Tenectin recruits integrin to stabilize bouton architecture and regulate vesicle release at the Drosophila neuromuscular junction
- Eunice Kennedy Shriver, National Institute of Child Health and Human Development, National Institutes of Health, United States
Figures
Figure 1 with 2 supplements
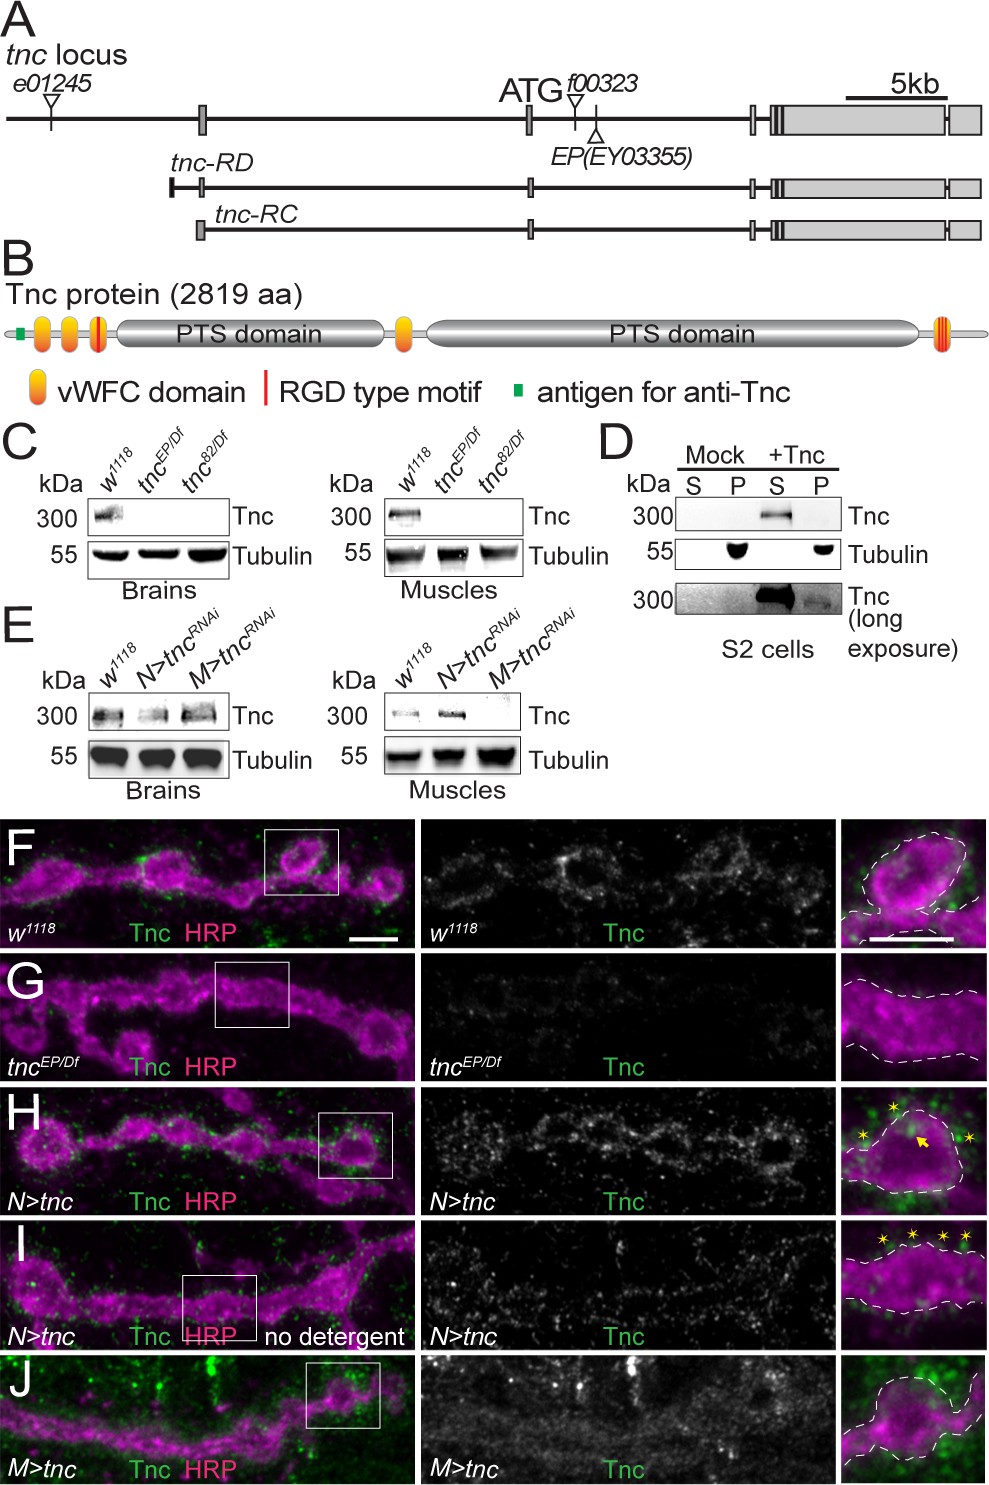
Tnc is expressed in neurons and muscles and concentrates at the synaptic cleft.
(A–B) Diagram of the tnc gene and the Tnc protein domains: vWFC (orange), Pro/Thr/Ser-rich, mucin specific domains (gray), and RGD motifs (red). The antigen for the anti-Tnc antibody is marked in green. (C–E) Western blot analyses of lysates from larval brains or muscles and transiently transfected S2 cells. Tnc can be detected in control but not in tnc mutants (C) and is reduced by knockdown of tnc in neurons or muscle (E). Tnc is efficiently secreted in the S2 cell media (S) compared with the cell pellet (P). (F–J) Confocal images of NMJ4 boutons of indicated genotypes stained for Tnc (green) and HRP (magenta). Low levels of Tnc surround synaptic boutons in control but not tnc mutant NMJs (F–G). Expression of Tnc in neurons but not in the muscles induces accumulation of Tnc-positive puncta in and around the NMJ boutons. The small puncta (asterisks) appear to be extracellular, as they are still present in detergent-free staining conditions (I), whereas the large aggregates (arrows) likely correspond to intracellular secretory compartments. Scale bars: 5 μm. Genotypes: tncEP(or 82)/Df (tncEP(or 82)/Df(3R)BSC655); N > tncRNAi (BG380-Gal4/+;UAS-tncRNAi/+); M > tncRNAi (UAS-tncRNAi/G14-Gal4); N > tnc (UAS-tnc/+; elav-Gal4/+); M > tnc (UAS-tnc/BG487-Gal4).
Figure 1—figure supplement 1

Tnc distribution in embryonic and larval tissues.
(A–B) Confocal images of control (A) and tnc mutant (B) stage 16 embryos stained for Tnc (green) and FasII (red). Tnc signals colocalize with neuronal marker FasII in control, but are not detectable in tnc mutant embryos. (C–D) Representative images of FasII-positive longitudinal axon tracks in the CNS of stage 17 embryos. tnc mutants have no apparent fasciculation defects. (E) Quantification of relative Tnc signals at NMJ4 shown in Figure 1F–H and J. (F–I) Low magnification confocal images of muscle 4 NMJ and nerve bundles stained for Tnc (green) and HRP (magenta). Tnc signals are concentrated at NMJ and in muscle nuclei (arrowhead). When overexpressed in the neurons, Tnc accumulates along the motor neuron axon (arrow) and at synaptic terminals. Muscle expressed Tnc is detectable throughout the muscle but is not enhance at the NMJs. Relative Tnc signals at the NMJ are quantified in (E). Scale bars: 20 μm. Genotypes: tncEP/Df (tncEP/Df(3R)BSC655); N > tnc (UAS-tnc/+; elav-Gal4/+); M > tnc (UAS-tnc/BG487-Gal4).
Figure 1—figure supplement 2

Addition of an HA tag does not change the distribution of overexpressed Tnc.
(A–D) Confocal images of NMJ4 boutons of indicated genotypes stained for HA (green) and HRP (magenta). Similar to Tnc, neural expression of Tnc-HA induces accumulation of HA-positive puncta inside (arrows) and outside (asterisks) the NMJ boutons. When overexpressed with strong muscle promoters, Tnc-HA is no longer detectable at the NMJs (D). Scale bars: 5 μm. Genotypes: N > tnc HA (UAS-tnc-HA/+; elav-Gal4/+); M > tnc HA (UAS-tnc-HA/+; 24B-Gal4/+).
Figure 2 with 1 supplement
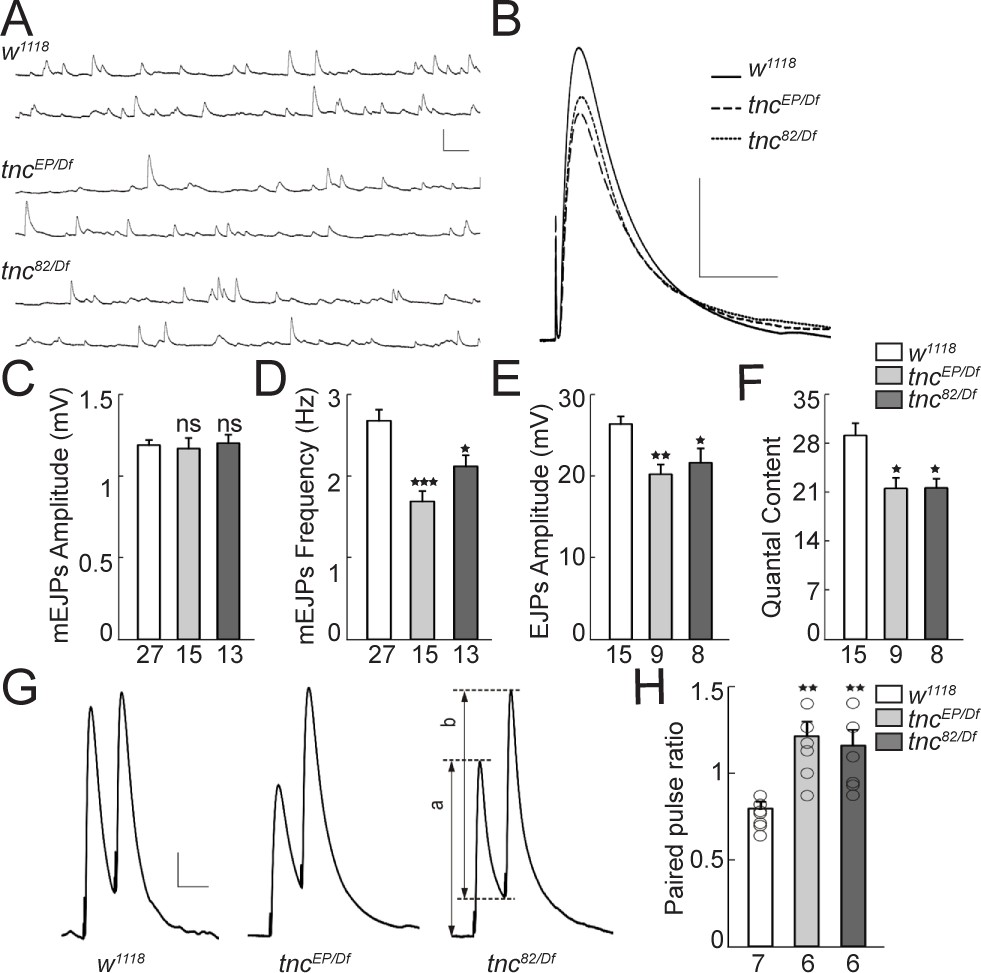
Reduced vesicle release probability at tnc mutant NMJs.
(A–B) Representative traces of spontaneous (A) and evoked (B) neurotransmitter release recorded from muscle 6 of indicated genotypes at 0.5 mM Ca2+. (C–F) Summary bar graphs showing the mean amplitude (C) and frequency (D) of mEJPs, the mean amplitude of EJPs (E) and the quantal content (F). The mEJPs amplitude is normal in tnc mutants, but the mEJPs frequency, EJPs amplitude and quantal content are reduced in both tnc allelic combinations. Resting potential: w1118 −61.30 ± 0.26 mV, tncEP/Df −61.27 ± 0.38 mV, tnc82/Df −61.85 ± 0.97 mV; input resistance: w1118 7.39 ± 0.40 MΩ, tncEP/Df 7.52 ± 0.72 MΩ, tnc82/Df 6.74 ± 0.24 MΩ. (G) Representative traces for paired-pulse stimulation in larvae of indicated genotypes. Paired stimuli (200 μsec, 1.9 V) were separated by duration of 50 ms. (H) Quantification of the paired-pulse ratio (% change in the amplitude of the second EJP (b) to that of the first EJP (a)) in larvae of indicated genotypes. The number of NMJs examined is indicated under each bar. Bars indicate mean ± SEM. **p<0.01, *p<0.05. Scale bars: (A): 1.5 mV- 500 ms; (B): 10 mV- 400 ms; (G): 4 mV- 50 ms.
Figure 2—figure supplement 1

NMJ morphology in control and tnc mutant larvae
(A) Confocal images of third instar NMJ (muscle 4, A4) stained with HRP antibody.
tnc mutants had relatively normal NMJ morphology and only subtle changes in bouton numbers (quantified in B). (C) Climbing assay for 7 days-old adult escapers of indicated genotypes. The number of animals examined is indicated in each bar. Scale bars: 20 μm. Genotype: tncEP(or 82)/Df (tncEP (or 82)/Df(3R)BSC655)..
Figure 3 with 1 supplement
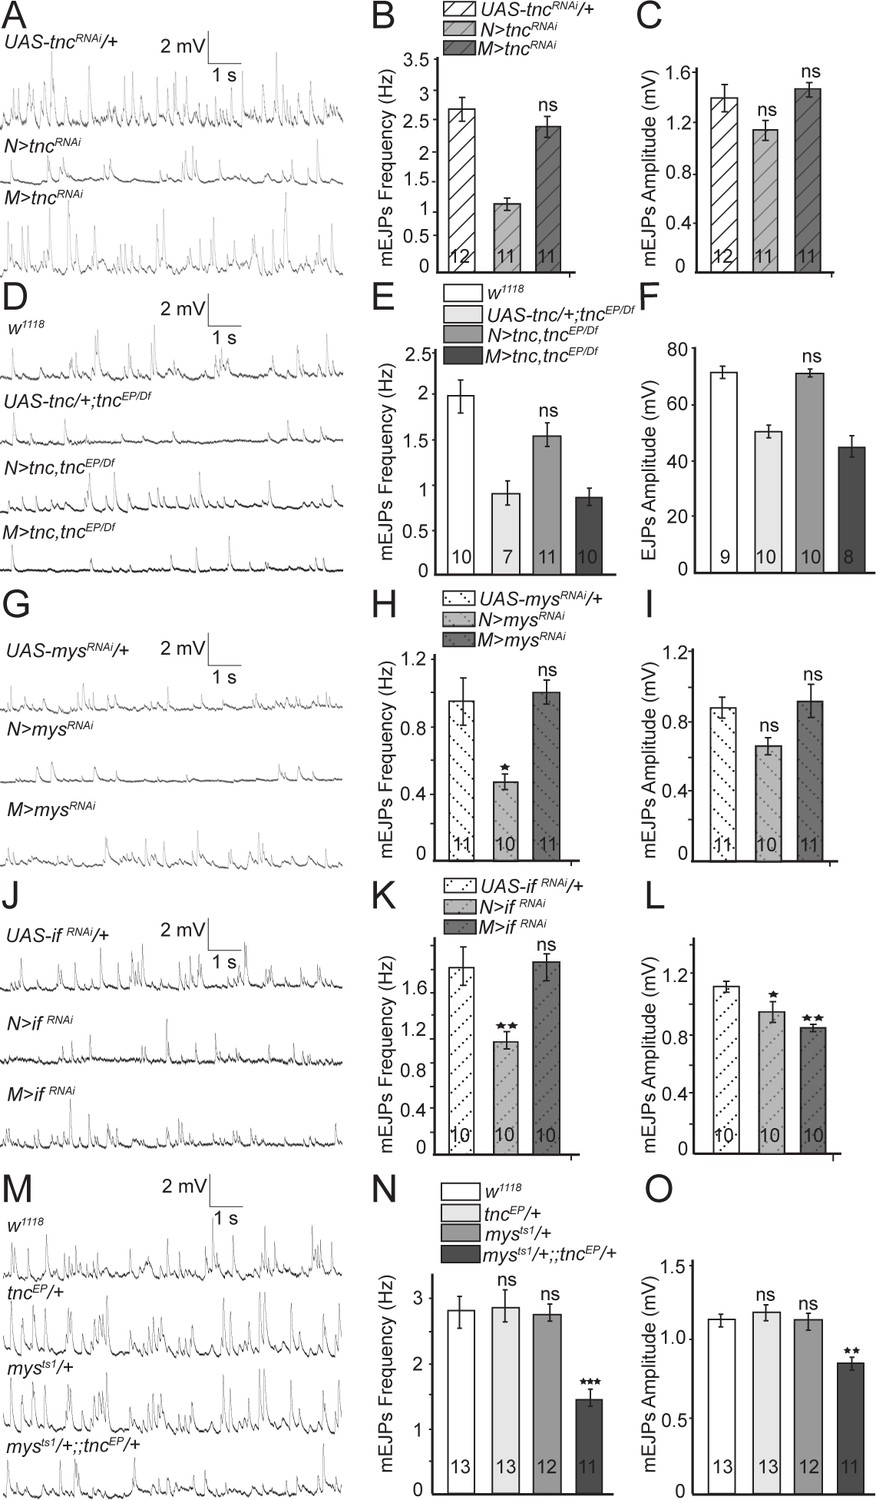
Presynaptic Tnc and integrin are critical for neurotransmitter release.
(A–L) Representative traces and summary bar graph for mEJPs and EJPs recorded at 0.8 mM Ca2+ from muscle 6 of indicated genotypes. The number of samples examined is indicated in each bar. (A–C) Neuronal knockdown of tnc significantly reduces the mEJPs frequency. (D–F) Neuronal but not muscle expression of Tnc can rescue the mEJPs frequency and EJP amplitude at tnc mutant NMJs. (G–L) The mean mEJPs frequency is dramatically reduced when mys/βPS integrin or if/αPS2 are knocked down in the neurons. Knockdown of if/αPS2 also induces slight reduction of the mean mEJPs amplitude and occasionally muscle attachment defects. (M–O) The trans-heterozygotes (mys/+;; tnc/+) show enhancement of phenotypes compared with individual heterozygotes, indicating that tnc and mys interact genetically. Bars indicate mean ±SEM. ns, not significant (p>0.05), ***p<0.001,***p<0.001 *p<0.05. Genotypes: N > tncRNAi (BG380-Gal4/+; UAS-tncRNAi/+); M > tncRNAi (UAS-tncRNAi/+; 24B-Gal4/+); tnc rescue control (UAS-tnc/+;tncEP/Df(3R)BSC655); N > tnc, tncEP/Df (UAS-tnc/+;tncEP/elav-Gal4,Df(3R)BSC655); M > tnc, tncEP/Df (UAS-tnc/+; tncEP/24B-Gal4, Df(3R)BSC655); N > mysRNAi (BG380-Gal4/+; UAS-Dcr-2/+; UAS-mysRNAi/+); M > mysRNAi (UAS-Dcr-2/+; UAS-mysRNAi/24B-Gal4); N > if RNAi (BG380-Gal4/+; UAS-if RNAi/UAS-Dcr-2); M > if RNAi (UAS-if RNAi/UAS-Dcr-2; 24B-Gal4/+).
Figure 3—figure supplement 1
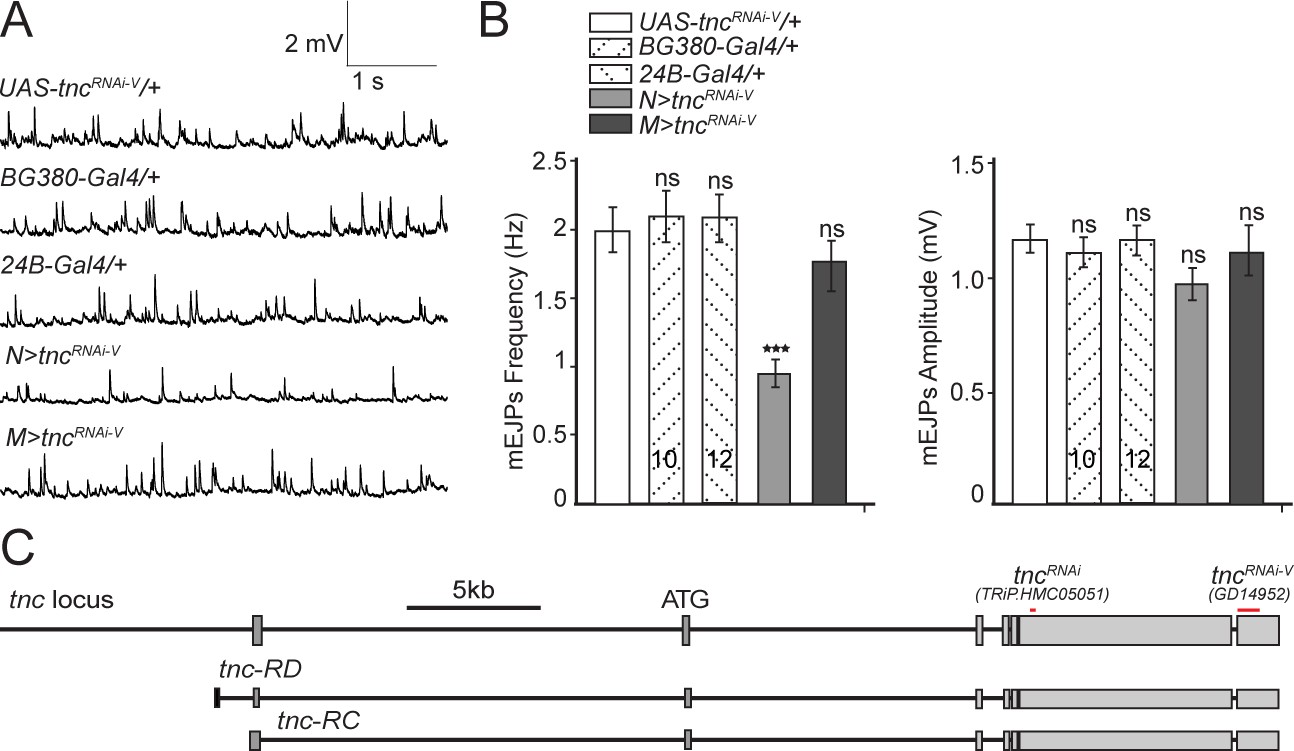
Additional control recordings.
(A–B) Representative traces and summary bar graph for mEJPs frequency and amplitude recorded at 0.8 mM Ca2+ from muscle 6 of indicated genotypes. The number of samples examined is indicated in each bar. (C) Diagram of the fragments within the two UAS-tncRNAi lines utilized here relative to the known tnc transcripts. Bars indicate mean ± SEM. ns, not significant (p>0.05), ***p<0.001. Genotypes: N > tncRNAiRNAi-V (BG380-Gal4/+; UAS-tncRNAi-V/UAS-Dcr-2); M > tncRNAi (UAS-tncRNAi-V/UAS-Dcr-2; 24B-Gal4/+).
Figure 4 with 2 supplements
tnc mutants have reduced perisynaptic αPS2/βPS integrin.
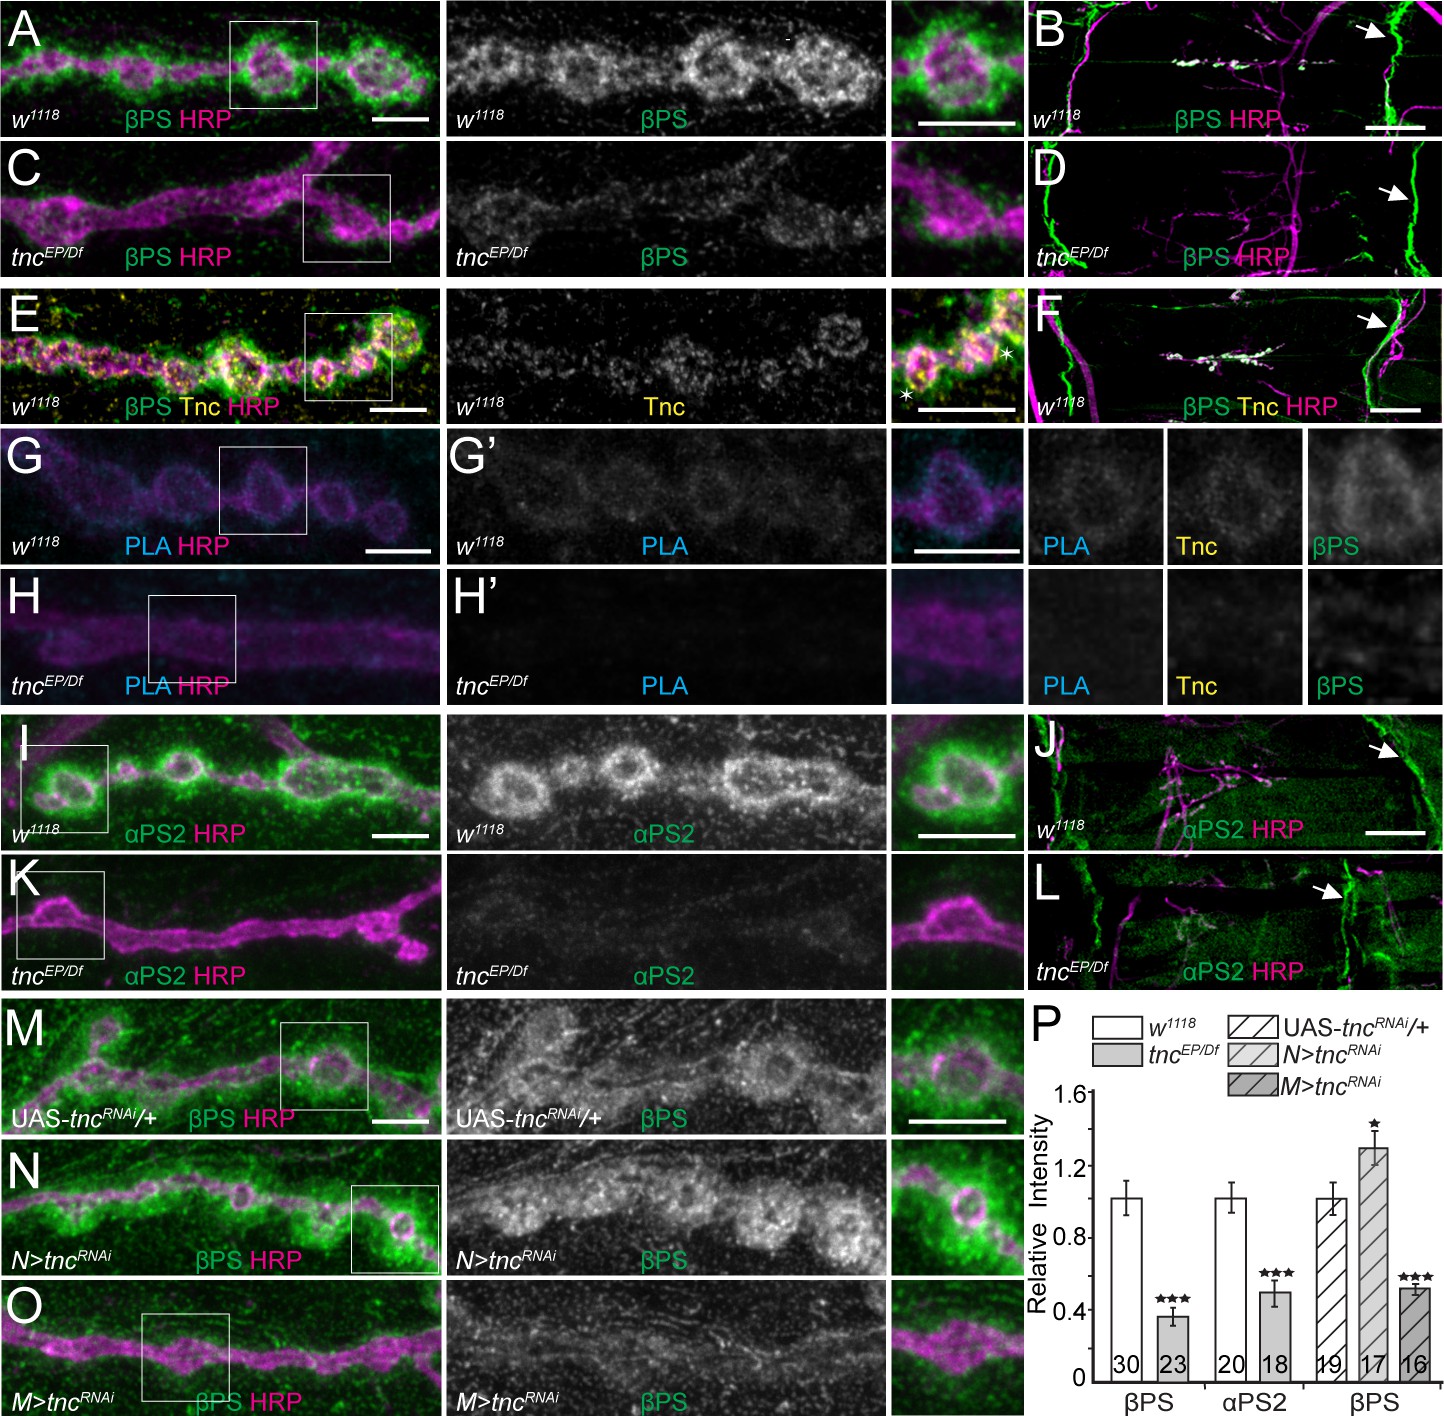
(A–D) Confocal images of control NMJ4 boutons and NMJ 6/7 muscle fields of indicated genotypes stained for βPS (green) and HRP (magenta). Compared to control (w1118), tnc mutant have dramatically decreased βPS signals at the NMJs (quantified in P), but normal levels at the muscle attachment sites (arrows). (E–F) Confocal images of control NMJ4 boutons stained with Tnc (yellow), βPS (green) and HRP (magenta). Like βPS, Tnc concentrates at the periphery of HRP-marked boutons (asterisks), but unlike βPS, Tnc is not present at the muscle attachment sites. (G–H’) Distribution of Tnc (yellow), βPS (green), PLA signals (cyan) (G’–H’), and HRP (magenta) in control and tnc mutant boutons. PLA signals are only observed at control NMJs and localize circumferentially to the boutons, indicating that Tnc and βPS are in close proximity at the synaptic cleft. (I–P) Confocal images of NMJ4 boutons and NMJ6/7 muscle fields of indicated genotypes stained for αPS2 (I–L) or βPS (M–O) (green), and HRP (magenta). Similar to βPS, αPS2 signals are dramatically reduced at tnc mutant NMJs (quantified in P), but are normal at the muscle attachment sites (arrows). Tissue specific tnc knockdown indicates that postsynaptic Tnc controls the βPS accumulation at synaptic locations, whereas neuron-derived Tnc appears to limit it (M–O). The number of NMJs examined is indicated in each bar. Bars indicate mean ± SEM. ***p<0.001, *p<0.05. Scale bars: (A, E, G, G’, I and M) 5 μm; (B, F and J) 20 μm. Genotypes: tncEP/Df (tncEP/Df(3R)BSC655); N > tncRNAi (BG380-Gal4/+; UAS-tncRNAi/+); M > tncRNAi (UAS-tncRNAi/+; 24B-Gal4/+)..
Figure 4—figure supplement 1
Comparison of various synaptic proteins in control and tnc mutant NMJs.
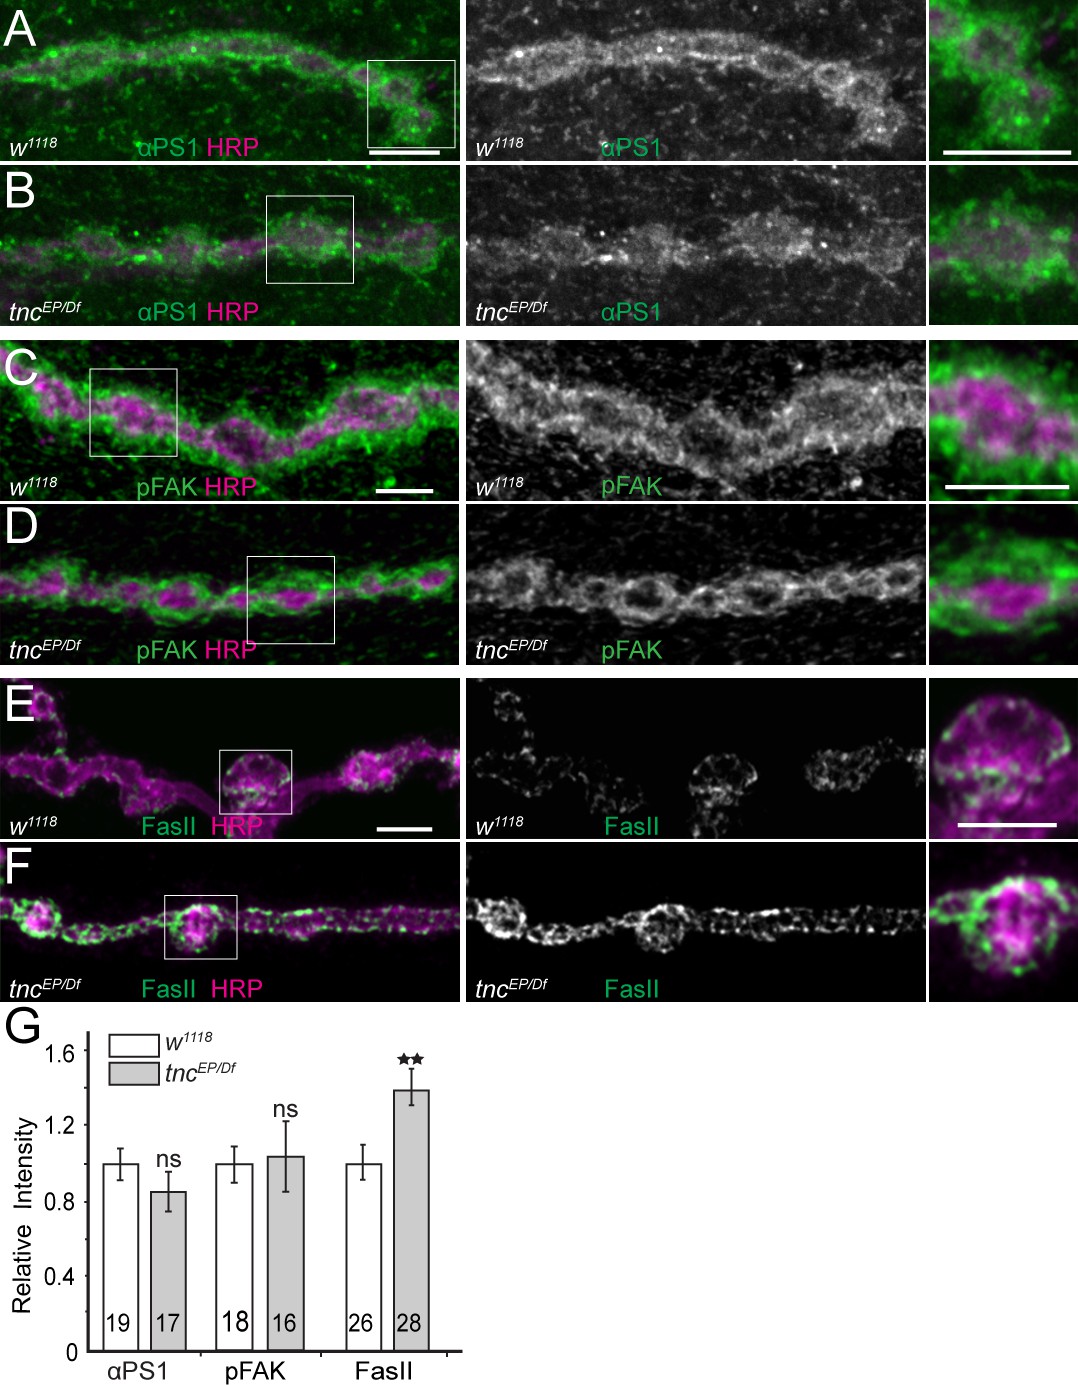
(A–F) Confocal images of third instar NMJ4 boutons from control and tnc mutants stained for αPS1, pFAK, or FasII (green), and HRP (magenta). tnc mutant NMJs have normal levels of αPS1 and pFAK, but significantly increased FasII signals (quantified in G). The number of samples examined is indicated in each bar. Bars indicate mean ± SEM. ns (p>0.05), **p<0.01, ns (p>0.05). Scale bars: 5 μm.
Figure 4—figure supplement 2
The inhibitory effect of neuron-derived Tnc on muscle Tnc.
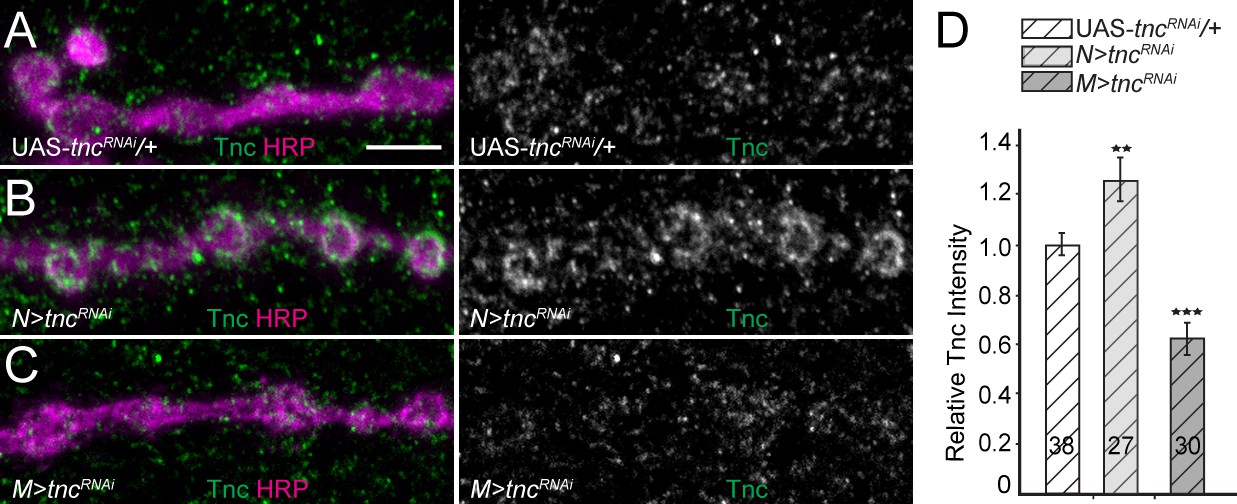
(A–D) Confocal images of third instar NMJ4 boutons from control and various tnc manipulations stained for Tnc (green) and HRP (magenta). While the knockdown of tnc in muscles reduces the Tnc levels at the NMJ by 37%, the neuronal knockdown of tnc leads to a significant increase in the Tnc NMJ levels, suggesting an inhibitory effect of neuron-derived Tnc onmuscle Tnc. The number of samples examined is indicated in each bar. Bars indicate mean ± SEM. ns (p>0.05), **p<0.01, ***p<0.001. Scale bars: (A) 5 μm in boutons. Genotypes: N > tncRNAi (BG380-Gal4/+; UAS-tncRNAi/+); M > tncRNAi (UAS-tncRNAi/+; 24B-Gal4/+)..
Figure 5 with 1 supplement
tnc mutants have smaller boutons and reduced SSR.
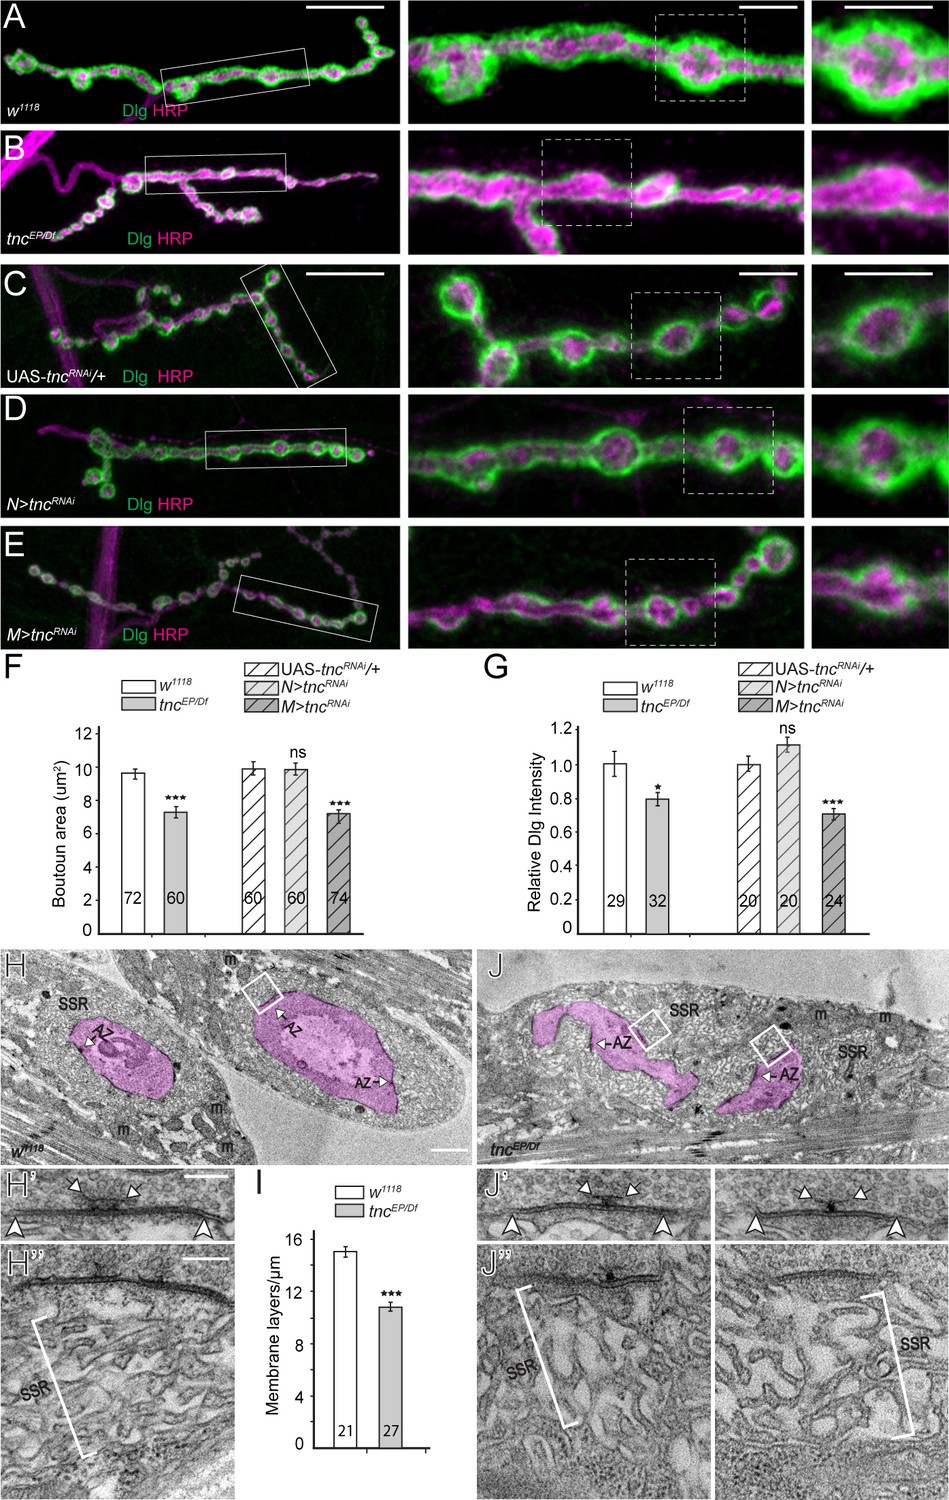
(A–E) Confocal images and analyses of third instar NMJ4 boutons of indicated genotypes stained for Dlg (green) and HRP (magenta). Compared to control, tnc mutant NMJs have smaller boutons and reduced perisynaptic Dlg levels (quantified in F–G). Knockdown of tnc in muscles but not in motor neurons recapitulates the mutant defects. (H–J) Electron micrographs of type Ib boutons. The neuronal compartment is labeled in magenta; the active zones (AZ, arrows), mitochondria (m), and subsynaptic reticulum (SSR, brackets) are indicated. The tnc mutants have sparse SSR with reduced density of the membrane layers (quantified in I). The tnc synapses appear normal (insert detail) but they reside in relatively distorted boutons. The number of samples examined is indicated in each bar. Bars indicate mean ±SEM. ns (p>0.05), *p<0.05, ***p<0.001. Scale bars: (A) 20 μm, 5 μm in boutons; (E) 2 μm, 200 nm in details. Genotypes: N > tncRNAi (BG380-Gal4/+; UAS-tncRNAi/+); M > tncRNAi (UAS-tncRNAi/+; 24B-Gal4/+)..
Figure 5—figure supplement 1

tnc mutants have normal PSDs.
(A–D) Confocal images of NMJ4 boutons from third instar control larvae and tnc mutants stained for GluRIIB or PAK (green), GluRIIA or Neto (red) and HRP (blue). tnc mutant NMJs have normal levels of synaptic glutamate receptors and PSD components (PAK and Neto) (quantified in E). The number of samples examined is indicated in each bar. Bars indicate mean ± SEM. ns (p>0.05). Scale bars: 3 μm.
Figure 6 with 1 supplement
Diminished cortical skeleton at tnc mutant NMJs.
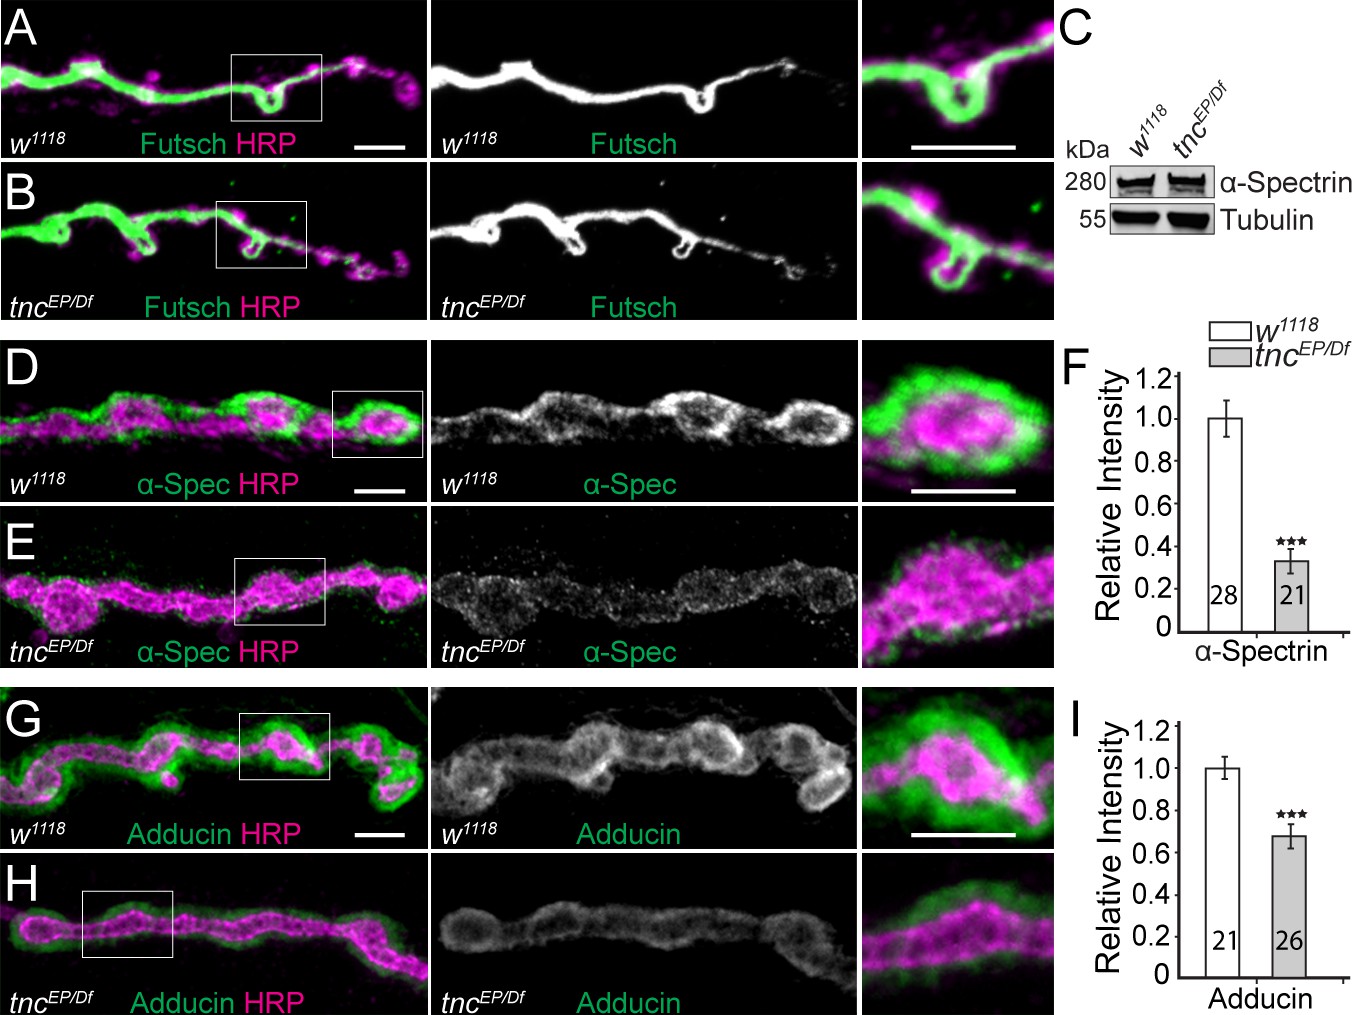
(A–B) Confocal images of NMJ4 boutons stained for Futsch (green) and HRP (magenta) reveal normal presynaptic Futsch-positive loops and microtubules bundles at tnc mutant NMJs. (C) Western blot analysis of lysates from larval carcasses show normal levels of α-Spectrin in tnc mutants. (D–I) Confocal images of NMJ4 boutons for the indicated genotypes stained for α-Spectrin (D–E), or Adducin (G–H) (green) and HRP (magenta), (quantified in F and I). α-Spectrin levels are dramatically decreased at tnc mutant NMJs; the reduction of Adducin is less drastic, but significant. The number of NMJs examined is indicated in each bar. Bars indicate mean ± SEM. ns (p>0.05), ***p<0.001. Scale bars: 5 μm.
Figure 6—figure supplement 1
Tnc/integrin-mediated spectrin recruitment.
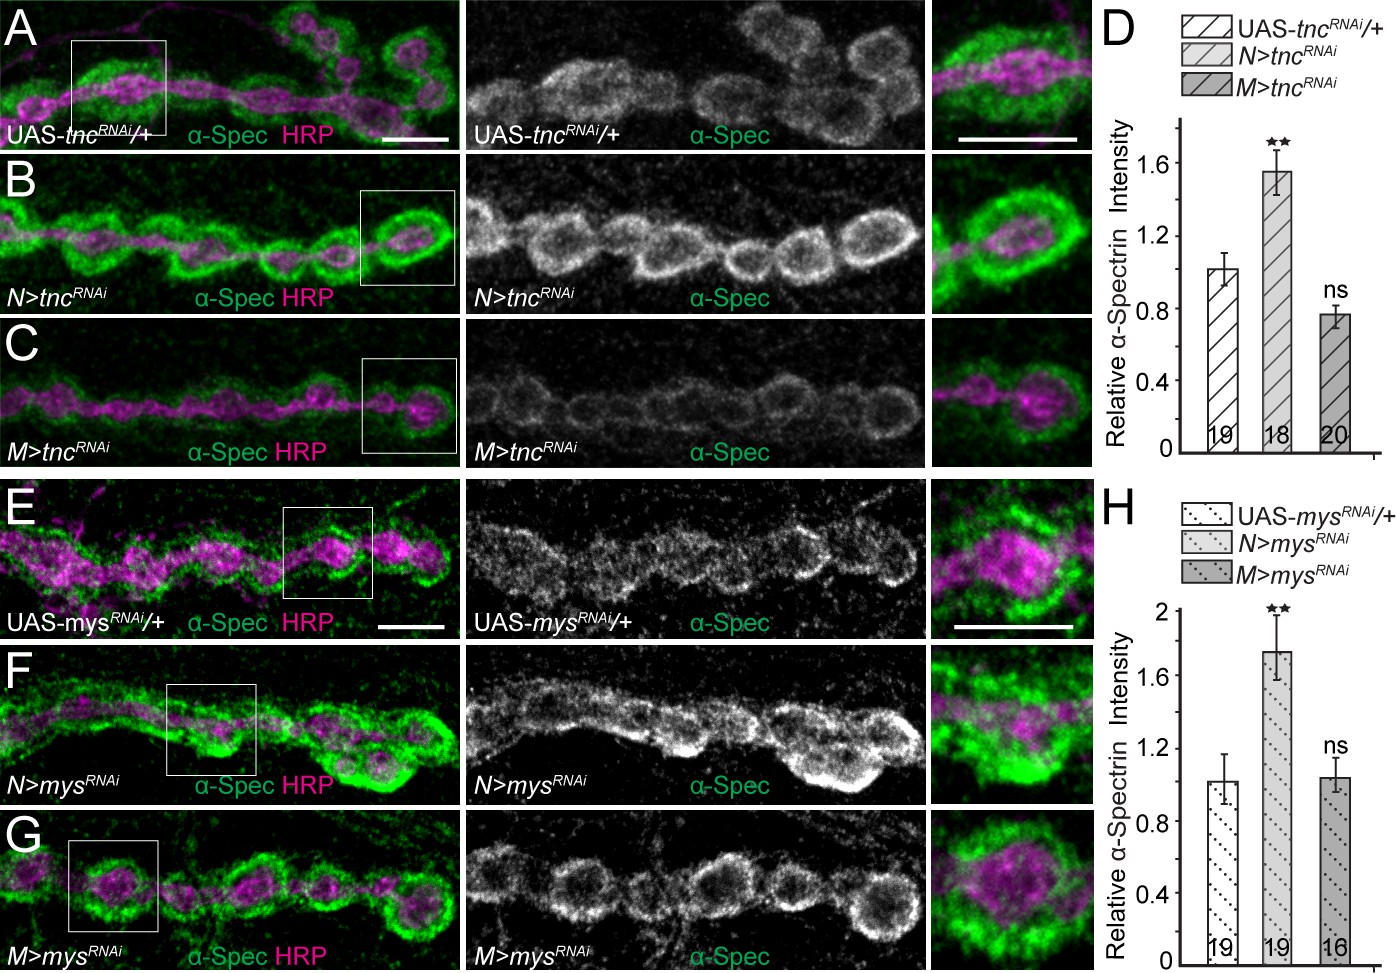
(A–H) Confocal images of third instar NMJ4 boutons from control and various tnc and mys/βPS manipulations stained for α-Spectrin (green) and HRP (magenta). Neuronal knockdown of tnc significantly increases the α-Spectrin levels; muscle knockdown mildly decreases the α-Spectrin signals (quantified in D). Thus synaptic α-Spectrin generally follows the levels of synaptic Tnc (compare with Figure 4—figure supplement 2). The recruitment of α-Spectrin appears to be dependent on Tnc/integrin complexes, since muscle knockdown of mys/βPS drastically reduces α-Spectrin accumulation at synaptic terminals (quantified in H). The number of NMJs examined is indicated in each bar. Bars indicate mean ±SEM. ns (p>0.05), ***p<0.001, **p<0.01. Scale bars: 5 μm. Genotypes: N > tncRNAi (BG380-Gal4/+; UAS-tncRNAi/+); M > tncRNAi (UAS-tncRNAi/+; 24B-Gal4/+); N > mys RNAi (BG380-Gal4/+; UAS-mys RNAi/UAS-Dcr-2); M > mys RNAi (UAS-mys RNAi/UAS-Dcr-2; 24B-Gal4/+).
Figure 7 with 1 supplement
Tnc expression restores the synaptic accumulation of βPS at tnc mutant NMJs.
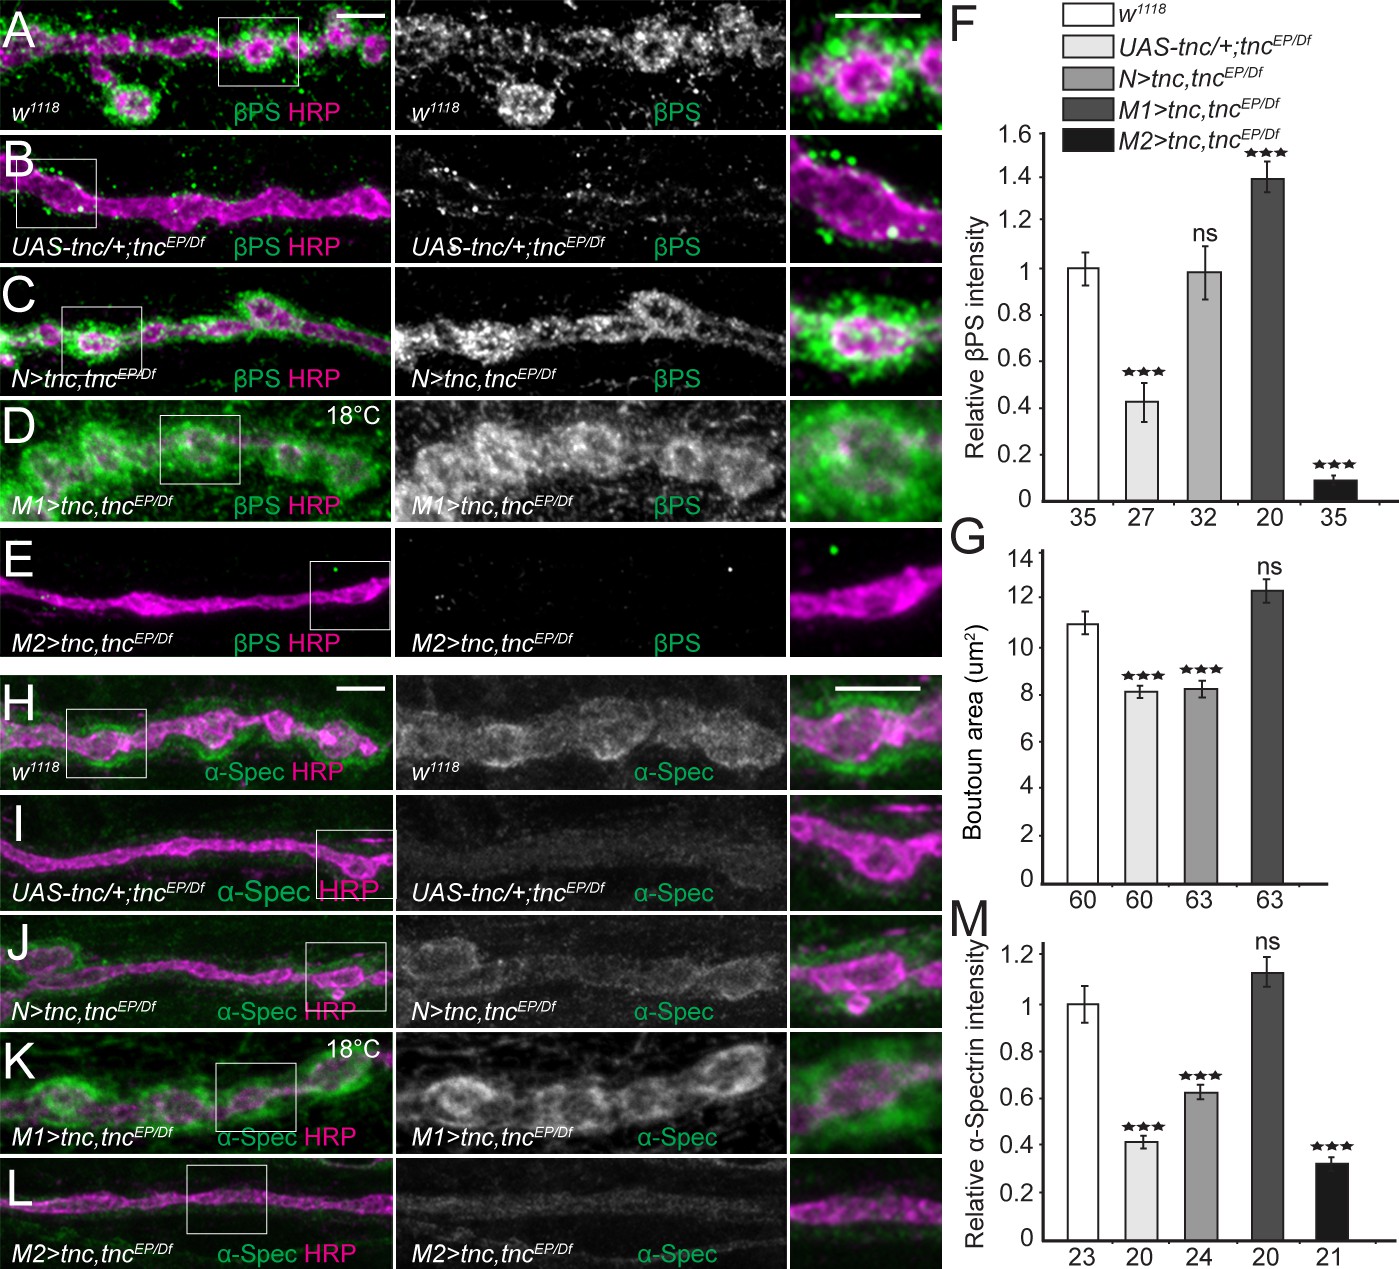
(A–M) Confocal images of NMJ4 boutons of indicated genotypes stained for βPS integrin (A–E) or α-Spectrin (H–L) (green) and HRP (magenta). The animals were reared at 25°C unless marked otherwise. When expressed in neurons, high levels of Tnc could restore the accumulation of βPS at tnc mutant NMJs (quantified in F). However, in these animals the boutons remain small, resembling the tnc mutant boutons (quantified in G). For the muscle rescue, Tnc levels were controlled using two different promoters and rearing the animals at 18°C (low expression) or 25°C (moderate). Low levels of muscle Tnc produce substantial accumulation of βPS integrin at tnc NMJs, above the control levels, and fully rescued the boutons size; high level of muscle Tnc further decreased the βPS accumulation at tnc NMJs. The α-Spectrin synaptic levels are restored only when Tnc is provided at low levels in the muscle. The number of samples examined is indicated in each bar. Bars indicate mean ±SEM. ***p<0.001. Scale bars: 5 μm. Genotypes: control (UAS-tnc/+;tncEP/Df(3R)BSC655); N > tnc, tncEP/Df (UAS-tnc/+;tncEP/elav-Gal4, Df(3R)BSC655); M1 >tnc, tncEP/Df (BG487-Gal4/UAS-tnc; tncEP/Df(3R)BSC655); M2 >tnc, tncEP/Df (UAS-tnc/+; tncEP/24B-Gal4, Df(3R)BSC655)..
Figure 7—figure supplement 1
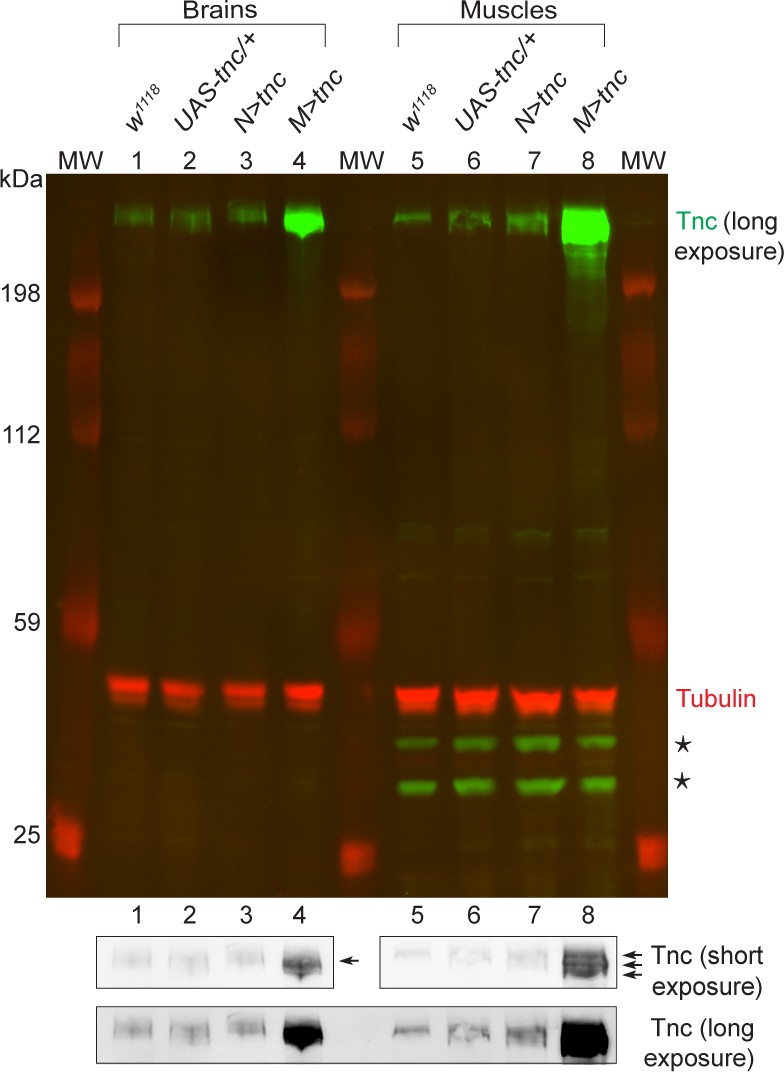
Western blot analysis of protein lysates from brains or muscles of third instar larvae of indicated genotypes stained for Tnc (green) (predicted MW is 299 kD), and Tubulin (red).
The polyclonal anti-Tnc antibodies label one specific band in all samples, except for muscle extracts from larvae with excess muscle Tnc (lane 8). For lane 8, the short exposure captures apparently multiple Tnc-positive species (arrows). (*) non-specific staining. Genotypes: N > tnc (UAS-tnc/+; elav-Gal4/+); M > tnc (UAS-tnc/+; 24B-Gal4/+)..
Figure 8 with 1 supplement
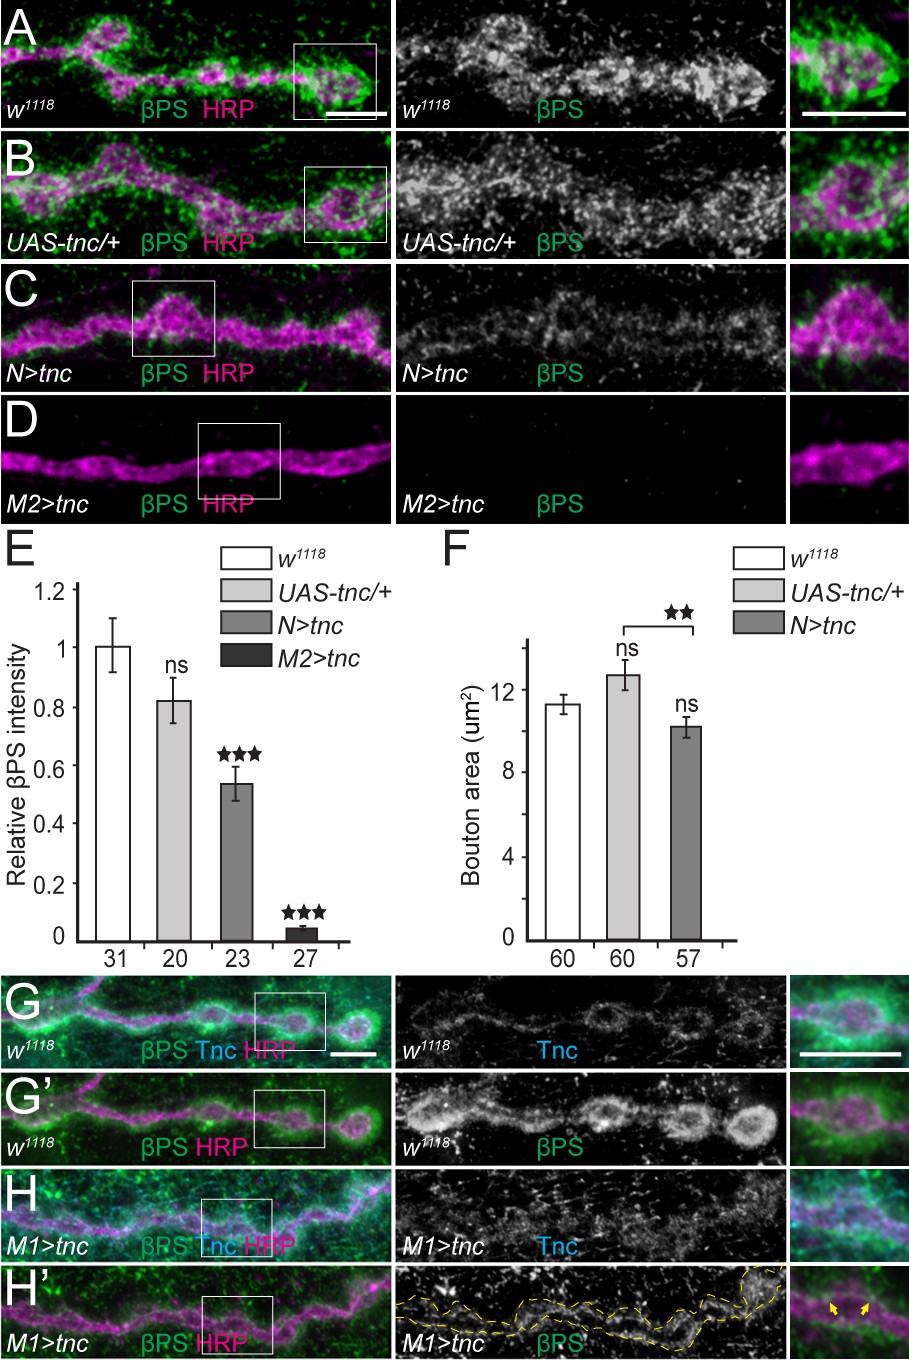
Excess Tnc disrupts the βPS accumulation at synaptic terminals.
(A–D) Confocal images of NMJ4 boutons of indicated genotypes stained for βPS (green) and HRP (magenta) (quantified in E). Excess Tnc induces drastic reductions of synaptic βPS levels compared with controls. Compared with the transgene alone control (B), neuronal Tnc significantly reduces the bouton area (quantified in F). Overexpression of Tnc in the muscle completely disrupts the NMJ bouton-interbouton boundaries. (G–H’) Confocal images of third instar NMJ4 boutons stained for Tnc (Cyan), βPS (green) and HRP (magenta). A pulse of tnc expression in larval muscles (in larvae reared at 18°C and shifted at 25°C for 8 hr) increases the levels of Tnc at synaptic terminals and diminishes the postsynaptic βPS signals. The remaining βPS immunoreactivities appear as thin lines (between arrows) localized inside the boutons. The number of samples examined is indicated in each bar. Bars indicate mean ±SEM. ns (p>0.05), ***p<0.001, **p<0.01. Scale bars: 5 μm. Genotypes: N > tnc (UAS-tnc/+;elav-Gal4/+); M1 >tnc (UAS-tnc/BG487-Gal4); M2 >tnc (UAS-tnc/+;24B-Gal4/+).
Figure 8—figure supplement 1
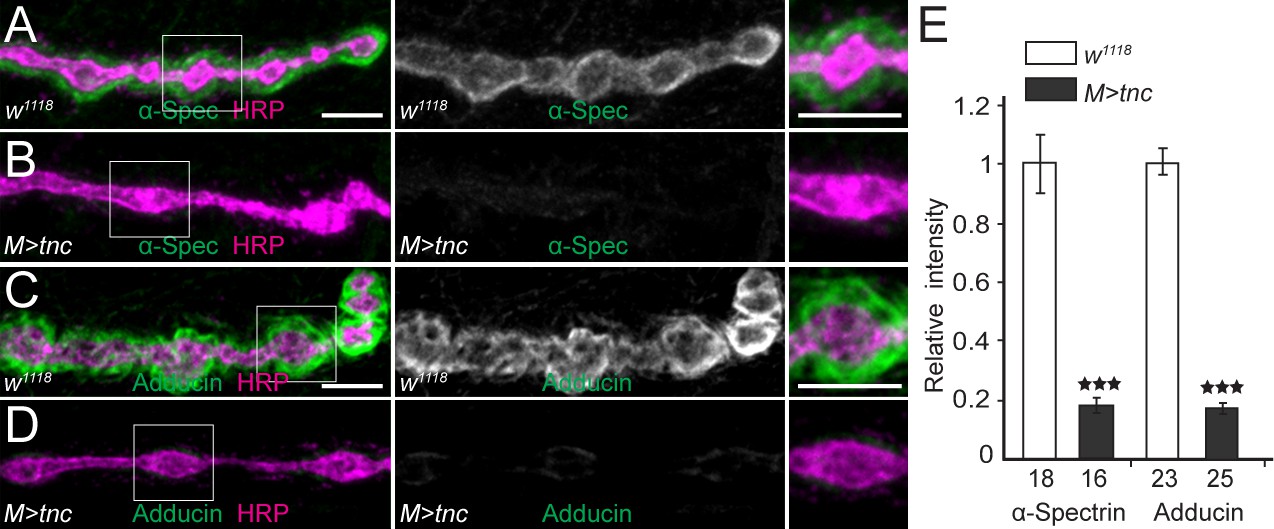
Deleterious effects of excess muscle Tnc.
(A–D) Confocal images of NMJ4 boutons stained for α-Spectrin (A–B) or Adducin (C–D) (in green) and HRP (magenta) (quantified in E). Excess Tnc in the muscle disrupts the spectrin-rich membrane skeleton. The number of samples examined is indicated in each bar. Bars indicate mean ± SEM. ns (p>0.05), ***p<0.001. Scale bars: 5 μm. Genotypes: M > tnc (UAS-tnc/G14-Gal4).
Figure 9 with 1 supplement
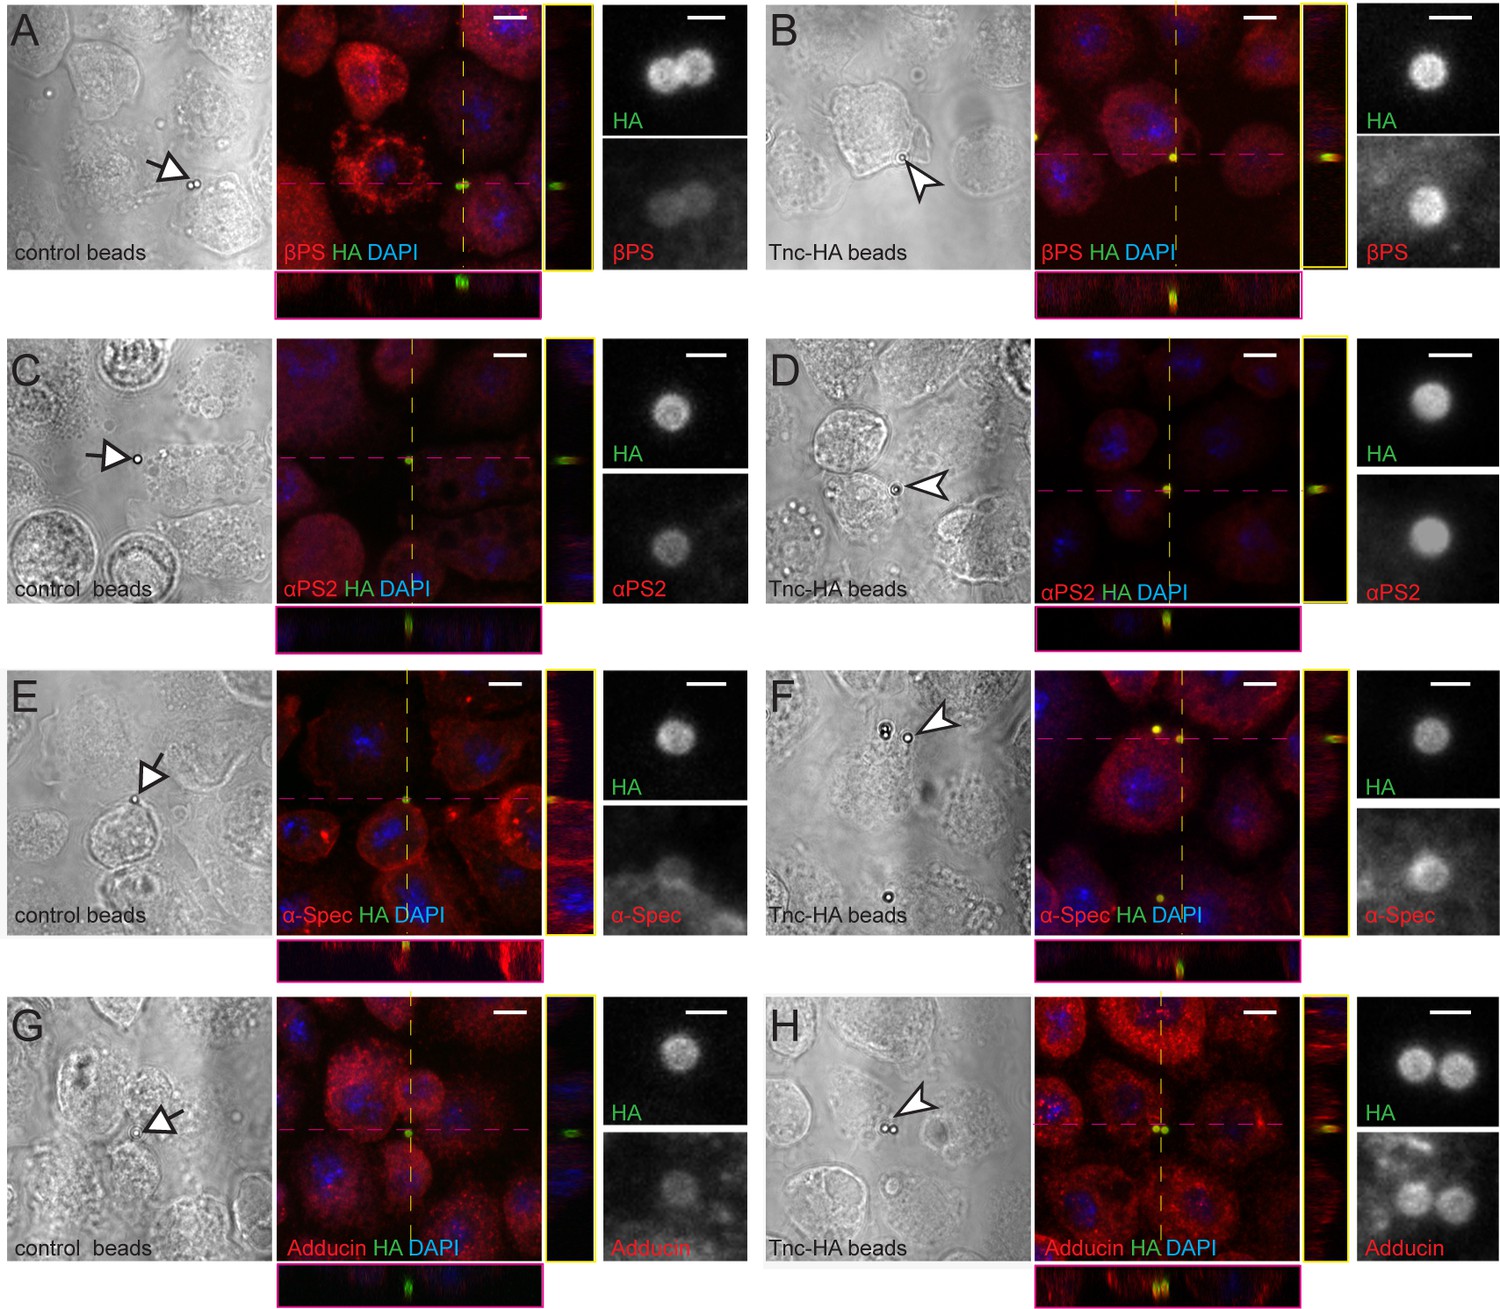
Tnc directs accumulation of integrin and spectrin at the cell membrane.
(A–H) Phase contrast and confocal microscopy images of S2R + cells presented with control (Tld-HA-) and Tnc-HA-coated beads and stained for βPS, αPS2, α-Spectrin or Adducin (in red), HA (green), and DAPI (blue). Arrows indicate control and arrowheads point to Tnc-HA-coated beads, enlarged in details on the right. The Tnc-HA-coupled beads, but not the control, induce strong accumulation of βPS at the bead-cell membrane interfaces, as indicated in the lateral projections, along the dotted lines. The accumulation of αPS2, α-Spectrin or Adducin is also significant in the proximity of Tnc-HA-coupled beads, which appear yellow, in contrast to control beads that remain green. Scale bars: 5 μm, 1 μm in details.
Figure 9—figure supplement 1
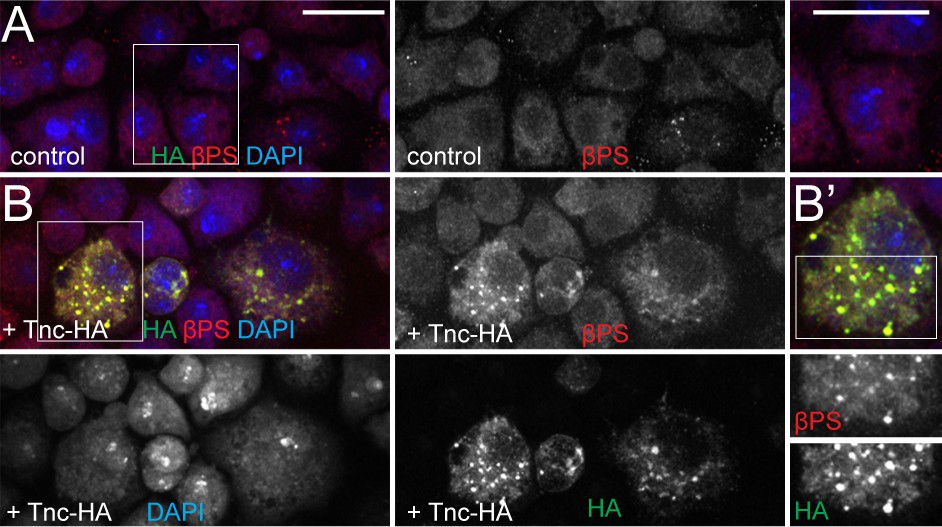
Cell expressing Tnc have elevated levels of βPS.
(A–B) S2R + cells transfected with Tnc-HA stained for HA (green), βPS (red) and DAPI (blue) and analyzed by confocal microscopy. Comparing with control, cells expressing Tnc-HA have overall elevated βPS levels; the frequency and distribution of Tnc-HA and βPS-positive aggregates suggest that Tnc may aid the surface expression of βPS. Scale bars: 20 μm.
Additional files
-
Transparent reporting form
- https://doi.org/10.7554/eLife.35518.023
Download links
A two-part list of links to download the article, or parts of the article, in various formats.
Downloads (link to download the article as PDF)
Open citations (links to open the citations from this article in various online reference manager services)
Cite this article (links to download the citations from this article in formats compatible with various reference manager tools)
Tenectin recruits integrin to stabilize bouton architecture and regulate vesicle release at the Drosophila neuromuscular junction
eLife 7:e35518.
https://doi.org/10.7554/eLife.35518


