Mechanisms of PDZ domain scaffold assembly illuminated by use of supported cell membrane sheets
- University of Copenhagen, Denmark
- Free University Brussels (VUB), Belgium
Figures
Figure 1
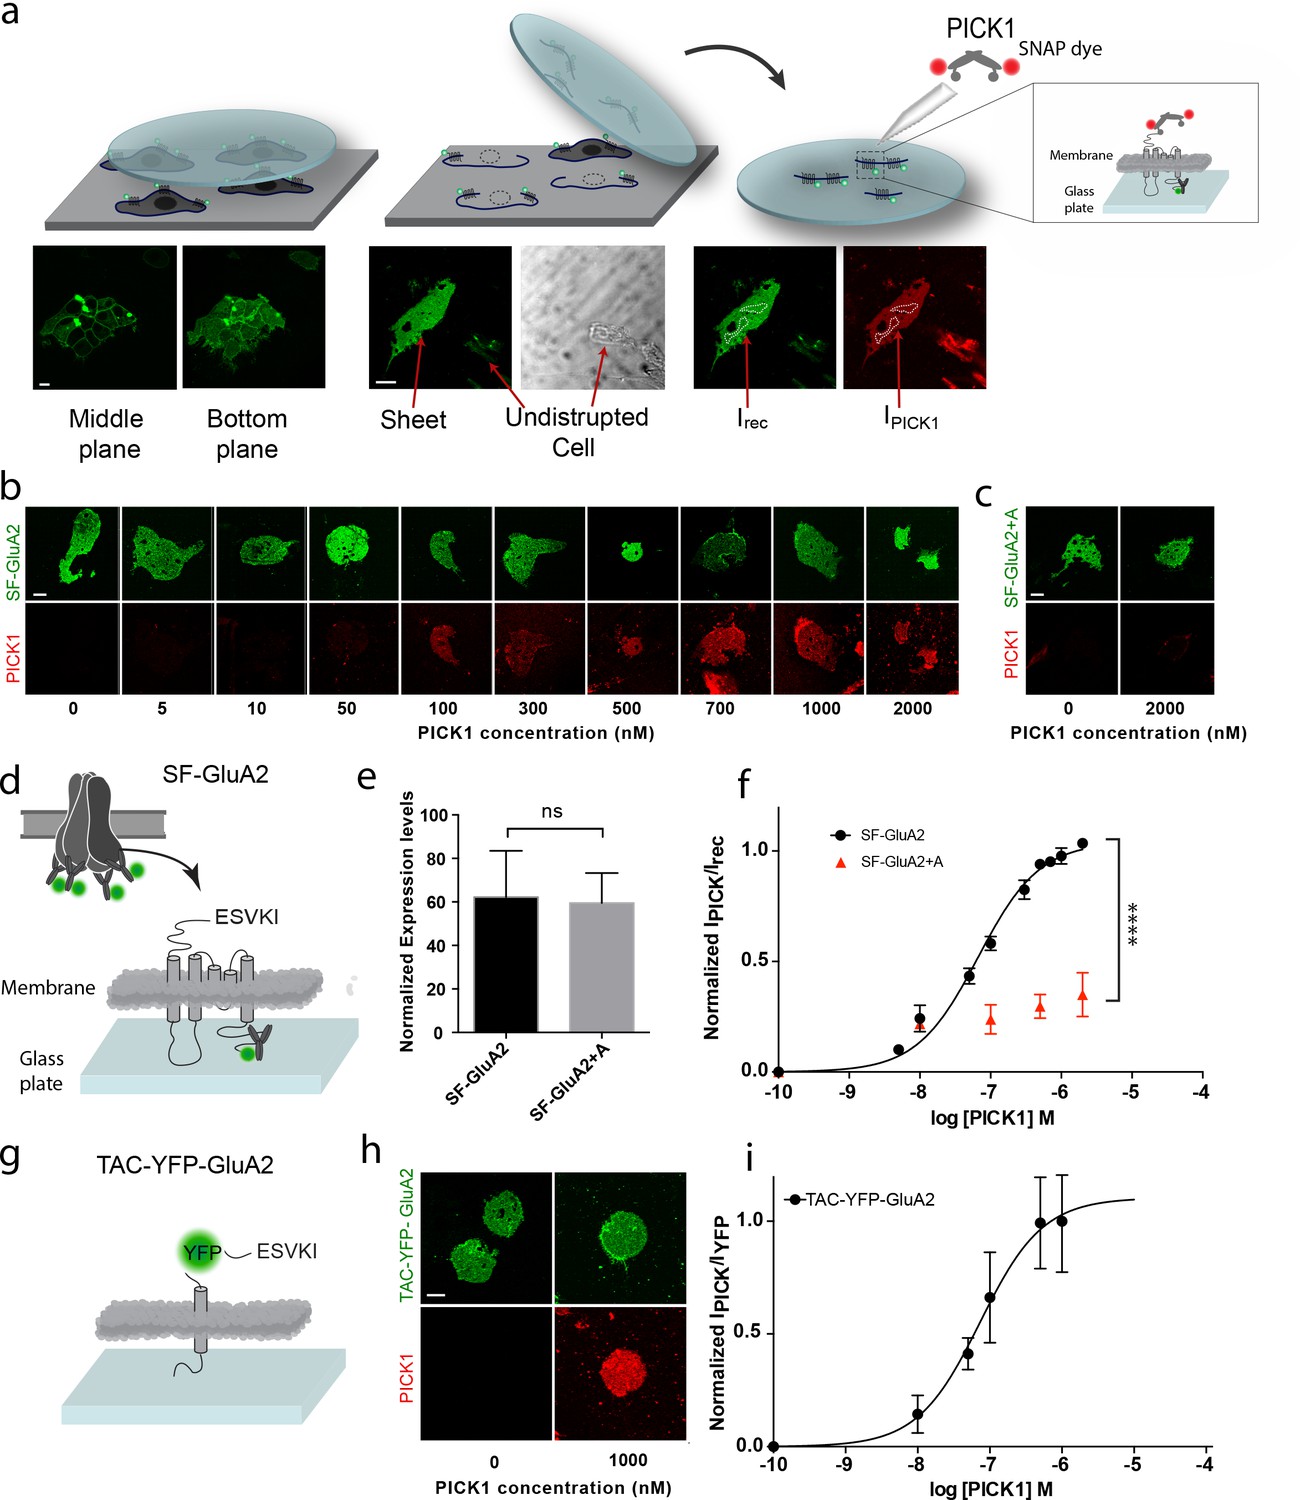
PICK1 PDZ binds with nanomolar binding strength to transmembrane interaction partners in semi-native membranes.
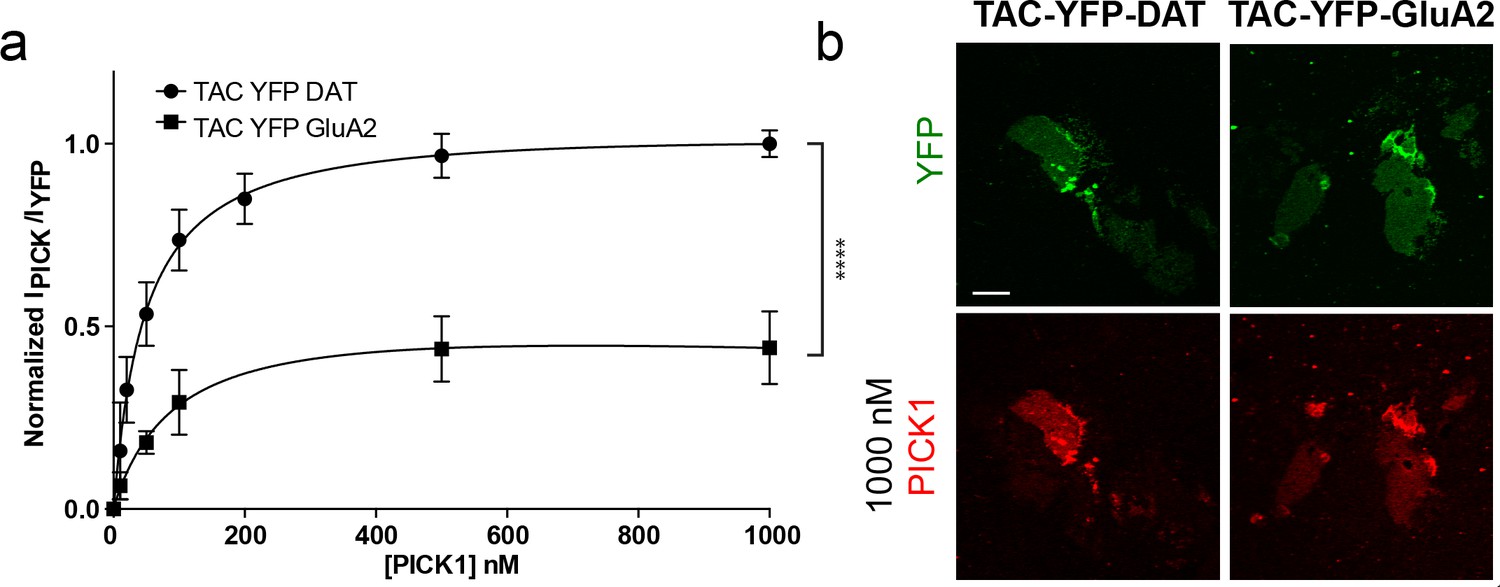
(a) SCMS were prepared from HEK293 Grip tite cells transfected with a fluorescently labeled (green) membrane protein of interest (left) by pressing a pre-coated glass coverslip onto the cells (middle) and subsequently detaching the apical plasma membranes from the remains of the cells (right). Single bilayers were readily distinguished from undisrupted cells or organelles by their lack of three-dimensional structure. SCMS were incubated with buffer containing fluorescently labeled scaffolding protein (red). Binding was quantified by measuring the intensity of PICK1, IPICK1, relative to the intensity of the receptor, Irec, in a region of interest (dashed white lines). (b) Representative confocal images demonstrating concentration dependent binding of PICK1 (red) to SCMS expressing SF-GluA2 (green), or (c) endpoints for SF-GluA2 +A. (d) Schematic representation of SF-GluA2 constructs labeled with anti-FLAG M1-alexa 488 antibody. (e) Expression levels of SF-GluA2 and SF-GluA2 +A in SCMS were similar (p=0.66). (f) Quantification of concentration dependent binding of PICK1 on SCMS’s expressing SF-GluA2 (black) (Kd*=67 ± 6 nM), or SF-GluA2 +A (red), (n = 3, ****p≤0.0001). (g) Schematic representation of TAC-YFP-GluA2 constructs (h) Representative end points of PICK1 concentrations series. (i) Quantification of concentration dependent binding of PICK1 to TAC-YFP-GluA2 (Kd*=73 ± 19 nM) (n = 3). Scale bars 10 μm.
Figure 2 with 3 supplements
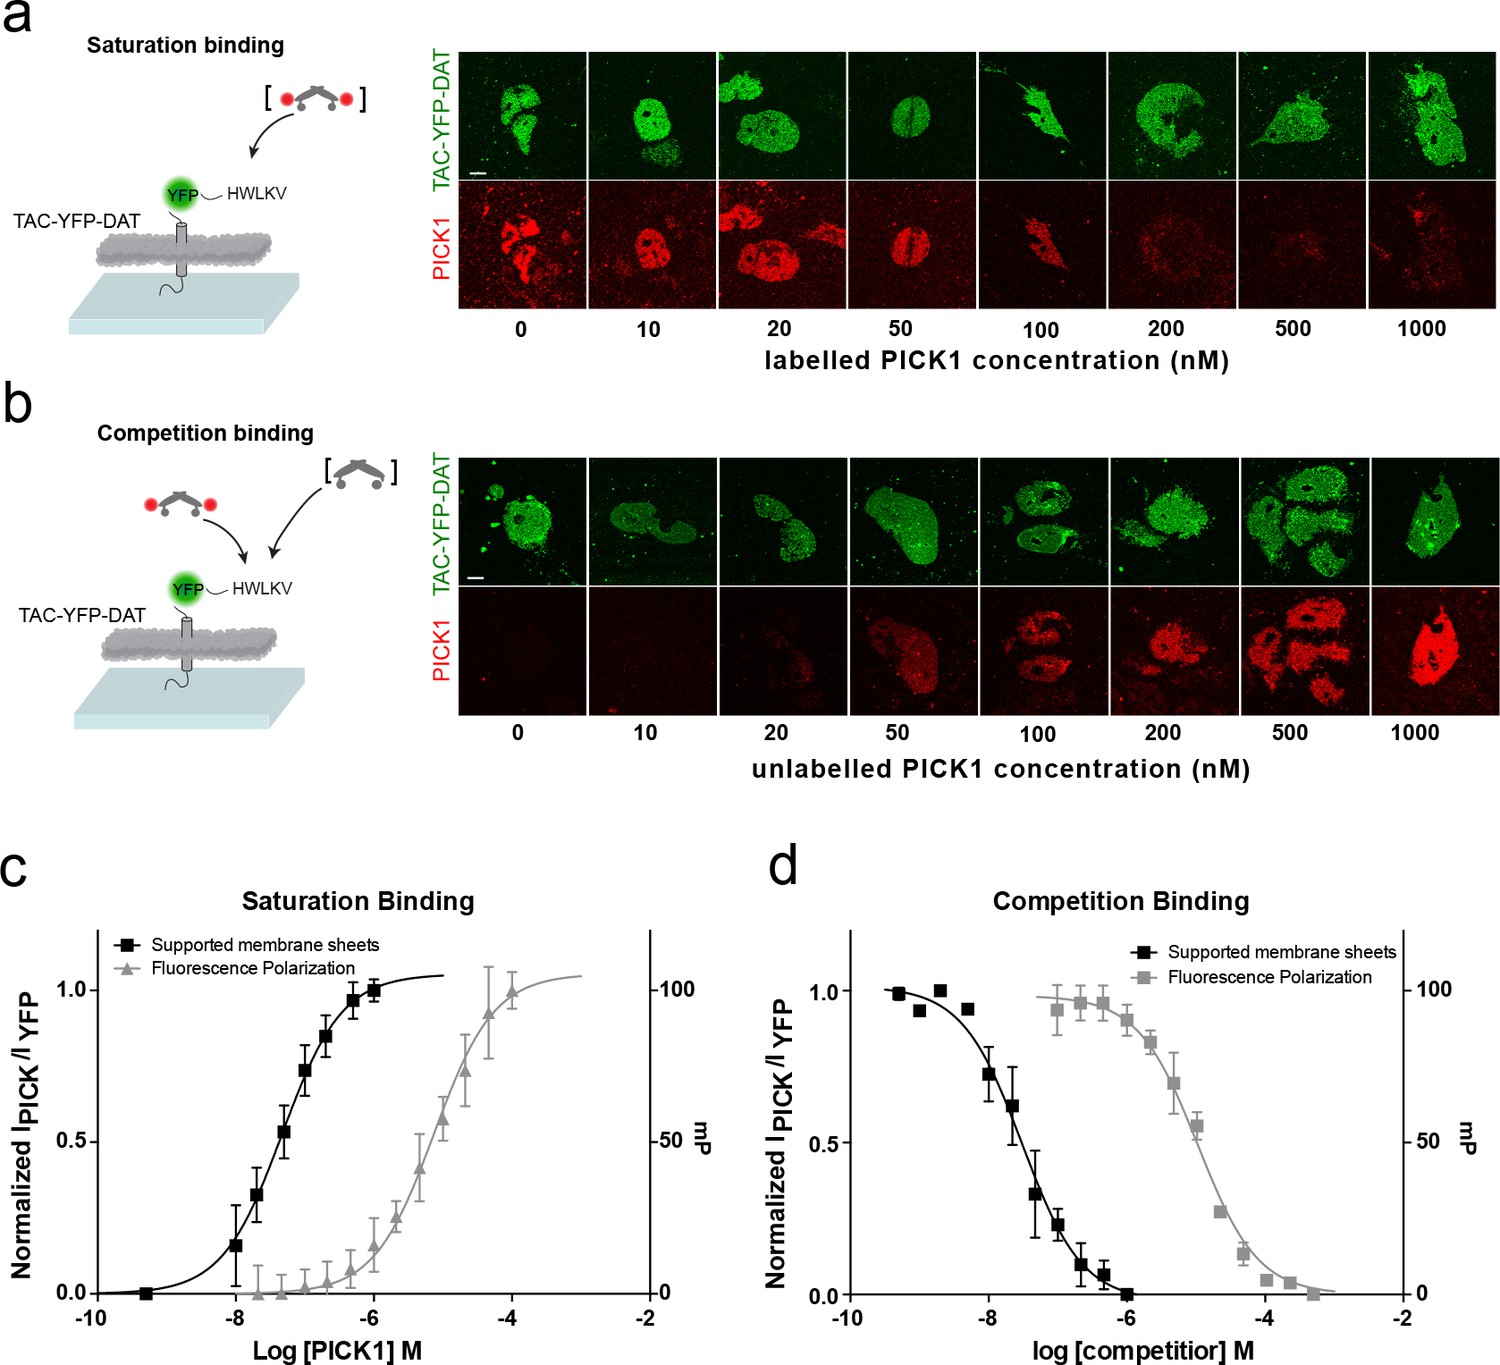
PICK1 binding on SCMS is specific and the binding strength is increased two orders of magnitude compared to in-solution affinities.
Schematic and representative confocal images demonstrating saturation with labeled PICK1 (a) and competition between labeled PICK1 and unlabeled PICK1 (b) on SCMS expressing TAC-YFP-DAT. Brackets indicate the varied PICK1 pool. (c) Normalized binding as a function of unlabeled PICK1 concentration (black), left axis (Kd*=47 ± 5 nM) (n = 7) compared to in-solution based FP-measurements (grey), right axis (Kd = 9± 2 μM, n = 3, performed in triplicates). (d) Normalized binding as a function of unlabeled PICK1 concentration (black), left axis (IC50 = 29 ± 4 nM) (n = 5) compared to in-solution based FP-measurements (grey), right axis (Ki,app = 2 ± 0.4 μM, n = 3, performed in triplicates). Scale bars 10 μm.
Figure 2—figure supplement 1
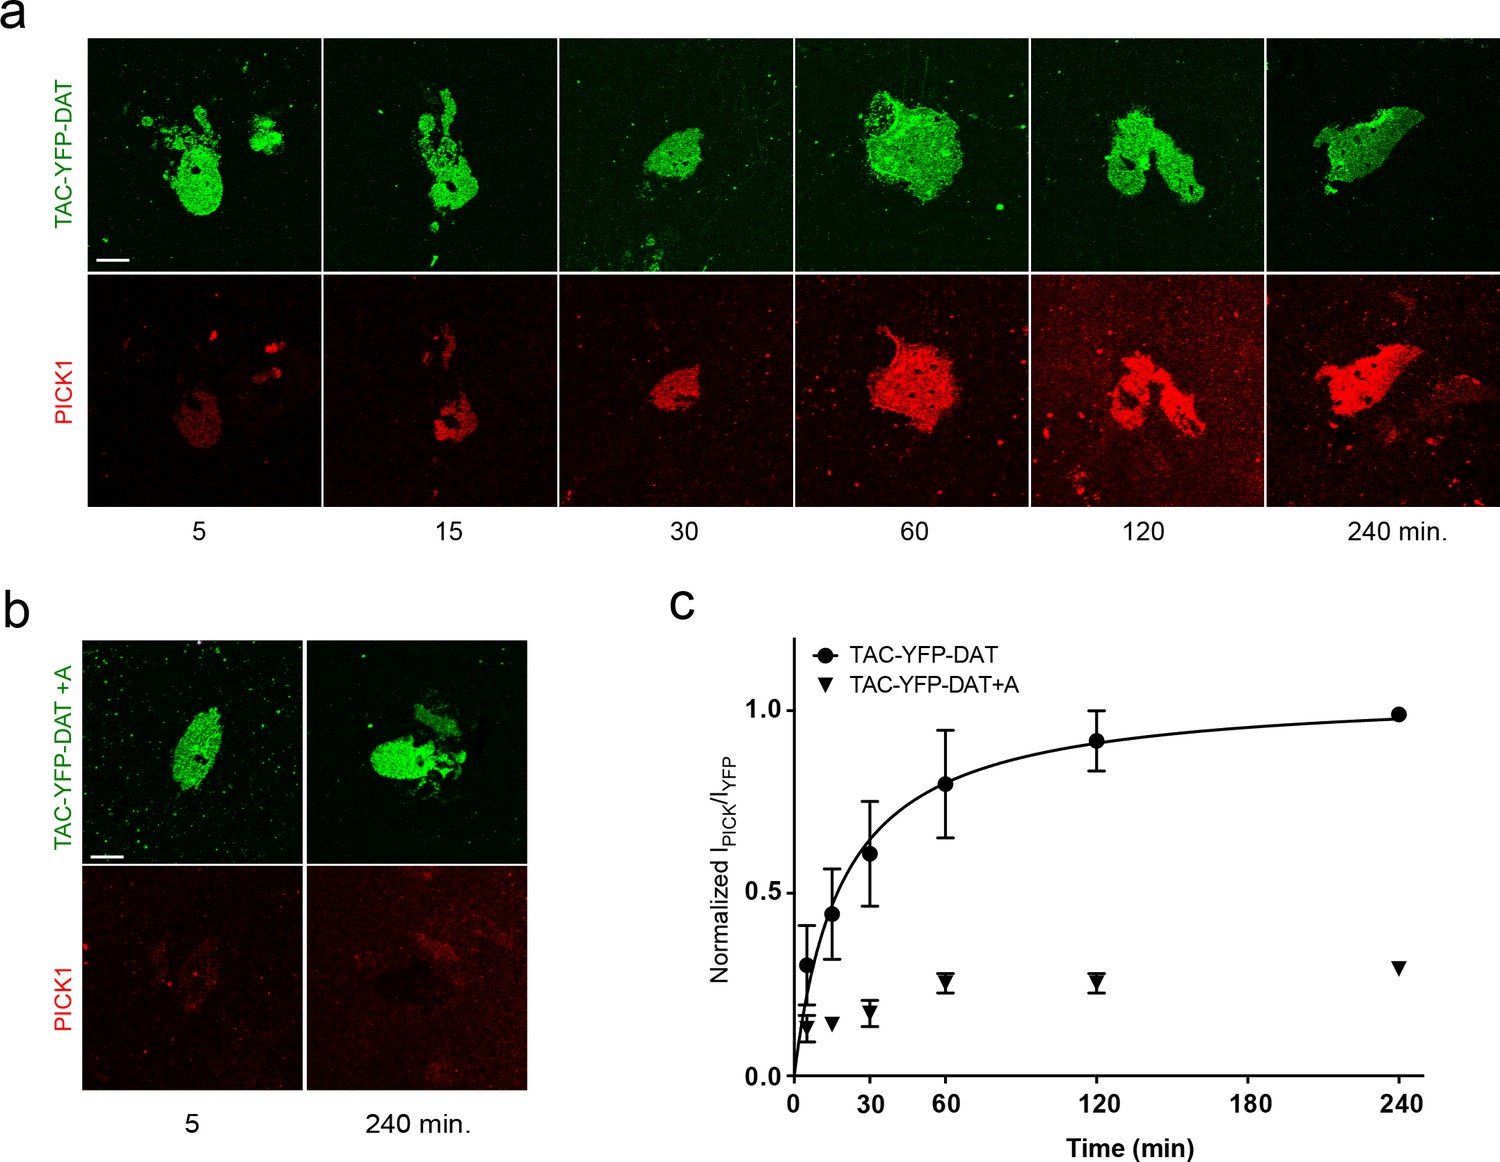
The PICK1 – TAC-YFP-DAT interaction is saturable and depends primarily on the PDZ binding motif.
(a–b) Representative images demonstrating PICK1 time series (or end points) on SCMS expressing the TAC-YFP-DAT or TAC-YFP-DAT+A constructs. (c) Normalized PICK1 binding as a function of incubation time. For TAC-YFP-DAT half maximum binding is 19 ± 3 min, (n = 3).
Figure 2—figure supplement 2
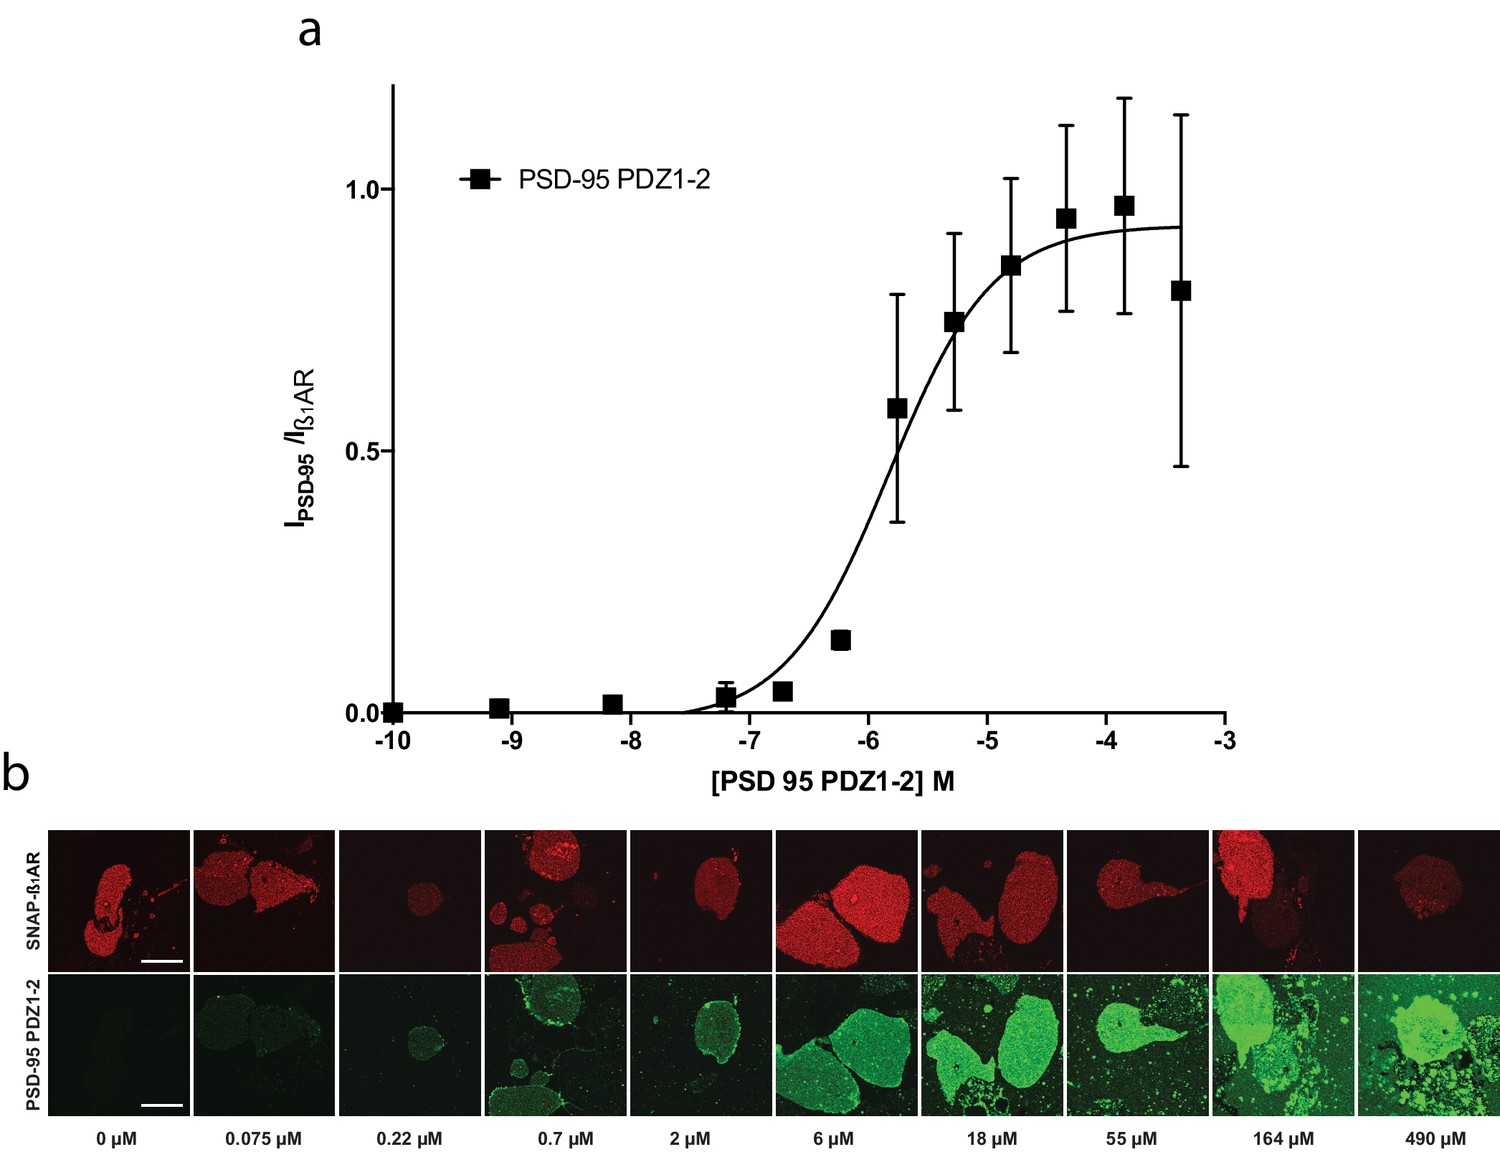
PSD-95 PDZ1-2 binding to SF-β1AR in supported cell membrane sheet.
(a) Concentration dependent normalized binding of PSD-95 PDZ1-2 (black) to β1AR (Kd*=3 ± 2), n = 3. (b) Representative images demonstrating a PSD95-PDZ1-2 concentration series on supported cell membranes expressing the β1-AR.
Figure 2—figure supplement 3
The intrinsic PDZ affinity does not translate directly to avidity but determines maximal binding.
(a) Quantification of concentration dependent binding of PICK1 to TAC-YFP-GluA2 and TAC-YFP-DAT, plotted on a linear scale. TAC-YFP-DAT Bmax = 100%, TAC-YFP-GluA2 Bmax = 44 ± 9%, (****p<0.0001; n = 3 and 7, respectively). (b) Representative images of end points of the PICK1 concentration series to TAC-YFP-DAT and TAC-YFP-GluA2.
Figure 3 with 1 supplement
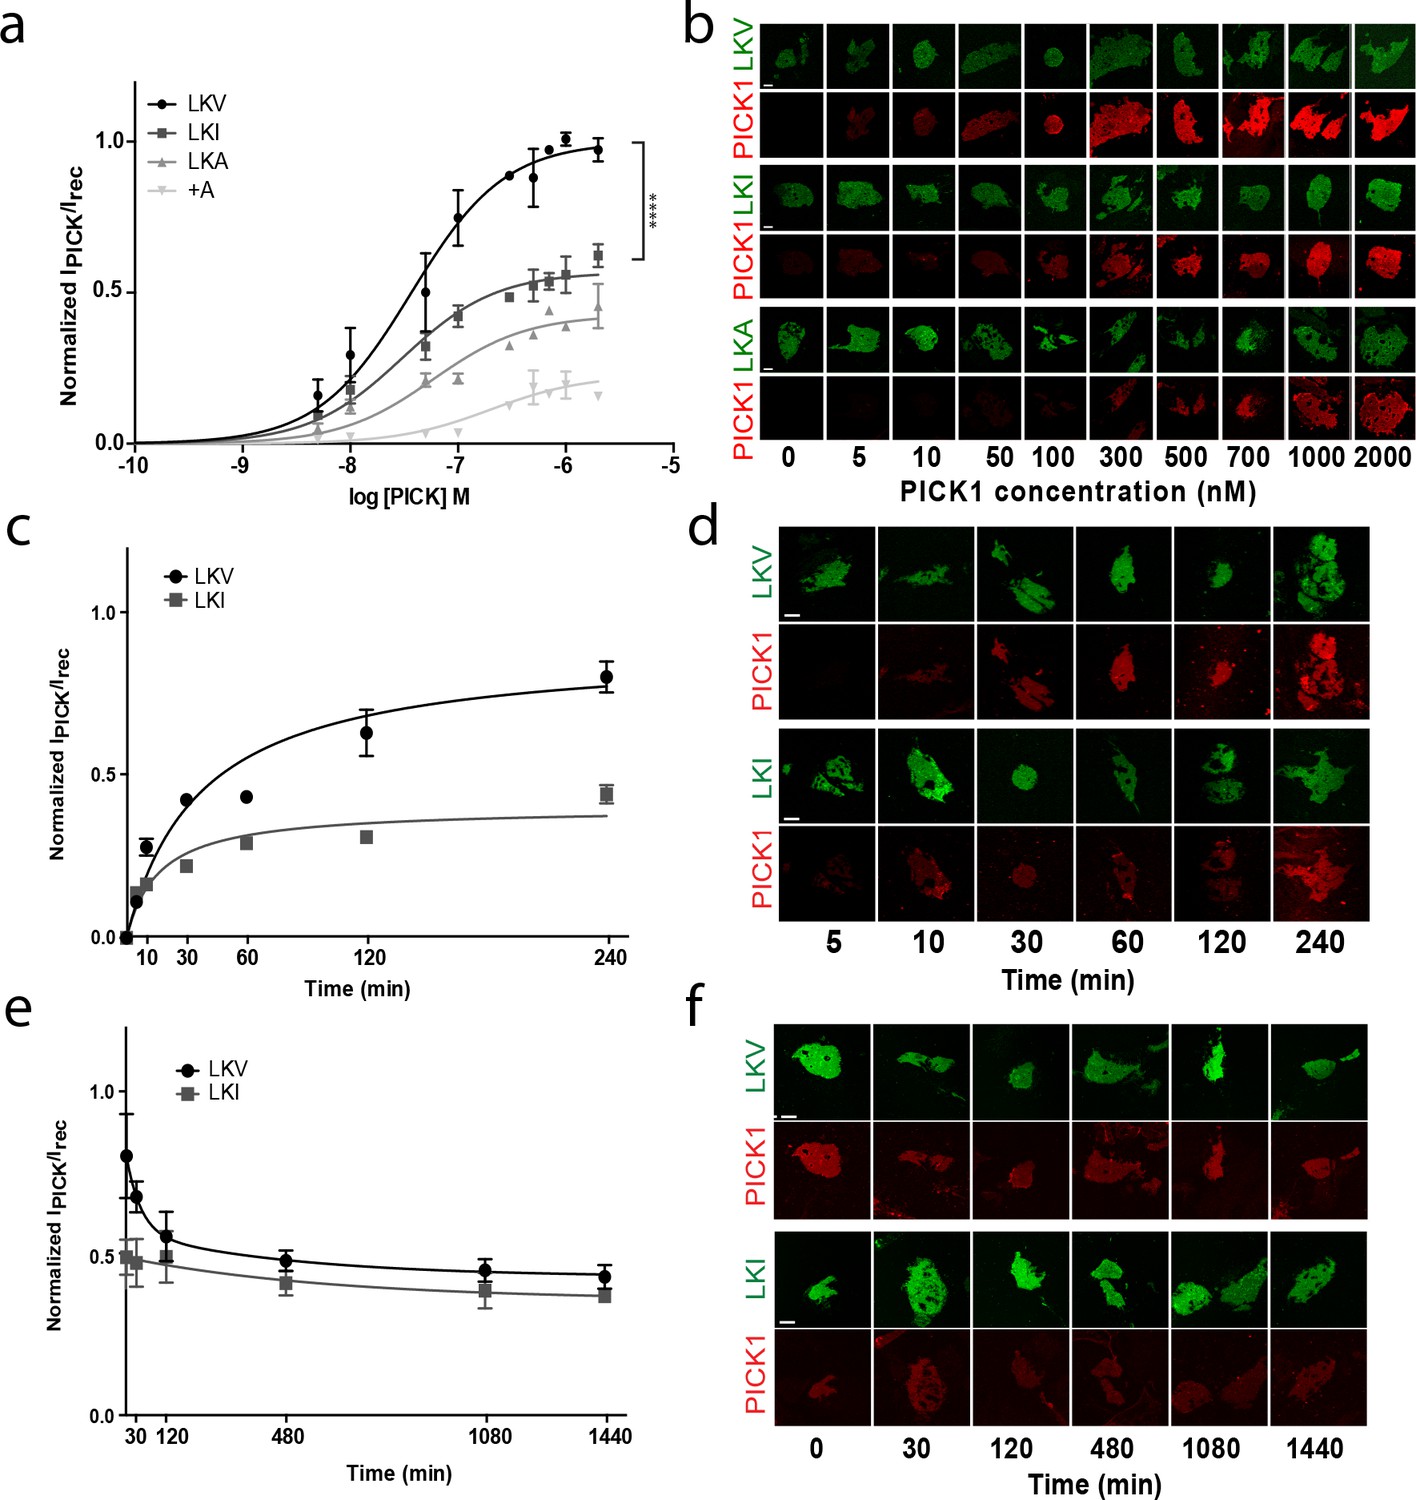
The intrinsic PDZ affinity does not translate directly to avidity but determines maximal binding.
(b) Normalized binding derived from SCMS as a function of PICK1 concentration to LKV (black) (Kd*=37 ± 5 nM, Bmax = 100%), LKI (dark grey) (Kd*=29 ± 4 nM, Bmax = 56 ± 2%), LKA (light grey) (Kd*=59 ± 11 nM, Bmax = 41 ± 4%) LKV +A (white) (Kd*not fitted, Bmax = 21 ± 3). n = 8, 7, 5 and 3, respectively (**p<0.01; ****p≤0.0001). (b) Representative images demonstrating concentration dependent binding of PICK1 to SCMS expressing LKV, LKI and LKA constructs. (c) Representative PICK1 binding to SCMS expressing LKV or LKI as a function of incubation time. PICK1 concentration is 100 nM. Half maximum binding values are 24 ± 14 min for LKV, and 11 ± 4 min for LKI (means ±s.e.m, n = 3). (d) Representative images showing time dependent PICK1 binding to LKV and LKI. (e) Representative PICK1 dissociation curves from SCMS expressing LKV or LKI (points are means ±SD). LKV is fitted to a two-state dissociation with estimated fast and slow half-life of 21 ± 8 and 373 ± 51 min., respectively. LKI is fitted to a one-state dissociation with a half-life of 431 ± 16 min. (means ± S.E, n = 3). (f) Representative images showing time dependent PICK1 dissociation from LKV and LKI. Scale bars 10 μm.
Figure 3—figure supplement 1
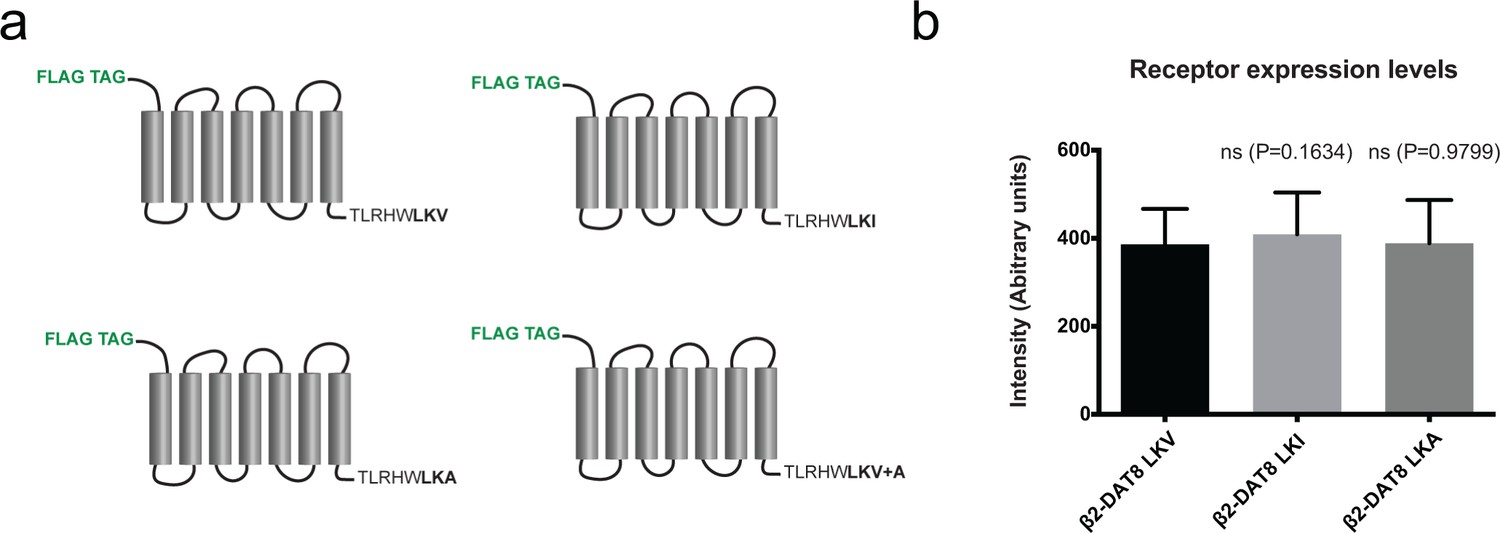
β2 fusion constructs and expression levels.
(a) Schematic representation of β2 C-terminal fusion constructs. (b) Expression levels of β2 DAT fusion constructs. Secondary units are arbitrary units relating to measured intensities.
Figure 4 with 3 supplements
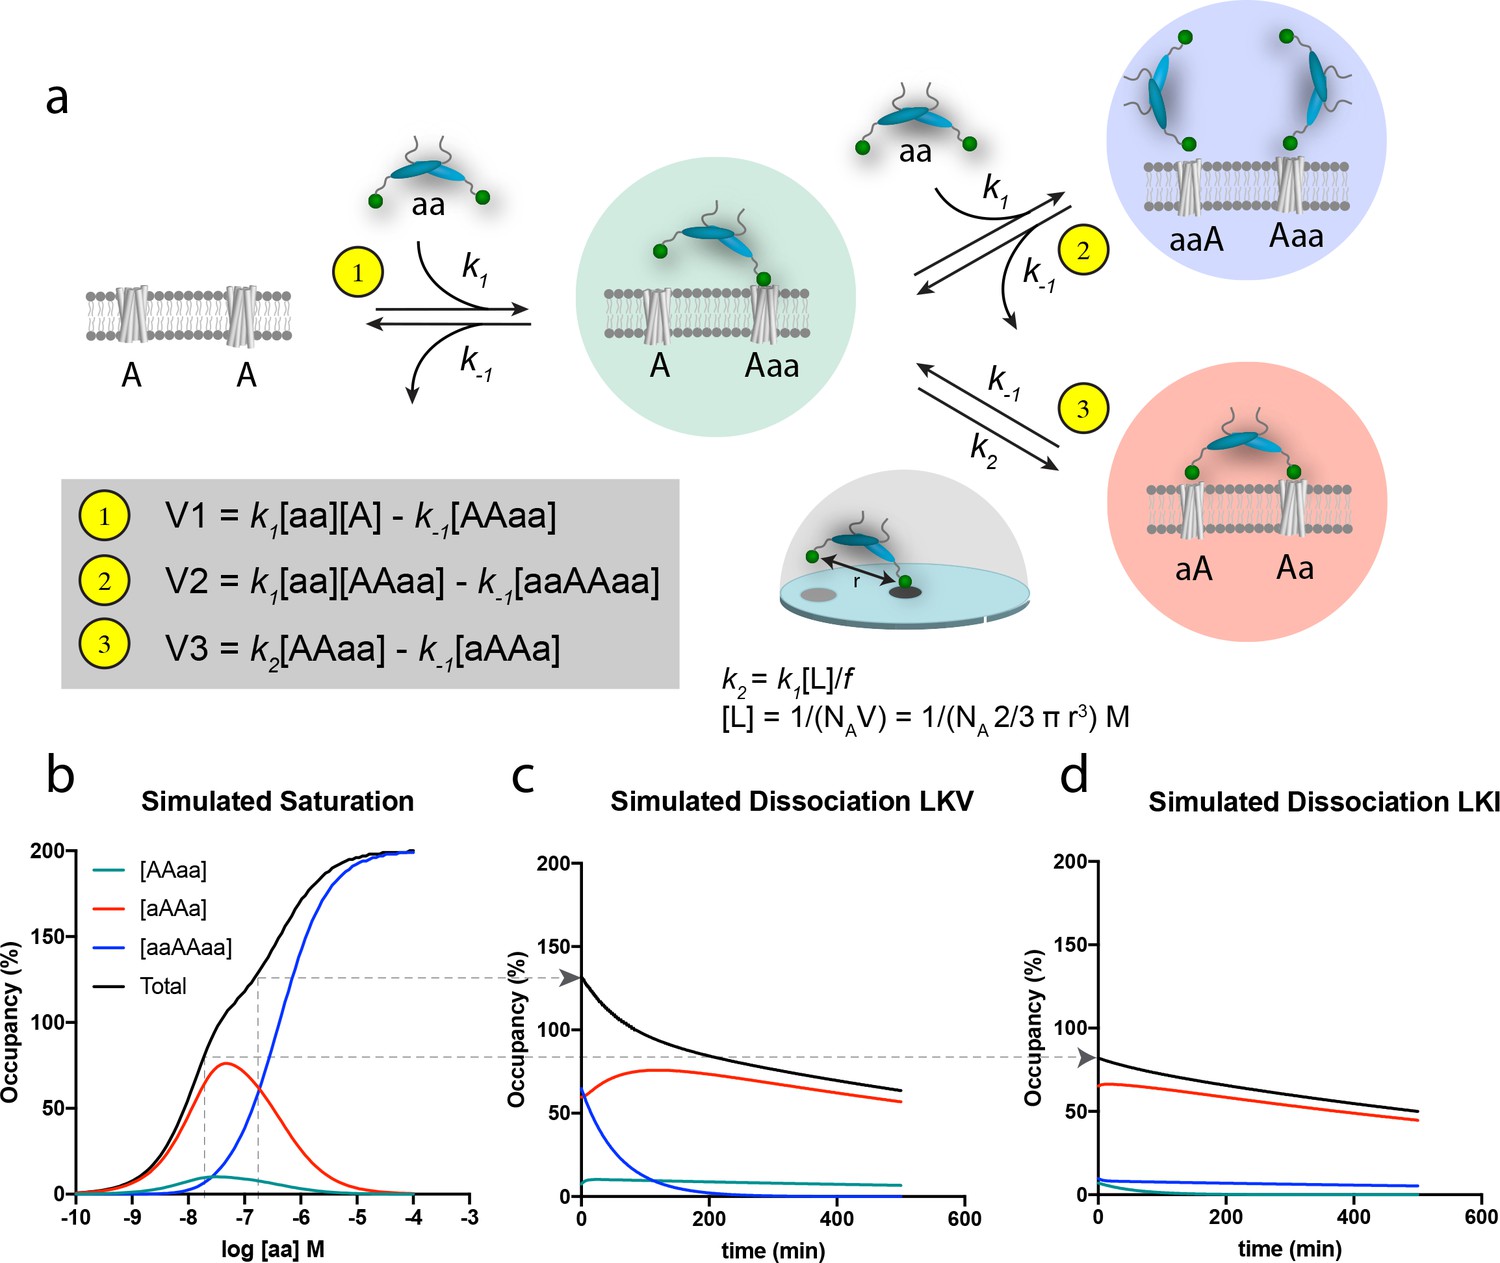
Schematic representation of the thermodynamic model for homobivalent ligand-target interactions and thereon-based simulated saturation and dissociation curves.
(a) Thermodynamic scheme for homobivalent ligand, ‘aa’- target, ‘AA’, interactions (see also Figure 4—figure supplement 1 for full scheme). The different binding modes in panel a are designated by ‘AAaa’ for the partially bound complexes (green), by ‘aAAa’ for the bivalently bound complex (red) and by ‘aaAAaa’ for ‘ternary’ complex with two partly bound ligands (blue). The rebinding kinetics is dependent the local concentration, [L], that is calculated as that of one molecule within a half-sphere with radius, r. Moreover, the rate constant is modified by f due to steric hindrance, restricted rational freedom and entropic cost. An f of 185 enables good qualitative simulation of our data (see also Figure 4—figure supplement 3 for behavior at other values of f). (b) Simulated saturation binding curve for binding of species. Input parameters: k1 = 1.85⋅105 M−1min−1, k-1 = 0.0085 min-−1, k2 = 0.136 min−1 (i.e. a composite rate constant such as defined in the figure). Total incubation time is 120 min. Analysis of the total signal according to a variable slope sigmoidal dose-response paradigm yields half-maximal signal at 50 nM. Note for these parameters the blue ‘ternary’ complex outpaces the red bivalent complex at bulk concentration of PICK1 above 100 nM. (c,d) Simulated dissociation curves after 120 min pre-incubation with 200 nM (c) and 20 nM (d) of the same homobivalent ligand as in panel c (corresponding to the affinity difference between LKV and LKI). [aa] is set and kept at 0 for simulating the ‘washout phase’.
Figure 4—figure supplement 1

Differential equations to follow the time-wise changes in the different target species shown in Figure 4.
(a) Abbreviated notation for the free and bound target species. As in Figure 4a, the different binding modes are designated by ‘AAaa’ for the partly complexes, by ‘aAAa’ for the fully bound bivalent complex and by ‘aaAAaa’ for the ternary complexes with two partly bound ligands. (b) Differential equations used for simulating the time-wise changes in the different target species. k1 is the association and k-1 the dissociation rate constants for the monovalent binding. When PICK1 is only attached via one of its PDZ domains the second PDZ domain can only move within half of a sphere with a radius, r, corresponding to the maximal distance between the two PDZ domains. The local concentration of the second PDZ domain, [L], can be calculated as showed in Figure 4a. The penalty factor, f, is introduced to modulate the association rate constant of the second PDZ interaction (k2) in order to account for limited rotational freedom, sterical hinderance or structural rearrangements governing binding of the second PDZ domain. [AA]occ refers to the sum of all ligand-bound species and is expressed as percent of the total target population.
Figure 4—figure supplement 2
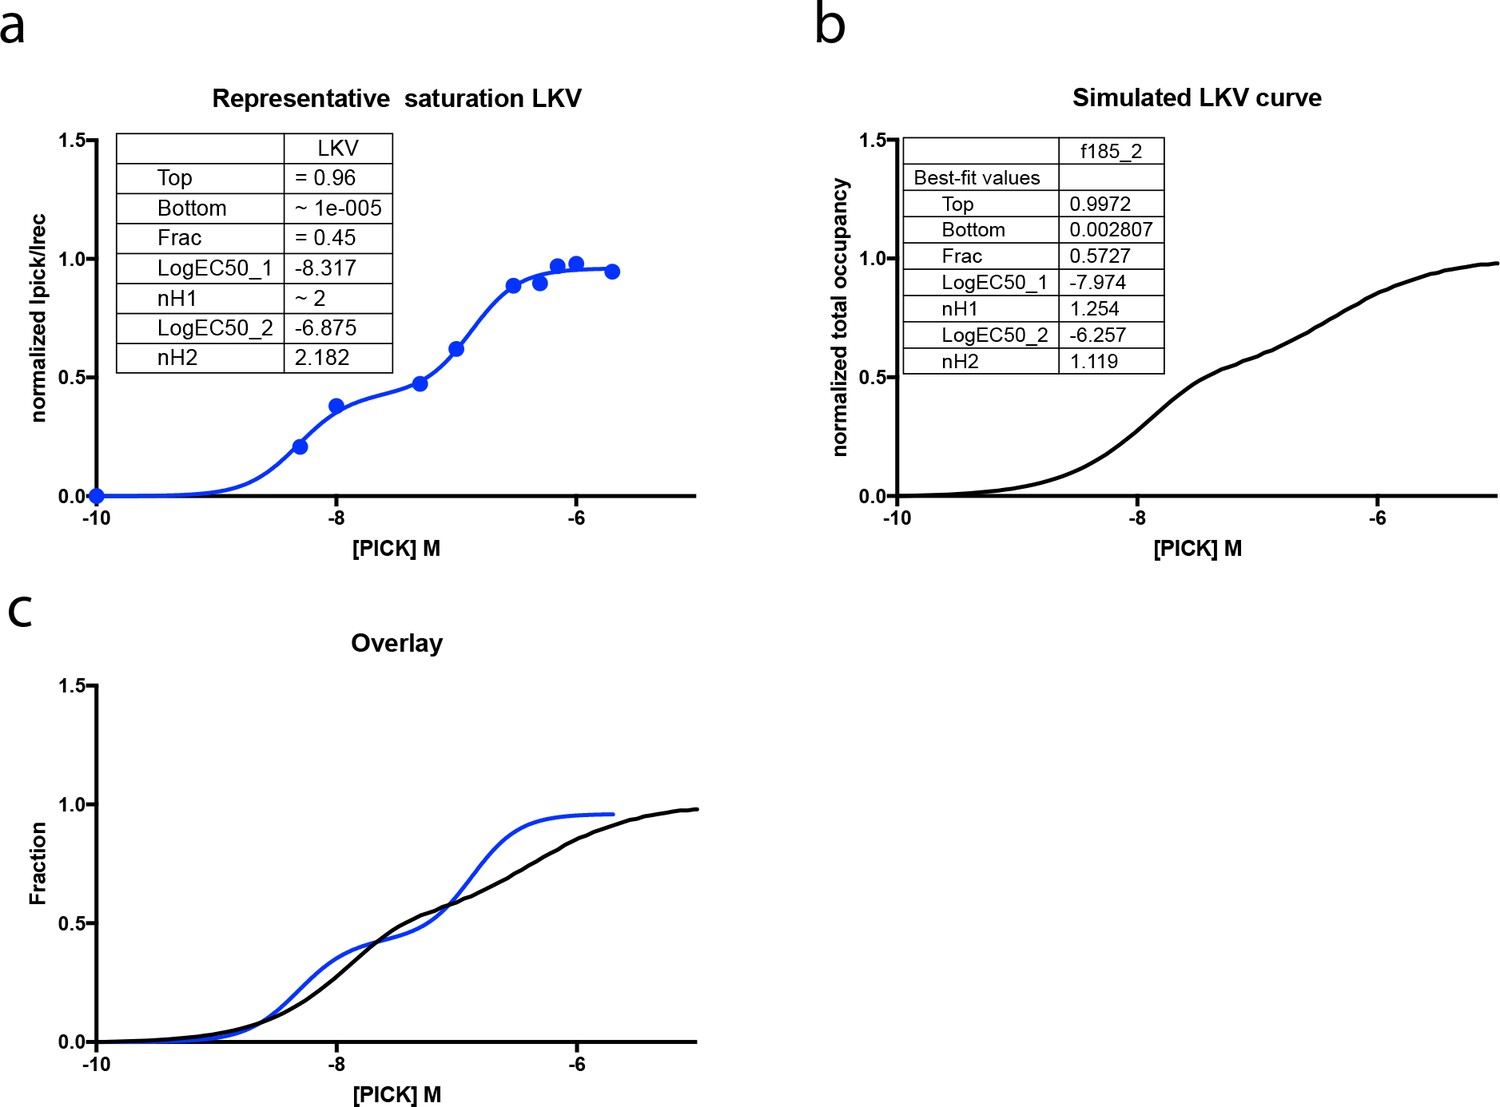
comparison of the PICK WT - LKV binding curves derived from experiments and the simulation.
(a) Representative binding curve derived from a single binding experiment of PICK1 WT to LKV. Here the biphasic behavior is not masked by the experimental error between different n’s and the biphasic curve binding becomes more pronounced. (b) Simulated binding curve of PICK1 WT binding to WT from Figure 4. (c) Overlay of the two fits shows good agreement between our experiment and simulation. Simulation parameters are given in the legend of Figure 4 and in the Materials and method section.
Figure 4—figure supplement 3
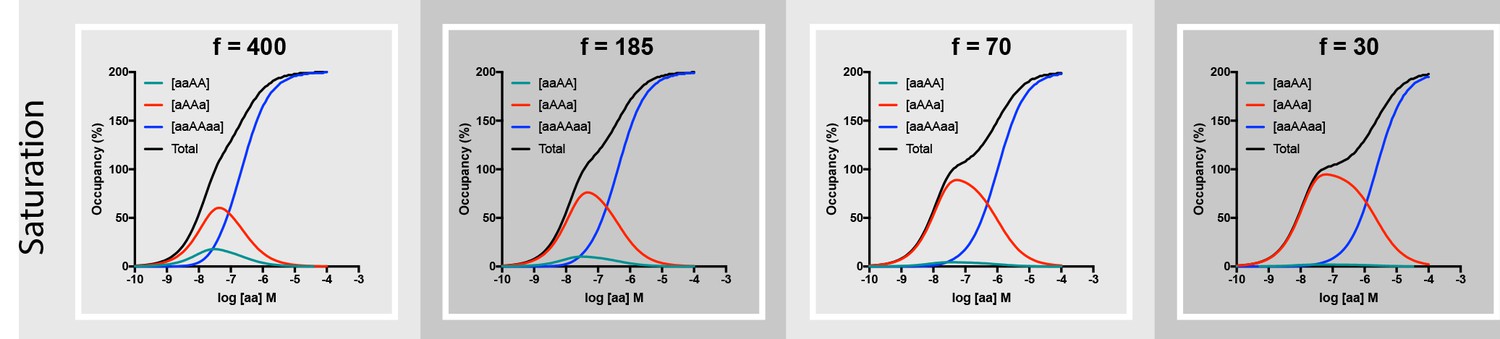
Broader range of f ratios and homobivalent ligand concentrations to illustrate the influence of this parameter on saturation profiles.
The binding model and the ligand-emitted (fluorescence) signal intensity of the different binding modes is outlined in the legend of Figure 4 and Figure 4—figure supplement 1. Input parameters are similar to those used in Figure 4: r = 180 Å, k1 = 1.85⋅105 M−1min−1, k-1 = 0.0085 min-−1, k2 = 0.136 min−1. Investigated f values are given on top of the panel. Total incubation time is 120 min. Curves move from nearly- sigmoidal to outspokenly biphasic when f decreases. This phenomenon illustrates the fact that even higher [aa] is required for V2 to exceed V3 as the f parameter decrease.
Figure 5 with 3 supplements
PICK1 switch scaffolding mode dependent on intrinsic PDZ affinity.
(a) Schematic representation of the experimental setup. Both PICK1 WT (blue) and PICK1 A87L (red) are labeled. Exchange is allowed before binding of PICK1 WT/A87L heterodimers. (b) Representative images of heterodimeric binding as a function of concentration. (c–e) Normalized concentration dependent binding to either LKV (solid lines) or LKI (dashed lines), and quantified in both the WT (blue) and A87L (red) channel as function of linear and logarithmic concentration. LKV PICK1 WT/A87L: Kd*=24 ± 21 nM, Bmax: 51 ± 2%. LKI PICK1 WT/A87L Kd*=123 ± 21 nM, Bmax: 56 ± 2% (see Tables 1–3 for explanation of Bmax values) (n = 3), (****p≤0.0001). (f) Schematic summary of conclusions made from figures c-e. Fitted Bmax values are shown on the y-axis, for PICK1 WT/WT and PICK1 WT/A87L to SCMS expressing LKV and LKI together with avidity and proposed binding mode (g–h) Flp-In T-REx 293 eYFP-PICK1 cells transiently expressing LKV, LKI, LKA or LKV +A with (black bars;+Tet) and without (white bars; −Tet) tetracycline-induced expression of eYFP-PICK1 were surface-labeled with anti-FLAG M1 antibody prior to stimulation of internalization with agonist (10 μM Isoproteronol for 20 min). Subsequently, cells were treated with the antagonist (10 μM Alprenolol, 60 min) to allow recycling to the plasma membrane. Surface receptor immunoreactivity was determined by surface ELISA. Internalization (g) refers to the fractional reduction of surface receptor in response to 25 min of agonist exposure compared with non-treated cells (100%). Recycling (h) refers to the fractional recovery of surface receptor following antagonist incubation for 1 hr. These values were all normalized to the respective signal of non-interacting β2-LKV + A, with and without tetracycline induction, respectively. Data are means ±S.E, n = 6. (***p<0.001, ns >0.05, One way ANOVA, Bonferroni’s post test compared to LKV +A). Scale bars 10 μm.
Figure 5—figure supplement 1
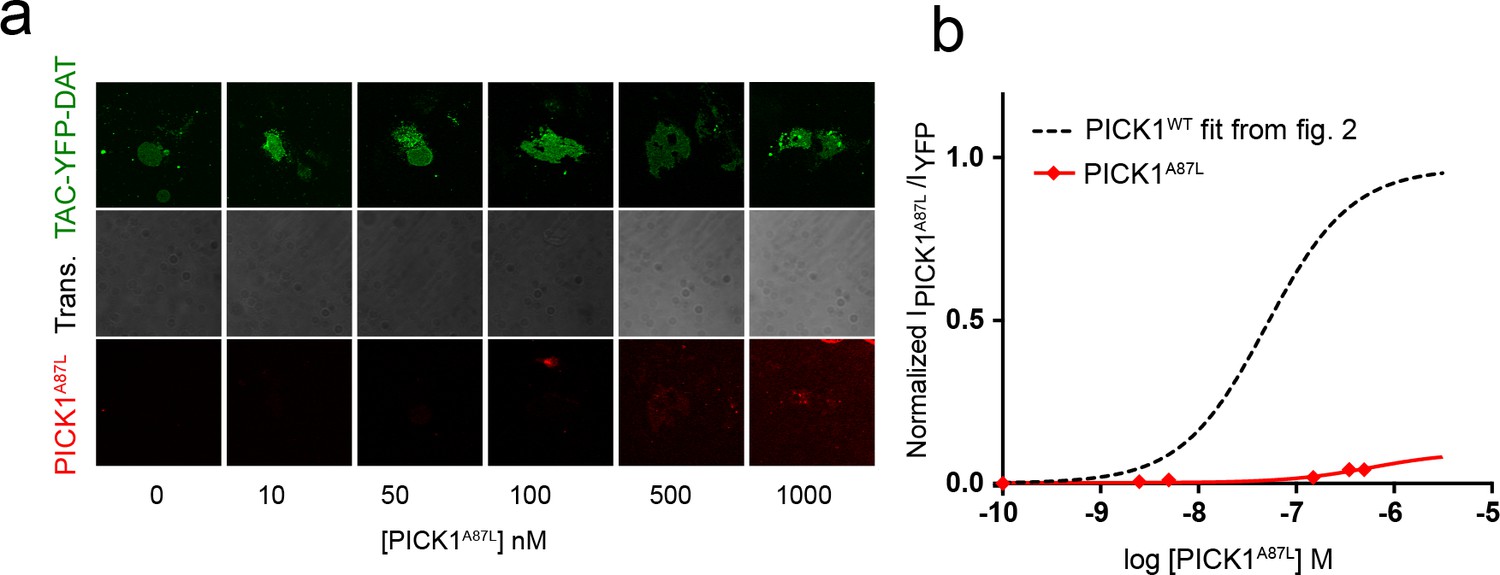
Mutation of the PICK1 PDZ domain abolished binding to SCMSs.
(a) Representative images showing concentration dependent binding of PICK1 A87L homodimers to TAC-YFP-DAT (b) Comparison between concentration dependent binding of PICK1 WT (dashed line and PICK1 A87L (red) homodimers. PICK1 A87L shows very little if any specific or unspecific binding to SCMS.
Figure 5—figure supplement 2
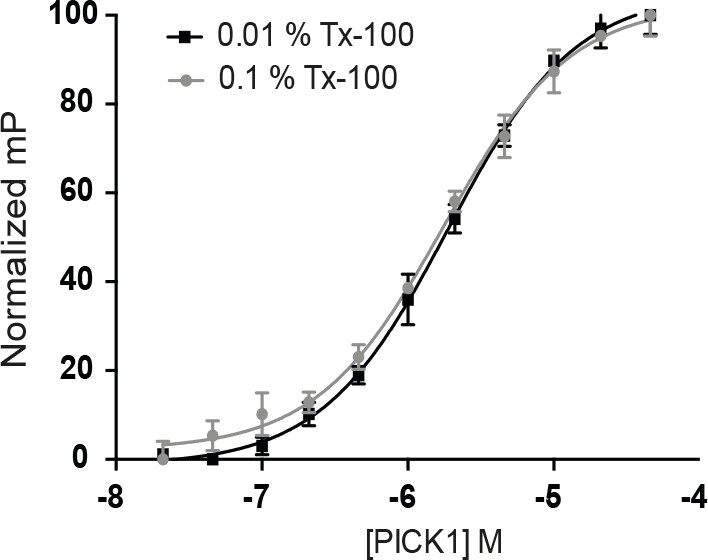
Triton-X 100 does not impair PICK1 PDZ domain function.
Fluorescence polarization experiment demonstrating identical PDZ-dependent binding of PICK1 in-solution to Org-DAT C13 peptide in 0.01% and 0.1% Triton-X 100, the latter was used for the exchange of monomers in Figure 5 (n = 3, each experiment performed in duplicates).
Figure 5—figure supplement 3
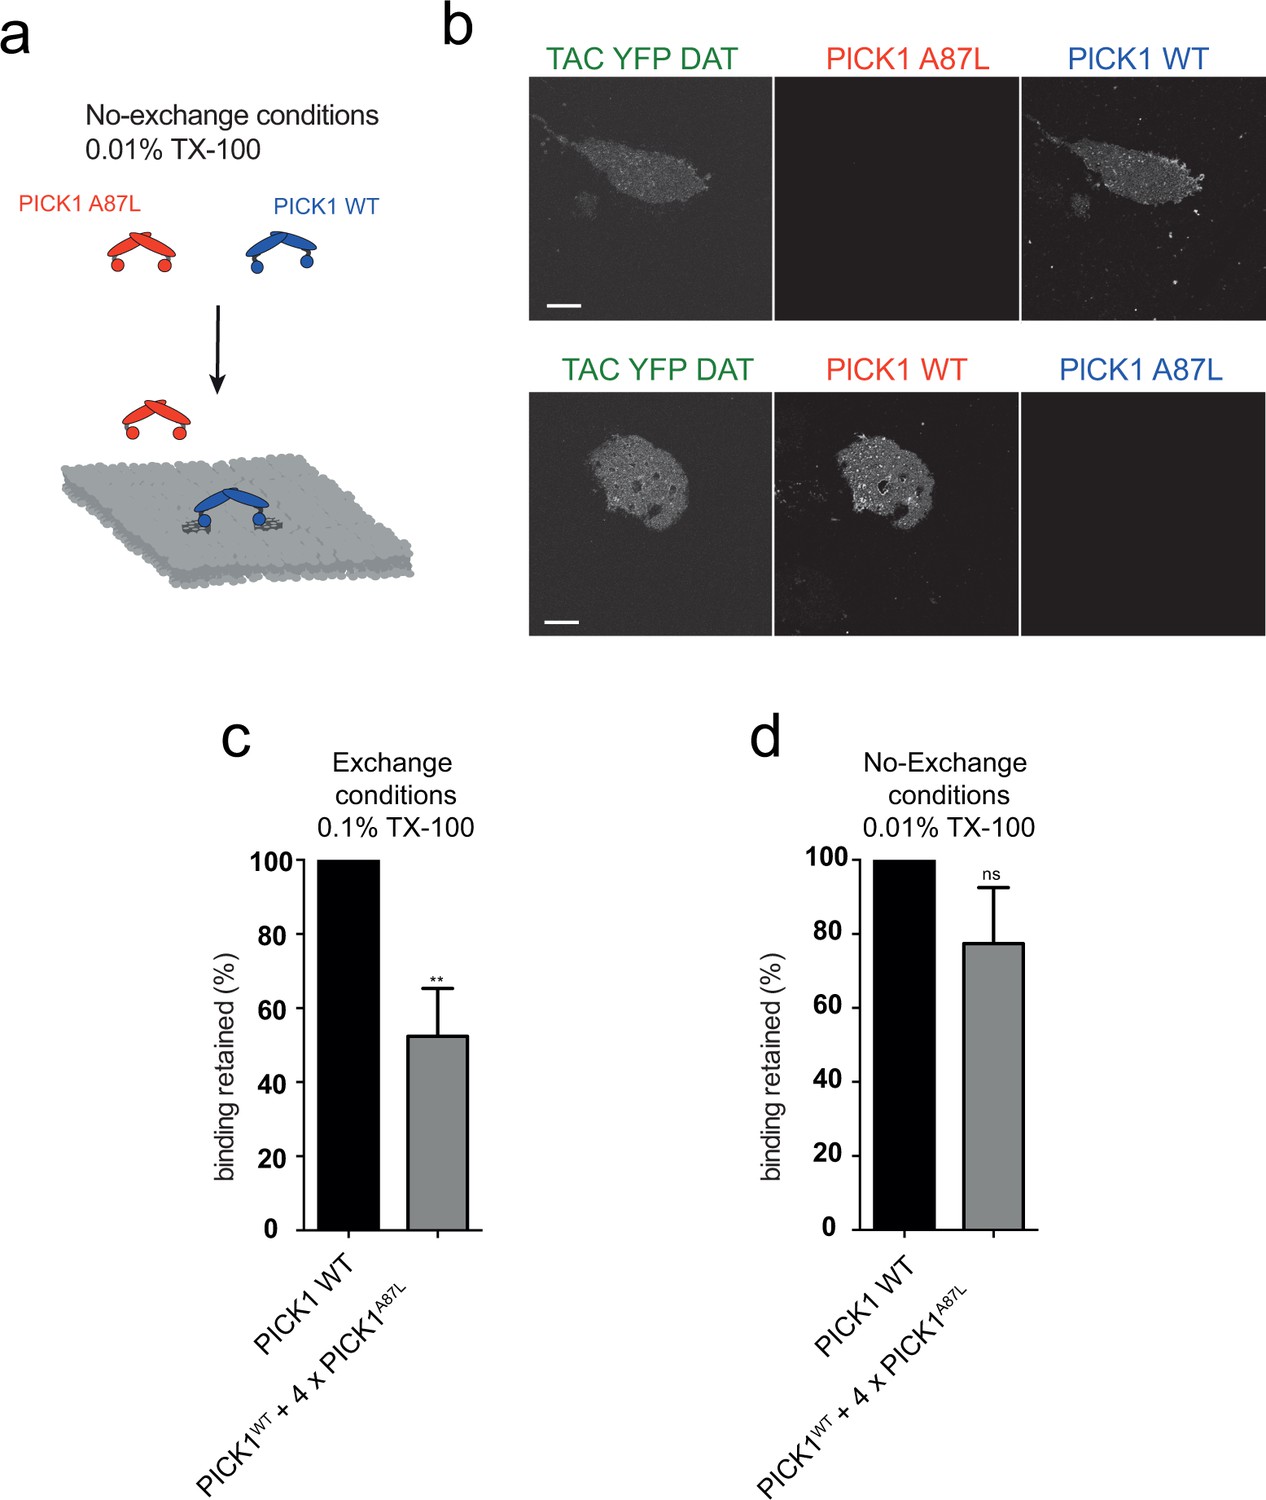
PICK1 WT binding does not promote nucleation of PDZ independent binding on the membrane sheets.
(a) Schematic representation of the nucleation experiment where PICK1 A87L/A87L and PICK1 WT/WT are mixed under no-exchange conditions (0.01% TX-100) (b) Representative images of the 0.01% exchange. Bound PICK1 WT/WT does not facilitate binding of PICK1 A87L/A87L through oligomerization. Color labeling reversed in bottom row. (c–d) Binding of PICK1 WT after incubation with four times excess PICK1 A87L in exchange (0.1%TX-100) or no-exchange (0.01% TX-100) conditions at a fixed PICK1 WT concentration of 100 nM. As expected, Bmax is maintained (p=0.0611) under no-exchange conditions. Under exchange conditions the Bmax was reduced to 52 ± 10% (**p≤0.01).
Figure 6

Disruption of the PICK AH compromises binding strength and alters synaptic localization and clustering of PICK1 in hippocampal neurons.
(a) PICK1 V121E,L125E amphipathic helix mutations depicted on PICK1 domain overview. (b) Normalized malemide stained PICK1 V121E,L125E binding as a function of concentration towards LKV. Kd*=0.28 ± 0.12 μM, Bmax: 95 ± 9%. Malemide stained PICK1 WT as dashed line for comparison. (c–d) Flp-In T-REx 293 eYFP-PICK1 WT or eYFP-PICK1 V121E, L125E cells transiently expressing LKV with (black bars;+Tet) and without (white bars; −Tet) similar to the data shown in Figure 3h–g. Data are means ± S.E, n = 6. (*p≤0.05, Students t-test, correction for multiple comparisons). (e) Model of PICK1 scaffolding. After the initial binding using one PDZ domain, PICK1 will be able to maintain avidity via both the second PDZ domain and the AH (grey box). The AH interaction, however, is dependent on the PDZ interaction. Under conditions yielding the second interaction relatively unfavorable state (2) will be slightly favored. This will allow for an additional PICK1 molecule to bind the free receptor site. If the concentration and intrinsic affinity is sufficiently high this state (3) can be maintained. (f) Representative images of hippocampal neurons, DIV 20–22, expressing GFP-PICK1WT (upper panel) or GFP-PICK1 V121E, L125E (lower panel) stained for GFP (left column) and PSD-95 (middle column), and the overlay is shown in the right column. Scale bar is 20 µm. (g) Quantification of the expression level of GFP-PICK1 WT and GFP-PICK1 V121E, L125E measured as the mean intensity of GFP in the soma. (h) Quantification of the number of dendritic PICK1 clusters (see Materials and method section for definition) relative to the number of PSD-95 clusters. (i) Quantification of PSD-95 clusters relative to dendritic length. (j) Quantification of the fraction of PICK1 clusters colocalized with PSD-95. All values are normalized to the corresponding mean value for GFP-PICK1 wt. (***p<0.001).
Tables
Table 1
PICK1 WT binding statistics.
https://doi.org/10.7554/eLife.39180.010| Ligand | EC50 (nM) | Bmax (% of max) | N | ||
|---|---|---|---|---|---|
| Tac-yfp dat c24 | 47 | ± | 5 | 100 § | 7 |
| TAC-YFP DAT C24 + A | n.d | - | 3 | ||
| TAC-YFP GluA2 C24 | 73 | ± | 19 | 44 ± 9 § | 3 |
| TAC-YFP GluA2 C24 + A | n.d | - | 3 | ||
| SF-GluA2 | 67 | ± | 6 | 100 and | 3 |
| SF GluA2 + A | n.d* | 33 ± 4 and | 3 | ||
| β2-DAT WT (LKV) | 37 | ± | 5 | 100 # | 8 |
| β 2-DAT LKI | 29 | ± | 4 | 56 ± 2 # | 7 |
| β 2-DAT LKA | 59 | ± | 11 | 41 ± 4 # | 5 |
| β 2-DAT + A | 201 | ± | 102 | 21 ± 3# | 3 |
Table 3
PICK1 Mutants binding to LKI
https://doi.org/10.7554/eLife.39180.020| PICK1 variant (LKI) | EC50 (nM) | Bmax (% of max) | N | ||
|---|---|---|---|---|---|
| Pick1 wt | 29 | ± | 4 | 56 ± 2 * | 7 |
| PICK1 A87L | n.d | - | 3 | ||
| Half label PICK1 A87L/WT | 123 | ± | 41 | 56 ± 2 * | 3 |
-
n.d: No detectable binding or that curves could not be reliably fitted to a saturable binding event.
n.d* Curve not fitted but for comparison an apparent Bmax is determined from the concentration endpoint.
-
* Comparable Bmax values
§ Comparable Bmax values
-
& Comparable Bmax values
Table 2
PICK1 Mutants binding to LKV.
https://doi.org/10.7554/eLife.39180.021| PICK1 variants (LKV) | EC50 (nM) | Bmax (% of max) | N | ||
|---|---|---|---|---|---|
| Pick1 wt | 37 | ± | 5 | 100 # | 8 |
| PICK1 A87L | n.d | - | 3 | ||
| PICK1 L121E V125E | 286 | ± | 126 | 95 ± 9 # | 3 |
| Half label PICK1 A87L/WT | 24 | ± | 21 | 51 ± 2 # | 3 |
Key resources table
| Reagent type (species) or resource | Designation | Source or reference | Identifiers | Additional information |
|---|---|---|---|---|
| Gene (Rattus Norvegicus) | pick1 | UNIPROT - Q9EP80 | ||
| Gene (Rattus Norvegicus) | gluA2 | UNIPROT - P19491 | ||
| Gene (Rattus Norvegicus) | B2AR | UNIPROT - P10608 | ||
| Gene (Rattus Norvegicus) | B1AR | UNIPROT - P18090 | ||
| Gene (Rattus Norvegicus) | PSD95 | UNIPROT - P31016 | ||
| Recombinant DNA reagent | FLAG-β2 DAT8 LKV | Madsen et al., 2012 | See Materials and methods Section | FLAG-β2ARHis6 Provided by Dr. Mark von Zastrow , vector: pcDNA3.1, |
| Recombinant DNA reagent | FLAG-β2 DAT8 LKI | This paper | See Materials and methods Section | |
| Recombinant DNA reagent | FLAG-β2 DAT8 LKA | This paper | See Materials and methods Section | |
| Recombinant DNA reagent | FLAG-β2 DAT8 LKV + A | Madsen et al., 2012 | See Materials andmethods Section | |
| Recombinant DNA reagent | FLAG-β1AR | |||
| Recombinant DNA reagent | SF-GluA2 | This paper | See Materials and methods Section | pRK5 pHluorin-GluA2 was kindly provided by Dr Richard Huganir. Vector pRK5 |
| Recombinant DNA reagent | SF-GluA2 + A | This paper | See Materials and methods Section | Vector pRK5 |
| Recombinant DNA reagent | Tac-YFP-GluA2 | This paper | See Materials and methods Section | pcDNA3.1 |
| Recombinant DNA reagent | Tac-YFP-GluA2+A | This paper | See Materials and methods Section | pcDNA3.1 |
| Recombinant DNA reagent | Tac-YFP-DAT | This paper | See Materials andmethods Section | pcDNA3.1 |
| Recombinant DNA reagent | Tac-YFP-DAT+A | This paper | See Materials andmethods Section | pcDNA3.1 |
| Recombinant DNA reagent | PICK1 WT | Madsen et al., 2005 | See Materials and methods Section | pET41a |
| Recombinant DNA reagent | PICK1 A87L | Madsen et al., 2005 | See Materials andmethods Section | pET41a |
| Recombinant DNA reagent | PICK1 L121E, V125E | Herlo et al., 2018 | See Materials and methods Section | pET41a |
| Recombinant DNA reagent | SNAP-PICK1 | This paper | See Materials and methods Section | pET41a |
| Recombinant DNA reagent | SNAP-PICK1 A87L | This paper | See Materials and methods Section | pET41a |
| Recombinant DNA reagent | PSD95 PDZ 1–2 | Provided by Dr. Kristian Strømgaard | ||
| Recombinant DNA reagent | GFP PICK1 WT | Herlo et al., 2018 | See Materials and methods Section | pcDNA5/FRT/TO |
| Recombinant DNA reagent | GFP PICK1 V121E, L125E | Herlo et al., 2018 | See Materials and methods Section | pcDNA5/FRT/TO |
| Recombinant DNA reagent | pOG44 vector | V600520 (ThermoFisher) | ||
| Cell line (Human) | HEK293 GripTite | Available from Thermofisher: A14150 | RRID:CVCL_U428 | Provided by Dr Jonathan Javitch. Vector pRK5 |
| Cell line (Human) | Flp-In T-REx 293 PICK1 | R78007 (ThermoFisher); Madsen et al., 2012 | RRID:CVCL_U427 | |
| Cell line (Human) | Flp-In T-REx 293 PICK1 | R78007 (ThermoFisher); This paper | ||
| Antibody | ANTI-FLAG M1 | F3040 (Sigma) | RRID:AB_439712 | (1:1000) |
| Antibody | horseradish peroxidase-conjugated goat anti-mouse IgG | (ThermoFisher) | RRID:AB_2535981 | (1:500) |
| Peptide, recombinant protein | OrG DAT C13 | Synthesized (TAG-Copenhagen) | ||
| Chemical compound, drug | alprenolol | A0360000 (Sigma) | ||
| Chemical compound, drug | isoproterenol | 1351005 (Sigma) | ||
| Chemical compound, drug | poly-L-ornithine hydrobromide | P-8638 (Sigma) | ||
| Other | Alexa Fluor C5 malemide 488/568 | A10254, A20341 (ThermoFisher) | ||
| Other | SNAP-surface dye 568/647 | S9112S, S9137 (New England Biolabs) | ||
| Other | Alexa Fluor 488 (NHS) | A20000 (ThermoFisher) | ||
| Other | SuperSignal ELISA Femto Substrate | 37075 (Thermo Fisher) | ||
| Software, algorithm | Graphpad Prism | |||
| Software, algorithm | ImageJ | |||
| Software, algorithm | Copasi |
Additional files
-
Transparent reporting form
- https://doi.org/10.7554/eLife.39180.022
Download links
A two-part list of links to download the article, or parts of the article, in various formats.
Downloads (link to download the article as PDF)
Open citations (links to open the citations from this article in various online reference manager services)
Cite this article (links to download the citations from this article in formats compatible with various reference manager tools)
Mechanisms of PDZ domain scaffold assembly illuminated by use of supported cell membrane sheets
eLife 8:e39180.
https://doi.org/10.7554/eLife.39180


