A nanobody-based molecular toolkit provides new mechanistic insight into clathrin-coat initiation
- University of Pittsburgh, United States
Figures
Figure 1
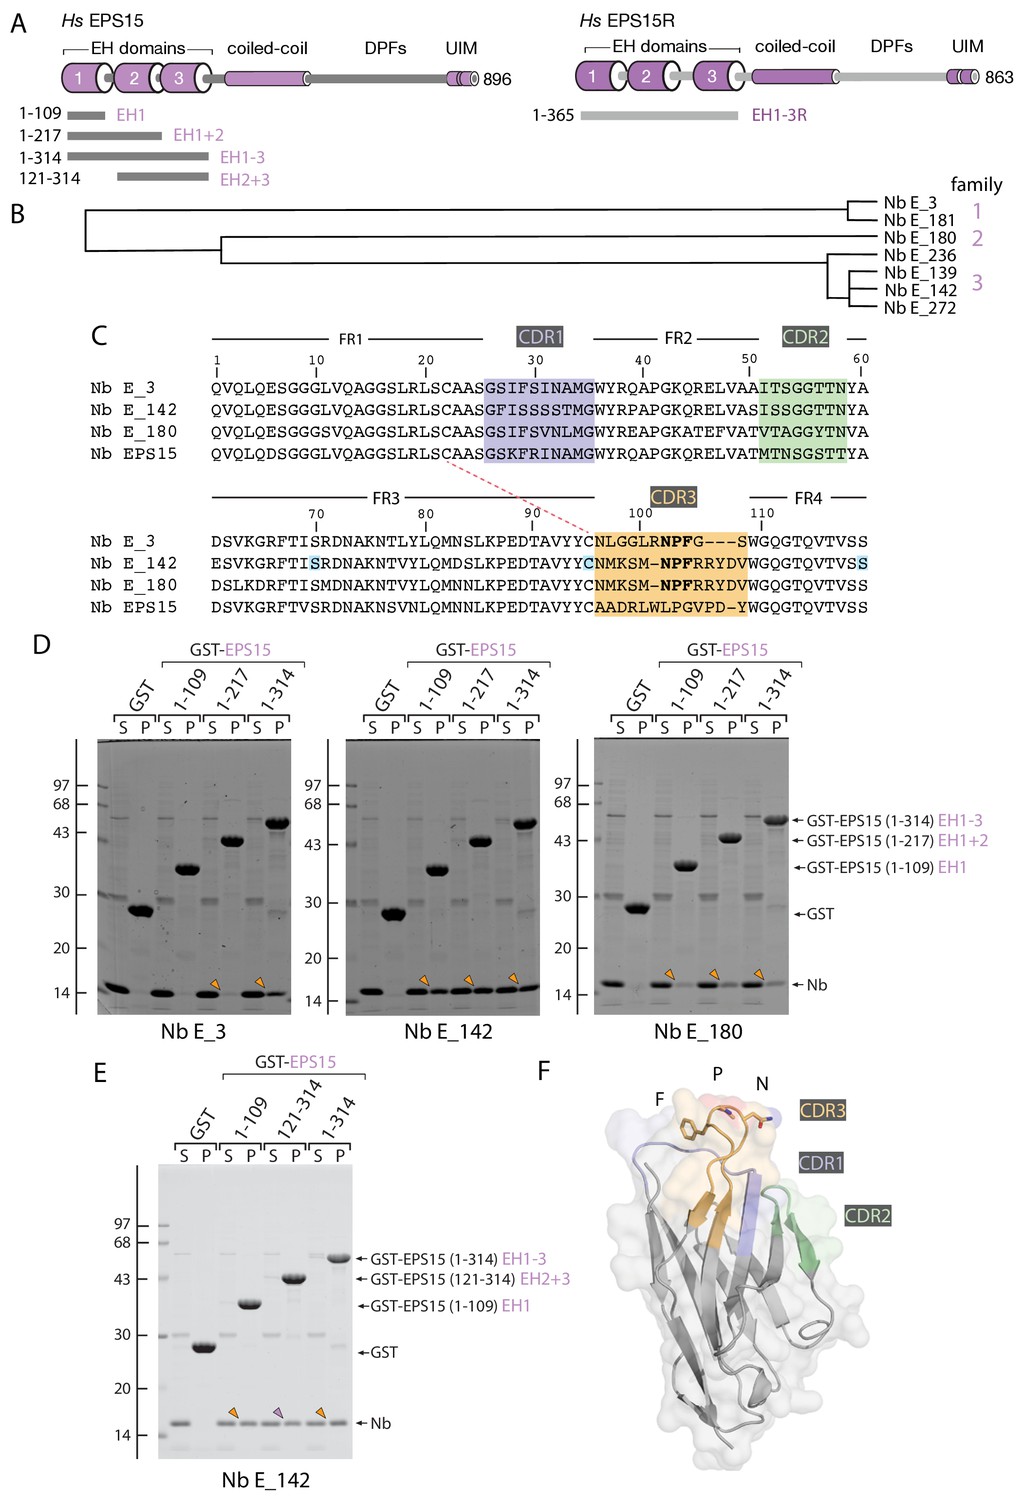
Anti-EPS15 Nb identification.
(A) Schematic diagrams of the overall architecture and structural features of H. sapiens (Hs) EPS15 and EPS15R proteins. The relative location of various GST-fusion proteins used is indicated. DPF: Asp-Pro-Phe SLiM repeat containing domain, UIM: ubiquitin-interacting motif. (B) Dendrogram of amino-acid sequence relationship between the seven VHH anti-EPS15 Nbs selected by biopanning and ELISA screening. Some intrafamily variability may have arisen from RT-PCR and/or amplification PCR-based DNA polymerase errors. (C) Amino acid alignment. Framework regions (FR) 1–4 and interposed, color-coded CDR1-3 stretches are indicated. The pair of cysteine residues involved in disulfide formation is indicated (dashed red line), while the three residues mutated in the conditionally-destabilized (Tang et al., 2016) desNb E_142 protein are highlighted (blue). (D) Pull-down assay of soluble anti-EPS15 Nb in E. coli periplasmic lysates using 50 μg GST, GST-EPS15 (1-109 , 1-217) or (1-314). Analysis of supernatant (S) and pellet (P) fractions after incubation of Sepharose-bead-immobilized GST fusion with E. coli periplasmic extract containing the indicated Nb. Coomassie-stained gels shown, with the position of the molecular mass standards (in kDa) indicated. Bound Nb recovered in the pellet fraction is indicated (arrowheads). (E) Binding of Nb E_142 to GST-EPS15 (1-134) and (121-314) lacking the EH1 domain as in D. (F) Combined ribbon and molecular surface representation of a computationally-threaded structure of Nb E_142 modeled by Phyre2 server (Kelley et al., 2015). The locations of the CDR1-3 on the folded VHH domain model are indicated with coloring as in C, while the NPF SLiM in CDR3 is shown in stick representation and single letter amino acid code.
Figure 2
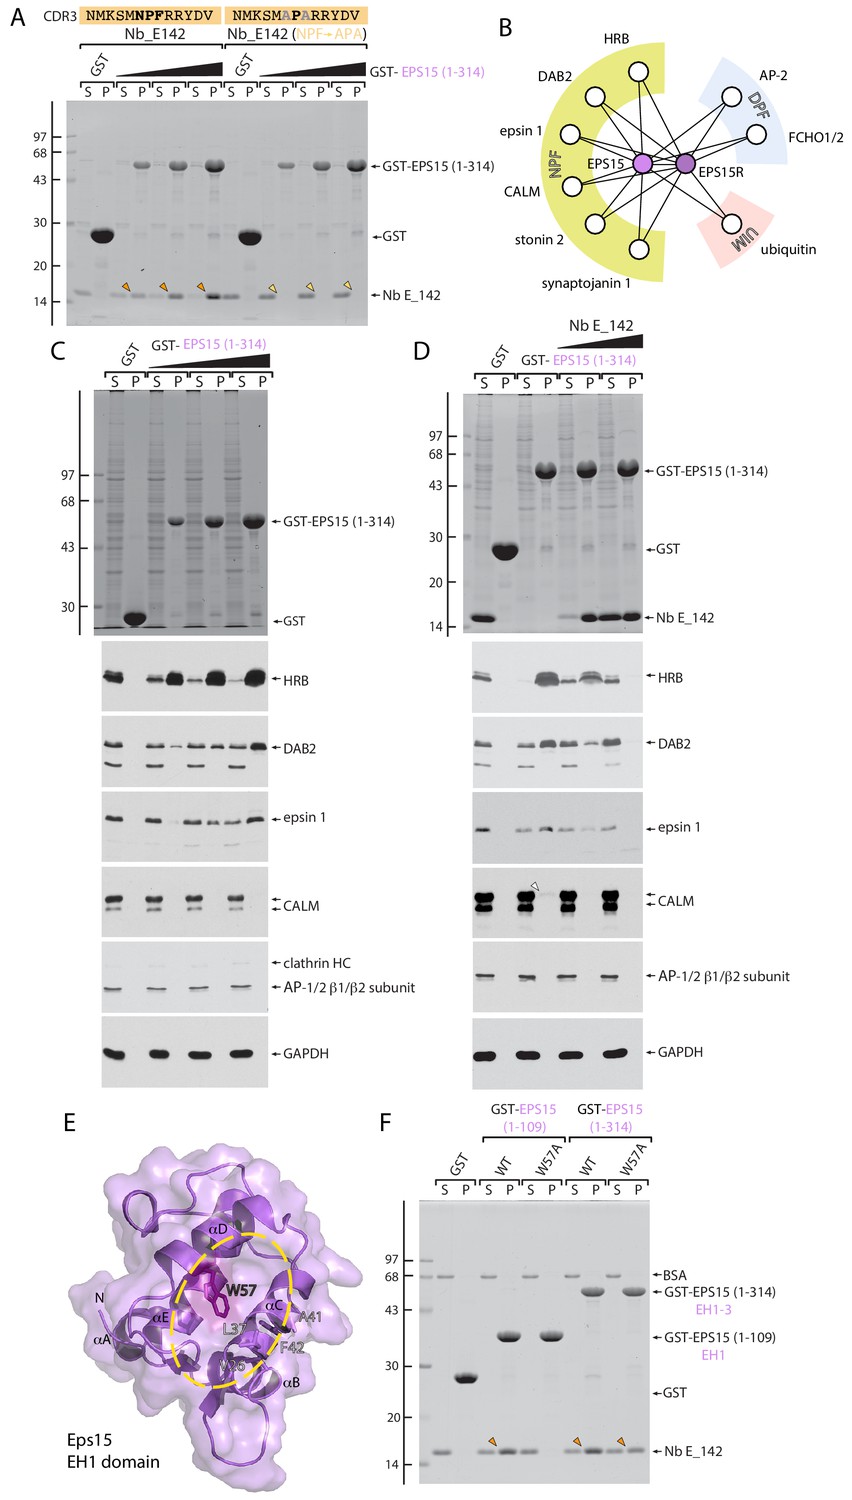
EH domain function-blocking Nb E_142.
(A) Pull-down binding assay of Nb E_142 and an NPF→APA E_142 mutant expressed in E. coli periplasmic extracts to either GST or increasing amounts of GST-EPS15 (1-314). Typical Coomassie-stained gel shown with the position of the molecular mass standards (in kDa) indicated on the left. (B) Schematic depiction of EPS15 and EPS15R interaction partners grouped by peptide SLiM or protein interaction type. (C) Biochemical pull-down assay of NPF-SLiM-containing partners within HeLa whole cell lysate to either immobilized GST or increasing amounts of GST-EPS15 (1-314) EH1-3 domain. After fractionation by SDS-PAGE, gels were either stained with Coomassie blue or transferred to nitrocellulose and immunoblotted with the indicated antibodies. (D) Inhibition of NPF-based partner protein interactions with 200 μg immobilized GST-EPS15 (1-314) by equimolar (45 μg) or 5-fold (225 μg) molar excess of added Nb E_142. (E) Combined ribbon and molecular surface representation of the M. musculus Eps15 EH1 domain (PDB ID: 1QJT) with location of W57 highlighted. Residues within the interaction surface (yellow oval) that undergo substantial chemical shift upon NPF ligand binding (Whitehead et al., 1999) are indicated. (F) Elimination of Nb binding by EH1 domain interaction site disrupting W57A mutation. Coomassie-stained gel of a pull-down assay using 50 μg of the indicated GST-fusion proteins with purified Nb E_142 protein. The location of the BSA carrier protein in the supernantant fractions is indicated, and bound Nb recovered in pellet fractions is indicated (arrowheads).
Figure 3 with 1 supplement
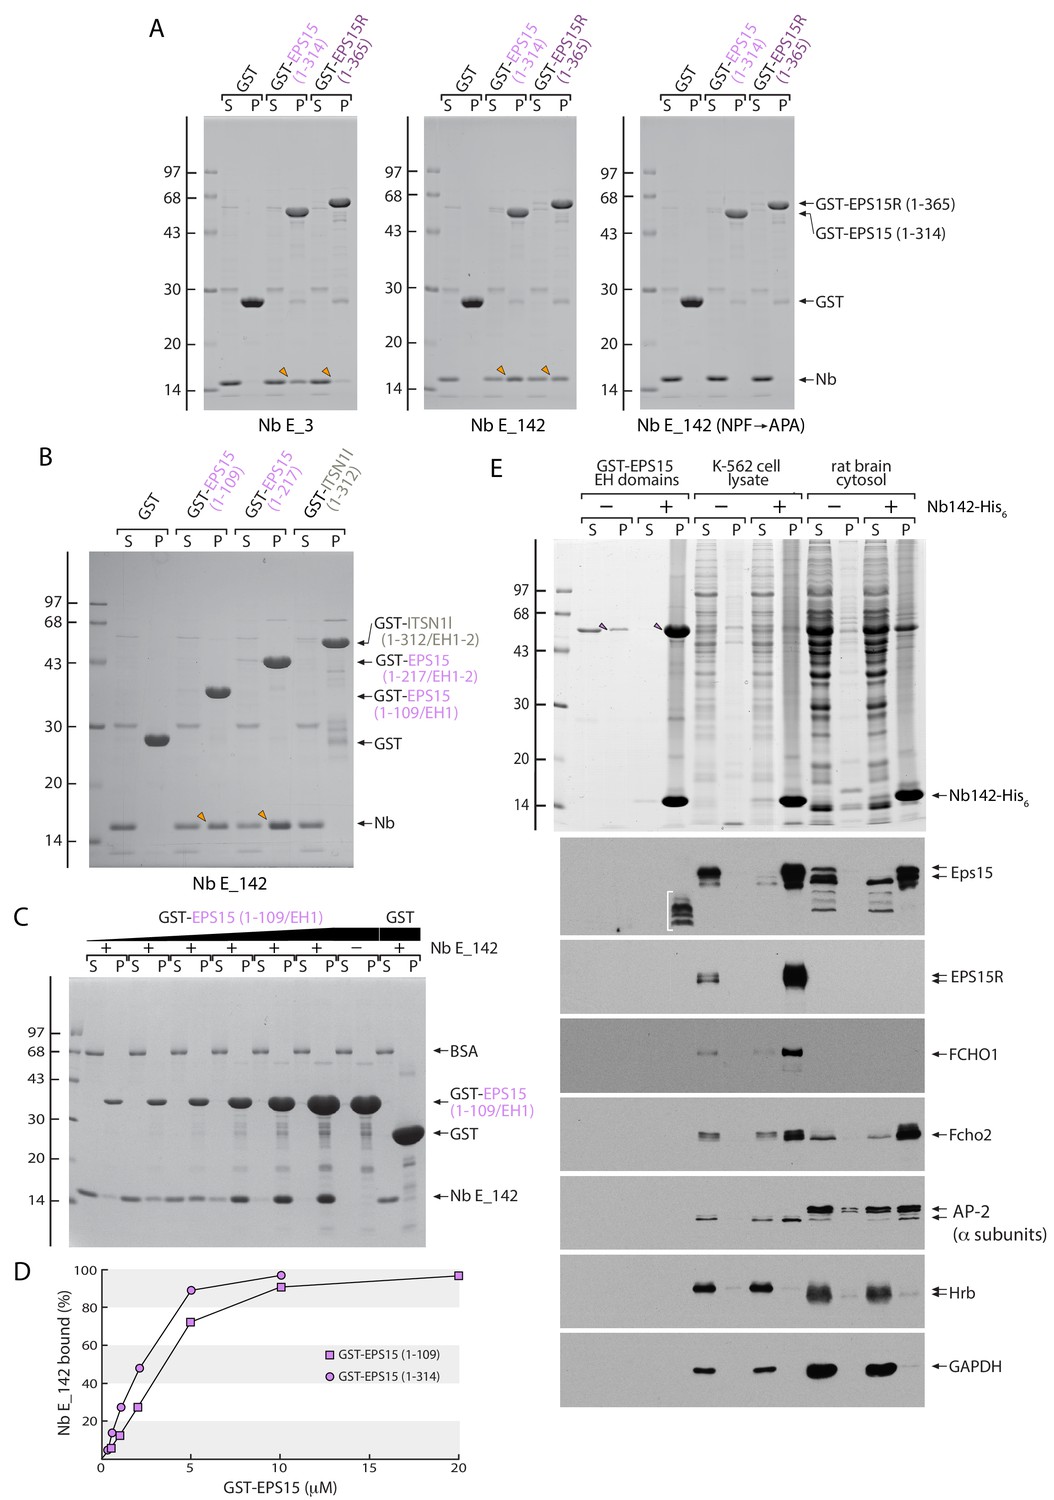
Direct interaction of Nb E_142 with the EPS15/R but not intersectin 1 EH domains.
(A) Analysis of supernatant (S) and pellet (P) fractions after incubation of 50 μg Sepharose-bead-immobilized GST, GST-EPS15 (1-314) or GST-EPS15R (1-365) with periplasmic extracts containing either Nb E_3, Nb E_142 or Nb E_142 (NPF→APA) as indicated. Coomassie-stained gels shown, with the position of the molecular mass standards (in kDa) indicated on the left, and bound Nb (arrowheads) shown. (B) Analysis of supernatant (S) and pellet (P) fractions after incubation of 50 μg Sepharose-bead-immobilized GST, GST-EPS15 (1–109/EH1) or GST-EPS15 (1–217/EH1-2) and GST-intersectin 1 l (ITSN1l) (1–312/EH1-2) with periplasmic extracts containing either Nb E_3, Nb E_142 as indicated. Coomassie-stained gel shown, with the position of the molecular mass standards (in kDa) indicated on the left, and bound Nb (arrowheads) shown. (C) Analysis of supernatant (S) and pellet (P) fractions after incubation of 20 μM Sepharose-bead-immobilized GST or 0.5–20 μM GST-EPS15 (1–109/EH1) with 2 μM purified Nb E_142 in the presence of 100 μg/ml BSA as indicated. Coomassie-stained gel shown, with the position of the molecular mass standards (in kDa) indicated on the left. (D) Plots of the mean of three determinations that differed by less than 10% shown for GST-EPS15 (1-109) (squares) or GST-EPS15 (1-314) (circles) titrations. Estimation of KD from the quantitative analysis of the supernatant fractions yields ~3 μM for a single EH domain (1-109) and ~2 μM for the triple EH domain array (1-314). (E) Analysis of supernatant and pellet fractions after immunoprecipitation of purified GST-EPS15 (1-314) (arrowheads) or native Eps15 in K-562 cell lysate or rat brain cytosol. After fractionation by SDS-PAGE, gels were either stained with Coomassie blue or transferred to nitrocellulose and immunoblotted with the indicated antibodies. Non-specific rabbit anti-EPS15 cross-reactive material in the pellet fraction from the GST-EPS15 (1-314) incubation is identified (bracket).
Figure 3—figure supplement 1
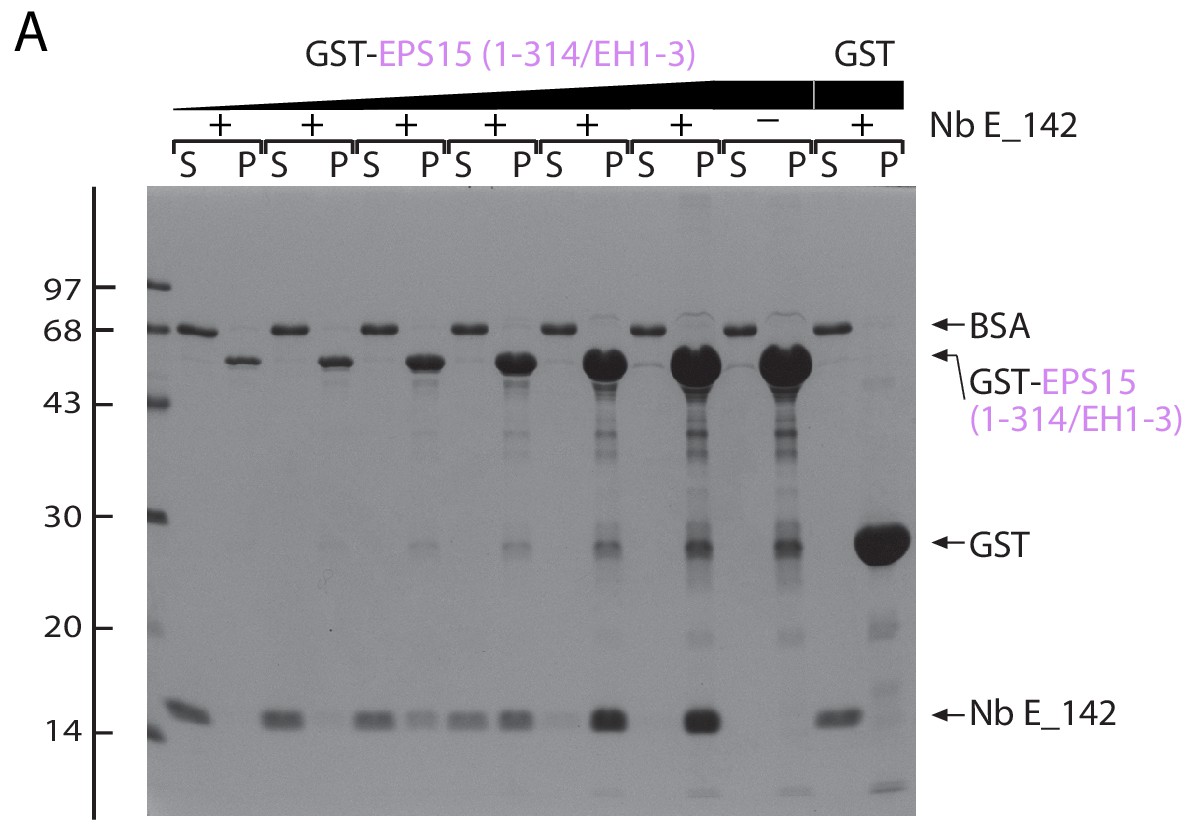
Quantitative titration of Nb E_142 with immobilized GST-EPS15 (1-314).
SDS-PAGE analysis of supernatant (S) and pellet (P) fractions of a representative pull-down assay after incubation of 10 μM Sepharose-bead-immobilized GST or 0.25–10 μM GST-EPS15 (1–314/EH1-3) with 2 μM purified Nb E_142 in the presence of 100 μg/ml carrier BSA, as indicated. Coomassie-stained gel shown, with the position of the molecular mass standards (in kDa) indicated on the left.
Figure 4 with 1 supplement
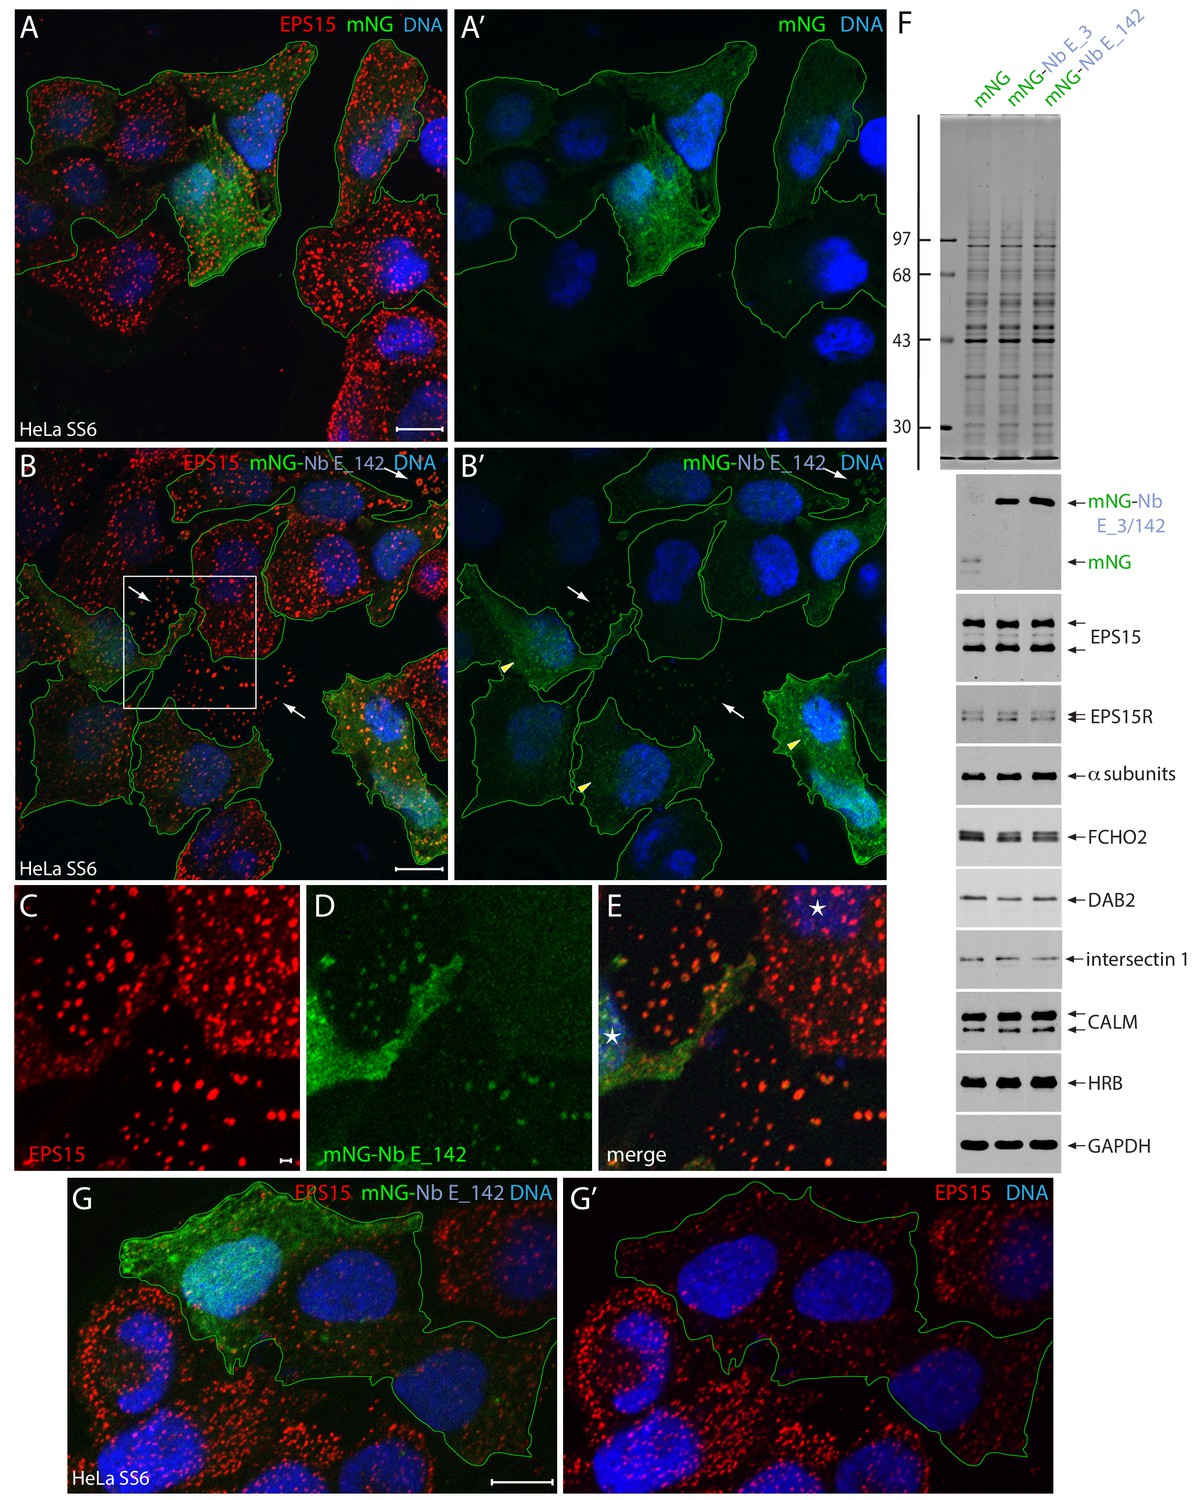
Intracellular expression of mNG-Nb E_142 in HeLa cells.
(A–E) Selected but representative basal confocal optical sections of HeLa SS6 cells, fixed after transient expression of either control mNG (A and A’; green) or mNG-Nb E_142 (B–G), and stained with anti-EPS15 antibodies (red) and Hoechst DNA dye (blue). The mNG-expressing transfected cells are outlined (green) and glass-attached ruptured cell cortices (arrows) and Nb E_142 colocalizing weakly with endogenous EPS15 (arrowheads) in intact cells are indicated. Color-separated enlargements (C–E) of the region boxed in B are shown with nuclei (asterisks) in intact cells identified. The presence of mNG-Nb E_142 within EPS15-positive, morphologically aberrant clathrin-coated structures is evident on the adherent membrane fragments from sheared-off non-viable cells (Heuser, 1989). Scale bar; 10 μm; 1.0 μm in C. (F) SDS-PAGE and immunoblot analysis of whole HeLa cell lysates after transfection with plasmids encoding mNG, mNG-Nb E_3 or mNG-Nb E_142 as indicated and either stained with Coomassie blue or probed with the indicated antibodies. Molecular mass standards (in kDa) are shown on the left. (G–G’) Selected but representative confocal basal optical section of HeLa SS6 cells expressing mNG-Nb E_142 and analyzed as in B. mNG-expressing transfected cells are outlined. Scale bar; 10 μm.
Figure 4—figure supplement 1
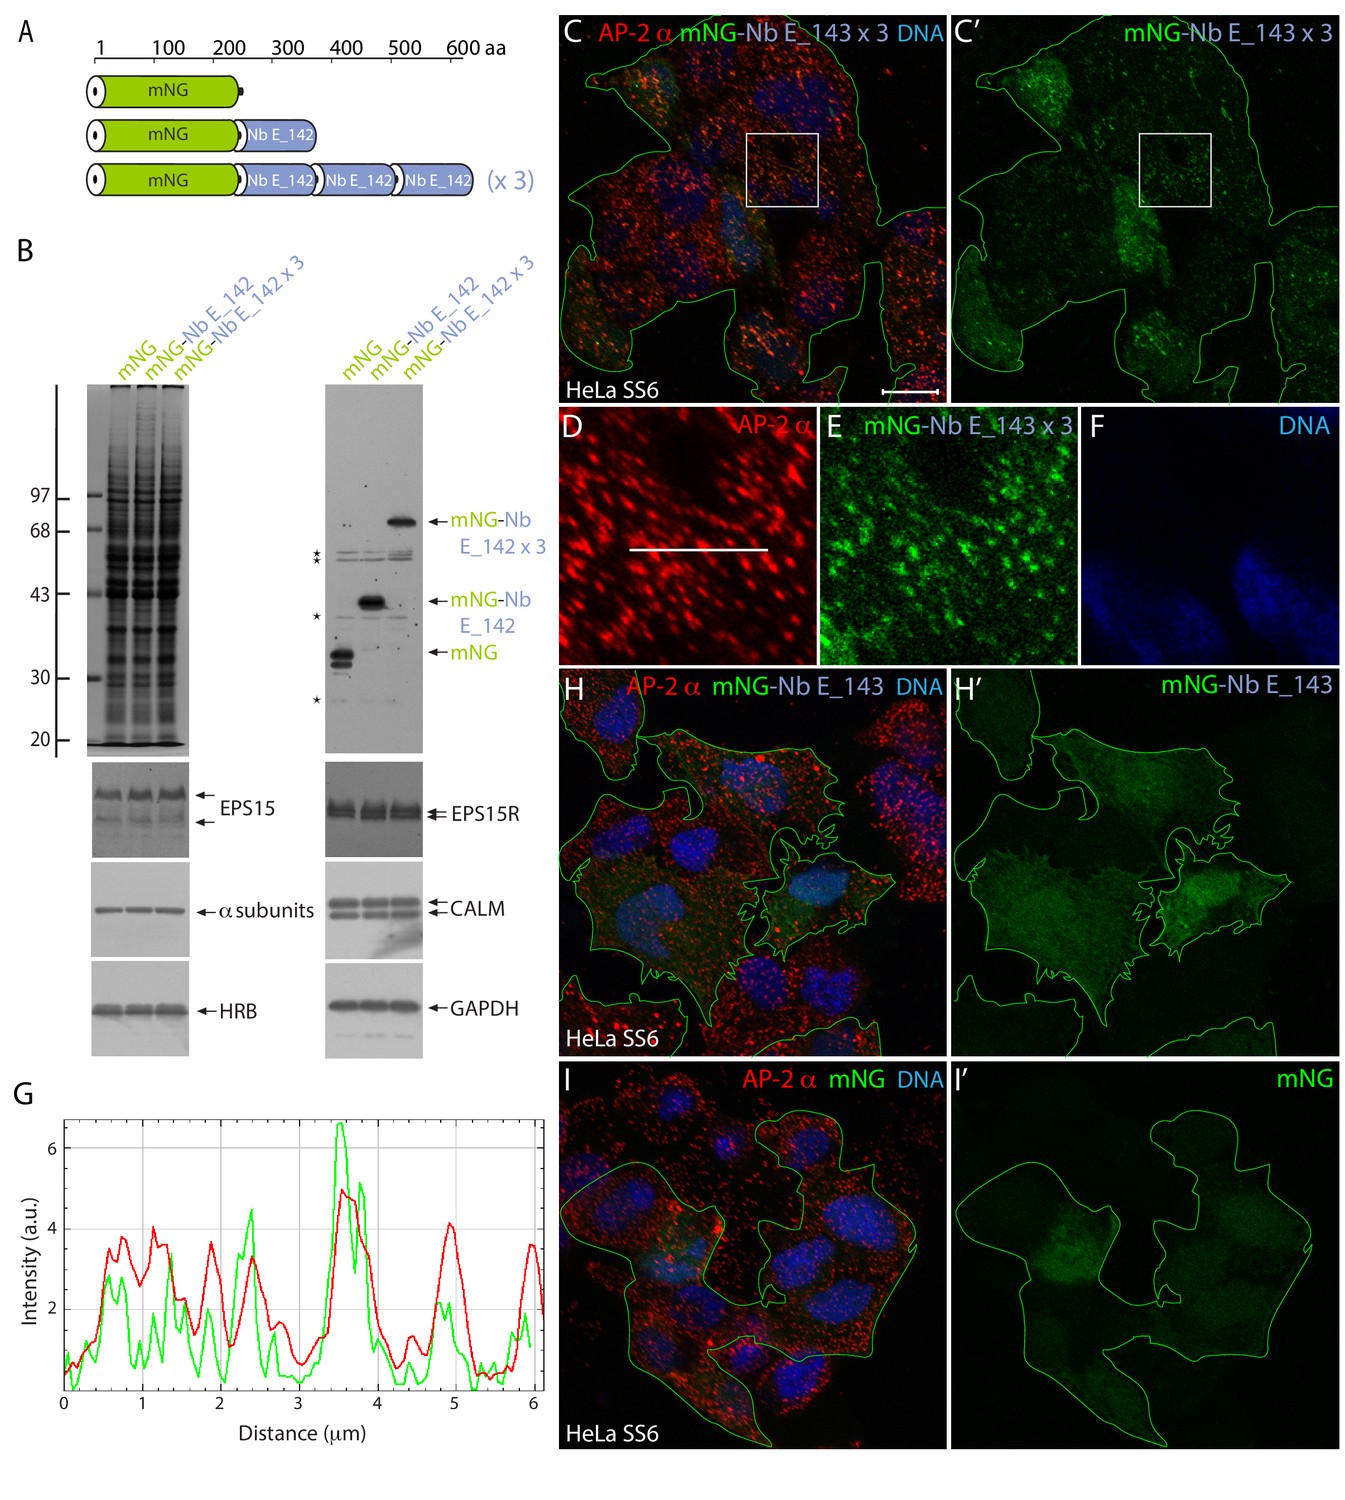
Efficient intracellular labeling of endogenous EPS15 in AP-2-positive clathrin-coated structures with a polyvalent tandem mNG-Nb E_142 × 3 fusion protein.
(A) Schematic depiction of the relative domain architecture of mNG, mNG-Nb E_142, and mNG-Nb E_142 × 3 intrabody constructs. aa: amino acid. (B) Biochemical validation of expression of intact intrabody fusions in HeLa SS6 cells. Whole-cell lysates from cells transiently transfected with encoding plasmids as indicated, subjected to SDS-PAGE analysis and either stained with Coomassie blue or transferred to nitrocellulose and immunoblotted with the indicated antibodies. Molecular mass standards (in kDa) are shown on the left, while non-specific, cross-reactive bands observed with the anti-mNG antibody are identified (asterisks). (C–F) Selected but representative basal confocal optical section of HeLa SS6 cells, fixed after transient expression of tandem mNG-Nb E_142 × 3, and stained with the anti-AP-2 α subunit mAb AP.6 (red) and Hoechst DNA dye (blue). The mNG-expressing transfected cells are outlined (green). Scale bar; 10 μm. Color-separated enlargements of the regions boxed in C and C’ are shown below (D–F). (G) Line-scan analysis of fluorescent signal colocalization of the AP-2 adaptor (red) and ectopic mNG-Nb E_142 × 3 (green) along the white line indicated in panel D. a.u.; arbitrary units. (H–I) Selected but representative comparative basal optical sections of HeLa SS6 cells transiently transfected with either the single mNG-Nb E_142 (H–H’) or control mNG (I-I’; green) encoding plasmids.
Figure 5 with 1 supplement
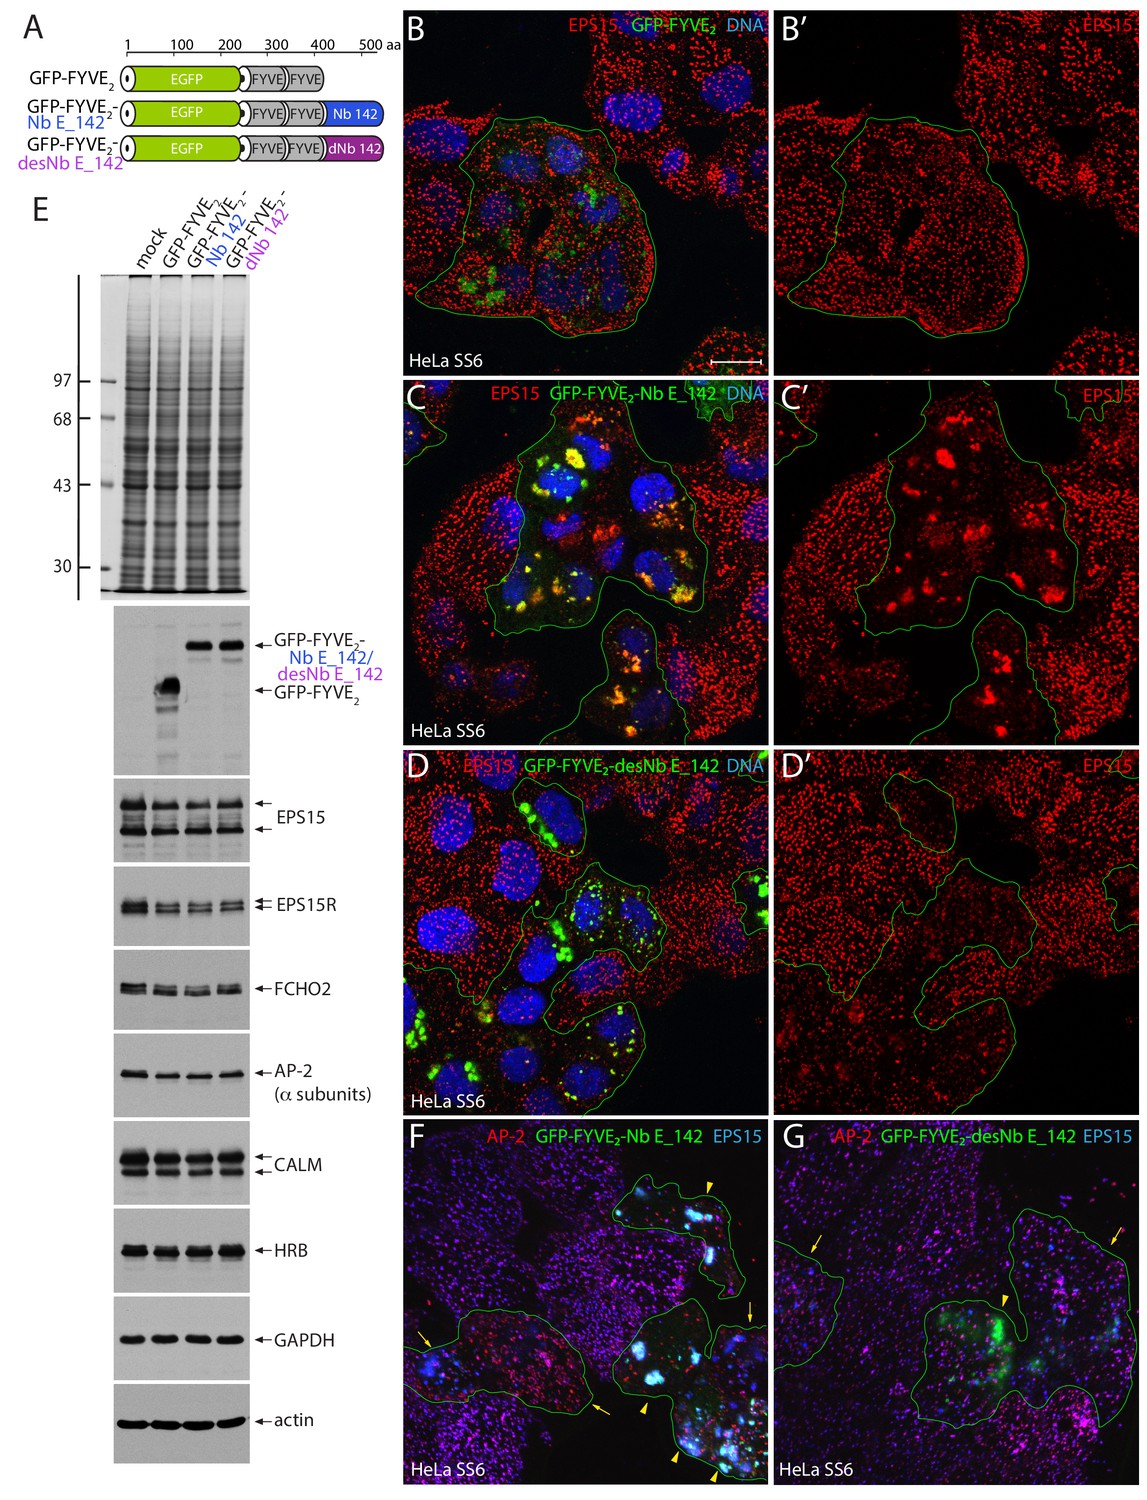
Massive endosome displacement of endogenous EPS15 with GFP-FYVE2-Nb E_142.
(A) Schematic depiction of the domain arrangement of the GFP-FYVE2-based fusion proteins analyzed. (B–D’) Selected but representative confocal basal optical sections of HeLa SS6 cells transfected with either negative control GFP-FYVE2 (B, B’), GFP-FYVE2-Nb E_142 (C, C’) or destabilized GFP-FYVE2-desNb E_142 (D, D’). Fixed cells were stained with anti-EPS15 antibodies (red) and DNA dye (blue). Scale bar; 10 μm. (E) SDS-PAGE and immunoblot analysis of whole HeLa SS6 cell lysates either mock transfected or transiently transfected with GFP-FYVE2-based plasmids as indicated. Gels were either stained with Coomassie blue or transferred to nitrocellulose and probed with the indicated antibodies. Molecular mass standards (in kDa) are shown on the left. (F–G) Basal confocal section of transiently transfected HeLa SS6 cells expressing either GFP-FYVE2-Nb E_142 (F) or GFP-FYVE2-desNb E_142 (G) and stained for AP-2 α subunit (red) or EPS15 (blue). Moderate (arrows) and high-level expression (arrowheads) and EPS15 with AP-2 sequestration are indicated.
Figure 5—figure supplement 1

Endocytic transferrin uptake in GFP-FYVE2-Nb E_142 expressing HeLa SS6 cells .
(A) Schematic representation of the transient transfection and transferrin internalization protocol. (B–F) Maximal intensity projection of a deconvoluted confocal z-stack of fixed HeLa SS6 cells previously transfected with GFP-FYVE2-Nb E_142 (green) and pulsed at 37°C with 25 μg/ml Alexa Fluor 568-labeled transferrin (red) for 5 min after starvation in serum-free medium for 60 min. After permeabilization, cells were stained with an anti-AP-2 α-subunit antibody (blue). A selected but representative stack is shown with color-separated enlargements (C–F) of the region boxed in B shown below. In the presence of GFP-FYVE2-Nb E_142, the grossly enlarged endosomes are apparent, yet transferrin endocytosis still ensues. In some cells, the distended endosomes contain the GFP-fusion protein (and EPS15/R), transferrin and strongly mislocalized AP-2 (arrow) while in other cells, transferrin is located in the lumen of expanded endosomes with only weak AP-2 attachment (arrowheads). Scale bar; 10 μm. (G–I) Quantitation of short-term transferrin uptake. Representative three-dimensional volume snapshots (G) of the same HeLa SS6 cell monolayer in B transiently transfected with GFP-FYVE2-Nb E_142 illustrating the Alexa-labeled transferrin uptake channel (gray scale, (G), segmented (transferrin pesudocolored green, (H) according to the expression pattern of the GFP-FYVE2-Nb E_142 (green, (I) decoy Nb. (J) Numerical comparison of summed transferrin fluorescence in GFP-FYVE2-Nb E_142-negative and -positive segmented populations between various volume bins, analyzed over similar total cellular volumes (5849 endosome objects in 47,366 μm3 for the untransfected and 5841 endosomes in 65,305 μm3 for the Nb E_142-transfected cells). Bars represent the standard error of the mean (SEM).
Figure 6 with 1 supplement

Mitochondrial capture of EPS15 with Akap1-Nb E_142-iRFP.
(A–B') Single confocal sections of basal (A and B) or medial (A' and B') optical planes of fixed HeLa SS6 cells previously transfected with either control Akap1-FRB-iRFP (A–A’) or Akap1-Nb E142-iRFP (B–B’) (pseudocolored red) and stained with an antibody directed against EPS15 (green) and Hoechst DNA dye (blue). The iRFP-expressing transfected cells are outlined (red) and, in medial views, EPS15 assembled in clathrin-coated structures at the plasma membrane is indicated (arrows). (C-D’) Representative single basal confocal sections of fixed HeLa SS6 cells previously transfected with either control Akap1-FRB-iRFP (C–C’) or Akap1-Nb E142-iRFP (D–D’) (pseudocolored blue) and stained with anti-AP-2 α-subunit (red) and anti-EPS15 (green) antibodies. Relative colocalization of AP-2 with EPS15 in absence of Akap1-FRB/Nb E_142-iRFP signal (C’ and D’) is shown. Scale bar; 10 μm.
Figure 6—figure supplement 1
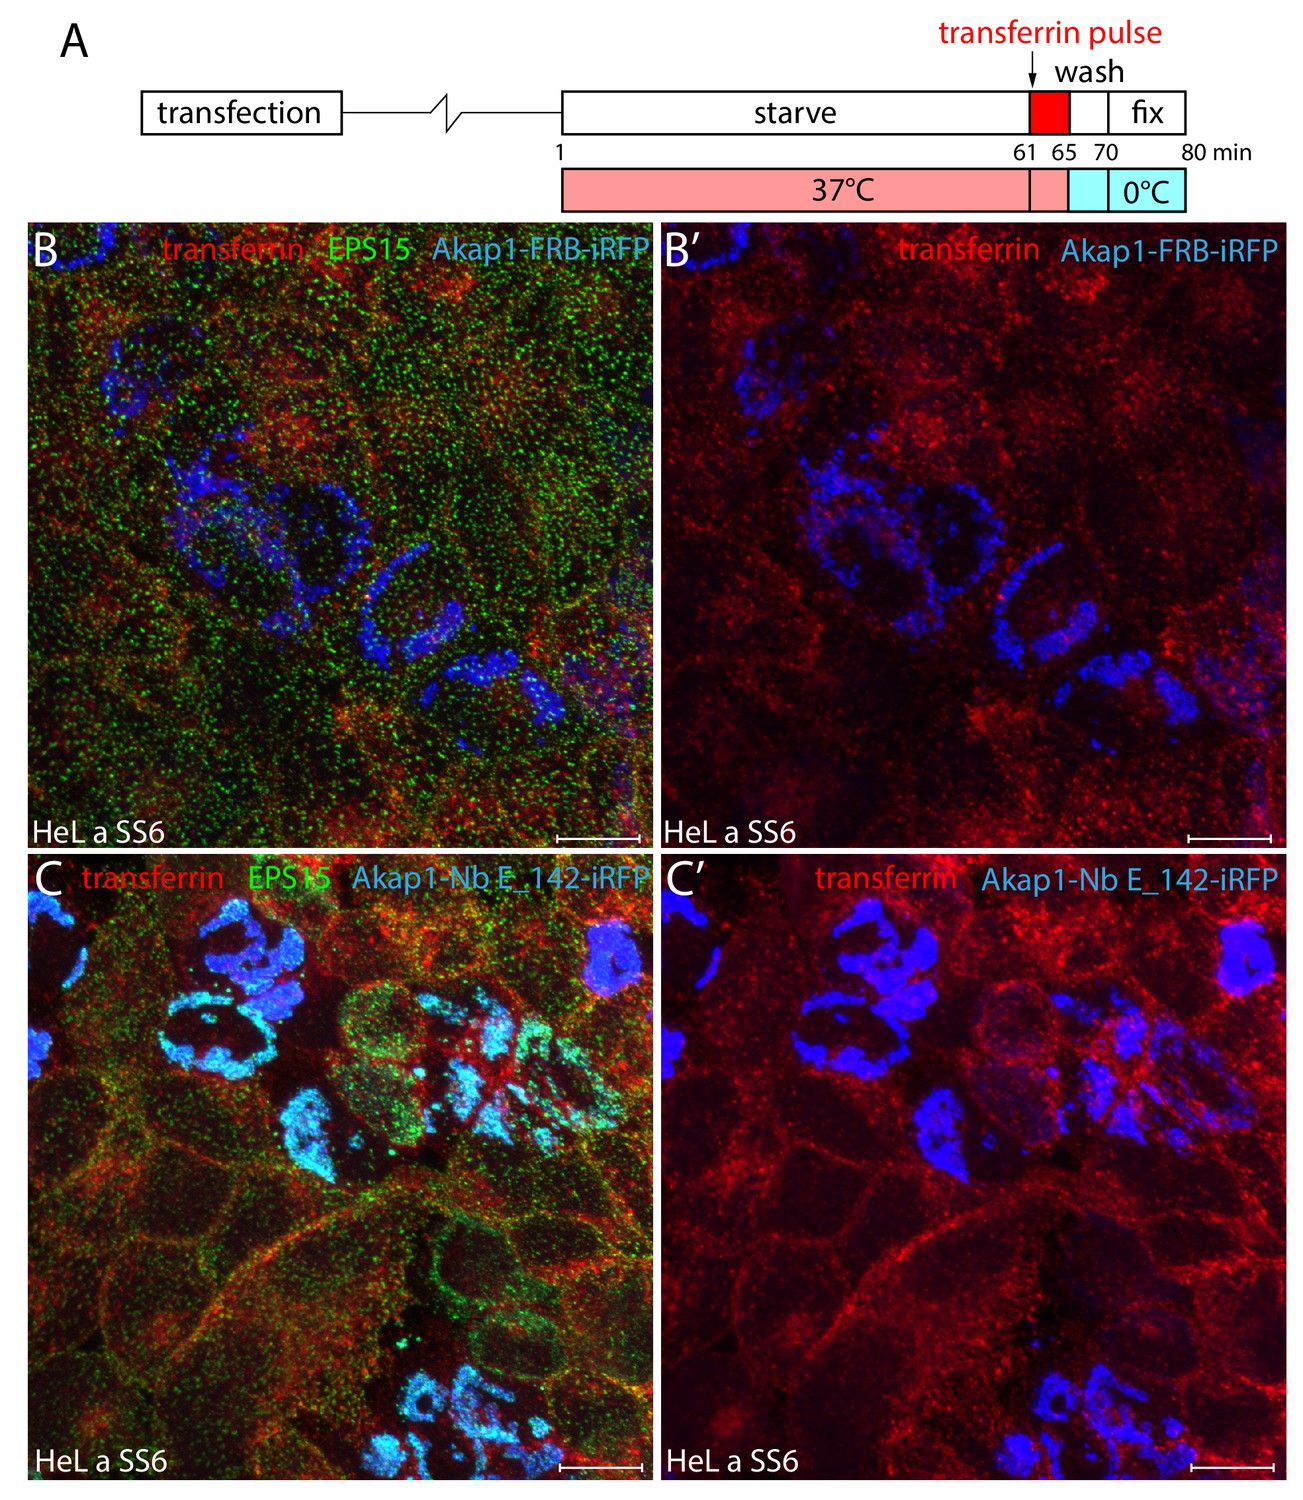
Transferrin internalization in Akap1-Nb E_142-expressing HeLa cells.
(A) Schematic representation of the transient transfection and transferrin internalization protocol. (B–C’) Representative maximal-intensity projections of HeLa SS6 cells transfected with either Akap1-FRB-iRFP (B–B’) or Akap1-Nb E142-iRFP (C–C’) (pseudocolored blue) and then pulsed at 37°C with 25 μg/ml Alexa Fluor 568-labeled transferrin (red) for 5 min after starvation in serum-free medium for 60 min. Following permeabilization, cells were stained with an anti-EPS15 antibody (green). Scale bar; 10 μm.
Figure 7 with 1 supplement
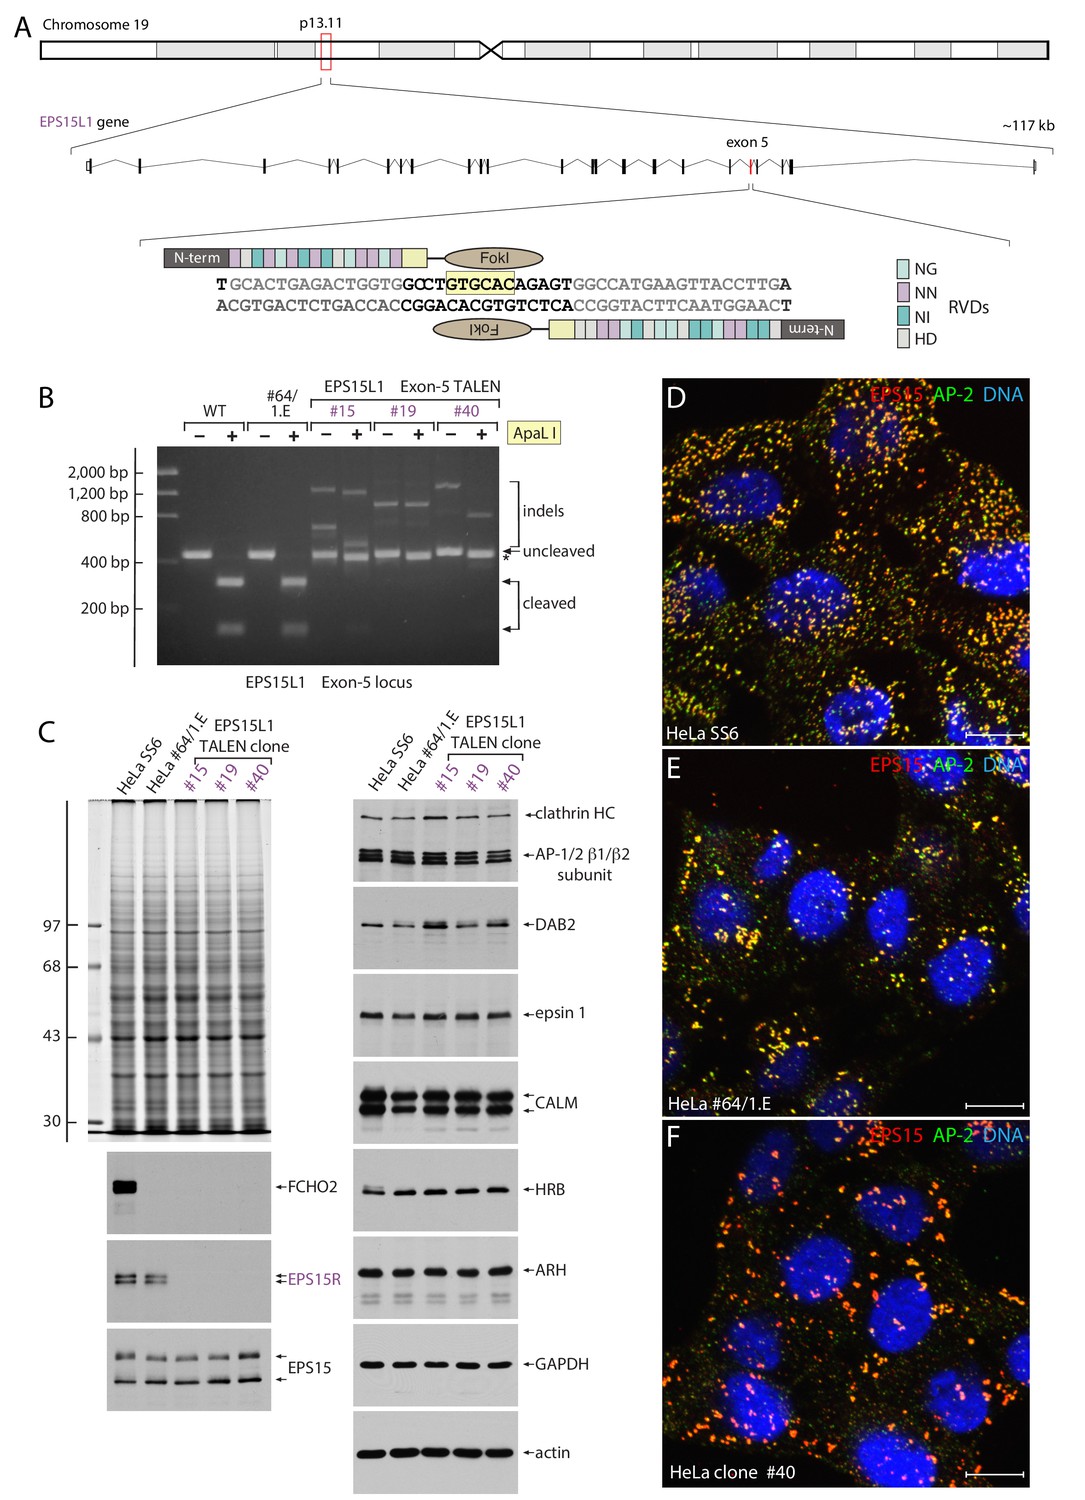
TALEN-mediated generation of FCHO1, FCHO2 and EPS15R triple-null HeLa cells.
(A) Schematic depiction of the location and organization of the EPS15L1 gene and TALEN design strategy. The assembled TALEN component repeat variable diresidues (RVDs) are shown, color-coded on the right. The diagnostic ApaLI restriction site (boxed in pale yellow) is indicated. (B) Agarose gel electrophoresis of EPS15L1 exon 5 PCR products with and without ApaL1 digestion as indicated. Compared with the parental HeLa SS6 and clone #64/1.E cell PCR products, the abnormally large cleavage-resistant indels in the three TALEN clones is indicated. (C) SDS-PAGE and immunoblot analysis of TALEN clones. Whole cell lysates subjected to SDS-PAGE were either stained with Coomassie blue or immunoblotted with the indicated antibodies. Molecular mass standards (in kDa) are shown on the left. (D–F) Representative confocal optical section of the steady-state distribution and morphology of clathrin-coated structures at the surface of parental HeLa SS6 (D), HeLa clone #64/1.E (E) and HeLa clone #40 (F) cells stained with antibodies directed against EPS15 (red), the AP-2 adaptor α subunit (green), and Hoechst DNA dye (blue) as indicated. Scale bar; 10 μm.
Figure 7—figure supplement 1
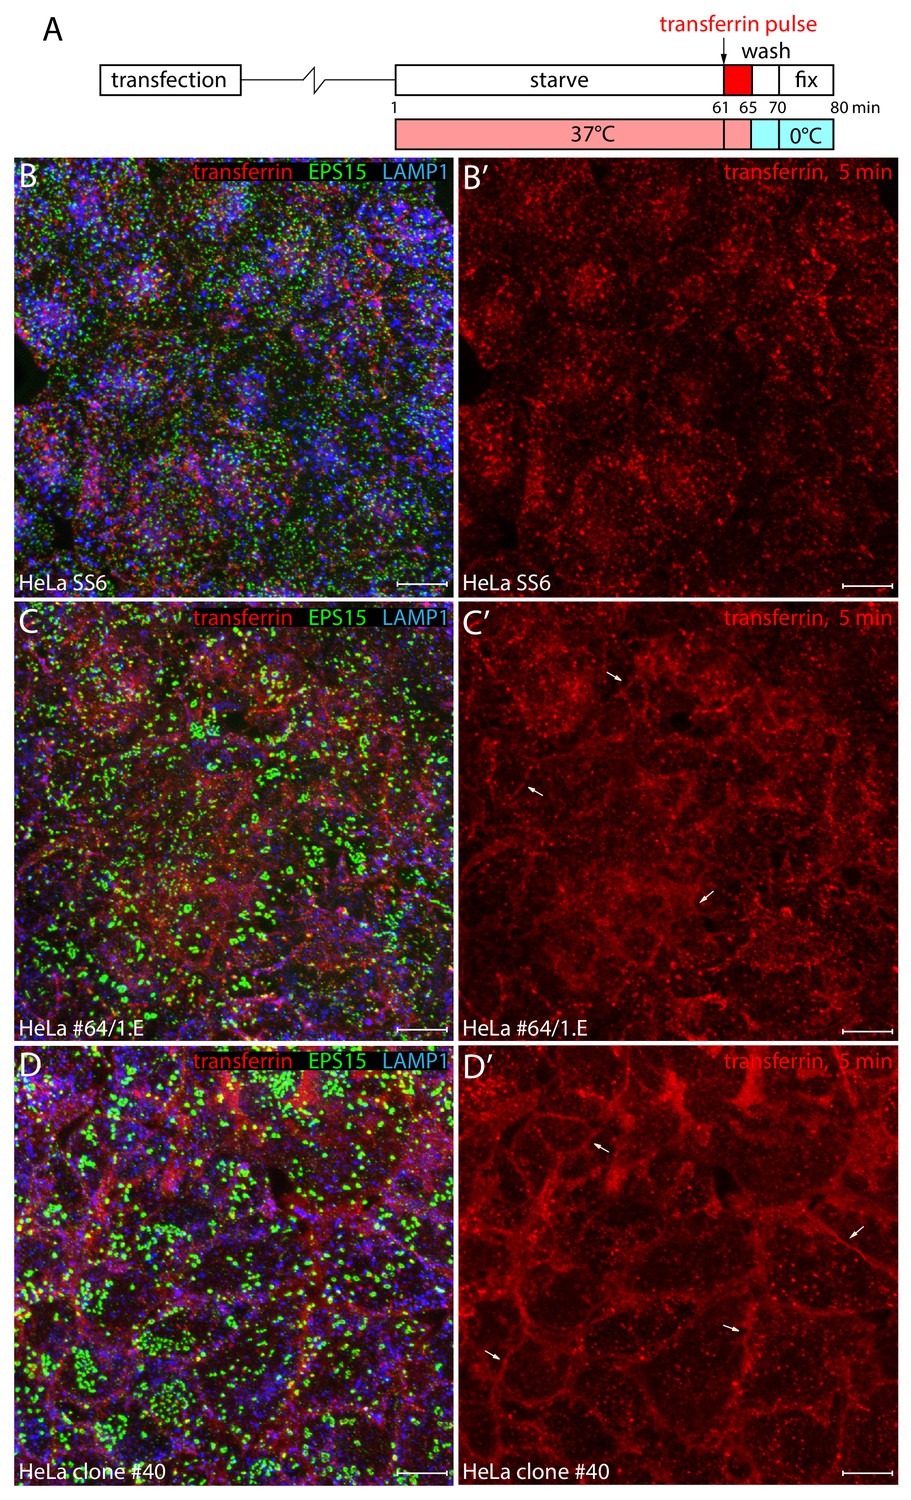
Defective endocytic transferrin internalization in genome-edited HeLa cells.
(A) Schematic representation of the transient transfection and transferrin internalization protocol. (B–D’) Representative maximal intensity projections of confocal z-sacks from confluent monolayers of control HeLa SS6 (B–B'), HeLa #64/1.E (C-C'), or HeLa clone #40 FCHO1/2- and EPS15R-null (D-D') cells pulsed with 25 μg/ml Alexa Fluor 568-transferrin at 37°C for 5 min after starvation in serum-free medium for 60 min. Fixed cells were stained with antibodies against EPS15 (green) and late endosome/lysosomal compartment marker LAMP-1 (blue). The color-separated transferrin (B’–D’) signal is shown on the right. Note the abnormal clathrin-coated structure morphology and distribution in the TALEN-edited cells correlates with reduced transferrin internalization into endosomes and diffuse accumulation of the transferrin receptor at the cell surface (arrows). Scale bar; 10 μm.
Figure 8

Clathrin-coated structure abnormalities in HeLa clone #40 cells lacking FCHO1/2 and EPS15/R.
(A–L) Representative confocal basal optical sections of fixed HeLa clone #40 cells expressing either control Akap1-FRB-iRFP (A and G) or Akap1-Nb E_142-iRFP (B-F, H-L; transfected cells outlined in blue) and stained with antibodies to EPS15 (green) and the AP-2 α subunit (red) or HRB (red), as indicated. Color-separated enlargements of the regions boxed in B and H are shown below, with colocalization of displaced endogenous EPS15 with Nb E_142 (arrowheads) in transfected cells and AP-2 with residual EPS15 or HRB at the plasma membrane (arrows) indicated. Scale bar; 10 μm.
Figure 9 with 1 supplement
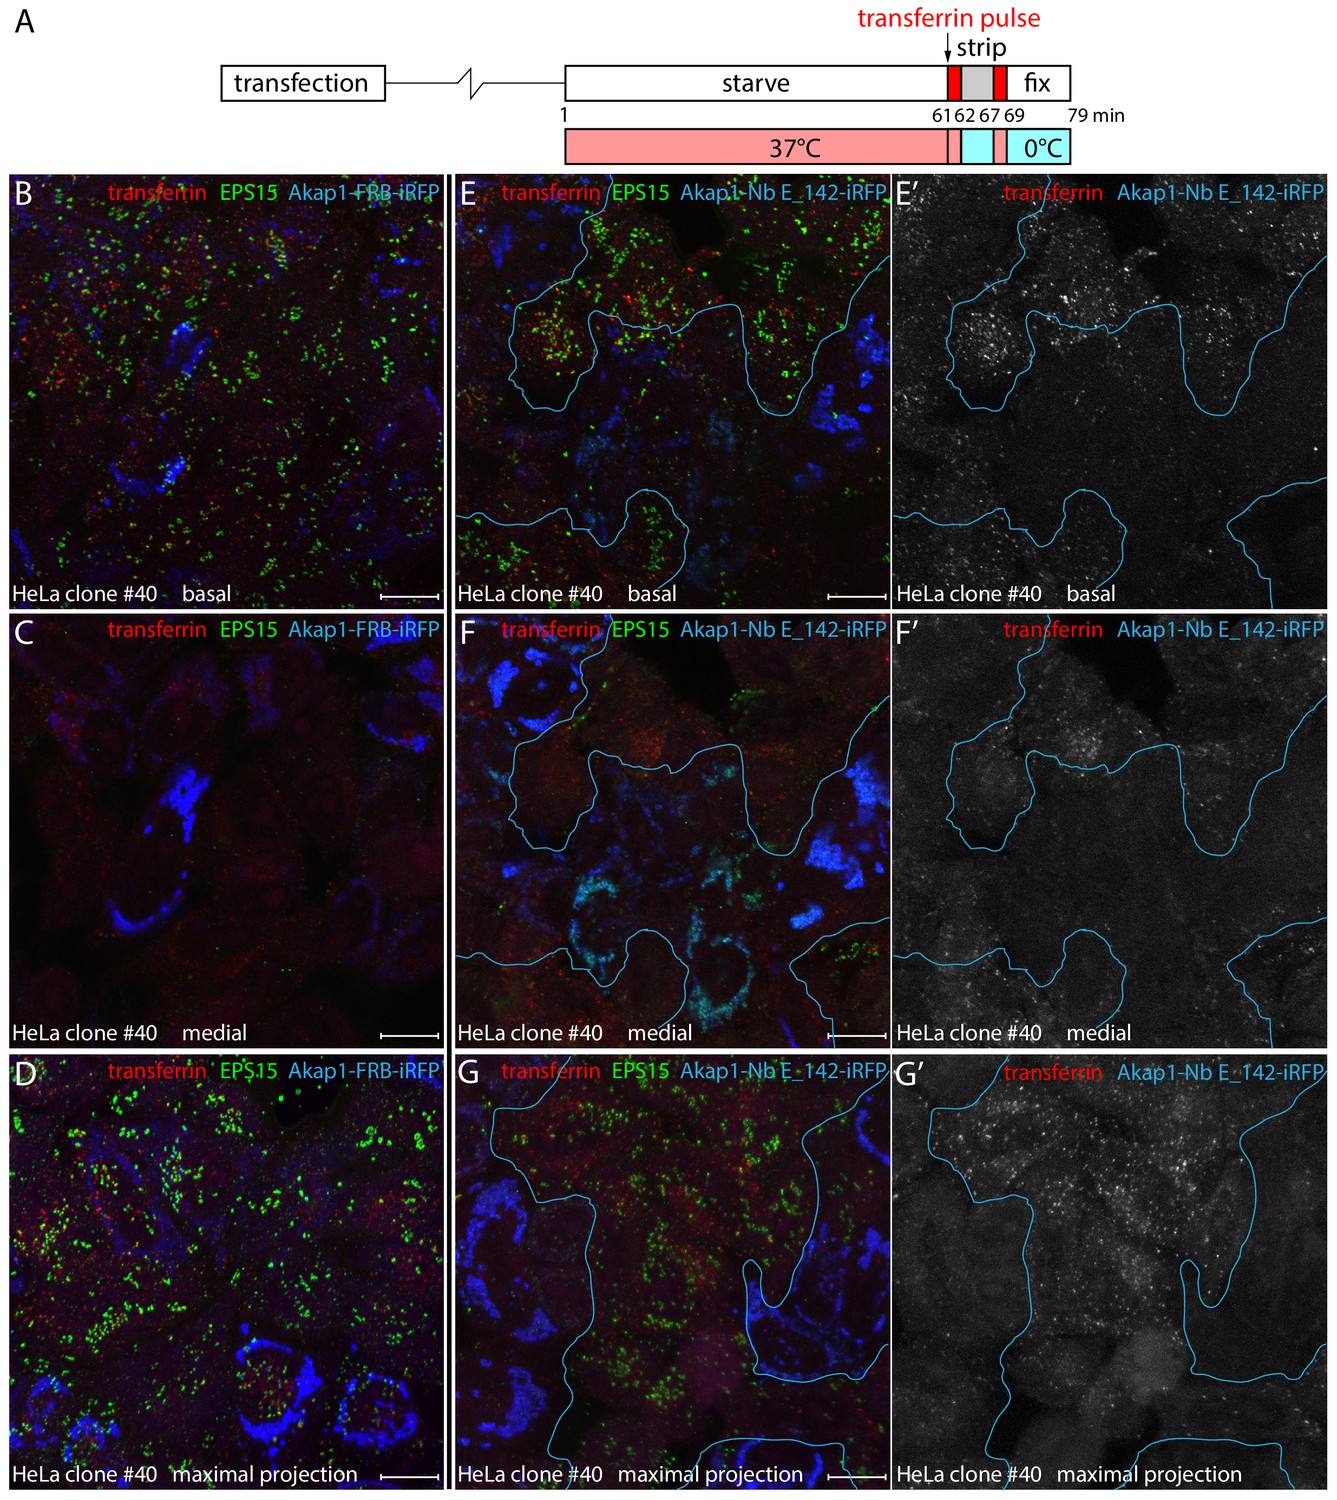
Defective clathrin-mediated endocytosis in Nb E_142-producing clone #40 cells.
(A) Schematic representation of the transient transfection and transferrin internalization protocol. (B-G') Transiently transfected HeLa clone #40 cells expressing either negative control Akap1-FRB-iRFP (B-D) or Akap1-Nb E_142-iRFP (E–G’) were incubated in starvation medium for 60 min before a 2 min pulse of 25 μg/ml Alexa Fluor 568-transferrin (red; white in E’-G’) at 37°C. The cells were then placed on ice and immediately washed three times with acid stripping buffer to remove surface bound transferrin. Then 37°C medium was readded and the cells incubated for a further 2 min at 37°C before fixation on ice. Permeabilized cells were stained with antibodies against EPS15 (green), and confocal optical sections from a basal (B and E) and medial (C and F) plane or a maximal intensity projection of alternative fields (D and G) are shown with the iRFP fusion protein pseudocolored (blue). Isolated grayscale images of the transferrin (red) channel in the Akap1-Nb E_142-iRFP-transfected preparations are shown on the right (E’–G’) to better visualize the defective clathrin-mediated endocytosis. Scale bar; 10 μm.
Figure 9—figure supplement 1

Quantitation of short-pulse transferrin uptake in Akap1-Nb E142-iRFP transfected HeLa clone #40 cells.
(A–C) Representative example of the image segmentation process of a deconvolved maximal-intensity projection image from a field of fixed, transiently-transfected HeLa clone #40 cells following the two-stage (A) transferrin uptake assay. Both the two-color (transferrin, red) and Akap1-Nb E142-iRFP (upon mitochondria and pseudocolored blue) image (B), with transfected cells highlighted in gray, and corresponding binary grayscale images (C) are shown. Numbered segmented regions are differentially color outlined. (D) Quantitation of number of transferrin-positive structures from five independent maximal-intensity projections, binned by area in the transfected HeLa clone #40 cell population. A total of 5133 transferrin-positive structures in the segmented untransfected and 3896 in the NbE_142-transfected HeLa cells were analyzed over similar total cellular areas (26,452 μm2 for the untransfected and 29,061 μm2 for the Nb E_142-transfected cells).
Figure 10
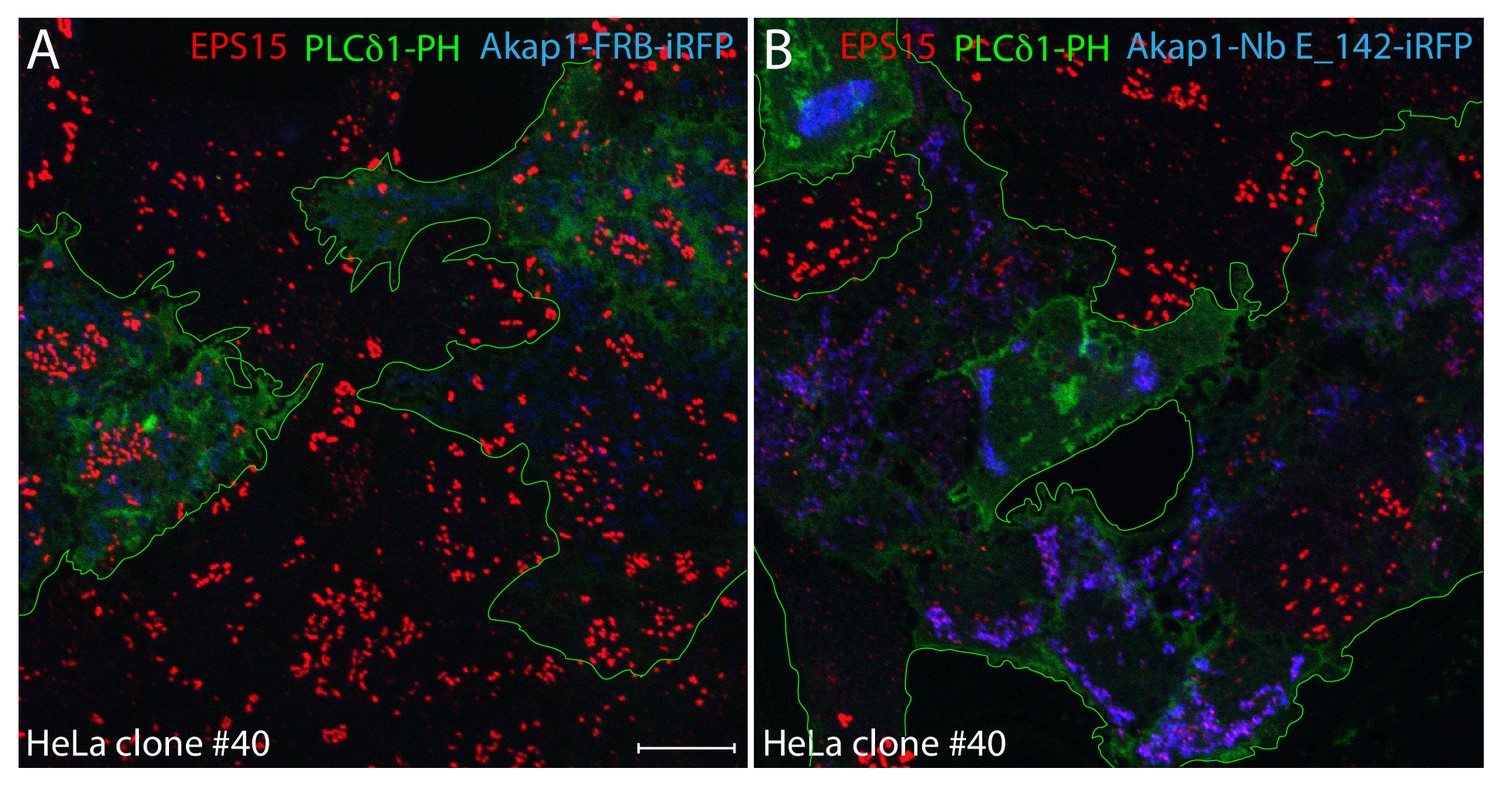
PtdIns(4,5)P2 synthesis in clone #40 cells expressing mitochondria-targeted Nb E_142.
(A–B) Single basal optical sections of HeLa clone #40 cells co-transfected with control Akap1-FRB-iRFP (A) or Akap1-Nb E_142-iRFP (B) (blue) together with PLCδ1 PH-GFP (green; transfected cells outlined). Fixed cells were probed with anti-EPS15 antibodies (red) as indicated. Scale bar; 10 μm.
Figure 11 with 1 supplement
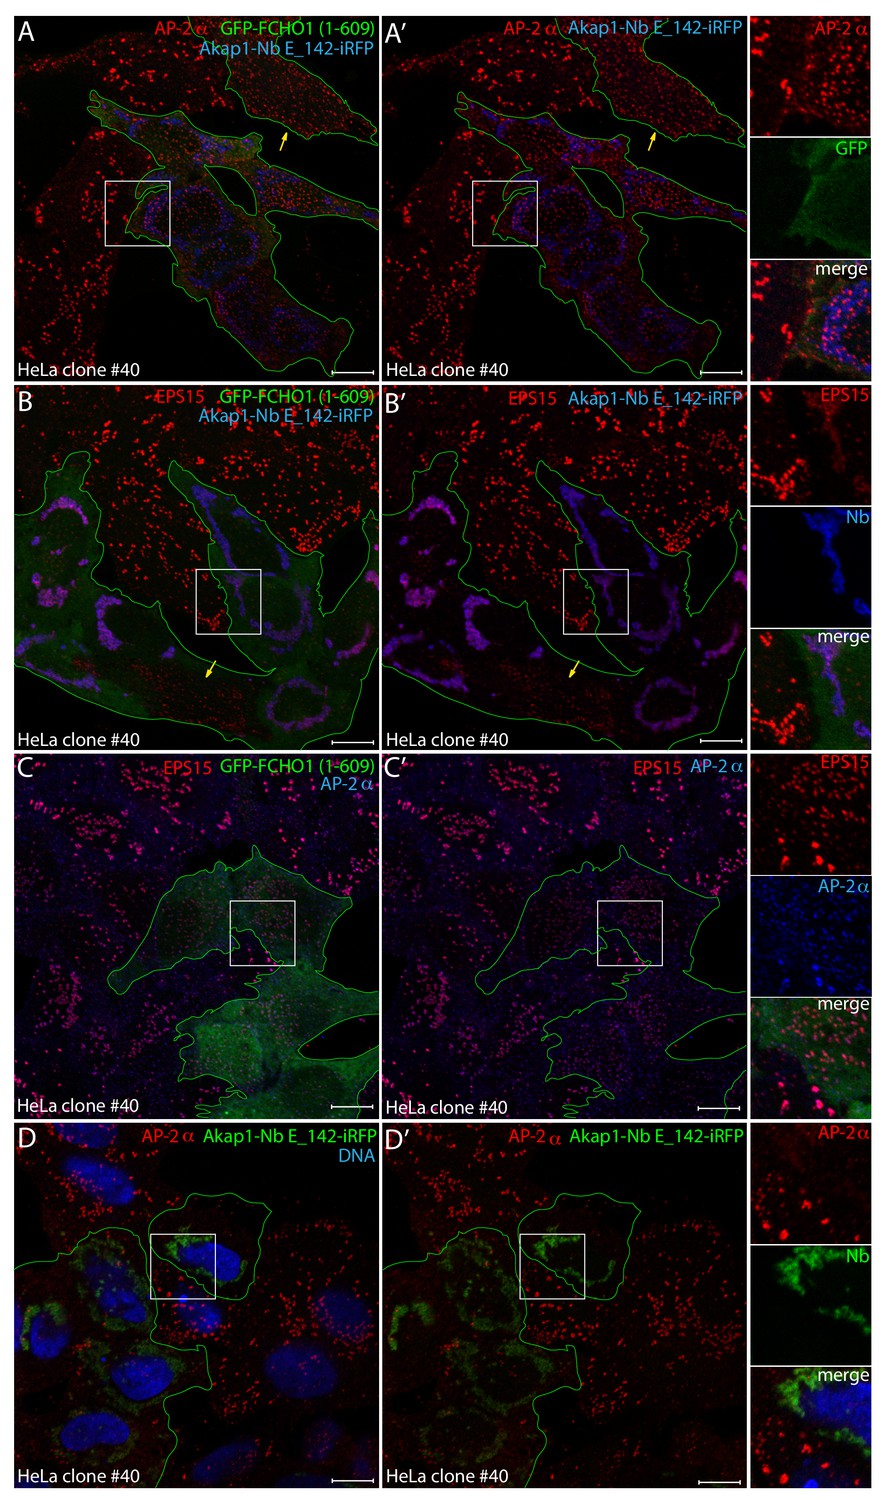
Reconstitution of clathrin-coated structure morphology in clone #40 cells with the FCHO1 disordered interdomain linker.
(A–B’) Representative confocal basal optical sections of HeLa clone #40 cells transiently transfected with both GFP-FCHO1 (1–609)- and Akap1-Nb E_142-iRFP-encoding plasmids before fixation. Permeabilized cells were stained with antibodies directed against either the AP-2 α subunit (red in A) or EPS15 (red in B). Because of diminished GFP expression in these co-transfected cells GFP was enhanced with the GFP-Booster Nb (green; transfected cells outlined), while the iRFP is pseudocolored (blue). Individual cells transfected with the GFP-FCHO1 (1–609) plasmid alone, lacking the mitochondrial iRFP signal, are indicated (yellow arrows), where the morphology of the clathrin-coated structures is rectified by the ectopic FCHO1 interdomain linker. Color-separated enlargements of the regions boxed in A and B are shown on the right. (C–D’) Basal optical sections of HeLa clone #40 cells transfected with either the GFP-FCHO1 (1–609) (C) or Akap1-Nb E_142-iRFP (D) plasmids alone before fixation and permeabilization. The GFP-FCHO1 (1–609)-expressing cells (green; transfected cells outlined) were stained with antibodies directed against the AP-2 α subunit (blue) and EPS15 (red), while the Akap1-Nb E_142-iRF-expressing cells were stained with anti-AP-2 α-subunit antibodies (red) and Hoechst DNA dye (blue) as indicated. Color-separated enlargements of the regions boxed in C and D are shown on the right. Scale bar; 10 μm.
Figure 11—figure supplement 1
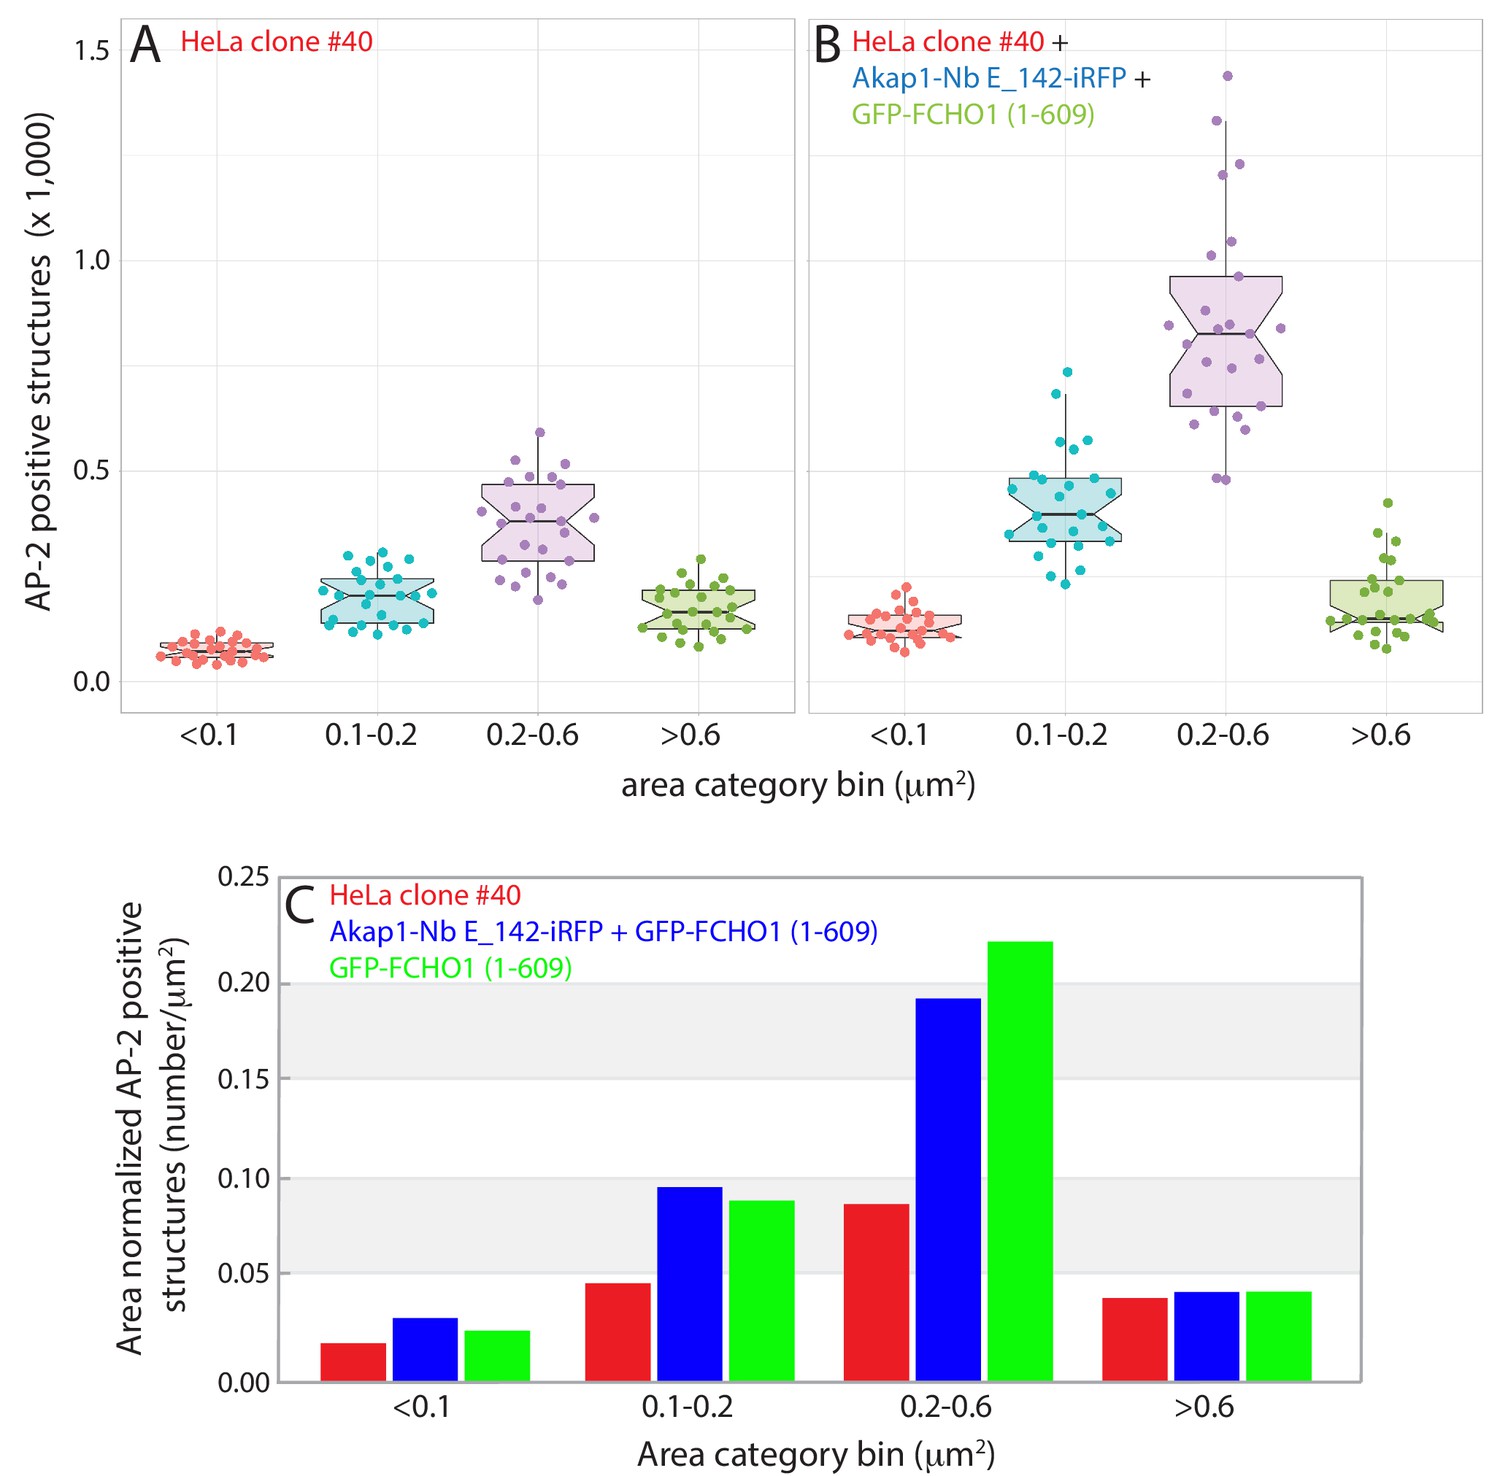
Quantitation of clathrin-coated structure restructuring in GFP-FCHO1 (1–609) transfected HeLa clone #40 cells.
(A–B) Measured distribution of AP-2-positive clathrin-coated structures, binned into the indicated size classes, in populations of HeLa clone #40 cells transiently-co-transfected with Akap1-Nb E142-iRFP and GFP-FCHO1 (1–609). Data separated into untransfected clone #40 cells (A) and dual Akap1-Nb E142-iRFP- and GFP-FCHO1 (1–609)-expressing cells (B). Combined dotplot and boxplot with whisker representation (Postma and Goedhart, 2019), where box notching represent the 95% confidence intervals. Similar total cellular areas (105,891.1 μm2 for the untransfected and 110,788.9 μm2 for the Nb E_142-transfected cells) analyzed. (C) Compared with the HeLa clone #40 cells (red), the altered size distribution of the AP-2-positive puncta in the dual Akap1-Nb E142-iRFP- and GFP-FCHO1 (1–609)-expressing HeLa clone #40 cells is analogous to the shifted distribution of AP-2-positive structures in clone #40 cells expressing only the GFP-FCHO1 (1–609) protein, when normalized to cell area.
Figure 12
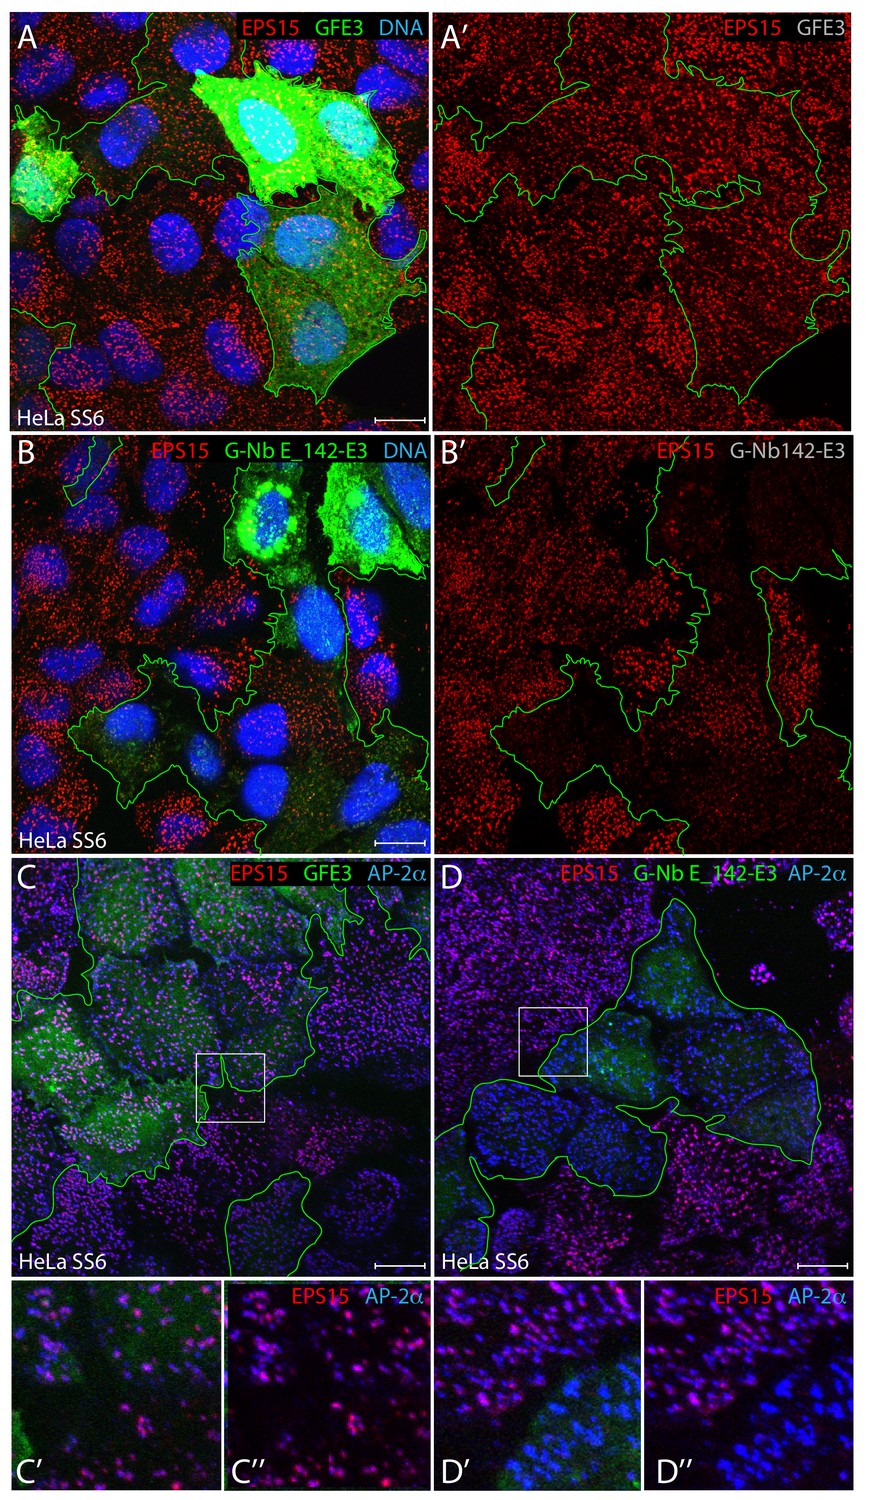
Ubiquitin-dependent degradation of EPS15 utilizing a repurposed E3 ligase.
(A–B’) Representative confocal basal optical sections of HeLa SS6 cells transfected with either GFE3 or G-Nb E_142-E3 plasmids before fixation and staining with anti-EPS15 antibodies (red), and Hoechst DNA dye (blue) as indicated. Cells expressing GFP-tagged E3 ligase fusions are outlined (green), with the separated EPS15 signal (A‘, B’) shown. (C–D’’) Fixed HeLa SS6 cells, transiently XIAP E3 ligase transfected as in A and B above, were stained with antibodies against EPS15 (red) and the AP-2 α subunit (blue) as indicated. Color-separated enlargements (C’–D’’) of the regions boxed in C and D are shown below. Scale bar; 10 μm.
Tables
Key resources table
| Reagent type (species) or resource | Designation | Source or reference | Identifiers | Additional information |
|---|---|---|---|---|
| Gene (Homo sapiens) | EPS15 | UniProt | P42566 | Epidermal growth factor receptor substrate 15 |
| Gene (H. sapiens) | EPS15L1;EPS15R | UniProt | Q9UBC2 | Epidermal growth factor receptor substrate 15R |
| Gene (H. sapiens) | ITSN1 | UniProt | Q15811 | Intersectin-1 |
| Gene (H. sapiens) | FCHO1; KIAA0290 | UniProt | O14526 | FCH domain only protein 1 |
| Gene (H. sapiens) | FCHO2 | UniProt | Q0JRZ9 | FCH domain only protein 2 |
| Strain, strain background (Escherichia coli) | XL1-Blue | Agilent Technologies | #200236 | |
| Strain, strain background (E. coli) | BL21 Codon Plus RIL | Agilent Technologies | #230240 | |
| Strain, strain background (E. coli) | BL21 (DE3) Codon Plus RIPL | Agilent Technologies | #230280 | |
| Cell line (H. sapiens) (female) | HeLa SS6 | Elbashir et al., 2001 | Human cervical carcinoma cell line | |
| Cell line (H. sapiens) (female) | HeLa SS6 clone #64/1.E | Umasankar et al., 2014 | Dual FCHO1- andFCHO2-gene disrupted (null) HeLa SS6 cells | |
| Cell line (H. sapiens) (female) | HeLa SS6 clone #64/1.E #40 (clone #40) | this paper | Triple FCHO1, FCHO2- and EPS15L1-gene disrupted (null) HeLa SS6 cells | |
| Antibody | anti-β-actin; mouse clone mAb C4 | Santa Cruz Biotechnology | sc-47779 | 1:10,000 for immunoblotting |
| Antibody | anti-AP-2 α subunit mouse mAb C-8 | Santa Cruz Biotechnology | sc-17771 | 1:500 for immunoblotting |
| Antibody | anti-AP-2 α subunit; mouse clone mAb AP.6 | F Brodsky Laboratory | PMID: 2574457 | 1:1,000-1:2,000 for immunofluorescence |
| Antibody | anti-ARH rabbit antigen affinity purified pAb | L Traub Laboratory | PMID: 12451172 | 1:2,000 for immunoblotting |
| Antibody | anti-AP-1/2 β1/β2 subunit; rabbit antigen affinity purified pAb GD/1 | L Traub Laboratory | PMID: 7876268 | 1:2,500 for immunoblotting |
| Antibody | anti-CALM; goat affinity purified pAb C-18 | Santa Cruz Biotechnology | sc-6433 | 1:500 for immunoblotting |
| Antibody | anti-clathrin heavy chain; mouse clone mAb TD.1 | F Brodsky Laboratory | PMID: 1547490 | 1:5,000 for immunoblotting |
| Antibody | anti-Dab2 rabbit antigen affinity purified pAb | L Traub Laboratory | PMID: 12234931 | 1:2,500 for immunoblotting |
| Antibody | anti-Disabled-2/p96; mouse mAb 52/p96 | BD Transduction Laboratories | 610464 | 1:1,000 for immunoblotting |
| Antibody | anti-Eps15; rabbit affinity purified pAb C-20 | Santa Cruz Biotechnology | sc-534 | 1:500 for immunoblotting |
| Antibody | anti-Eps15; rabbit antigen affinity purified pAb | E Ungewickell Laboratory | PMID: 12960147 | 1:500-1:2,000 for immunofluorescence |
| Antibody | anti-Eps15R; rabbit mAb ab53006 | AbCAM | EP1147Y | 1:5,000 for immunoblotting |
| Antibody | anti-epsin 1; rabbit antigen affinity piurified pAb | L Traub Laboratory | PMID: 10692452 | 1:1,000 for immunoblotting |
| Antibody | anti-FCHO1; rabbit antigen affinity purified pAb | L Traub Laboratory | 1:2,500 for immunoblotting | |
| Antibody | anti-FCHO2; rabbit antigen affinity purified pAb | Novus Biologicals | NBP2-32694 | 1:700 for immunoblotting |
| Antibody | anti-GAPDH; mouse mAb | USP Bio | Y1041 | 1:3,500 for immunoblotting |
| Antibody | anti-GFP; antigen affinity purified pAb | P Hanson Laboratory | 1:1,000 for immunoblotting | |
| Antibody | anti-GFP-Booster; llama VHH Nb | Chromotek | gba488-100 | 1:1,000-1:2000 for immunofluorescence |
| Antibody | anti-Hrb;RIP;Rab; goat affinity purified pAb | Santa Cruz Biotechnology | sc-1424 | 1:1,000 for immunoblotting |
| Antibody | anti-Hrb; AGFG1; mouse clone mAb H-2 | Santa Cruz Biotechnology | sc-166651 | 1:1,000-1:2,000 for immunofluorescence |
| Antibody | anti-intersectin 1; mouse clone mAb 29 | BD Transduction Laboratories | 611574 | 1:250 for immunoblotting |
| Antibody | anti-LAMP-1; mouse clone mAb 1D4B | Developmental Studies Hybridoma Bank | AB_528127 | 1:1,000-1:2,000 for immunofluorescence |
| Antibody | anti-mNG; mouse clone mAb 32F6 | Chromotek | 32f6-100 | 1:1,000 for immunoblotting |
| Sequence -based reagent | pGEX-5X-1 | Pharmacia | ||
| Sequence-based reagent | pGEX-4T-1 | Pharmacia | ||
| Sequence -based reagent | pMW172 | Michael Way | ||
| Sequence -based reagent | pMECS | NSF/VIB | ||
| Sequence-based reagent | pHEN6c | NSF/VIB | ||
| Sequence -based reagent | pmNG-C1 | this paper | mNG coding region replacing GFP in pEGFP-C1 vector | |
| Sequence-based reagent | pEGFP-FYVE2 | this paper | insertion of Nb E_142 following FYVE2 tandem | |
| Sequence- based reagent | pEGFP-FYVE2-Nb E_142 | this paper | introduction of 3maj destabilizing mutations into Nb E_142 | |
| Sequence -based reagent | pEGFP-FYVE2-Nb dE_142 | this paper | ||
| Sequence -based reagent | piRFP-N1-Akap1-FRB | |||
| Sequence -based reagent | piRFP-N1-Akap1-Nb E_142 | this paper | replacement of control FRB module with Nb E_142 | |
| Sequence -based reagent | pEGFP-FCHO1 (1–609) | Umasankar et al., 2014 | ||
| Sequence-based reagent | PCR primer sets | this paper | see Table 1 for complete PCR primer set details | |
| Peptide, recombinant protein | bovine serum albumin (BSA) | Pierce | 23209 | |
| Peptide, recombinant protein | glutathione | Sigma-Aldrich | G4251-1G | |
| Commercial assay or kit | QuikChange site-directed mutageneisis kit | Agilent Technologies | 200523 | |
| Chemical compound, drug | Glutathione- Spharose 4B | GE Healthscience | 17075605 | |
| Chemical compound, drug | Ni-NTA-agarose | MC Labs | NINTA-300 | |
| Chemical compound, drug | Normal goat serum | Sigma-Aldrich | 46767 | |
| Chemical compound, drug | Alexa Fluor 568-transferrin (H. sapiens) | Invitrogen; ThermoFisher Scientific | T23365 | |
| Chemical compound, drug | Saponin | Sigma-Aldrich | S7900 | |
| Chemical compound, drug | Lipofectamine 2000 | Invitrogen;ThermoFisher Scientific | 11668027 | |
| Software, algorithm | FV1-ASW 4.1 software | Olympus | ||
| Software, algorithm | ImageJ | Rueden et al., 2017 | ||
| Software, algorithm | Fiji | Schindelin et al., 2012 | ||
| Software, algorithm | NIS Elements 5.11.01 analysis package | Nikon |
Table 1
PCR primer sets.
https://doi.org/10.7554/eLife.41768.021| Primer pair | Plasmid | Method | FORWARD 5’ sequence | REVERSE 3’ sequence |
|---|---|---|---|---|
| HsEPS15 315- >*FORWARD QC/HSEPS15 315- >*REVERSE QC | Hs EPS15 (1-314) pGEX-5X-1 | QuikChange mutagenesis | 5’-ATGATTCCACCATCAGACA GGGCCTGATTACAAAAGAAC ATCATAGG-3’ | 5’-CCTATGATGTTCTTTTGTAATC AGGCCCTGTCTGATGGTGGAAT CAT-3’ |
| EH2 W218* QC FORWARD/EH2 W218* QC REVERSE | Hs EPS15 (1-217) pGEX-5X-1 | QuikChange mutagenesis | 5’-CCATCTAAGAGAAAAACG TGAGTTGTATCCCCTGCAG-3’ | 5’-CTGCAGGGGATACAACTCAC GTTTTTCTCTTAGATGG-3’ |
| EH1 L110* QC FORWARD/EH1 L110* QC REVERSE | Hs EPS15 (1-109) pGEX-5X-1 | QuikChange mutagenesis | 5’-CCAAGATTTCATGATACCA GTAGTCCTTAACTAATCAGTG GAACCTCTGC-3’ | 5’-GCAGAGGTTCCACTGATTAGT TAAGGACTACTGGTATCATGAAA TCTTGG-3’ |
| Hs EPS15 Pro121 Phusion FORWARD/pGEX-5X-1 BamHI Phusion REVERSE | Hs EPS15 (121-314) pGEX-4T-1 | Phusion mutagenesis | 5’-phos-CCATGGGCTGTA AAACCTGAAGATAAGG-3’ | 5’-phos-GATCCCACGACCTT CGATCAGATC-3’ |
| EPS15 W57A QC FORWARD/EPS15 W57A QC REVERSE | Hs EPS15 (1–107/W57A) pGEX-5X-1 | QuikChange mutagenesis | 5’-GACTTGATACTTGGAA AGATTGCGGATTTAGCCGAC ACAGATGGC-3’ | 5’-GCCATCTGTGTCGGCTAA ATCCGCAATCTTTCCAAGTATCA AGTC-3’ |
| Hs EPS15L1 EH1 BamHI-Met1 FORWARD/Hs EPS15L1 EH3 T366* XhoI REVERSE | Hs EPS15R (1-365) pGEX-5X-1 | Directional cloning | 5’-GTGGGATCCTCACCAT GGCGGCGCCGCTCATCC-3’ | 5’-ATACTCGAGTTAGCCTCT CTCCGAAGGCGGGACCATGTCC −3’ |
| Primer A6E/Primer PCMF | Nb E_3-His6 pHEN6c | Directional cloning | 5’-GATGTGCAGCTGCAG GAGTCTGGRGGAGG-3’ | 5’-CTAGTGCGGCCGCTGAG GAGACGGTGACCTGGGT-3’ |
| Primer A6E/Primer PCMF | Nb E-_142-His6 pHEN6c | Directional cloning | 5’-GATGTGCAGCTGCAG GAGTCTGGRGGAGG-3’ | 5’-CTAGTGCGGCCGCTGAG GAGACGGTGACCTGGGT-3’ |
| Primer A6E/Primer PCMF | Nb E_180-His6 pHEN6c | Directional cloning | 5’-GATGTGCAGCTGCAG GAGTCTGGRGGAGG-3’ | 5’-CTAGTGCGGCCGCTGAG GAGACGGTGACCTGGGT-3’ |
| NPF-APA QC primer FORWARD/NPF- APA QC primer REVERSE | Nb E-_142 (NPF APA)-His6 pHEN6c | QuikChange mutagenesis | 5’-TGTAATATGAAGAGCAT GGCCCCCGCCAGACGGTAT GACGTGTGG-3’ | 5’-CCACACGTCATACCGTCT GGCGGGGGCCATGCTCTTCATA TTACA-3’ |
| AgeI mNeonGreen 5' FORWARD/ XhoI mNeonGreen 3' REVERSE | mNG pmNG-C1 | Directional cloning | 5’-GCGCTACCGGTCGCCACC ATGGTGAGCAAGGGCGAGG AGG-3’ | 5’-TTGAGCTCGAGATCTGAGTC CGGACTTGTACAGCTCGTCCAT GCCCATCAC-3’ |
| Nb 5’ BglII + Gly4 FORWARD/Nb 3’ HindIII REVERSE | mNG-Nb E_3 pmNG-C1 | Directional cloning | 5’-ATCAGATCTGGAGGTGGA GGTCAGGTGCAGCTGCAGG AG-3’ | 5’-CTAAAGCTTTTATGAGGAGA CGGTGACCTGGG-3’ |
| Nb 5’ BglII + Gly4 FORWARD/Nb 3’ HindIII REVERSE | mNG-Nb E_142 pmNG-C1 | Directional cloning | 5’-ATCAGATCTGGAGGTGGA GGTCAGGTGCAGCTGCAGG AG-3’ | 5’-CTAAAGCTTTTATGAGGAGA CGGTGACCTGGG-3’ |
| CORRECT_3 × 1–2 Nb E_142 BmsBI + Gly6Ser2 FORWARD/ | mNG-Nb E_142 × 3 pmNG-C1 | Directional cloning | 5’-CACCGTCTCCTCATCCGG AGGTTCAGGAGGTTCCGGG GGCCAGGTGCAGCTGCAGG AG-3’ | 5’-GCCGTCGACTGAGGAGACG GTGACCTG-3’ |
| 3 × 2–3 Nb E_142 SalI + Gly6Ser2 FORWARD/BamHI 3x EPS142 Nb REVERSE for mNG-C1 | mNG-Nb E_142 × 3 pmNG-C1 | Directional cloning | 5’-CTCAGTCGACGGCGGATC TGGTGGGAGTGGGGGACAG GTGCAGCTGCAGGAGTC-3’ | 5’-GGTGGATCCTTATGAGGAGA CGGTGACCTG-3’ |
| Nb 5’ BglII + Gly4 FORWARD/2X Nb E_142 QC primer HindIII-SalI REVERSE | mNG-Nb E_142 × 3 pmNG-C1 | Directional cloning | 5’-ATCAGATCTGGAGGTGGA GGTCAGGTGCAGCTGCAGG AG-3’ | 5’-CCGCCGTCGACTGCACGAAA TTCGAAGCTTGAGGAGACGGTG ACCTGGGT-3’ |
| QC GFP-FYVE2- UbDelGG EcoRI sto/QC GFP- FYVE2-UbDelGG EcoRI sto | GFP-FYVE2 pEGFP-C1 | QuikChange mutagenesis | 5’-GAGCAGCTGAACAAGAAG GCATAATTCATGCAGATCTTT GTG-3’ | 5’-CACAAAGATCTGCATGAATTA TGCCTTCTTGTTCAGCTGCTC-3’ |
| VHH Nb EcoRI +Gly4 forward/Anti-Eps15 VHH Nb ApaI reverse | GFP-FYVE2-Nb E_142 pEGFP-C1 | Directional cloning | 5’-ATCGAATTCGGAGGTG GAGGTCAGGTGCAGCTGCA GGAG-3’ | 5’-ACTGGGCCCTTATGAGGA GACGGTGACCTG-3' |
| VHH Nb EcoRI +Gly4 forward/3 maj Anti-Eps15 VHH Nb ApaI reverse | GFP-FYVE2-dNb E_142 pEGFP-C1 | Directional cloning | 5’-ATCGAATTCGGAGGTGGA GGTCAGGTGCAGCTGCAGG AG-3' | 5’-ACTGGGCCCTTAGAAGGA GACGGTGACCTG-3’ |
| Nb + NLS C-term Phusion FORWARD/Nb C- term Phusion REVERSE | GFP-Nb E_142- SV40 NLS pEGFP-C1 | Phusion mutagenesis | 5’-phos-GGACCCAAGAAGAAA CGGAAGGTGTGAGGGCCCG GGATCCACCG-3’ | 5’-phos-GCGGCCGCCTGAGGA GACGGTGACCTGGGTCC-3’ |
| MfeI EPS Nb142 FORWARD for GNbE3/BglII EPS15 Nb142 REVERSE for GNbE3 | G-Nb E_142-E3 pCAG_EGFP | Directional cloning | 5’-TCGAGCAATTGATGGCAGA AGTTCAGGTGCAGCTGCAGG AG-3’ | 5’-GGTAAGATCTTCCTGAGGAG ACGGTGACCTGGGTCCCCTGG CCC-3’ |
Table 2
Primary antibodies.
https://doi.org/10.7554/eLife.41768.022| Antigen | Species | Designation/clone | Catalogue number | Supplier/Source | Application |
|---|---|---|---|---|---|
| β-actin | mouse | mAb C4 | sc-47778 | Santa Cruz Biotechnology | immunoblot |
| AP-2 α subunit | mouse | mAb C-8 | sc-17771 | Santa Cruz Biotechnology | immunoblot |
| AP-2 α subunit | mouse | mAb AP.6 | — | Frances Brodsky | immunofluorescence |
| ARH | rabbit | antigen affinity purified pAb | — | Traub laboratory | immunoblot |
| AP-1/2 β1/β2 subunit | rabbit | antigen affinity purified pAb GD/1 | — | Traub laboratory | immunoblot |
| CALM | goat | affinity purified pAb C-18 | sc-6433 | Santa Cruz Biotechnology | |
| clathrin heavy chain | mouse | mAb TD.1 | — | Frances Brodsky | immunoblot |
| Dab2 | rabbit | antigen affinity purified pAb | — | Traub laboratory | immunoblot |
| Disabled-2/p96 | mouse | mAb 52/p96 | 610464 | BD Transduction Laboratories | immunoblot |
| Eps15 | rabbit | affinity purified pAb C-20 | sc-534 | Santa Cruz Biotechnology | immunoblot |
| Eps15 | rabbit | antigen affinity purified pAb | — | Ernst Ungewickell | immuno fluorescence |
| Eps15R | rabbit | mAb ab53006 | EP1147Y | AbCAM | immunoblot |
| epsin 1 | rabbit | antigen affinity purified pAb | — | Traub laboratory | immunoblot |
| FCHO1 | rabbit | antigen affinity purified pAb | — | Traub laboratory | immunoblot |
| FCHO2 | rabbit | antigen affinity purified pAb | NBP2-32694 | Novus Biologicals | immunoblot |
| GAPDH | mouse | mAb | Y1041 | UBP Bio | immunoblot |
| GFP | rabbit | antigen affinity purified pAb | — | Phyllis Hanson | immunoblot |
| GFP-Booster | llama | anti-GFP Nb Atto 488 conjugate | gba488-100 | Chromotek | immunofluorescence |
| Hrb/RIP/Rab | goat | affinity purified pAb C-19 | sc-1424 | Santa Cruz Biotechnology | immunoblot |
| Hrb/AGFG1 | mouse | mAb H-2 | sc-166651 | Santa Cruz Biotechnology | immunofluorescence |
| Intersectin 1 | mouse | mAb clone 29 | 611574 | BD Transduction Laboratories | immunoblot |
| LAMP-1 | mouse | mAb clone 1D4B | AB_528127 | Developmental Studies Hybridoma Bank | immunoblot |
| mNG | mouse | mAb clone 32F6 | 32f6-100 | Chromotek | immunoblot |
Additional files
-
Transparent reporting form
- https://doi.org/10.7554/eLife.41768.023
Download links
A two-part list of links to download the article, or parts of the article, in various formats.
Downloads (link to download the article as PDF)
Open citations (links to open the citations from this article in various online reference manager services)
Cite this article (links to download the citations from this article in formats compatible with various reference manager tools)
A nanobody-based molecular toolkit provides new mechanistic insight into clathrin-coat initiation
eLife 8:e41768.
https://doi.org/10.7554/eLife.41768


