GPCR signaling inhibits mTORC1 via PKA phosphorylation of Raptor
- University of Texas Southwestern Medical Center, United States
- University of California, San Diego, United States
- Moores Cancer Center, University of California San Diego, United States
- Children's Hospital and Institutes of Biomedical Sciences, Fudan University, China
- University of California San Diego, United States
Figures
Figure 1 with 2 supplements
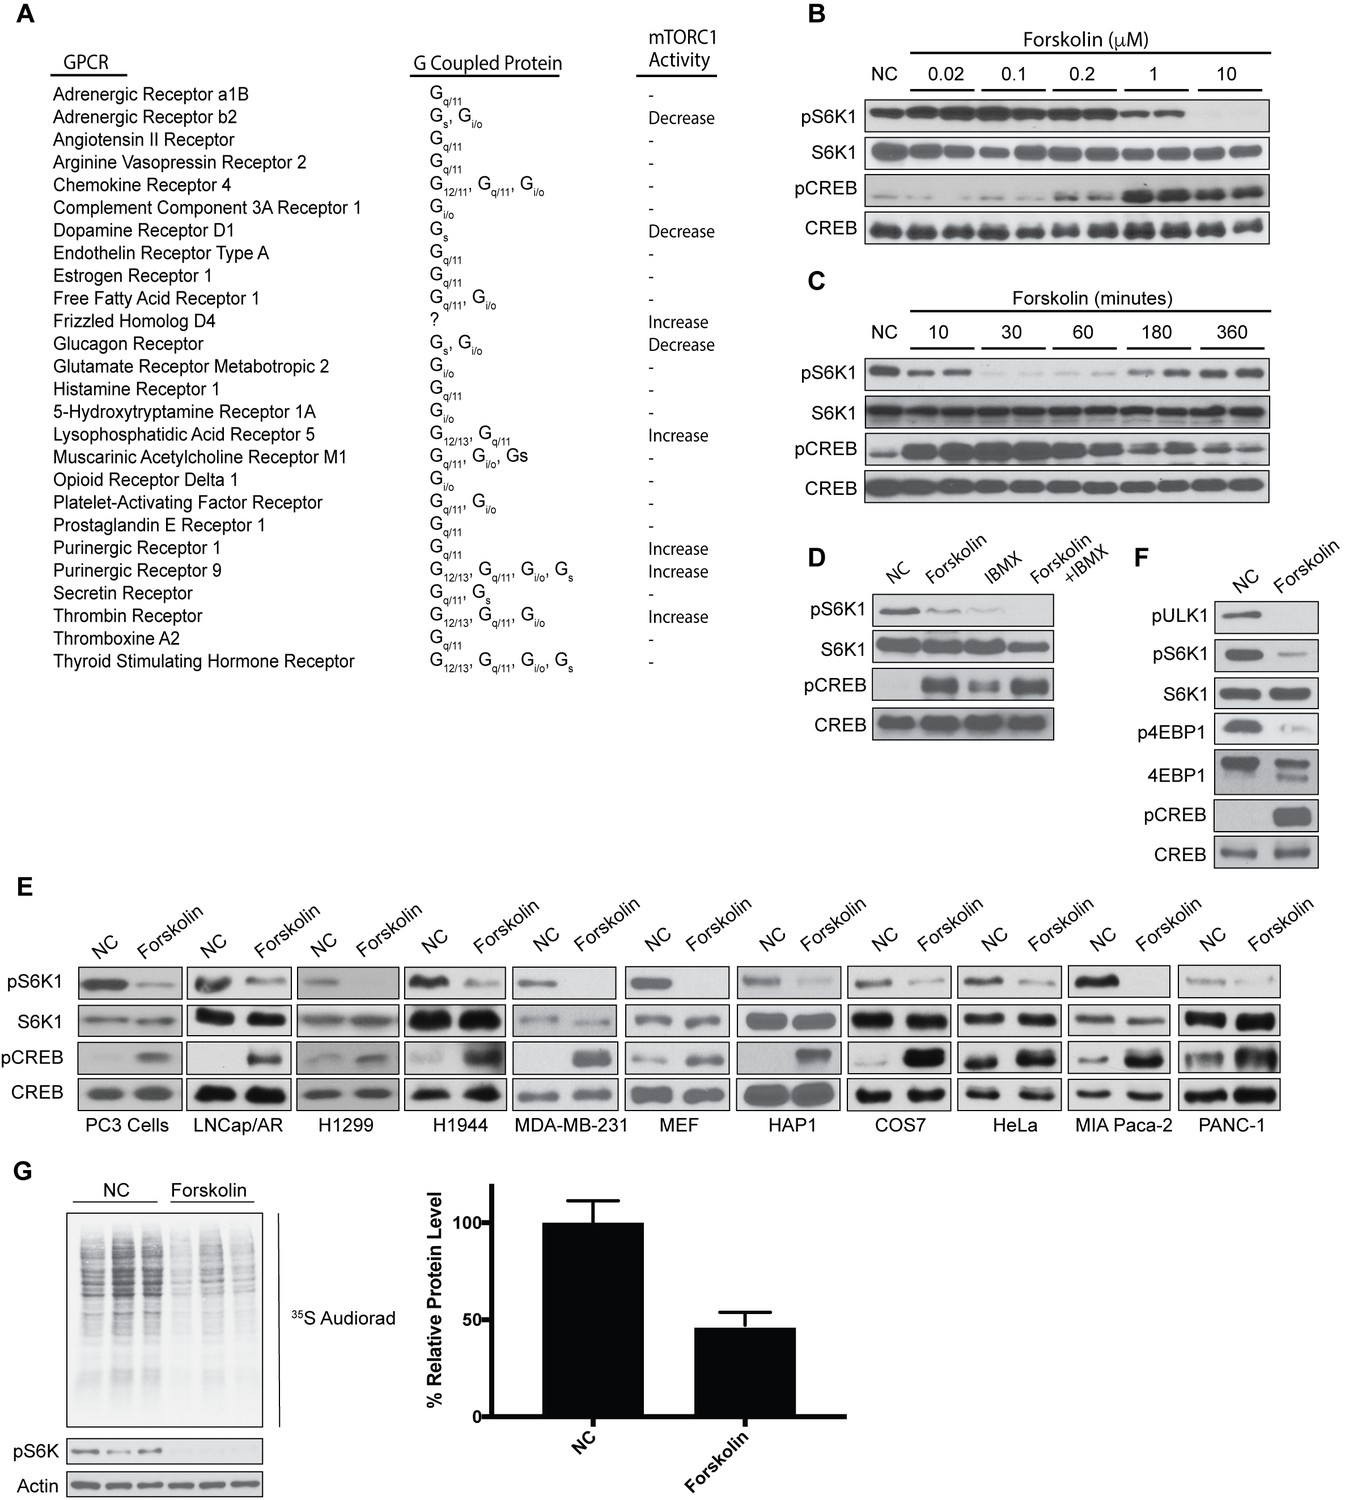
Increased levels of cAMP inhibit mTORC1 activation and global protein synthesis.
(A) Overexpression screen identifying GPCRs involved in mTORC1 regulation. GPCRs were overexpressed in human embryonic kidney 293A (HEK293A) cells, and 24 h later mTORC1 activity was analyzed by protein immunoblotting for the phosphorylation status of S6K1 at Thr 389. mTORC1 activity was visualized to be elevated (Increase), inhibited (Decrease), or unchanged (-). (B) Forskolin inhibits mTORC1 in a dose-dependent manner. HEK293A cells were treated with increasing concentrations (μM) of forskolin for 1 h and mTORC1 activity was analyzed by protein immunoblotting for the phosphorylation status of S6K1 (pS6K1) at Thr 389. Phosphorylation of CREB (pCREB) at Ser 133 was used as a positive control for the increase of cAMP after forskolin stimulation. Both S6K1 and CREB were used as lysate loading controls. NC denotes normal conditions. (C) Forskolin rapidly and transiently inhibits mTORC1. HEK293A cells were treated with 10 μM forskolin for the indicated time (min) and mTORC1 activity, CREB phosphorylation, and loading controls were analyzed as described in (B). (D) IBMX treatment inhibits mTORC1. Mouse embryonic fibroblasts (MEFs) were treated with 10 μM forskolin or with 10 μM 3-isobutyl-1-methylxanthine (IBMX) alone or in combination for 1 h and mTORC1 activity, CREB phosphorylation, and loading controls were analyzed as described in (B). (E) Forskolin inhibits mTORC1 in multiple cell lines. PC3, LNcap/AR, H1299, H1944, MDA-MB-231, MEF, HAP1, COS7, HeLa, MIA Paca-2, and PANC-1 were treated with or without 10 μM forskolin for 1 h and mTORC1 activity, CREB phosphorylation, and loading controls were analyzed as described in (B). (F) Forskolin inhibits phosphorylation of multiple mTORC1 substrates. HEK293A cells were treated with 10 μM forskolin for 1 h and mTORC1 activity was analyzed by protein immunoblotting for the phosphorylation status of S6K1 (pS6K1) at Thr 389, the phosphorylation status of ULK1 (pULK1) at Ser 758 and the mobility shift of 4EBP1, indicating 4EBP1 phosphorylation. CREB phosphorylation, and loading controls were analyzed as described in (B). (G) Forskolin inhibits global protein translation. HEK293A cells were incubated in Met and Cys-free DMEM with or without 10 uM of forskolin for 50 min. 35S-labeled L-Met and L-Cys mix was then added to the medium for 10 min and new synthesized proteins were detected by autoradiography (left). Densitometry analysis of each lane as well as actin was performed using ImageJ. Quantification is shown as the decrease of global protein synthesis between normal culture conditions and forskolin treatment. Three independent experiments comparing normal conditions (NC) and forskolin treatment (p=0.0159, t-test, error bars were calculated using SEM).
Figure 1—figure supplement 1
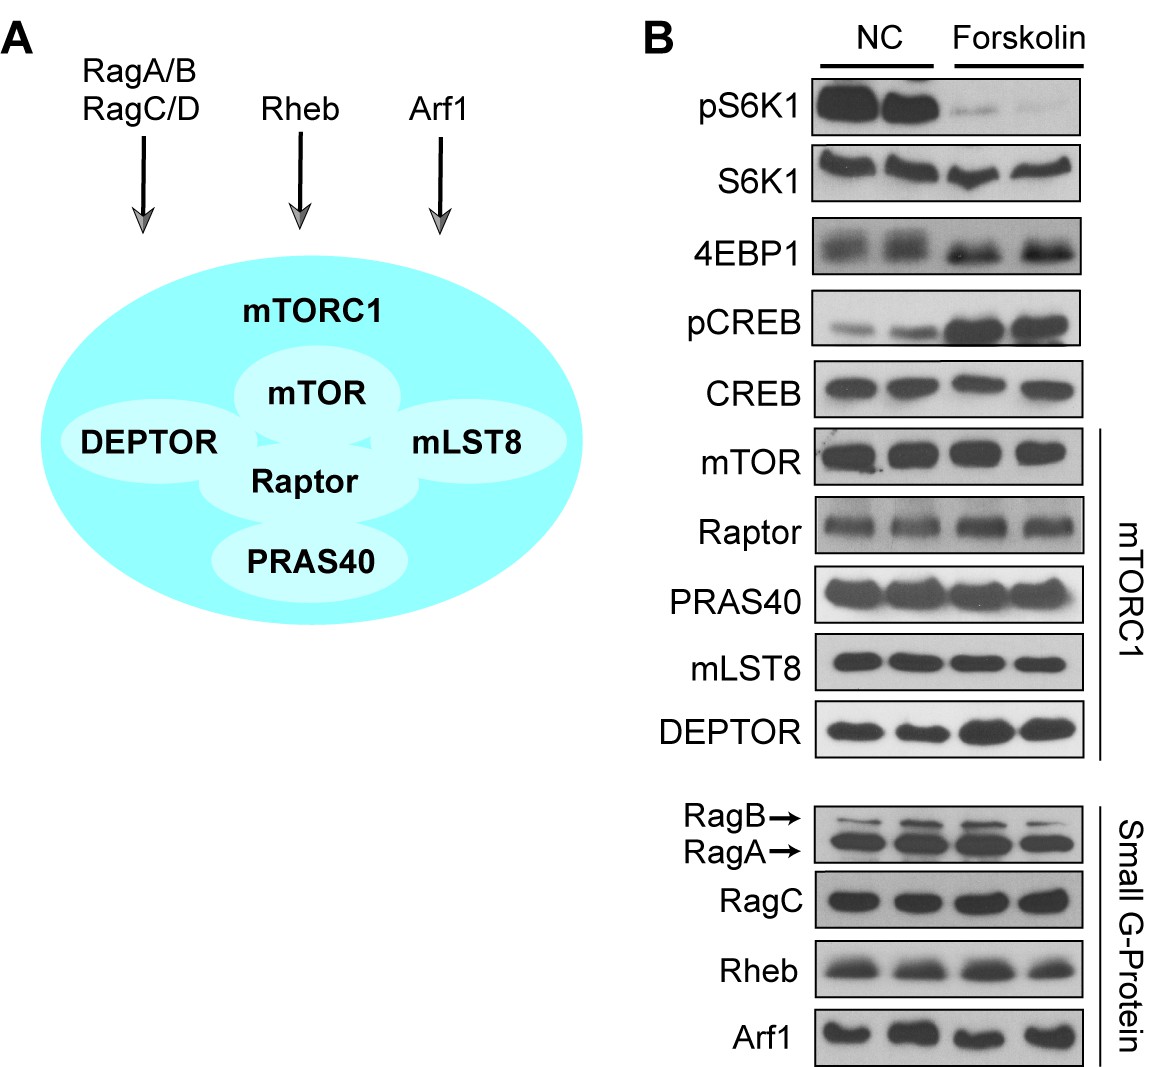
Protein levels of the mTORC1 complex or small G-proteins involved in mTORC1 signaling are unaffected by forskolin.
(A) Schematic presentation of mTORC1 including mTOR, Raptor, mLST8, Deptor, and PRAS40 and upstream regulators. The small G-protein Rheb activates mTORC1 downstream of growth factor signaling, whereas the small G-proteins RagA/RagC and Arf1 activate mTORC1 downstream of amino acid stimulation. (B) Forskolin treatment does not alter protein levels of the mTORC1 components or small G-proteins involved in mTORC1 signaling. Human embryonic kidney 293A (HEK293A) cells were treated with 10 μM forskolin for 1 h and mTORC1 activity was analyzed by protein immunoblotting for the phosphorylation status of S6K1 (pS6K1) at Thr 389 and the mobility shift of 4EBP1, indicating 4EBP1 phosphorylation. Phosphorylation of CREB (pCREB) at Ser 133 was used as a positive control for PKA activation by the increase of cAMP after forskolin stimulation. Both S6K1 and CREB were used as lysate loading. The mTORC1 components (mTOR, Raptor, PRAS40, mLST8, Deptor) and small G-proteins (RagA, RagB, RagC, Rheb, Arf1) were immunoblotted.
Figure 1—figure supplement 2
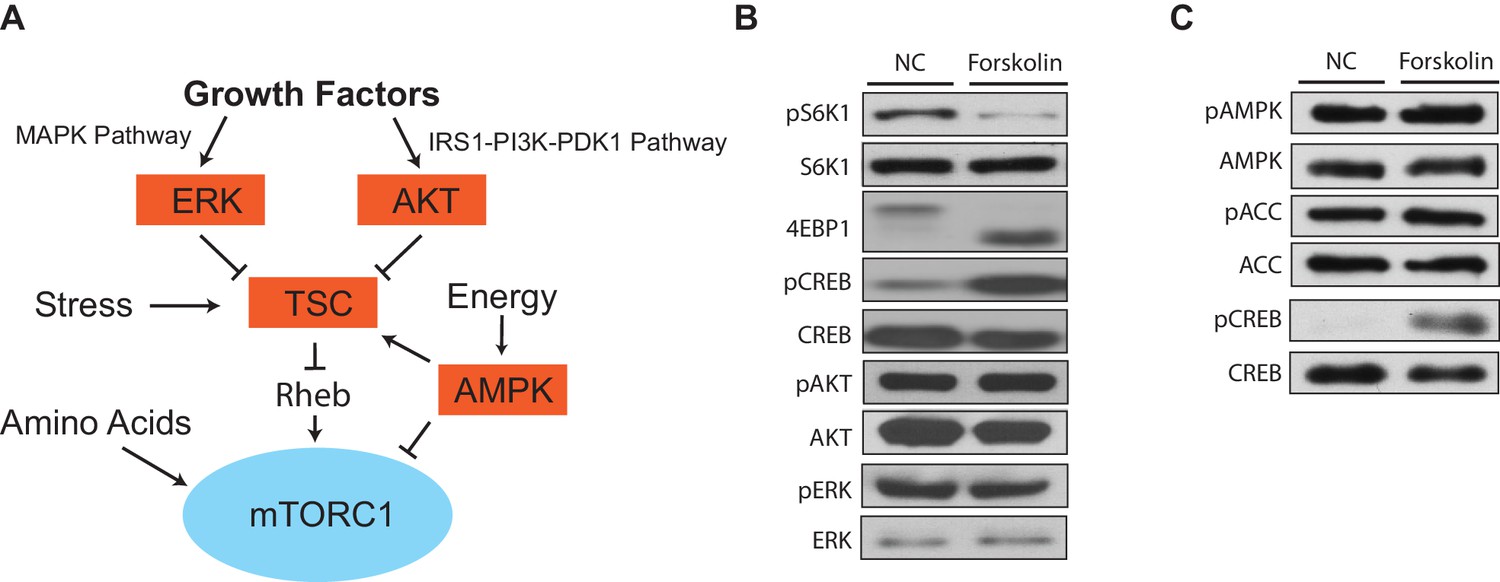
mTORC1 inhibition via increased levels of cAMP is not upstream of the tuberous sclerosis complex.
(A) Growth factors, energy status, stress, and amino acids converge on mTORC1 to regulate its activity. (B) Forskolin inhibits mTORC1 and not mTORC2. HEK293A cells were treated with 10 μM forskolin for 1 h and mTORC1 activity was analyzed by protein immunoblotting for the phosphorylation status of S6K1 (pS6K1) at Thr 389 and the mobility shift of 4EBP1, indicating 4EBP1 phosphorylation. Phosphorylation of CREB (pCREB) at Ser 133 was used as a positive control for the increase of 3’,5’-cyclic adenosine monophosphate after forskolin stimulation. Phosphorylation of AKT (pAKT) at Ser 473 and phosphorylation of ERK (pERK) at Thr 202/Tyr 204 were also observed to see whether forskolin regulated these signaling cascades. S6K1, CREB, AKT, and ERK were used as lysate loading controls. NC denotes normal conditions. (C) Forskolin does not change AMPK activity. Similar to (B) HEK293A cells were treated with 10 μM forskolin for 1 h and the phosphorylation of AMPK (pAMPK) at Thr 172 and phosphorylation of ACC (pACC) at Ser 79 were analyzed. AMPK and ACC were used as lysate loading controls. NC denotes normal conditions.
Figure 2
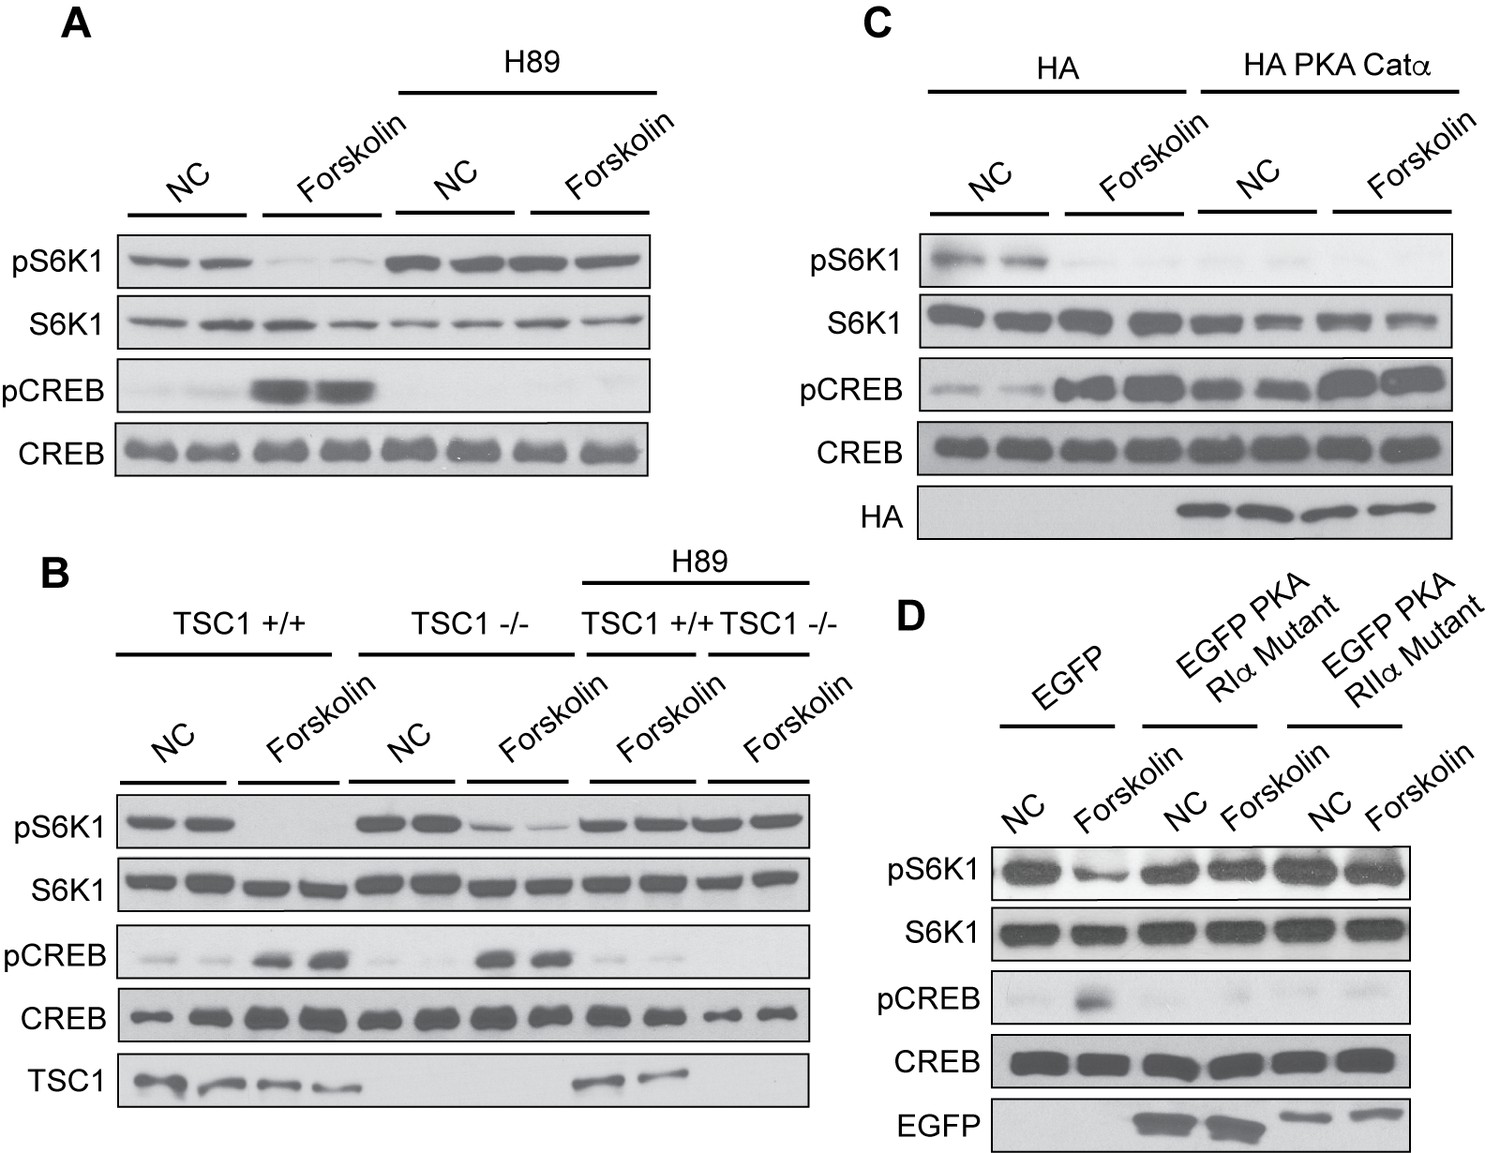
Protein Kinase A mediates the effect of cAMP to inhibit mTORC1.
(A) Inhibition of PKA by H89 blocks the effect of forskolin on mTORC1. Human embryonic kidney 293A (HEK293A) cells were pretreated with or without the protein kinase A (PKA) inhibitor H89, and then treated with or without 10 μM forskolin for 1 h. mTORC1 activity was analyzed by protein immunoblotting for the phosphorylation status of S6K1 (pS6K1) at Thr 389. Phosphorylation of CREB (pCREB) at Ser 133 was used as a positive control for the increase of cAMP after forskolin stimulation. Both S6K1 and CREB were used as lysate loading controls. NC denotes normal conditions. (B) PKA is required for forskolin-induced mTORC1 inhibition in TSC1 knockout cells. Control (TSC1 +/+) and tuberous sclerosis complex one knockout (TSC1 -/-) mouse embryonic fibroblasts (MEFs) were pretreated with H89 for 1 h, and then stimulated with or without 10 μM forskolin for 1 h. mTORC1 activity, CREB phosphorylation, and loading controls were analyzed as described in (A). TSC1 was also immunoblotted as a control to show the presence or absence of TSC1. NC denotes normal conditions. (C) Overexpression of PKA inhibits mTORC1. Empty vector (HA) or HA-tagged PKA Catα was expressed in HEK293A cells. Forty-eight hours later, cells were treated with or without 10 μM forskolin for 1 h. mTORC1 activity, CREB phosphorylation, and loading controls were analyzed as described in (A). HA was also immunoblotted as a control to show the presence or absence of HA-tagged PKA Catα. NC denotes normal conditions. (D) Dominant negative mutants of PKA regulatory subunits block the effect of forskolin on mTORC1. Empty vector (EGFP) or EGFP-tagged mutant PKA regulatory subunits (PKA RIα or PKA RIIα) were expressed in HEK293A cells. Forty-eight hours later, cells were treated with or without 10 μM forskolin for 1 h. mTORC1 activity, CREB phosphorylation, and loading controls were analyzed as described in (A). Expression of EGFP was also immunoblotted as a control to show the presence or absence of EGFP-tagged mutant PKA regulatory subunits (PKA RIα or PKA RIIα) detected by western blotting. NC denotes normal conditions.
Figure 3

cAMP suppresses amino acid-induced mTORC1 activation.
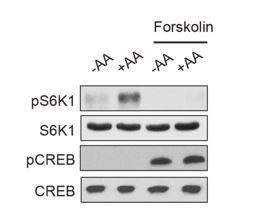
(A) Forskolin inhibits mTORC1 activation by insulin. Human embryonic kidney 293A (HEK293A) cells were starved of fetal bovine serum (FBS) for 16 h. After FBS starvation cells were starved of amino acids (-AA, left) or not starved of amino acids (+AA, right), pretreated with or without 10 μM forskolin for 1 h, and then stimulated with or without 100 nM insulin for 30 min. mTORC1 activity was analyzed by protein immunoblotting for the phosphorylation status of S6K1 (pS6K1) at Thr 389. Phosphorylation of CREB (pCREB) at Ser 133 was used as a positive control for the increase of cAMP after forskolin stimulation. Both S6K1 and CREB were used as lysate loading controls. (B) Forskolin inhibits mTORC1 activation by amino acids. MEFs were starved of amino acids (-AA) for 2 h, pretreated with or without 10 μM forskolin and 10 μM IBMX for 1 h, and then stimulated with or without amino acids (+AA) for 1 h. mTORC1 activity, CREB phosphorylation, and loading controls were analyzed as described in (A). NC denotes normal conditions. (C) Forskolin inhibits mTORC1 in TSC1 knockout cells. Control (TSC1 +/+) and TSC1 knockout (TSC1 -/-) mouse embryonic fibroblasts (MEFs) were starved of amino acids (-AA) for 2 h, pretreated with or without 10 μM forskolin and 10 μM 3-isobutyl-1-methylxanthine (IBMX) for 1 h, and then stimulated with or without amino acids (+AA) for 1 h. mTORC1 activity, CREB phosphorylation, and loading controls were analyzed as described in (A). TSC1 was also immunoblotted to show the presence or absence of TSC1. (D) Glutamine activates mTORC1 through a Rag GTPase-independent pathway involving Arf1 (left). Leucine and arginine activate mTORC1 through a Rag GTPase-dependent pathway (right). (E) Forskolin inhibits mTORC1 in both wildtype and RagA/B knockout cells. Control (RagA/B +/+) and RagA/B knockout (RagA/B -/-) MEFs were starved of amino acids (-AA) for 2 h, pretreated with or without 10 μM forskolin and IBMX for 1 h, and then stimulated with or without amino acids (+AA) for 1 h. mTORC1 activity, CREB phosphorylation, and loading controls were analyzed as described in (A). NC denotes normal conditions. (F) Forskolin inhibits mTORC1 in cells expressing RagA, which is constitutively active. Control (RagA/B +/+) MEFs, RagA/B knockout (RagA/B -/-) MEFs, and RagA/B knockout (RagA/B -/- + RagAGTP) MEFs expressing a constitutively active RagA were treated with or without 10 μM forskolin and IBMX for 1 h for 1 h. mTORC1 activity, CREB phosphorylation, and loading controls were analyzed as described in (A). NC denotes normal conditions. (G) Forskolin inhibits leucine and glutamine to activate mTORC1. HEK293A cells were starved of amino acids (-AA) for 1 h, pretreated with or without 10 μM forskolin 1 h, and then stimulated with 500 μM Leu (+Leu) or Gln (+Gln) for 1 h. mTORC1 activity, CREB phosphorylation, and loading controls were analyzed as described in (A).
Figure 4
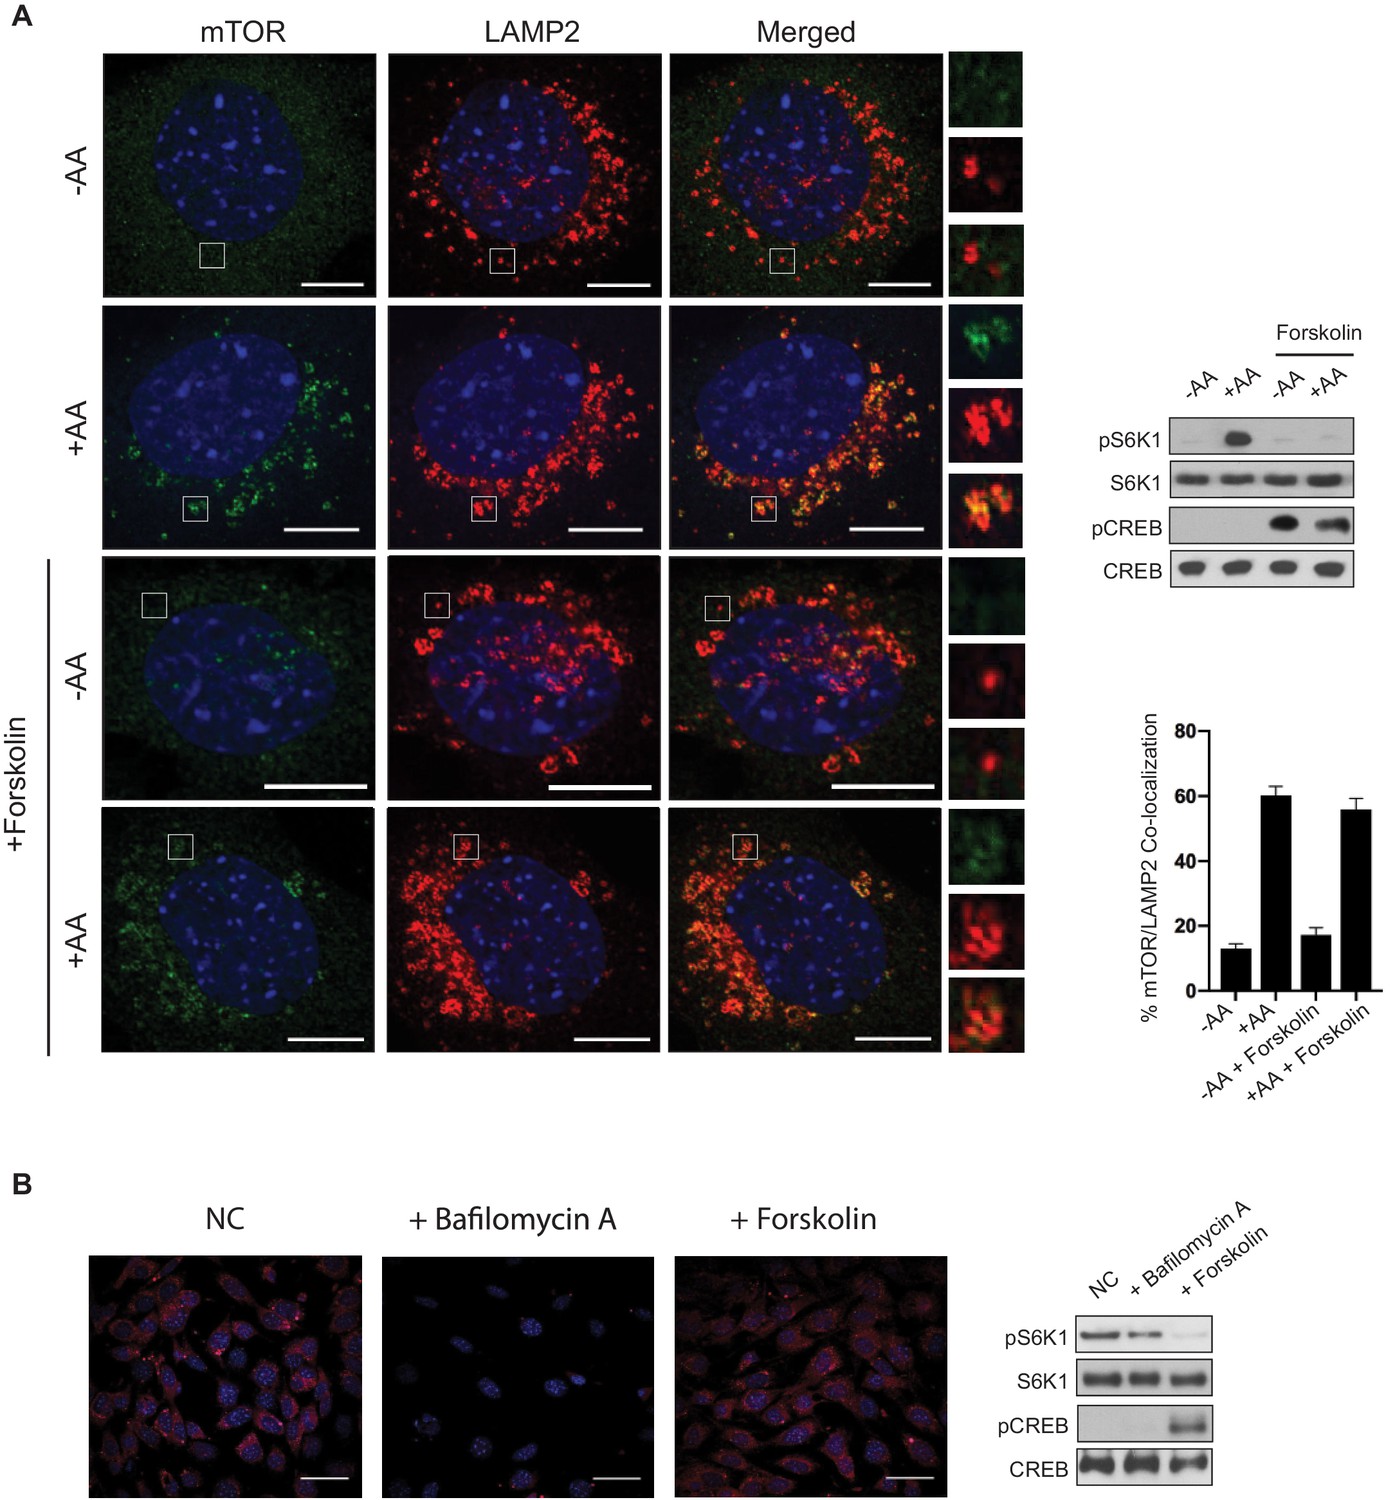
Amino acid-induced mTORC1 lysosomal localization is not blocked by cAMP.
(A) Forskolin does not block amino acid-induced mTOR lysosomal localization. Immunofluorescence analysis depicting mTOR (green) and LAMP2 (red) in mouse embryonic fibroblasts (MEFs). Merged depicts both mTOR and LAMP2. MEFs were starved of amino acids (-AA) for 2 h, treated with or without 10 μM forskolin for 1 h, then stimulated with amino acids (+AA) for 1 h. Higher magnification images of the area depicted by the inset and their overlays are shown on the right. Parallel protein immunoblot as a control for the immunofluorescence images depicting mTORC1 activity via the phosphorylation of S6K1 (pS6K1) is shown (right, top). Phosphorylation of CREB (pCREB) at Ser 133 was used as a positive control for the increase of CREB phosphorylation after forskolin stimulation. Both S6K1 and CREB were used as lysate loading controls. The percentages of mTOR/LAMP2 co-localization were quantified for cells pretreated with or without forskolin, and either starved of amino acids (-AA) or stimulated with amino acids (+AA). -AA vs. +AA (p=0.0001, t-test, error bars were calculated using SEM), -AA + forskolin vs.+AA + forskolin (p=0.0001, t-test, error bars were calculated using SEM), -AA vs. -AA + forskolin (p=0.1429, t-test, error bars were calculated using SEM),+AA vs.+AA + forskolin (p=0.3491, t-test, error bars were calculated using SEM) (right, bottom). Scale bar is 10 μm. (B) Forskolin does not appear to alter lysosomal pH. MEFs were treated with or without 10 μM of bafilomycin A or 10 μM forskolin for 1 h, followed by treatment with Lysotracker Red for 15 min. Parallel protein immunoblot as a control for the immunofluorescence images depicting mTORC1 activity is shown (right). mTORC1 activity, cAMP levels, and loading controls were analyzed as described in (A). NC denotes normal conditions. Scale bar is 180 μm.
Figure 5
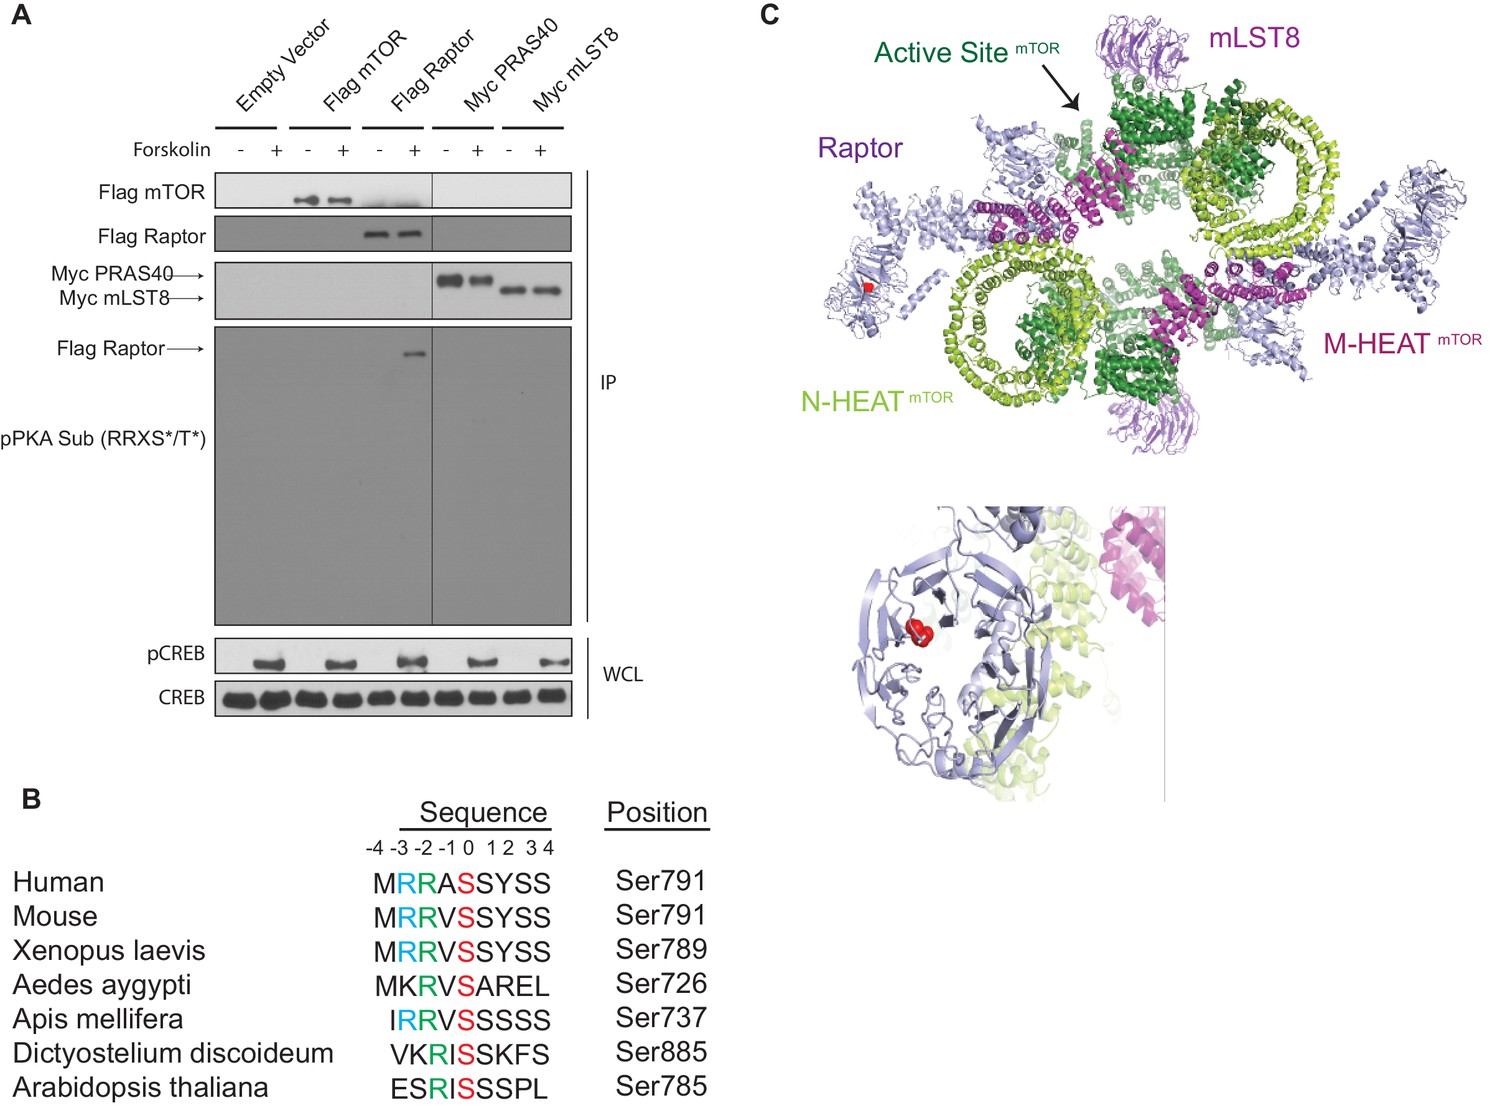
cAMP induces Raptor phosphorylation.
(A) Forskolin increases Raptor phosphorylation detected by a phospho-PKA substrate antibody. Empty vector, Flag-tagged mTOR, Flag-tagged Raptor, Myc-tagged PRAS40, or Myc-tagged mLST8 was expressed in human embryonic kidney 293A (HEK293A) cells. Forty-eight hours later, the cells were treated with or without 10 μM forskolin, and Flag or Myc immunoprecipitates (IPs) were analyzed by immunoblotting with a PKA substrate antibody that recognizes RRXS*/T* (pPKA Sub (RRXS*/T*)). Flag-tagged mTOR and Raptor, or Myc-tagged PRAS40 and mLST8 were also blotted to show equal IPs for cells treated with or without forskolin. CREB phosphorylation was included as a positive control for forskolin stimulation. CREB was used as lysate loading controls. WCL denotes whole cell lysate. (B) Alignment of Raptor Ser 791 among different species. (C) Raptor Ser 791 resides in the WD40 domain of Raptor. The red ball denotes the phosphorylation.
Figure 6 with 5 supplements

Protein kinase A phosphorylates Raptor at Ser 791.
(A) Forskolin stimulates Ser 791 (S791) phosphorylation in Raptor. HA empty vector, HA-tagged Raptor, HA-tagged Raptor S791A, HA-tagged Raptor S791D, HA-tagged Raptor S792A, or HA-tagged Raptor S791A/S792A was expressed in human embryonic kidney 293A (HEK293A) cells. Forty-eight hours later, the cells were treated with or without 10 μM forskolin, and HA immunoprecipitates (IPs) were analyzed by immunoblotting with a phospho-PKA substrate antibody that recognizes RRXS*/T* (pPKA Sub (RRXS*/T*)). mTOR and HA-tagged Raptor were also blotted to show equal IPs for cells treated with or without forskolin. CREB phosphorylation was included as a positive control for forskolin stimulation. CREB and S6K were used as lysate loading controls. HA was immunoblotted to ensure equal HA expression of the different HA-tagged Raptor constructs. WCL denotes whole cell lysate. (B) Forskolin increases the phosphorylation of endogenous Raptor. HEK293A cells were treated with or without 10 μM forskolin, and Raptor was immunoprecipitated (IP) analyzed by immunoblotting with a PKA substrate antibody that recognizes RRXS*/T* (pPKA Sub (RRXS*/T*)). Raptor and mTOR were also blotted to show equal IPs for cells treated with or without forskolin. Rabbit IgG (IgG) was used as a control. CREB phosphorylation was included as a positive control for forskolin stimulation. CREB and S6K were used as lysate loading controls. WCL denotes whole cell lysate. (C) PKA is required for Raptor phosphorylation by forskolin. HEK293A (WT) or PKA Cat α/β knockout (PKA cat α/β KO) HEK293A cells were treated with or without 10 μM forskolin, and pPKA Sub RRXS*/T* antibody was used for the immunoprecipitation (IP) to enrich for protein kinase A (PKA) substrates. The immunoprecipitations (IP) were analyzed by immunoblotting with Raptor. CREB phosphorylation was included as a positive control for forskolin stimulation. CREB, S6K, and Raptor were used as lysate loading controls. WCL denotes whole cell lysate. PKA Cat α/β was also immunoblotted to confirm the presence or absence of PKA Cat α/β. (D) PKA phosphorylates Raptor S791 directly. HA empty vector, HA-tagged Raptor, HA-tagged Raptor S791A, or HA-tagged Raptor S792A, was expressed in HEK293A cells. Forty-eight hours later, HA immunoprecipitates (IPs) were done and in vitro kinase assays were performed with or without recombinant PKA Cat α. The in vitro kinase assays were analyzed by immunoblotting with a PKA substrate antibody that recognizes RRXS*/T* (pPKA Sub (RRXS*/T*)). HA-tagged Raptor was blotted to show equal IPs. PKA Cat α was also immunoblotted as a control to show the presence or absence of PKA Cat α. HA was immunoblotted to ensure equal HA expression of the different HA-tagged Raptor constructs. WCL denotes whole cell lysate. (E) Right - HEK293A or HEK293A Raptor S791A mutant cells (S791A-1 or S791A-2) were treated with or without forskolin and mTORC1 activity was analyzed by pS6K1 or p4EBP1. S6K and 4EBP1 were loading controls. pCREB was probed for as a positive control indicating the increase in cAMP. The mTORC1 components (mTOR, Raptor, PRAS40, and mLST8) were also immunoblotted for. Left – Quantification of the % decrease of pS6K1 and p4EBP1 after forskolin treatment in HEK293A cells or HEK293A Raptor S791A mutant cells (S791A-1 or S791A-2) from three independent experiments. %pS6K level: HEK293A vs. S791A-1 (p=0.0055, t-test, error bars were calculated by using SEM), HEK293A vs. S791A-2 (p=0.1215, t-test, error bars were calculated by using SEM, increased but not significant). %4EBP1 level: HEK293A vs. S791A-1 (p=0.0382, t-test, error bars were calculated by using SEM), HEK293A vs. S791A-2 (p=0.001, t-test, error bars were calculated by using SEM). (F) Cell number of HEK293A cells or HEK293A Raptor S791A mutant cells (S791A-1 or S791A-2) were quantified 96 h after the initial plating of 5 × 10⁴ cells per well in normal and forskolin-treated conditions. NC HEK293A vs. S791A-1 (p=0.0071, t-test, error bars were calculated using SEM). NC HEK293A vs. S791A-2 (p=0.0302, t-test, error bars were calculated by using SEM). Forskolin-treated HEK293A vs. S791A-1 (p=0.0308, t-test, error bars were calculated by using SEM). Forskolin-treated HEK293A vs. S791A-2 (p=0.0244, t-test, error bars were calculated using SEM). HEK293A NC vs. forskolin (p=0.0455, t-test, error bars were calculated using SEM). S791A-1 NC vs. forskolin (p=0.0095, t-test, error bars were calculated using SEM). S791A-2 NC vs. forskolin (p=0.0293, t-test, error bars were calculated using SEM).
Figure 6—figure supplement 1
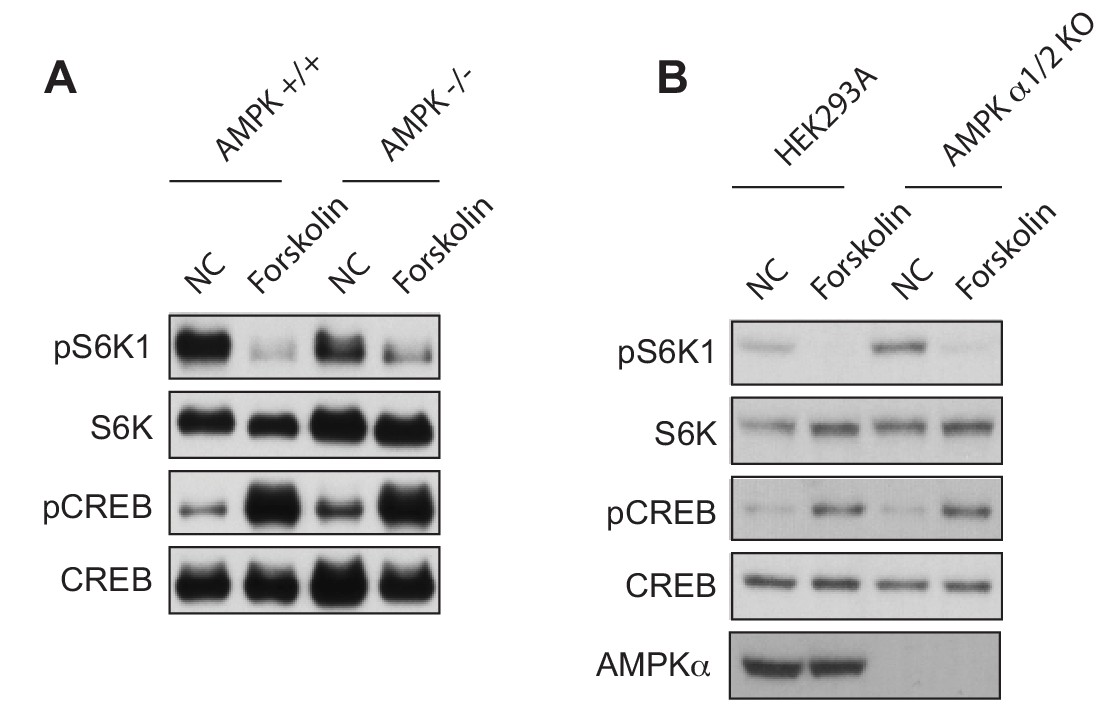
Forskolin inhibits mTORC1 in the absence of AMPK.
(A) Forskolin inhibits mTORC1 in AMPK knockout MEF cells. AMPK α1/2 wild-type (AMPK +/+) or AMPK α1/2 knockout (KO) (AMPK -/-) MEFs were treated with or without forskolin and mTORC1 activity was analyzed by protein immunoblotting for the phosphorylation status of S6K1 (pS6K1) at Thr 389. Phosphorylation of CREB (pCREB) at Ser 133 was used as a positive control for the increase of 3’,5’-cyclic adenosine monophosphate after forskolin stimulation. S6K1 and CREB were used as lysate loading controls. NC denotes normal conditions. (B) Forskolin inhibits mTORC1 in AMPK knockout HEK293A cells. Similar to (A), control or AMPK α1/2 KO HEK293A cells were treated with or without forskolin and mTORC1 activity was analyzed as in (A).
Figure 6—figure supplement 2
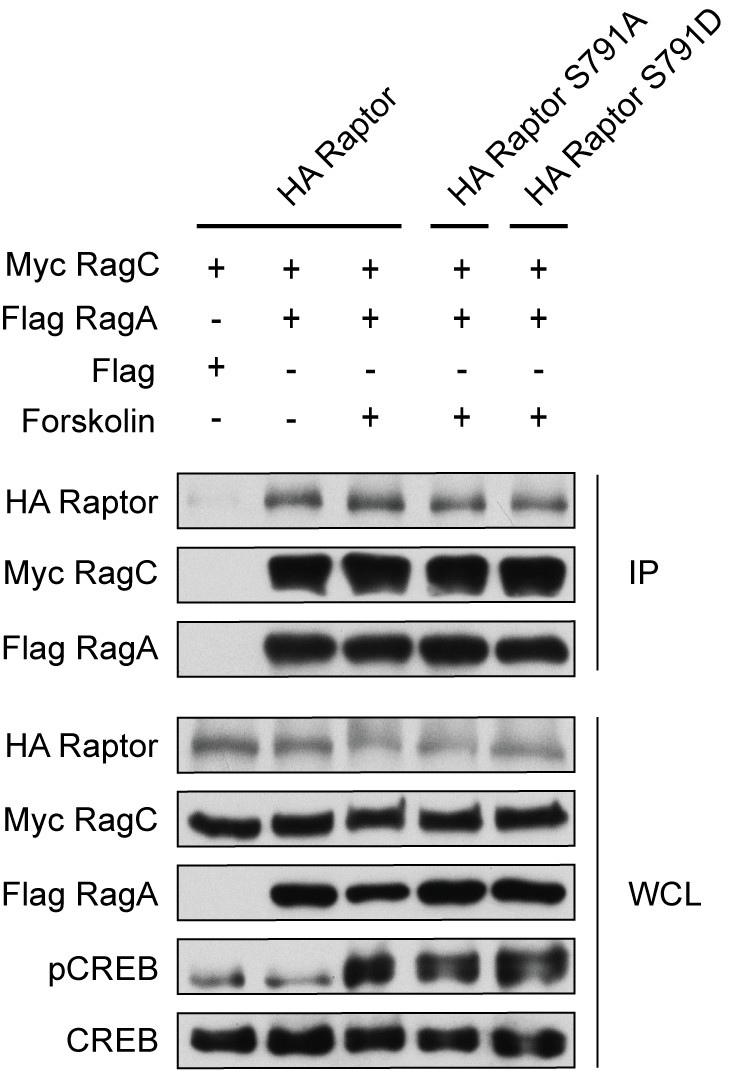
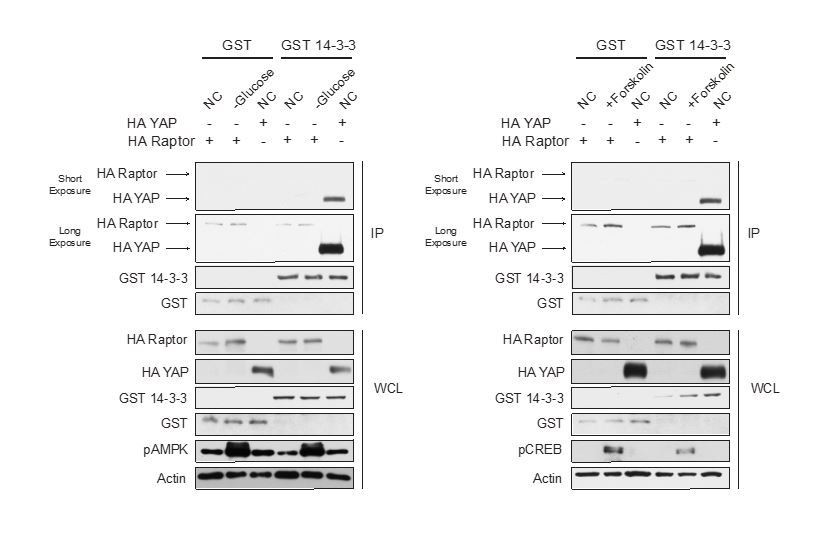
Raptor Ser 791 phosphorylation does not alter Raptor binding to the Rag GTPases.
HEK293A cells were treated with or without 10 μM forskolin. The following plasmids were overexpressed (+) or not overexpressed (-). HA-tagged Raptor, HA-tagged Raptor S791A, HA-tagged Raptor S791D, Myc-tagged Rag C, Flag-tagged RagA, or Flag. Flag immunoprecipitates (IPs) were analyzed by immunoblotting with a HA, Myc, or Flag antibody. CREB phosphorylation was included as a positive control for forskolin stimulation and CREB was blotted as a control. WCL denotes whole cell lysate.
Figure 6—figure supplement 3
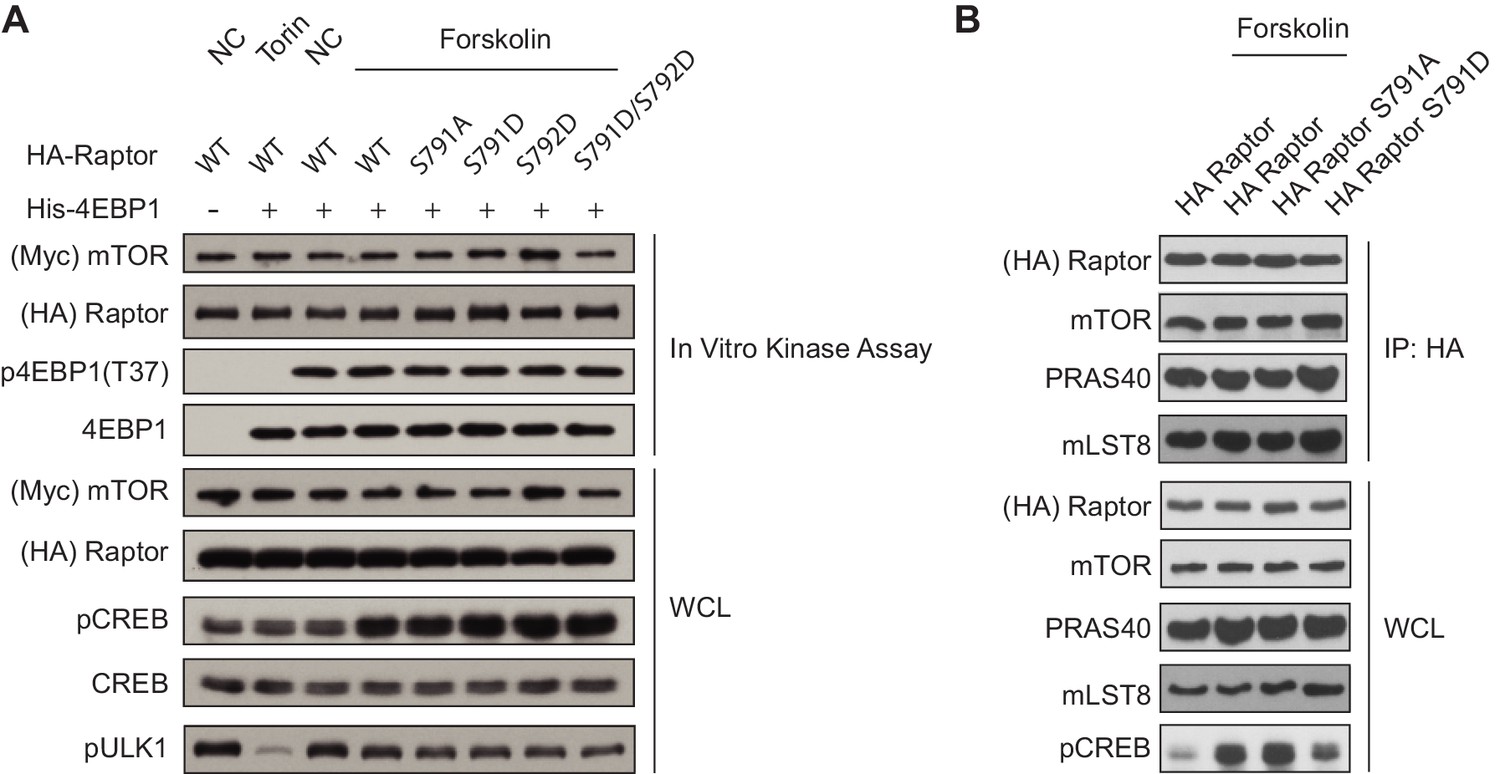
cAMP does not alter mTORC1 kinase activity or binding of mTORC1 components.
(A) cAMP doesn't alter mTORC1 kinase activity. HA-tagged Raptor or HA-tagged Raptor mutants (S791A, S791D, S792D, S791D/S792D) were overexpressed with Myc-tagged mTOR in HEK293A cells. Forty-eight hours later, the cells were treated with or without 100 nM torin or 10 μM forskolin, and the mTORC1 complex was immunoprecipitated (IP) via Raptor. The mTORC1 complex was then incubated with recombinant His-4EBP1 and in vitro kinase assays were performed. Myc-tagged mTOR and HA-tagged Raptor were blotted in the in vitro kinase assay to show equal IPs. mTORC1 activity was assessed by p4EBP1 (Thr 37), and 4EBP1 was blotted for as a loading control. Phosphorylation of CREB (pCREB) at Ser 133 and pULK at Ser 758 were used as positive controls for the increase of cAMP after forskolin stimulation in the whole cell lysate (WCL). CREB, S6K, Myc-tagged mTOR, and HA-tagged Raptor were used as lysate loading controls. (B) cAMP doesn't alter binding of mTORC1 components. HA-tagged Raptor or HA-tagged Raptor mutants (S791A and S791D) were expressed in HEK293A cells. Forty-eight hours later, the cells were treated with or without 10 μM forskolin, and HA immunoprecipitates (IPs) were analyzed by immunoblotting for the mTORC1 components (HA-tagged Raptor, mTOR, PRAS40, mLST8) both in the IP and WCL. Phosphorylation of CREB (pCREB) at Ser 133 was used as a positive control for the increase of cAMP after forskolin stimulation.
Figure 6—figure supplement 4
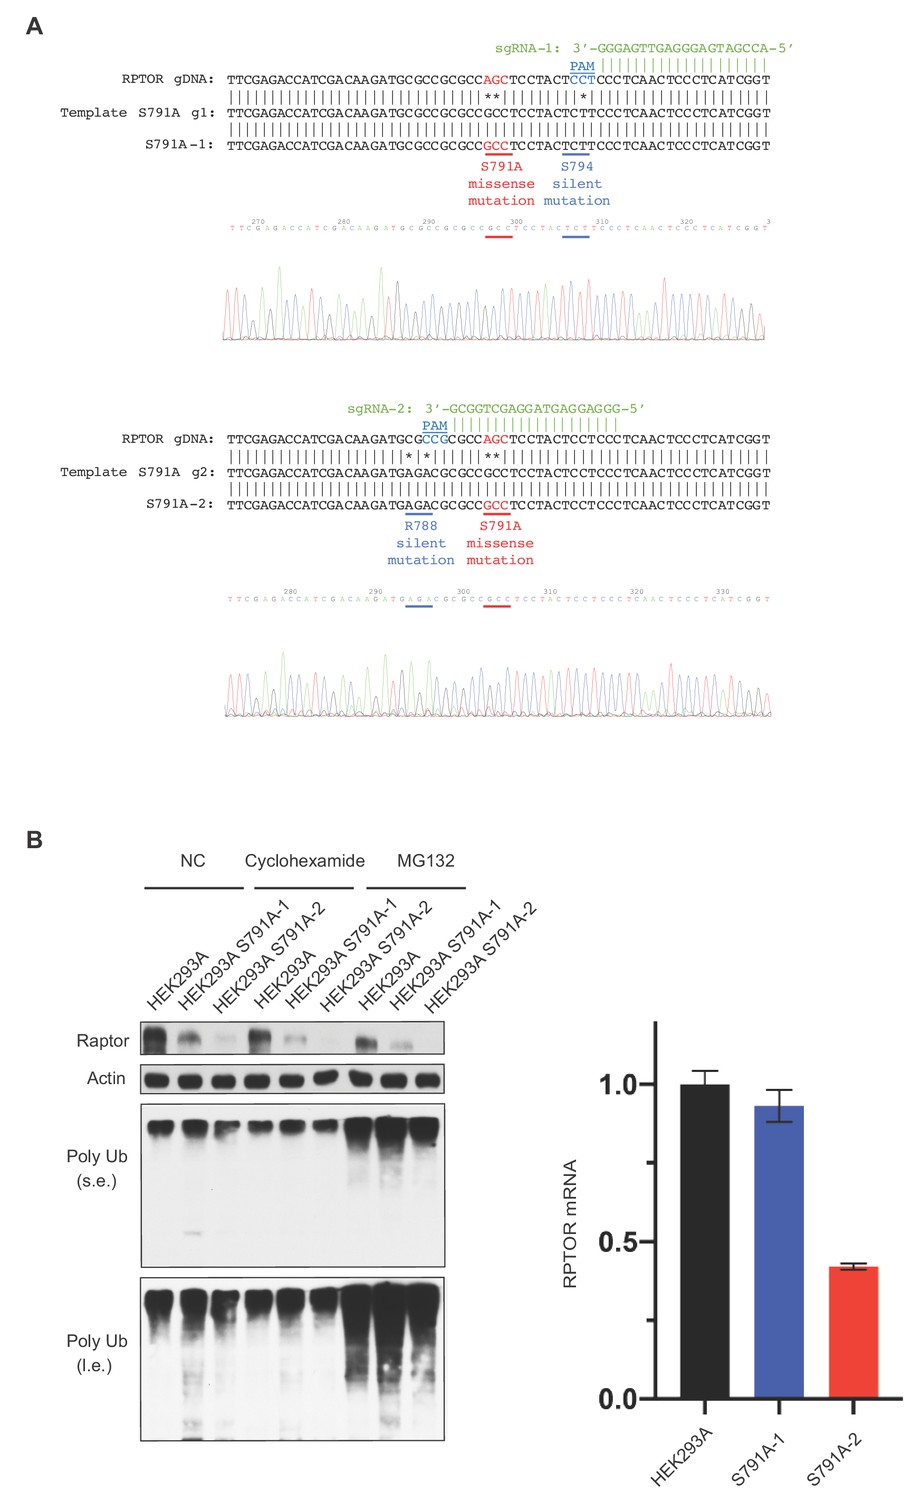
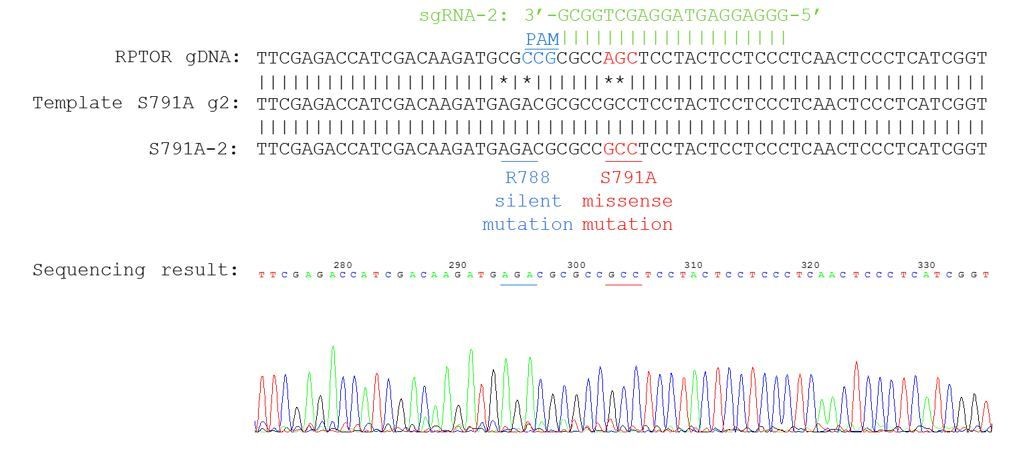
Generation of the Raptor S791A mutant HEK293A cells using CRISPR/Cas9 genome editing.
(A) Generation of Raptor S791A cells. Sequence depicting the locus in the RPTOR gene showing the single guide RNA (sgRNA, green), the 5’NGG protospacer adjacent motif (PAM; blue), and the mutation (red) that generates the S791A mutation. (B) Characterization of Raptor S791A cells. Left: HEK293A cells or HEK293A Raptor S791A mutant cells (S791A-1 or S791A-2) were treated with or without cycloheximide (25 ug/mL for 4 h) or MG132 (10 uM for 4 h) and Raptor, Actin, or Poly Ub were analyzed. S.e. denotes short exposure, l.e. denotes long exposure, and NC denotes normal conditions. Right: Raptor mRNA was analyzed in HEK293A cells or HEK293A Raptor S791A mutant cells via RT-PCR. HEK293A vs. S791A-1 (p=0.3622, t-test, error bars were calculated using SEM). HEK293A vs. S791A-2 (p=0.0002, t-test, error bars were calculated using SEM). S791-A vs. S791A-2 (p=0.0006, t-test, error bars were calculated using SEM).
Figure 6—figure supplement 5
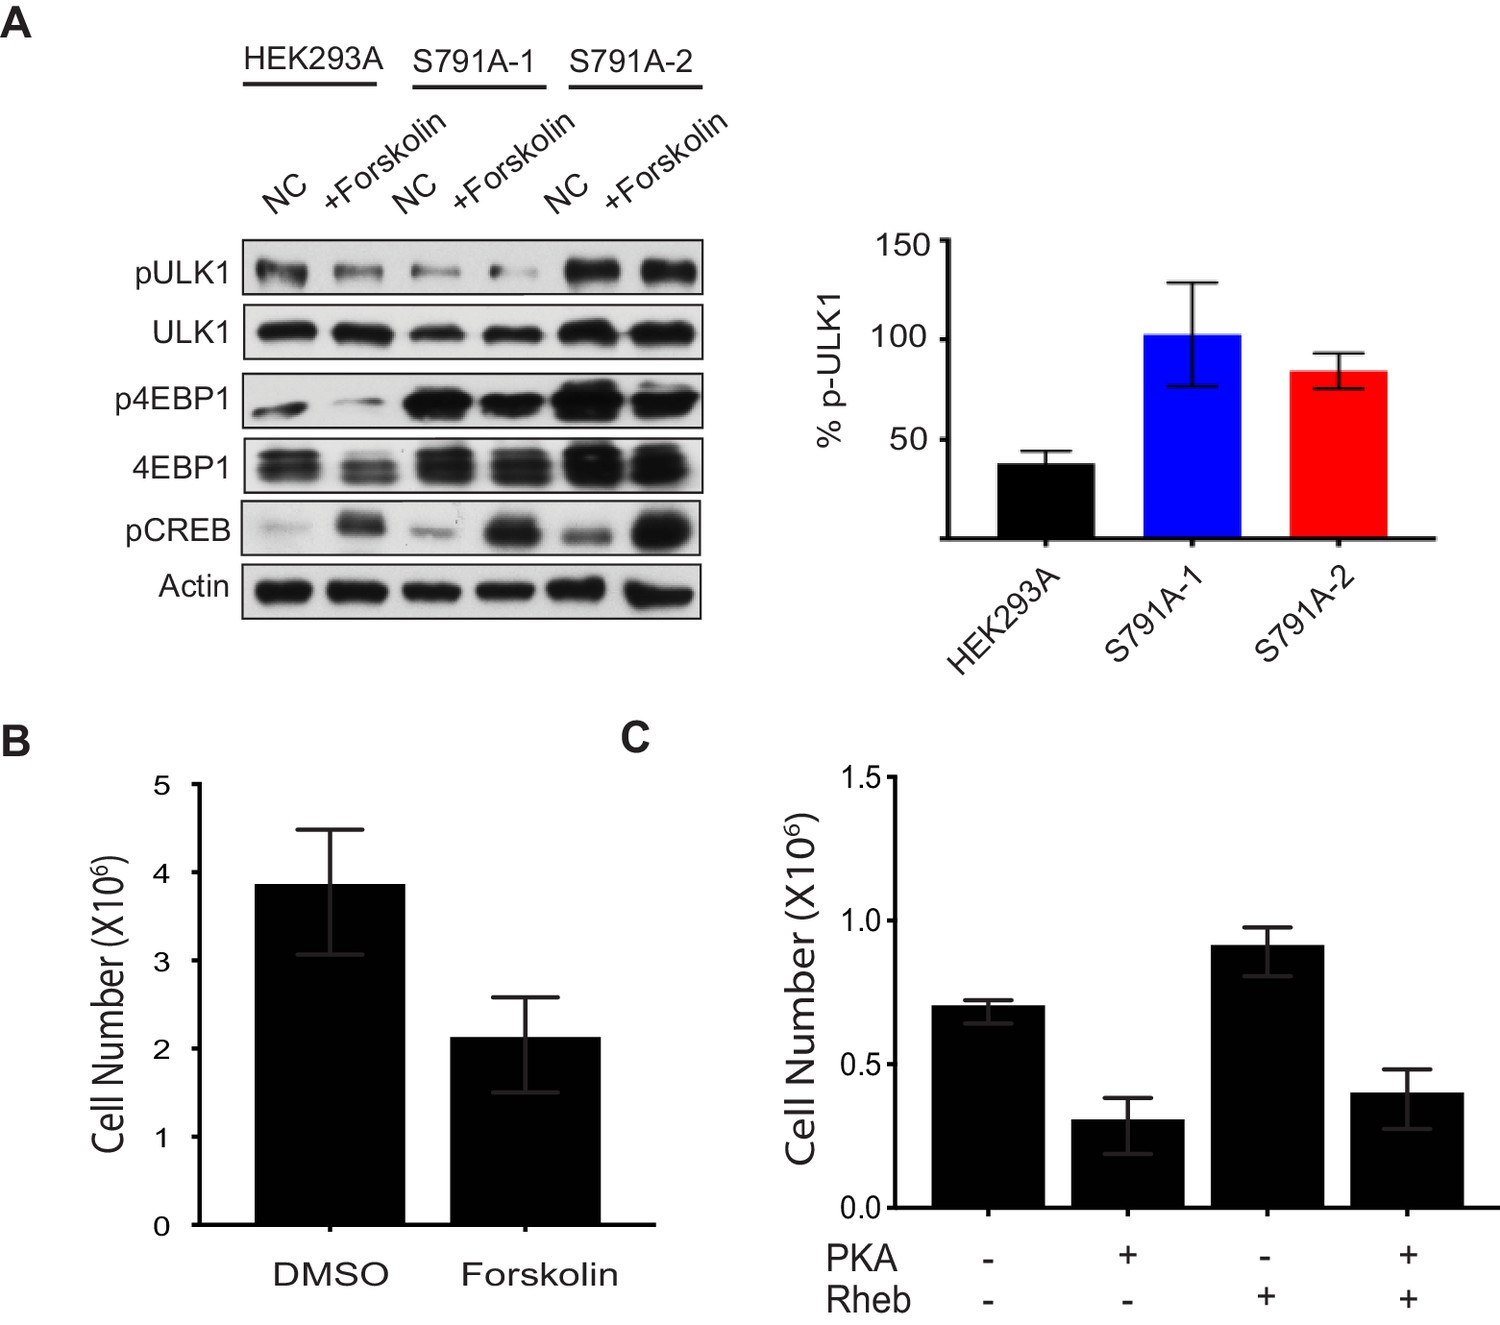
Raptor Ser 791 phosphorylation decreases mTORC1 activity and cell proliferation.
(A) Raptor Ser 791 phosphorylation decreases mTORC1 activity. Right: HEK293A or HEK293A Raptor S791A mutant cells (S791A-1 or S791A-2) were treated with or without forskolin and mTORC1 activity was analyzed by pULK1 or p4EBP1. ULK1, 4EBP1, and actin were loading controls. pCREB was probed for as a positive control indicating the increase in cAMP. Left: Quantification of the % decrease of pULK1 in HEK293A cells or HEK293A Raptor S791A mutant cells (S791A-1 or S791A-2) from at least three independent experiments. %pULK1 level: HEK293A vs. S791A-1 (p=0.0371, t-test, error bars were calculated using SEM), HEK293A vs. S791A-2 (p=0.00.0017, t-test, error bars were calculated using SEM, increased but not significant). (B) Forskolin treatment decreases cell proliferation. MDA-MB-231 cells were treated with or without 10 μM forskolin (fresh media and 10 μM forskolin applied daily) and cell number was counted 72 h later. DMSO vs. forskolin (p=0.008, t-test, error bars were calculated using SEM) (C) Elevated PKA levels decreases cell proliferation. Flag-tagged PKA Catα and/or Myc-tagged Rheb were overexpressed in HEK293A cells and cell number was counted 120 h later. Vector control vs. Flag-tagged PKA Catα (p=0.0055, t-test, error bars were calculated using SEM), vector control vs. Myc-tagged Rheb (p=0.0558, unpaired t-test, error bars were calculated by using SEM), vector control vs. PKA Catα and Myc-tagged Rheb (p=0.0258, t-test, error bars were calculated using SEM).
Figure 7
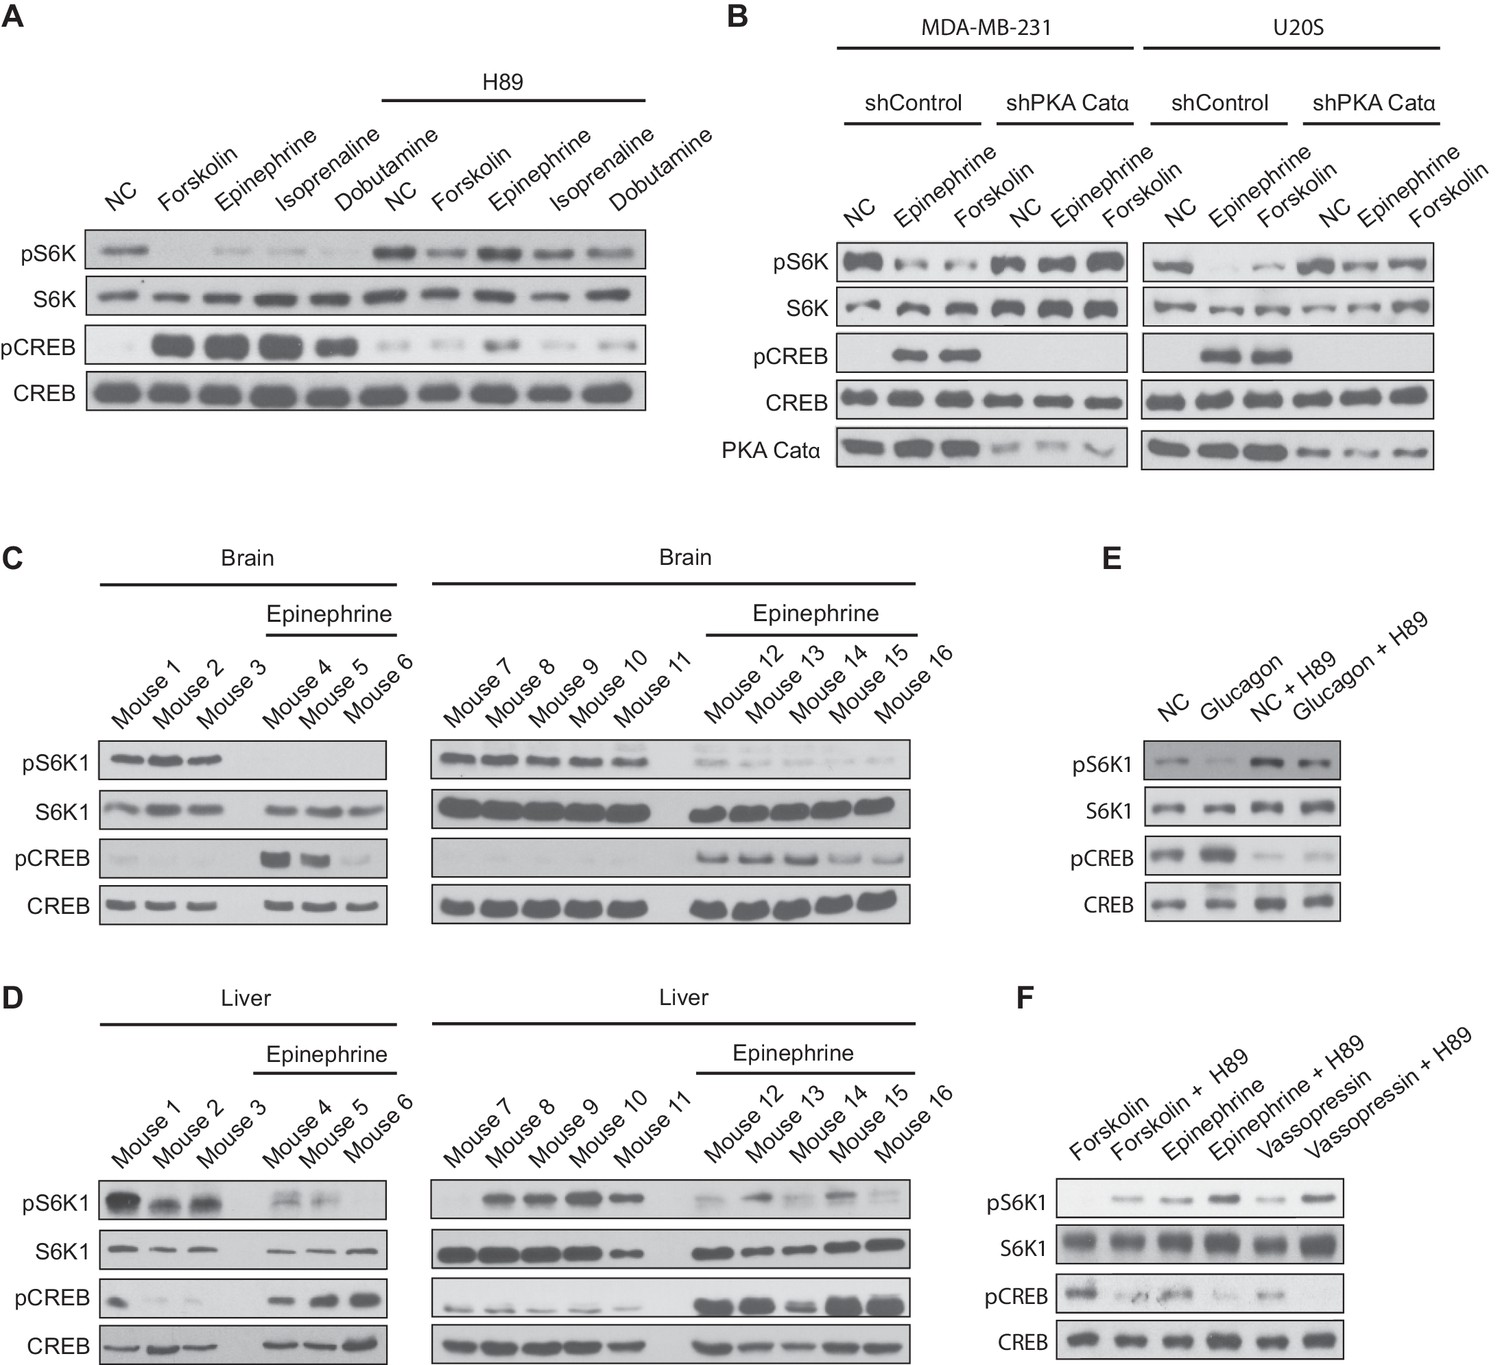
Activation of Gαs-coupled GPCRs inhibit mTORC1 activity in vivo.
(A) MDA-MB-231 cells were pretreated with or without the protein kinase A (PKA) inhibitor H89, and then treated with or without 10 μM forskolin, 10 μM epinephrine, 10 μM isoprenaline, or 10 μM dobutamine for 1 h. mTORC1 activity was analyzed by protein immunoblotting for the phosphorylation status of S6K1 (pS6K1) at Thr 389. Phosphorylation of CREB (pCREB) at Ser 133 was used as a positive control for the increase of cAMP after Gαs-coupled GPCR stimulation. Both S6K1 and CREB were used as lysate loading controls. NC denotes normal conditions. (B) MDA-MB-231 and U20S stable cell lines expressing control shRNA (shControl) or shRNA targeting the PKA catalytic α subunit (shPKA Cat α) were treated with or without 10 μM forskolin or 10 μM epinephrine. mTORC1 activity and loading controls were analyzed as described in (A). PKA Catα was also immunoblotted as a control to show the level of PKA Catα. NC denotes normal conditions. (C) Mice were injected with either epinephrine (0.75 ug/g) or propranolol (0.04 mg/g), and 30 min later brain tissues were processed and analyzed for mTORC1 activity by immunoblotting for the phosphorylation status of S6K1 (pS6K1) at Thr 389. Phosphorylation of CREB (pCREB) at Ser 133 was used as a positive control for the increase of cAMP after Gαs-coupled GPCR stimulation (β2 adrenergic receptor). Both S6K1 and CREB were used as lysate loading controls. (D) Mice were injected with either epinephrine (0.75 ug/g) or propranolol (0.04 mg/g), and 30 min later livers were processed and mTORC1 activity, cAMP levels (stimulation of β2 adrenergic receptor), and loading controls were analyzed as described in (A). (E) Primary mouse hepatocytes were treated with 2 μM glucagon for 1 h, and mTORC1 activity, cAMP levels, and loading controls were analyzed as described in (A). (F) Primary mouse hepatocytes were pretreated with or without PKA inhibitor H89, and then treated with 10 μM forskolin, 10 μM epinephrine, or 10 μM vasopressin for 1 h, and mTORC1 activity, cAMP levels, and loading controls were analyzed as described in (A).
Author response image 1
Author response image 2

Sequencing chromatogram for knock-in clone S791A-1.
Author response image 3
Sequencing chromatogram for knock-in clone S791A-2.
Author response image 4
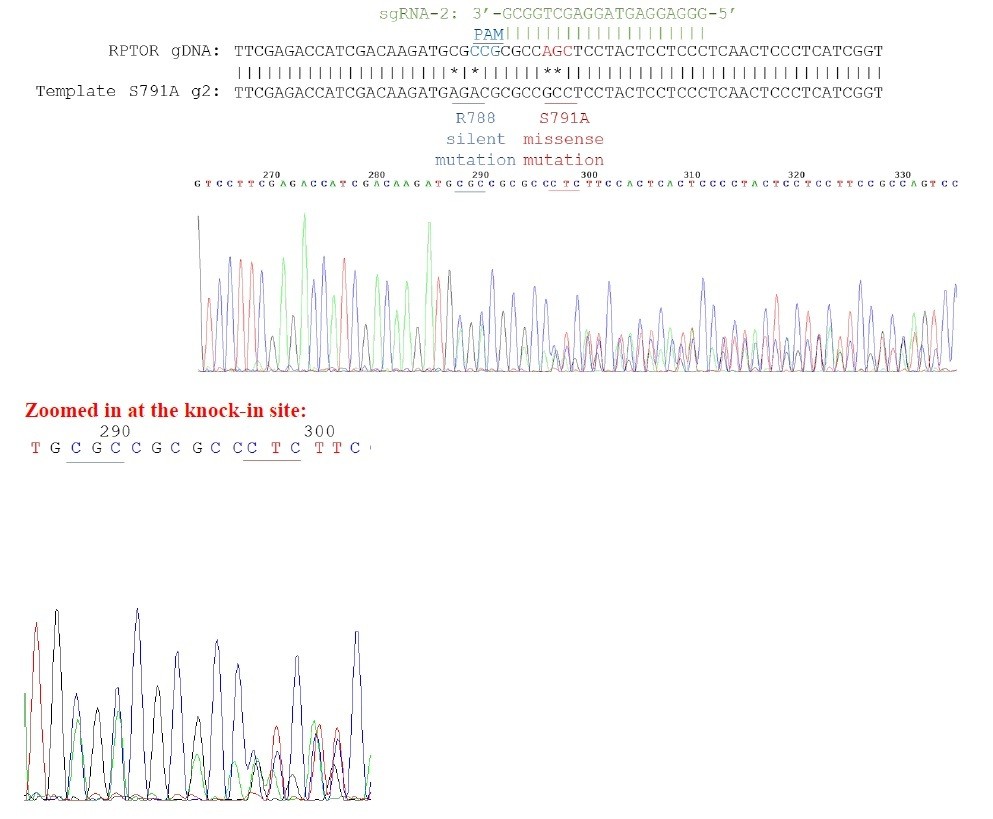
Sequencing chromatogram for heterozygous knock-in.
3 peaks can be observed in the chromatogram.For example, for the nucleotides underlined in red, you can see 3 distinct peaks for the first 2 nucleotides.
Author response image 5
Additional files
-
Transparent reporting form
- https://doi.org/10.7554/eLife.43038.016
Download links
A two-part list of links to download the article, or parts of the article, in various formats.
Downloads (link to download the article as PDF)
Open citations (links to open the citations from this article in various online reference manager services)
Cite this article (links to download the citations from this article in formats compatible with various reference manager tools)
GPCR signaling inhibits mTORC1 via PKA phosphorylation of Raptor
eLife 8:e43038.
https://doi.org/10.7554/eLife.43038


