Rod nuclear architecture determines contrast transmission of the retina and behavioral sensitivity in mice
- Max Planck Institute of Molecular Cell Biology and Genetics, Germany
- Center for Systems Biology Dresden, Germany
- Cluster of Excellence, Physics of Life, Technische Universität Dresden, Germany
- Technische Universität Dresden, Germany
- Biozentrum, Ludwig Maximilians Universität, Germany
Figures
Figure 1 with 2 supplements
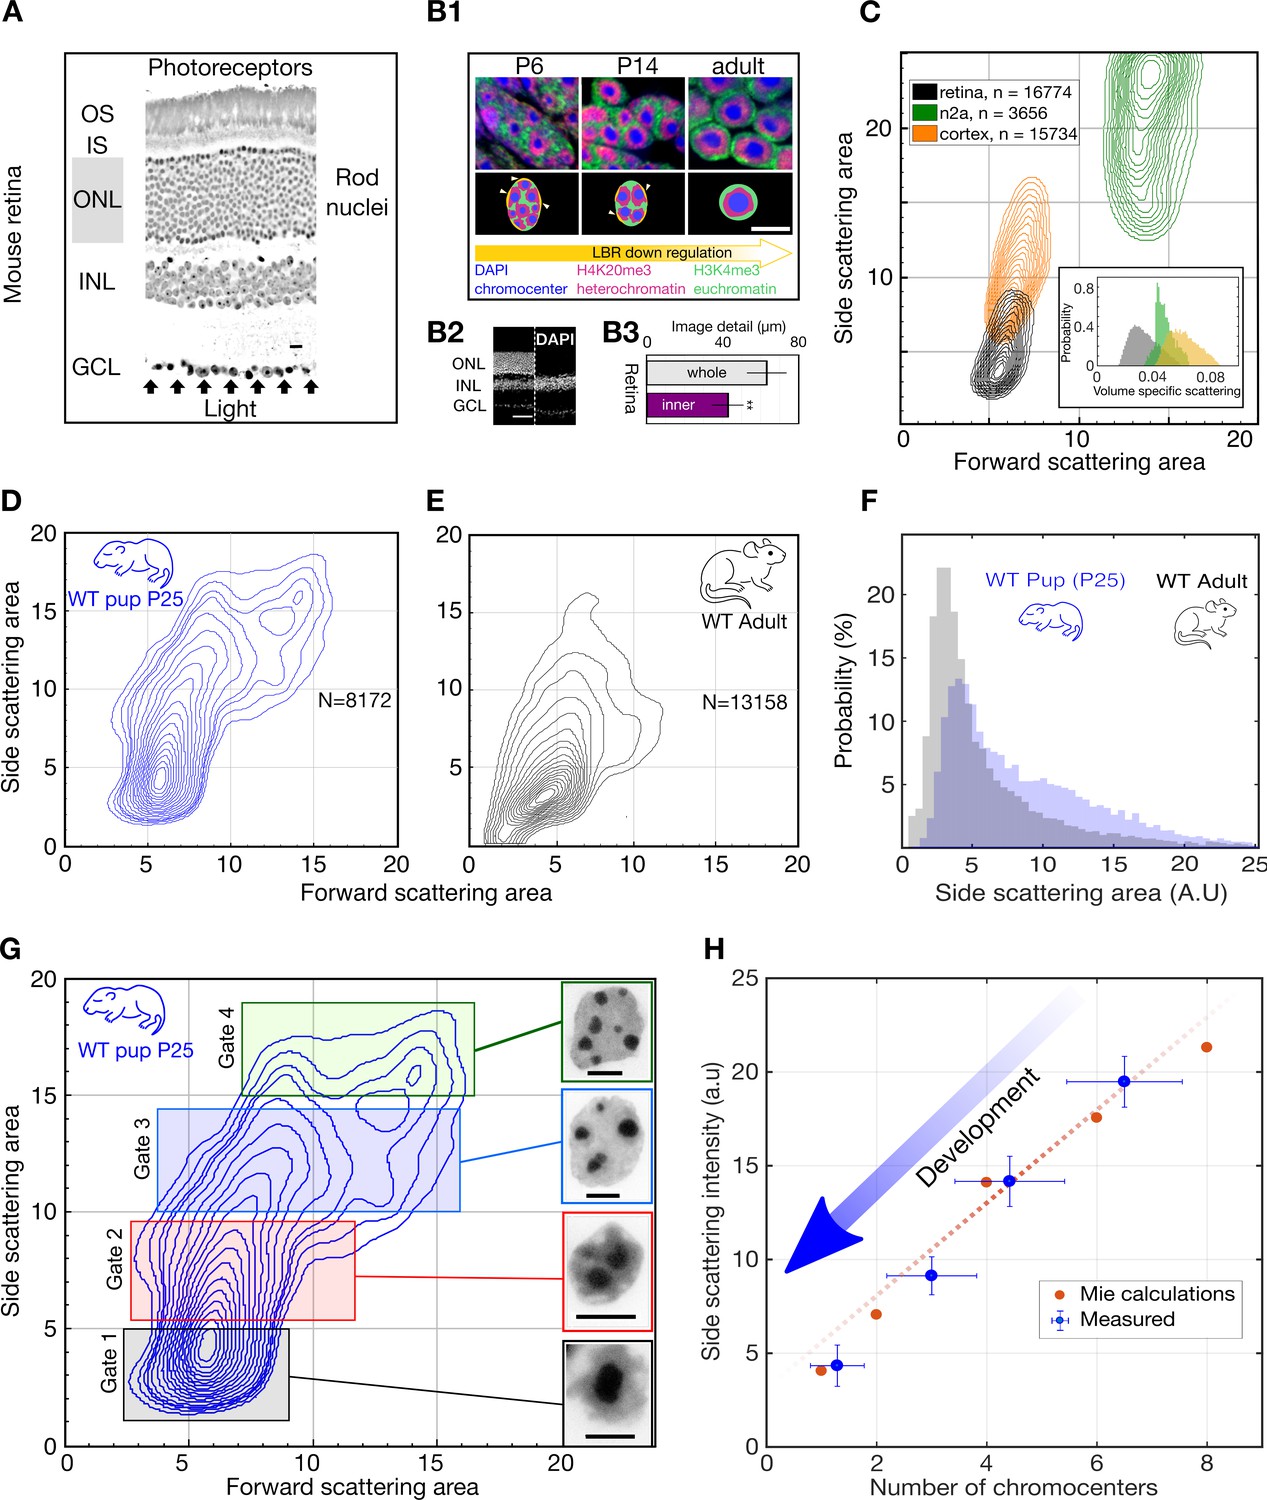
Light scattering by retinal nuclei reduces with chromocenter number during development.
(A) Longitudinal section showing the path of light through the mouse retina, including the rod nuclei dominated outer nuclear layer (ONL). Ganglion cell layer (GCL), inner nuclear layer (INL) and outer nuclear layer (ONL) and the inner and outer segments (IS and OS). (B1) (top) Downregulation of the lamina tether LBR (yellow) enables fusion of mobilized chromocenters and thereby an architectural inversion of mouse rod nuclei. (bottom) FISH images of rod nuclei stained with DAPI (blue) showing the dense chromocenters, LINE rich heterochromatin (H4K20me3, magenta) and SINE rich euchromatin (H3K4me3, green) (B2) DAPI section of WT mouse retina in comparison to a Rd1/Cpfl1-KO mouse retina showing the presence of only the inner retina. (B3) Quantification of image transmission shows that the inner retina alone (Rd1/Cpfl1-KO, N = 5) transmits approximately 50% more image detail than the full retina (N = 11), suggesting significant image degradation in the thick outer nuclear layer. (C) FACS scattering profiles comparing retinal neurons, cortical neurons and N2a neuroblastoma cells showing lower light scattering properties of retina neurons. (Inset) Volume-specific light scattering is significantly reduced in the retinal cell nuclei. (D, E) FACS scatter plot for isolated retinal nuclei from WT developmental stage week three pup (P25) and adult mice demonstrating stronger large angle scattering by the P25 nuclei. (F) Histogram of side scattering in adult and P25 retina depicting a higher side scattering for the developing retinal nuclei. (G) Sorting of developmentally maturing nuclei according to different side scattering signal. Insets show representative examples of Hoechst stained nuclei in the corresponding sort fractions. The rectangles represent sorting gates for microscopy analysis. (H) Quantification of reduced scattering with chromocenter number is sufficiently explained by a wave optical model of light scattering n = 38 nuclei. (Error bars in (H) show s.d.) Scale bars (A) - 10 μm. (B1), G - 5 μm, (B2) – 50 µm.
Figure 1—figure supplement 1
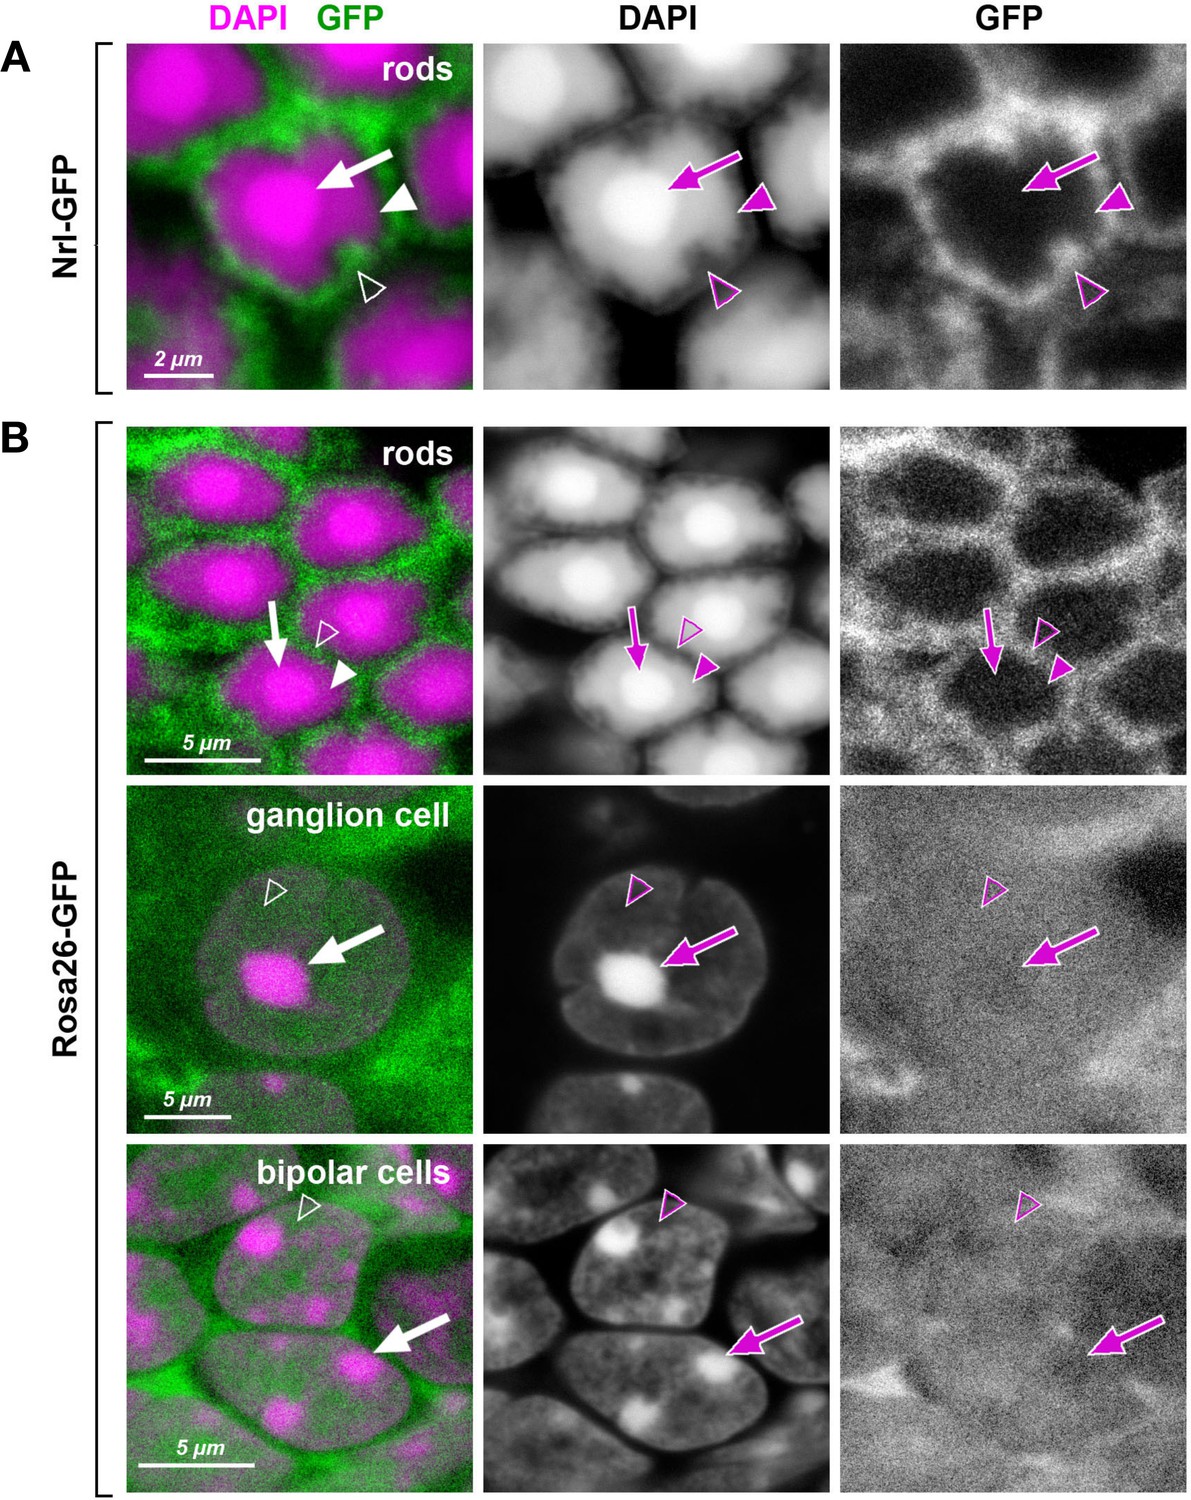
Heterochromatin in mouse rod nuclei exhibits unusual dense packing.
Retinal cells of transgenic mice expressing GFP (green) under rod-specific Nrl promoter (A; Akimoto et al., 2006) and under control of the ROSA26 promoter (B; Ivanova et al., 2005). In inverted rod nuclei, the chromatin of the central chromocenter (arrows) and the surrounding shell of LINE-rich heterochromatin (arrowheads) is packed so densely that free molecules of GFP do not penetrate into these nuclear regions. In contrast, loosely packed euchromatin in the peripheral nuclear shell (empty arrowheads) allow GFP penetration. In conventional nuclei, exemplified by ganglion and bipolar cells, the entire nucleoplasm, regardless to chromatin nature, is penetrable for GFP with chromocenters showing slightly less permeability (arrows). Nuclei are counterstained with DAPI (magenta). Single confocal sections.
Figure 1—figure supplement 2

Reorganization of rod nuclear architecture in the course of postnatal retinal development (A) and in transgenic rods expressing LBR (B, C).
(A) Difference in nuclear architecture of terminally differentiated rods (adult,) and photoreceptor progenitors (P6) is highlighted by GFP (green) expressed under Nrl promoter and freely distributed through nucleoplasm and cytoplasm. During first 4–6 weeks of postnatal development, conventional nuclear architecture of rod progenitors (arrow), characterized by multiple chromocenters adjacent to the nuclear periphery, is gradually rearranged into inverted one of fully mature rods (arrow) with a single central chromocenter surrounded by LINE-rich heterochromatin. (B, C) Rod nuclei ectopically expressing LBR (green) in adult TG-LBR retina have conventional nuclear organization with chromocenters adjacent to the nuclear lamina (B) and euchromatin occupying the nuclear interior (C). Nuclear lamina is stained with antibodies to lamin B (B) and euchromatin is highlighted by H4K5ac staining (C). Note that only proportion of rods in TG-LBR retina express LBR and thus maintain conventional nuclei (arrows). Nuclei of rods not expressing LBR are lacking peripheral tethers of heterochromatin and ultimately undergo inversion (arrowheads). Nuclei are counterstained with DAPI (magenta). Single confocal sections.
Figure 2 with 2 supplements
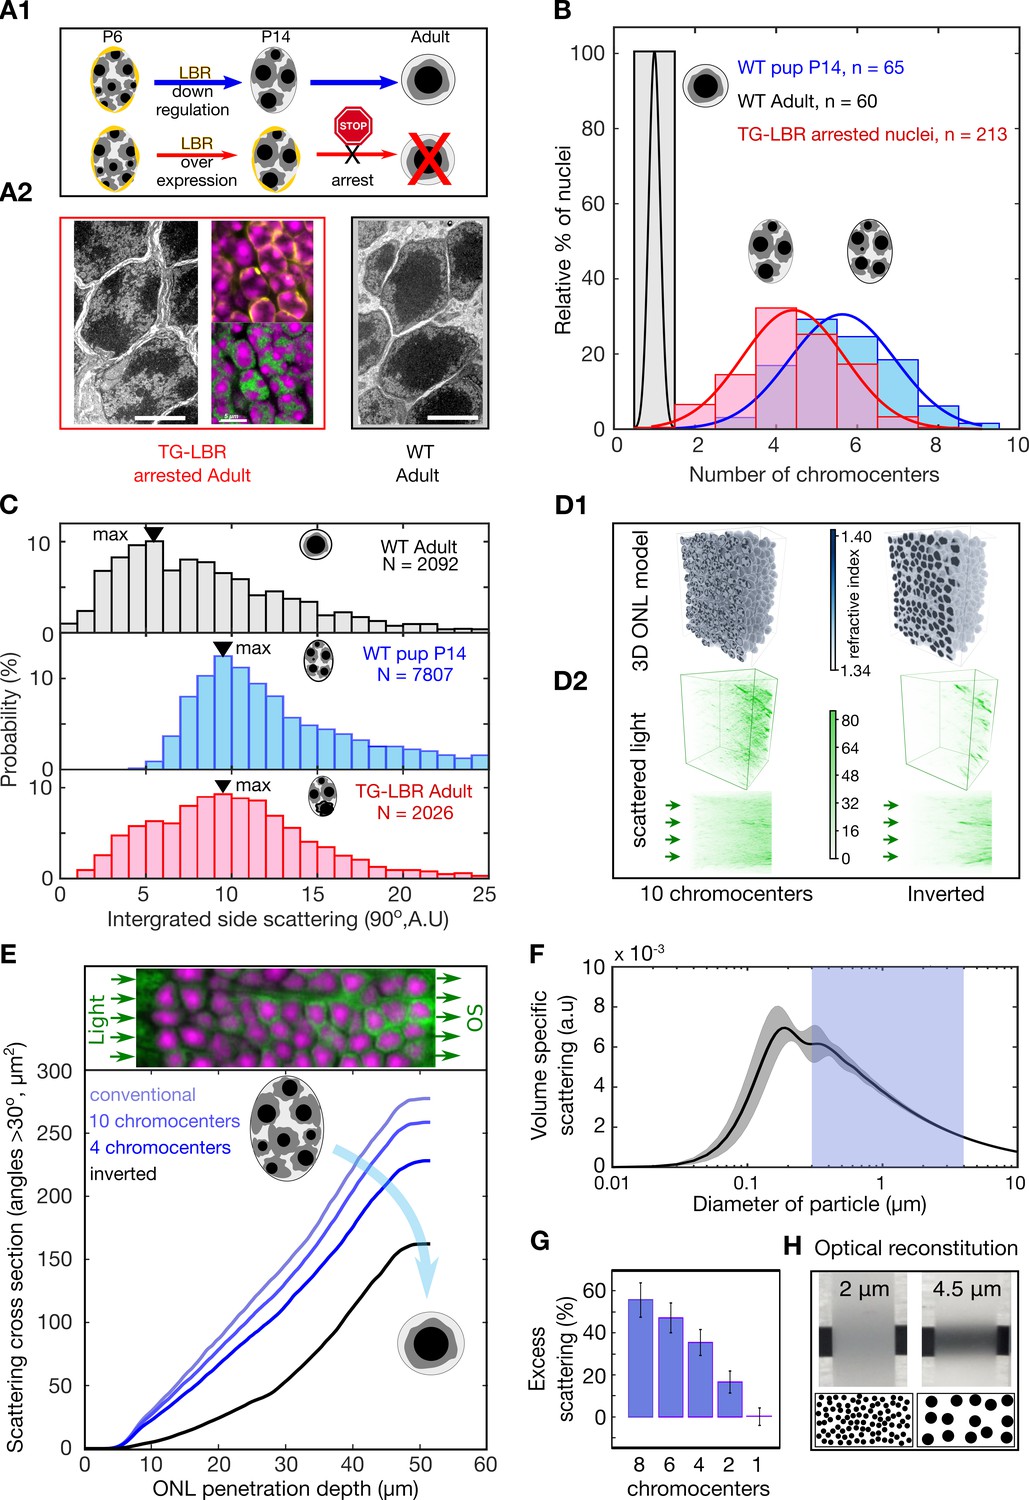
Developmental arrest of chromocenter fusion increases light scattering from rod nuclei in measurements and tissue simulations.
(A1) Schematic of the normal rod nuclear WT development and inversion arrested nuclei by LBR overexpression. (A2) EM images illustrating different electron densities in the euchromatic and heterochromatic phase underlying their refractive index (RI) differences (scalebar 5 μm). (mid-top) Immunostaining of overexpressed of LBR tethers (yellow), and high-density heterochromatin (DAPI, magenta). (mid- bottom) Heterochromatic chromocenters (DAPI, magenta) and euchromatin (H4K5ac, green) (B) Chromocenter number distribution in LBR overexpressing rod nuclei is drastically different from WT mice, and similar to a developing WT pup (P14). (C) Side scattering assessed by FACS for TG-LBR retina nuclei is higher than that of WT nuclei and comparable to that of a WT P14 nuclei with similar chromocenter numbers. Note the shift of peak value upon LBR overexpression. (D1) 3d RI distribution mapped onto anatomically faithful volumetric ONL images. WT inverted architecture (right, top) and early developmental state (left) (simulation). (D2) (top) Differential simulations of light propagation in the ONL, using same positions and shapes of about 1750 nuclei, but varying chromatin distributions. (bottom) Maximum projection illustrating greater proportions of scattered light (angles > 30 deg) in the ONL with multiple chromo-centered nuclei. (E) Quantitative analysis of this data. (F) Angle weighted volume-specific scattering strength for nuclei models evaluated by Mie scattering theory. (G) Excess scattering occurring in multi-chromocenter nuclei models. (H) Chromocenters scattering reconstituted in an emulsion of silica spheres in glycerol-water mixture. Pictograms reflect accurate number ratio of spheres.
Figure 2—figure supplement 1
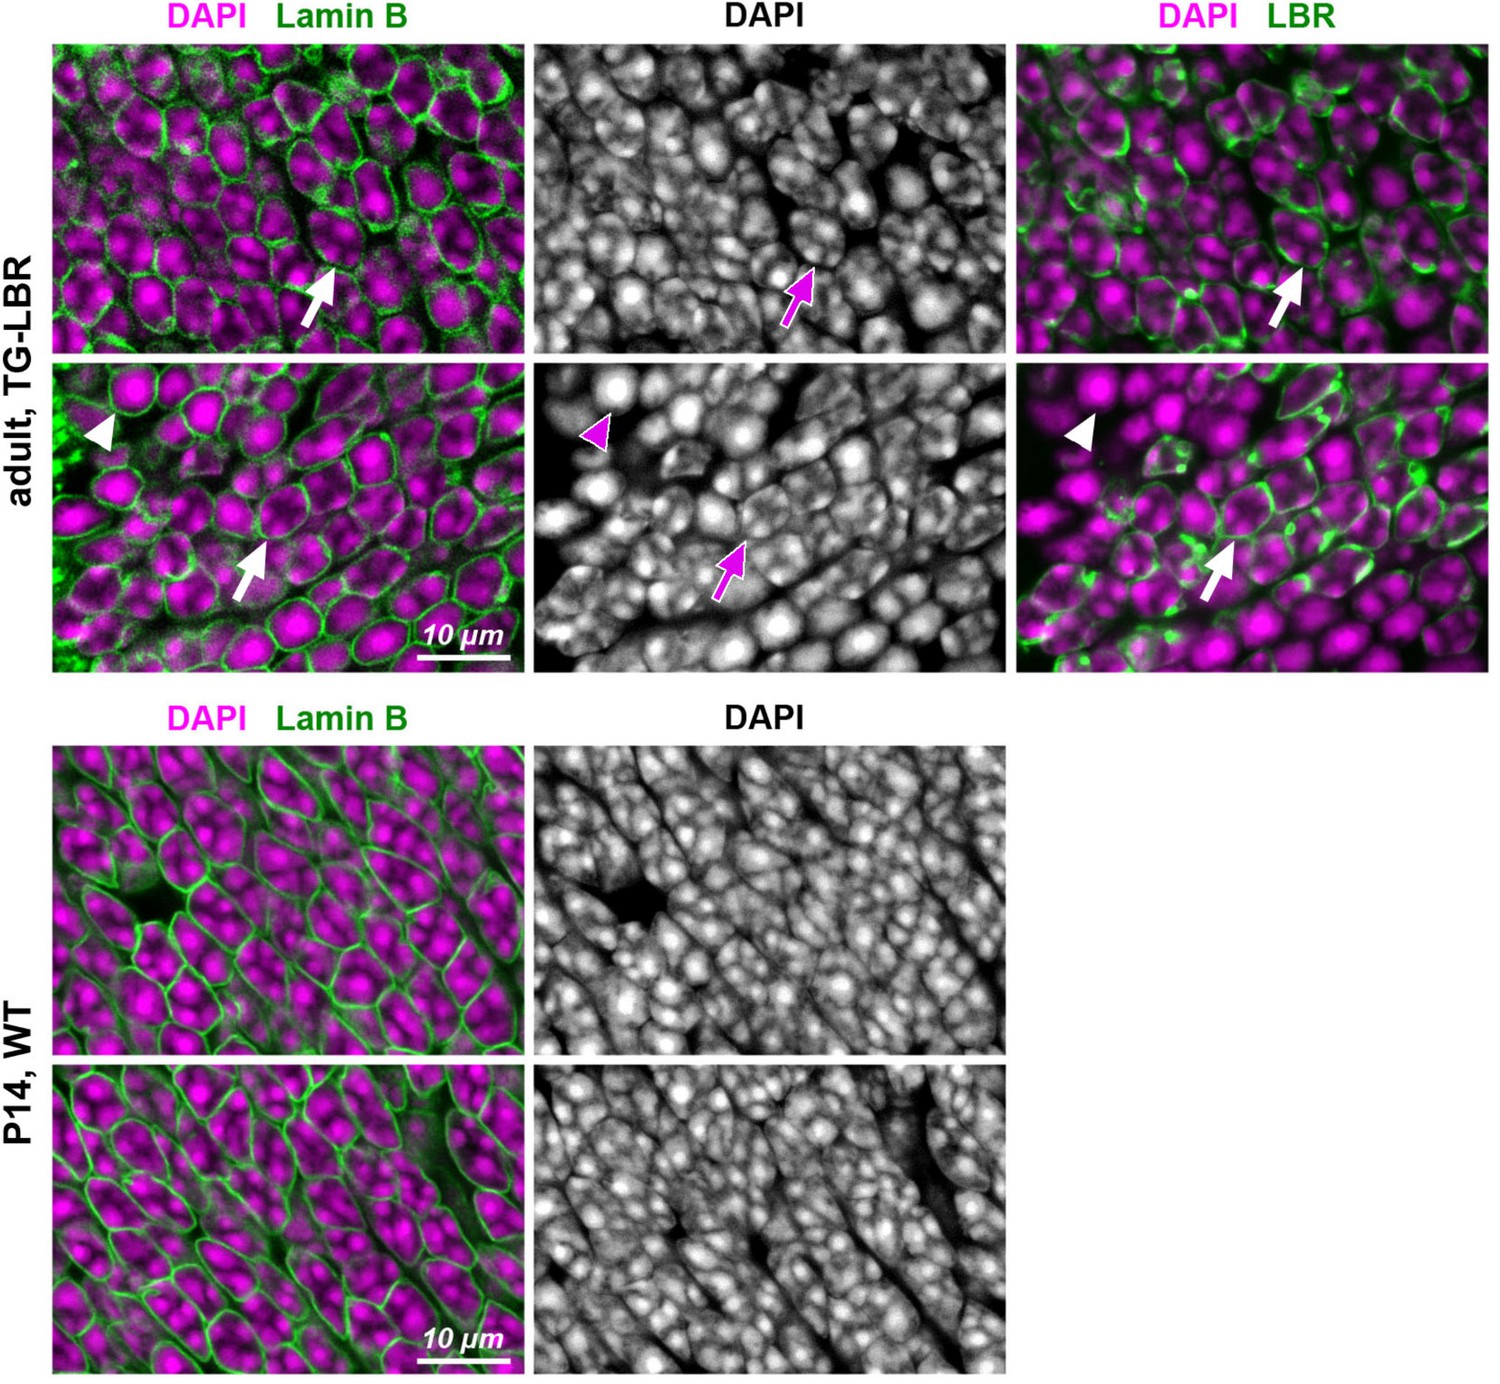
Distribution of chromocenters in nuclei of adult rods transgenitically expressing LBR in comparison to nuclei of P14 WT rods.
Exemplified areas of ONL in adult TG-LBR (upper raw) and P14 WT (bottom raw) retinas. Note that only a proportion of rods in transgenic retina express LBR (see also Figure 1—figure supplement 2). Nuclei of rods expressing LBR exhibit conventional chromatin arrangement with chromocenters adjacent to the nuclear envelope (arrows); rod nuclei not expressing LBR remain inverted with one central chromocenter (arrowheads). P14 WT rod nuclei have still conventional nuclei, although exhibit signs of ongoing inversion with massive chromocenter fusion. Immunostaining for lamin B is used to outline nuclear border (green, left panel); immunostaining for LBR is used to highlight transgenic rods (green, right panel); nuclei are counterstained with DAPI (magenta). Single confocal sections.
Figure 2—figure supplement 2
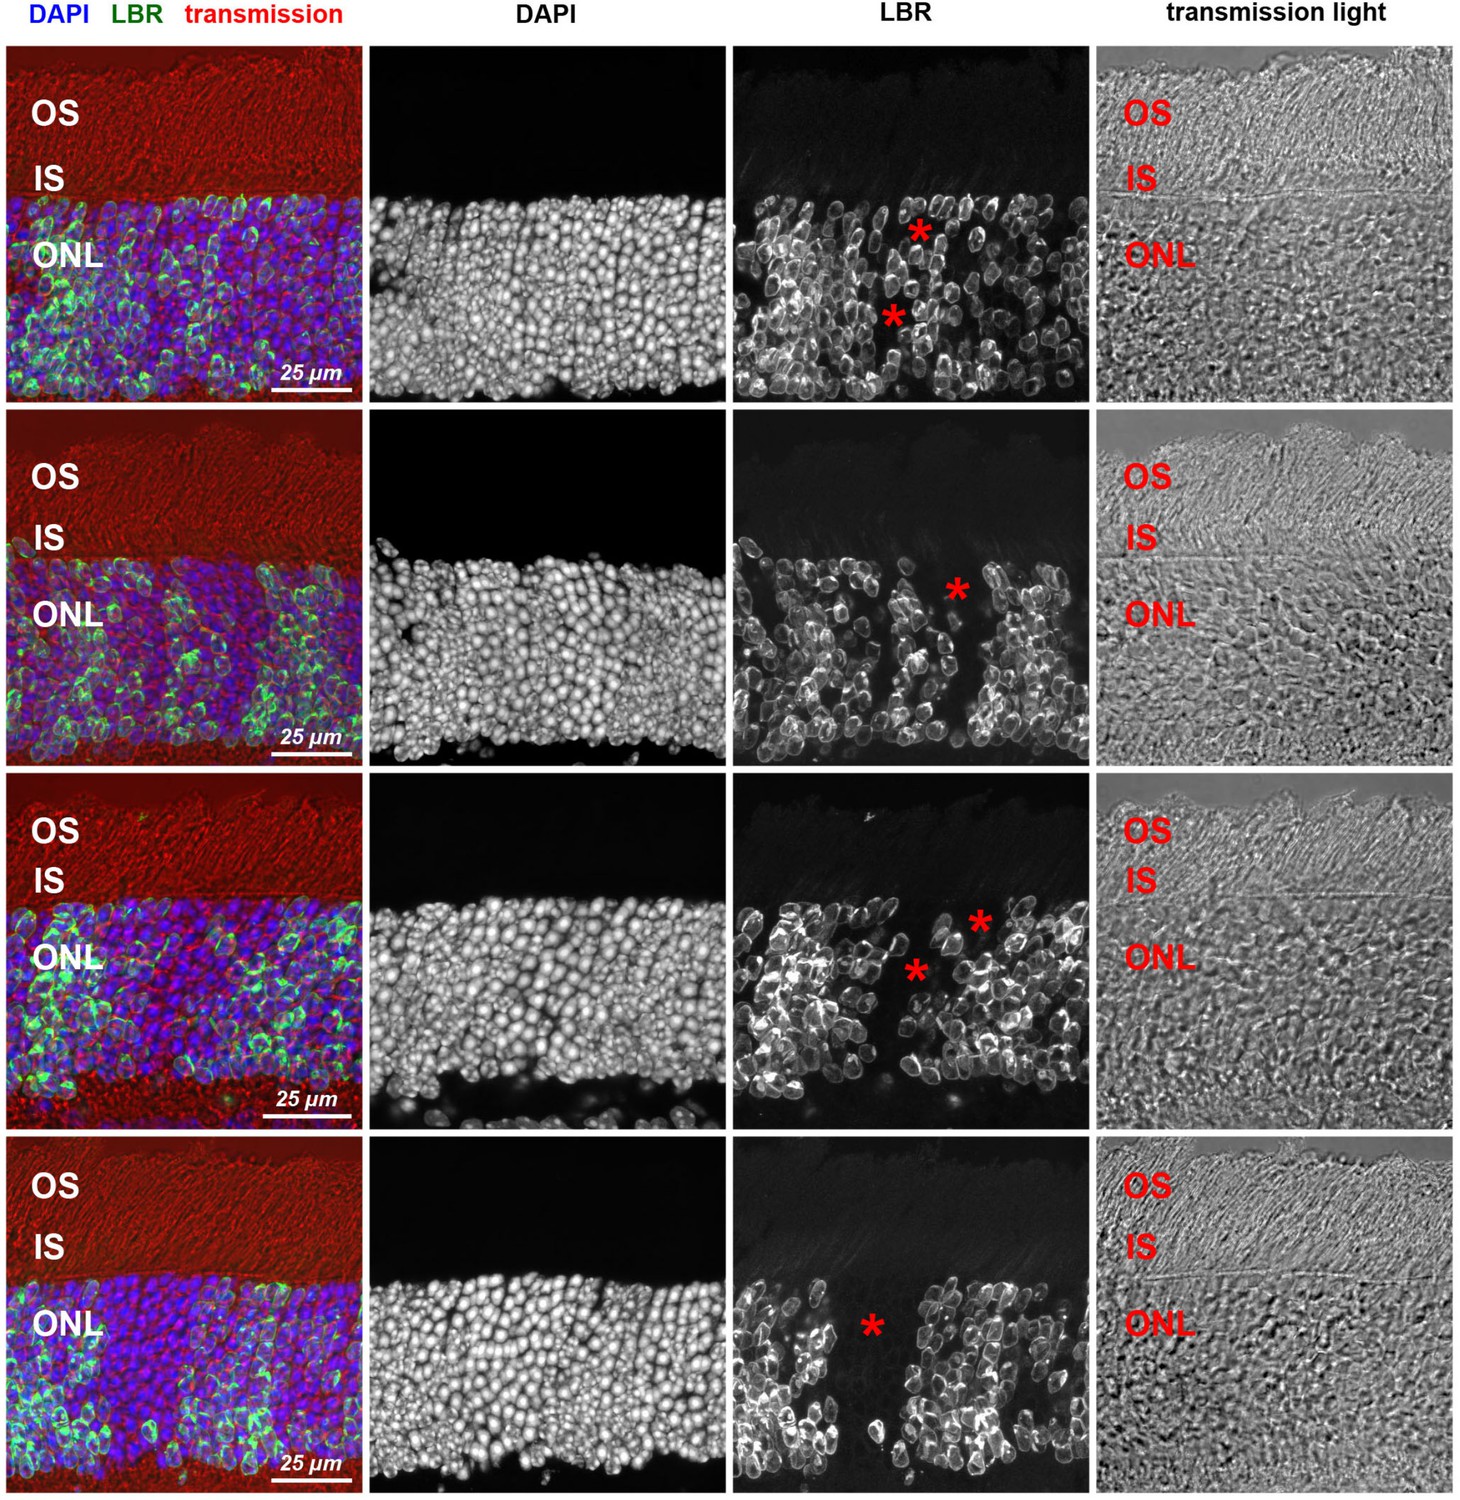
Transgenic expression of LBR does not influence rod photoreceptor structure.
Retina areas with LBR-positive and LBR-negative (asterisks) rod clones demonstrating unaltered stratification. The three photoreceptor layers, represented by photoreceptor perikarya (ONL), cytoplasm of inner segments (IS) and dendritic ends of outer segment (OS), are preserved in TG-LBR retina. Immunostaining of LBR (green); nuclear counterstain with DAPI (blue). Maximum intensity projections of 5–7 µm confocal stacks.
Figure 3 with 2 supplements
Nuclear inversion improves retinal contrast transmission characteristics.
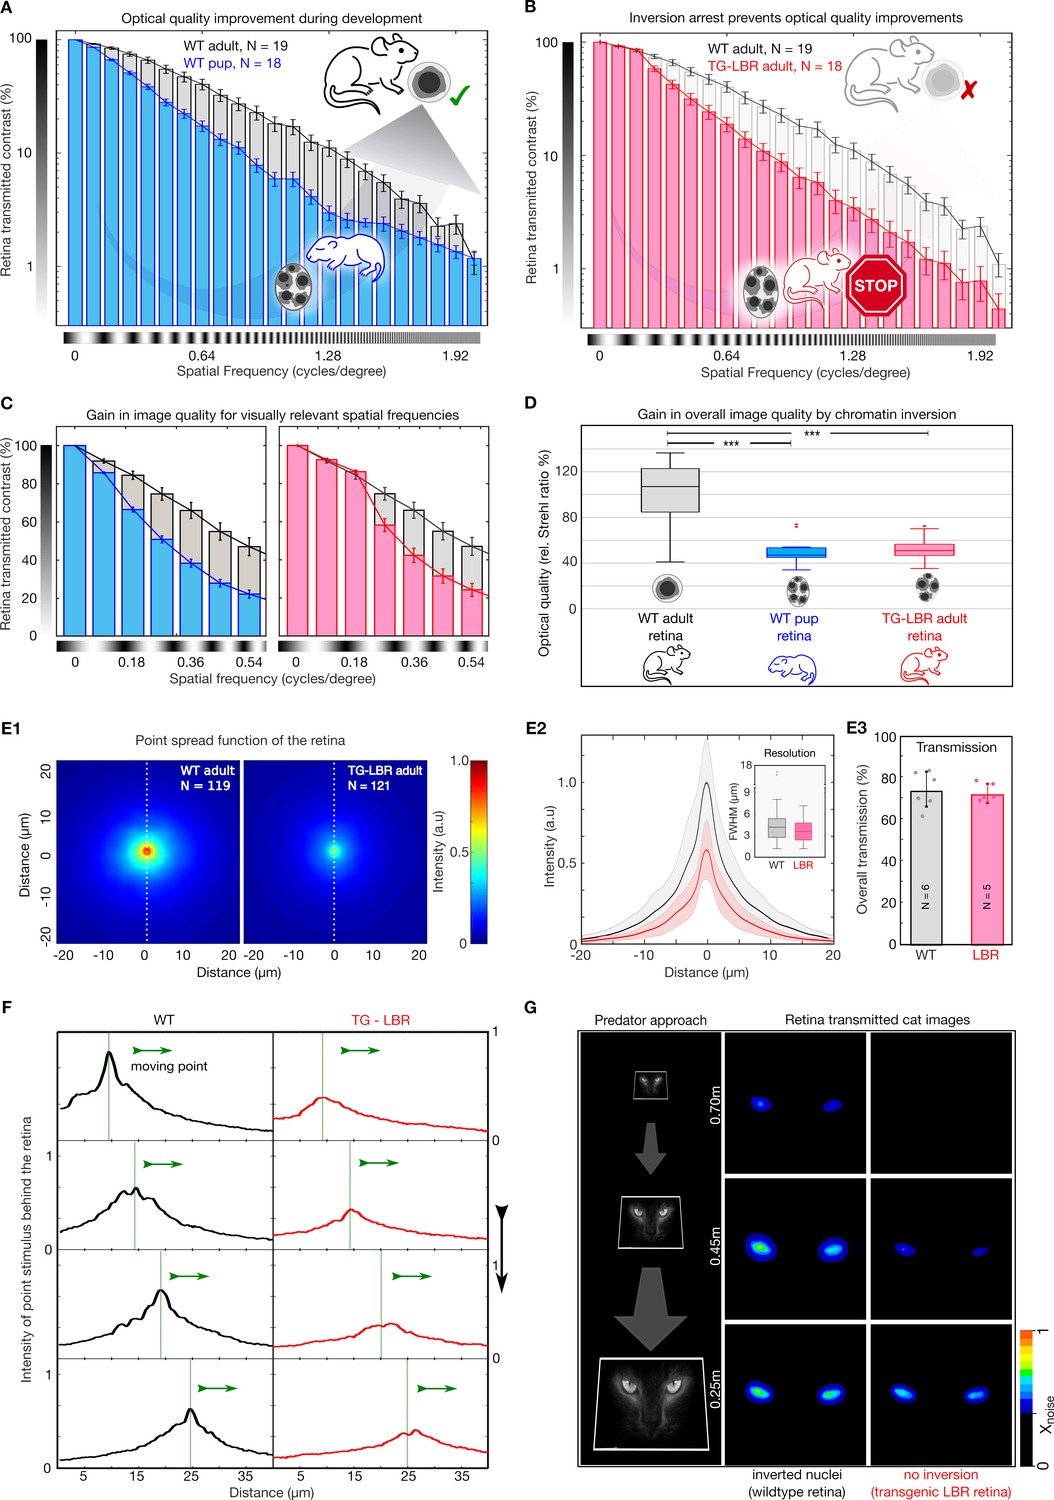
(A) Retinal contrast transmission increases during developmental stages of nuclear inversion, as experimentally revealed by measurements of retina-transmitted sinusoidal stripe patterns (modulation transfer functions). Developmental stage P12-14 (N = 18), compared to wildtype adult (N = 19 animals), note log scale. (B) These improvements in optical quality do not occur in retinae in which rod nuclei are transgenitically arrested in development and maintain 4–5 chromocenters. TG-LBR mouse (N = 18 animals) compared to WT reference (N = 19 animals), N = 1950 images in total. Mean + /- 95% CI. (C) Retinal contrast transmission at visually relevant spatial frequencies showcasing on an average ~49% and~37% better contrast transfer by the WT Adult retina (grey) in comparison to the WT-P14 pup (blue) and TG-LBR Adult (red) respectively. (D) The optical quality improvement of the retina (relative Strehl ratios), as caused by nuclear inversion, is two-fold (p=1.1880e-08 - WT adult vs WT pup, 3.4055e-08 - WT adult vs TG-LBR adult, 0.4761 - TG-LBR adult vs WT pup). (E1) Point spread function (PSF) for WT and LBR adult retinae by projection of 3 µm point light stimuli through the retina, N = 240 measurements in total six retinae. (E2) Intensity quantification along the white dotted line. Shaded region shows ±1 sd. Comparable resolution in transmitted images as assessed by the FWHM of the psf (inset). (E3) Near identical diffuse light transmission by both WT and TG-LBR retinae (n = 2 animals each, mean ± s.d.) (F) Intensity of a moving, retina-transmitted point stimuli for WT (black) and TG-LBR mouse (red). (G) Image-series of a cat approach as seen through the retina of mice, WT and transgenic genotype from various behaviorally relevant distances at the same vision limiting (arbitrarily chosen) signal to noise level. Consistent intensity differences of two or more color shades indicate significantly better predator detection potential for WT mice. Data magnified for clarity.
Figure 3—figure supplement 1
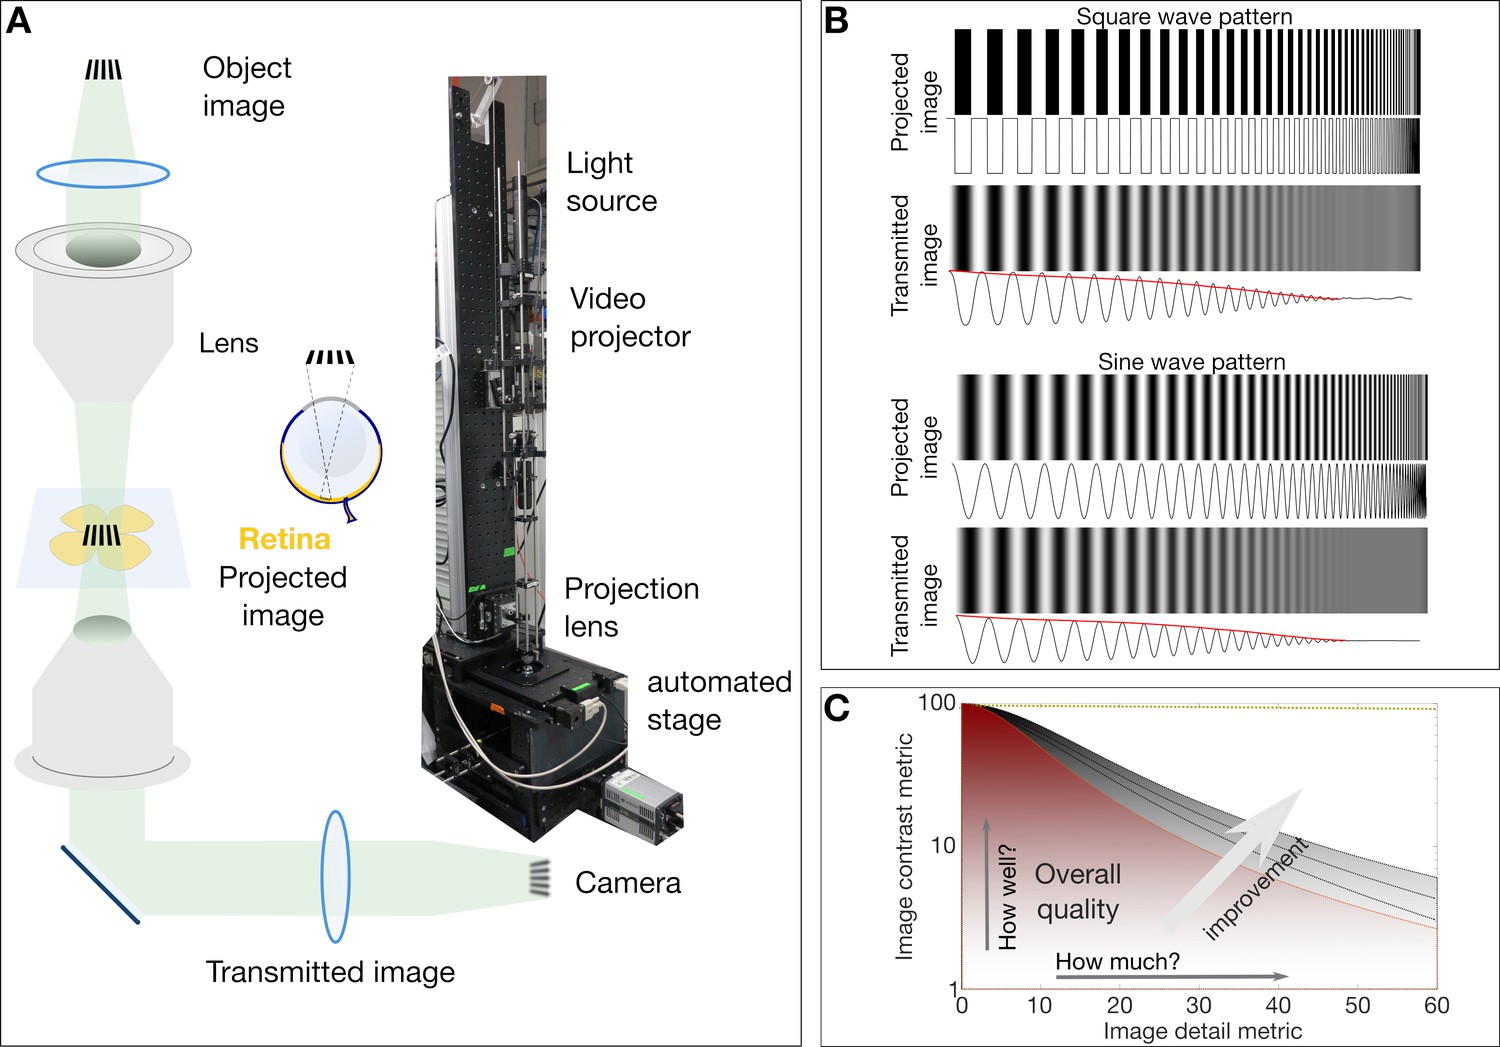
Simplified schematic of the custom micro-projection setup and the concept of modulation transfer function.
(A) Simplified schematic and photo of the micro projection setup indicating the image object. The projecting lens functions like the biological eye (same NA = 0.45) to project the image on to the retina. The transmitted image is collected by a second lens and recorded on a camera. (B) The loss of contrast inherent to imaging systems (compare contrasts and intensity signals in projected and transmitted images). The envelope of the gradually degreasing signal (shown in red) is essentially the transfer function of the imaging system. The study of the contrast at various image details and fineness results in the MTF curves as shown in (C). (C) A typical MTF plot of image contrast vs image detail parameters. In this depicted case the overall image quality is proportional to the area under the curve that can yield the Strehl Ratio (a combined metric of how well and how much of the image is visible).
Figure 3—figure supplement 2
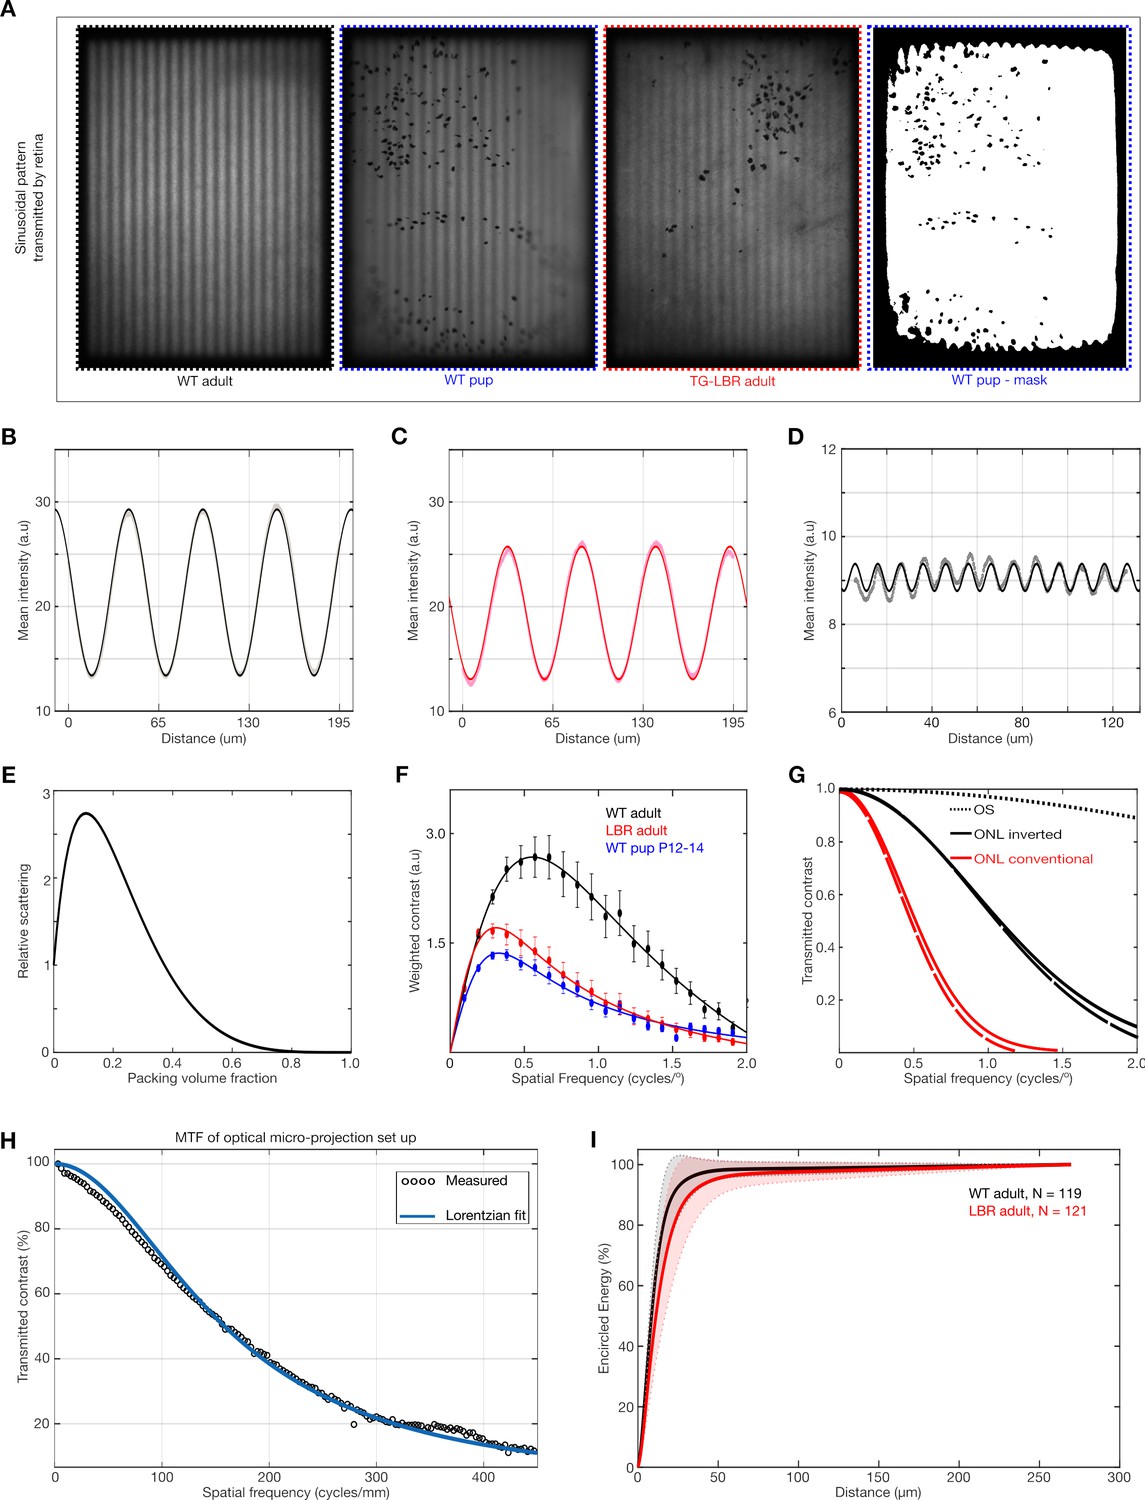
Modulation Transfer Function and its relation to light scattering and visual perception.
(A) Representative images of sinusoidal patterns transmitted by the different retinae and a mask image (far right) illustrating the ROI used for contrast analysis. (B, C) Fitting of pure sinusoidal curves to the measured intensity in a WT and TG-LBR mouse retina at 0.1cyc/deg. The greater transmission of contrast is evident from the amplitude of the sine waves in the WT retina. (D) Illustration of robustness of the sine curve fitting for very low residual contrast (~3%) and very fine image details. (E) Dependent scattering effects due to close packing of scatterers for various volume fractions. (Calculations based on models described in literature). (F) Frequency weighted contrast transmission curves for the evaluation of the Strehl Ratio. (G) Estimates of comparison of MTF from modelling and simulation of light scattering by outer nuclear layer (ONL) and outer segments (OS) illustrating the dominant effect of the packed nuclei as opposed to the outer segments. (H) Modulation transfer function of the optical micro-projection set up. (I) Encircled energy (EE) plot. EE under the retinal PSF converges to the same value for both WT (black) and TG-LBR retinae (red) Shaded regions show standard deviation. N = 240 measurements in total six retinae.
Figure 4 with 3 supplements
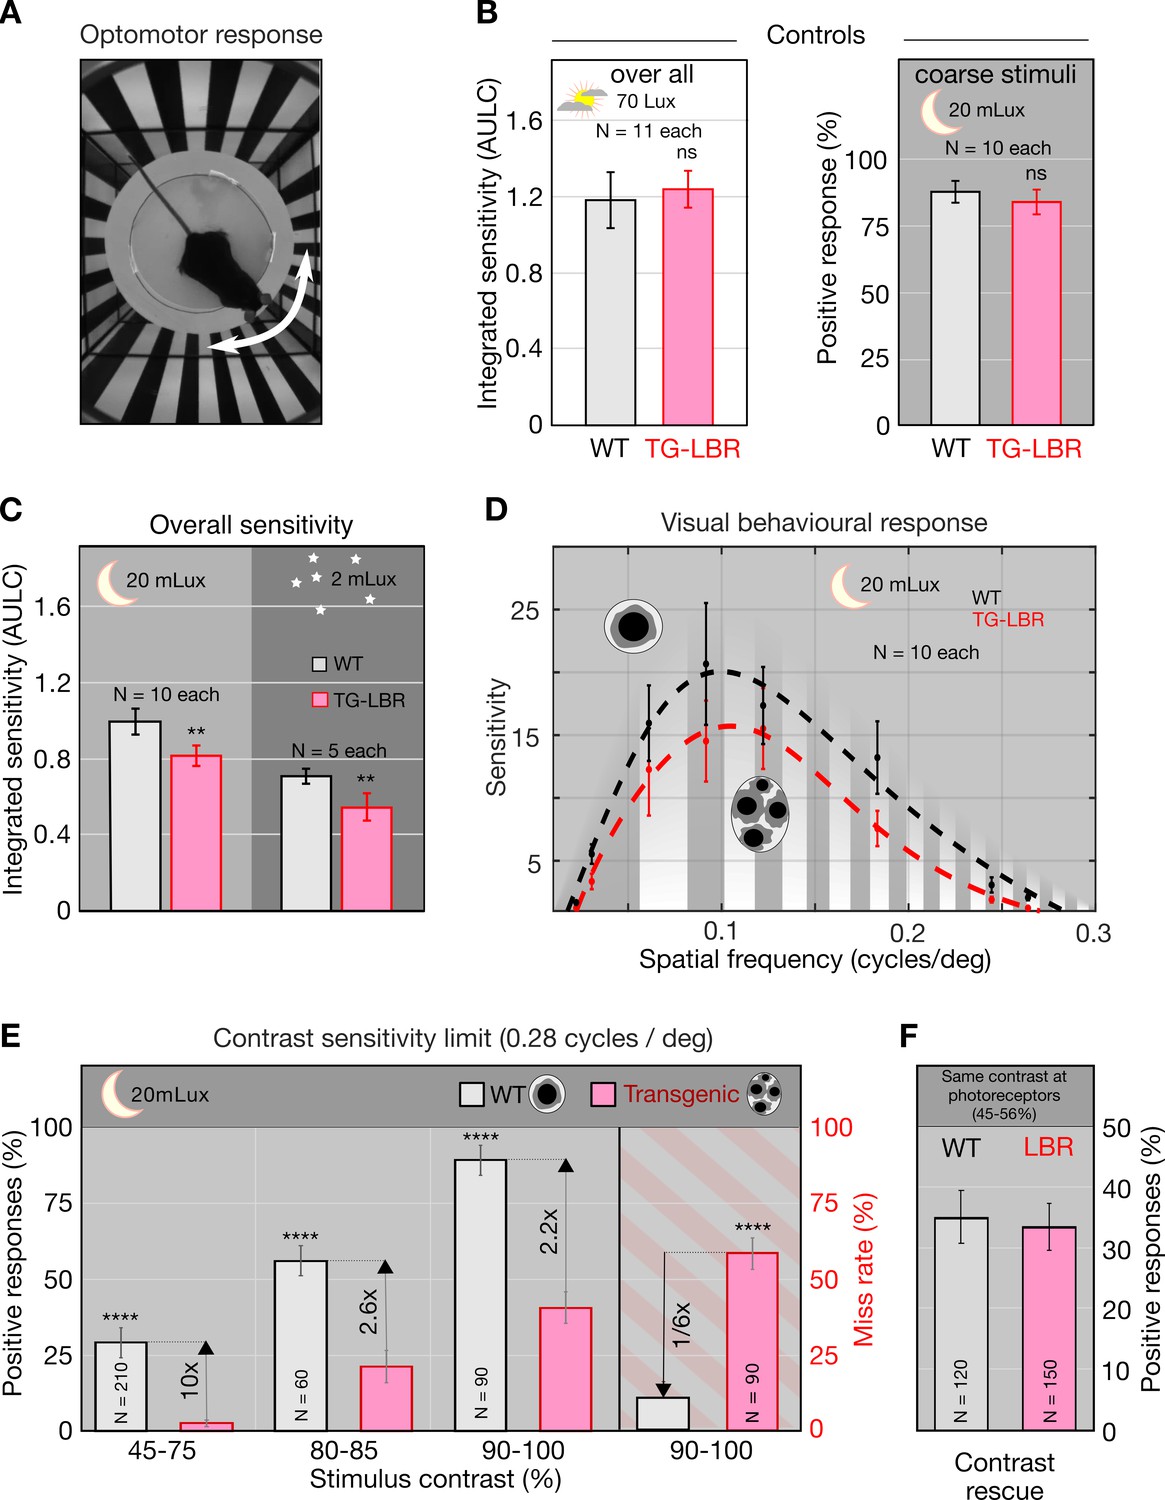
Nuclear inversion improves contrast sensitivity in the dark.
(A) Illustration of the automated optomotor response experiment to assess the visual performance of mice, shown a 0.06 cycles/deg. (B) Photopic control condition and scotopic coarse stimulus (0.06cycles/deg) control showing no significant difference between WT and TG-LBR mice (p=0.5307, p=0.2842, t-test, Chi-square test). (C) Under scotopic conditions (20 and 2 mLux) the overall sensitivity of the WT mice is 22% and 29% higher than TG-LBR mice (area under log contrast sensitivity curve, AULC) mean+/-95% CI, (p=0.00081, 0.0047, two sample t-test). (D) Contrast sensitivity curves evaluated at 20mLux light intensity. Significant differences appear at angular sizes above 0.15 cycles/deg (p=0.038, two sample t-test). (E) Behavior differences are strongest for stimuli close to the visual threshold. Here the mice in possession of the inverted rod nuclei (WT) possess an up to 10 times higher sensitivity at intermediate contrasts (29% vs 3% correct response in 45–75% contrast range), and a six times reduced risk to miss a motion stimulus at high contrasts (10 vs 59% failure in detection, 0.26–0.3 cycles/deg), (p<0.0001, Chi-square test) mean ± s.d. (F) Rescue experiment demonstrating sufficiency of improved retinal contrast transmission to explain improved sensitivity. Adjusting the level of contrast at the photoreceptor level (by pre-compensation of differential contrast loss) restores sensitivity of TG-LBR mice. N indicates number of individual trials of 10 animals together for each mouse type.
Figure 4—figure supplement 1
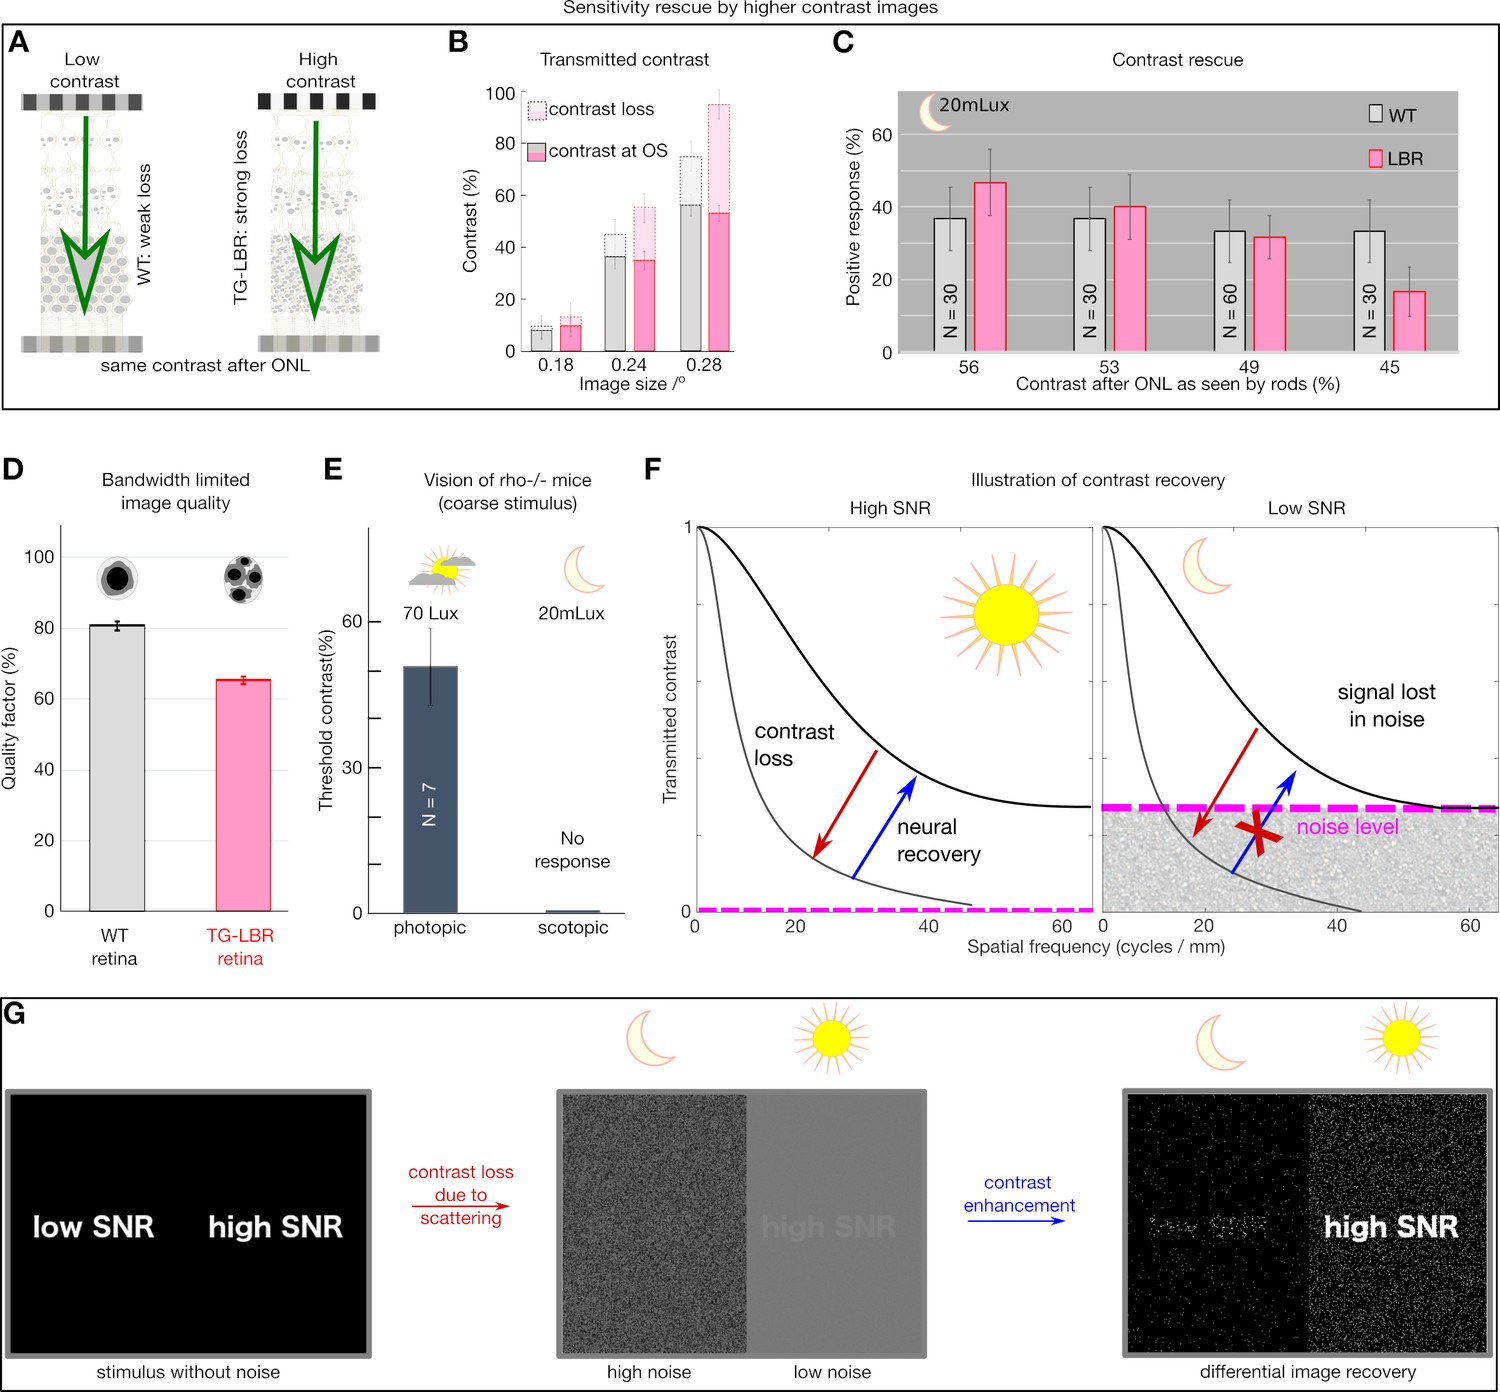
Retina transmitted contrast directly impacts visual behavior.
(A) Illustration of the role of retina as an information filter and contrast loss buckets for WT and TG-LBR retina. (B) Stimuli contrast for OMR response presented such that after corresponding loss in the WT and TG-LBR retinae, the outer segments receive comparable contrast of ~9%, 36% and 54% at 0.18, 0.24, 0.28 cycles/deg respectively for transduction. (C) The visual response of the TG-LBR mouse is recovered to the level of WT mouse by a stimulus with higher input image contrast compensating for the greater loss due to its ONL with highly scattering non-inverted nuclei. (D) Estimates of image quality for the corresponding mice based on the MTF of WT and TG-LBR retina at relevant range of visually sensitive image details (0.15–0.36 cycles/degree). (E) Control to verify the scotopic illumination settings of the OKT setup, depicting no response for a rhodopsin KO mouse. (F) Day and night vision differ significantly in the signal to noise level (Warrant, 1999), and loss of signal below the noise floor is lost from an information point of view and cannot be recovered. (G) Illustration of the contrast recovery for stimulus under low and high noise conditions. The scattering induced contrast loss and image degradation in a noisy low light environment cannot be recovered by any contrast enhancement mechanism.
Figure 4—figure supplement 2
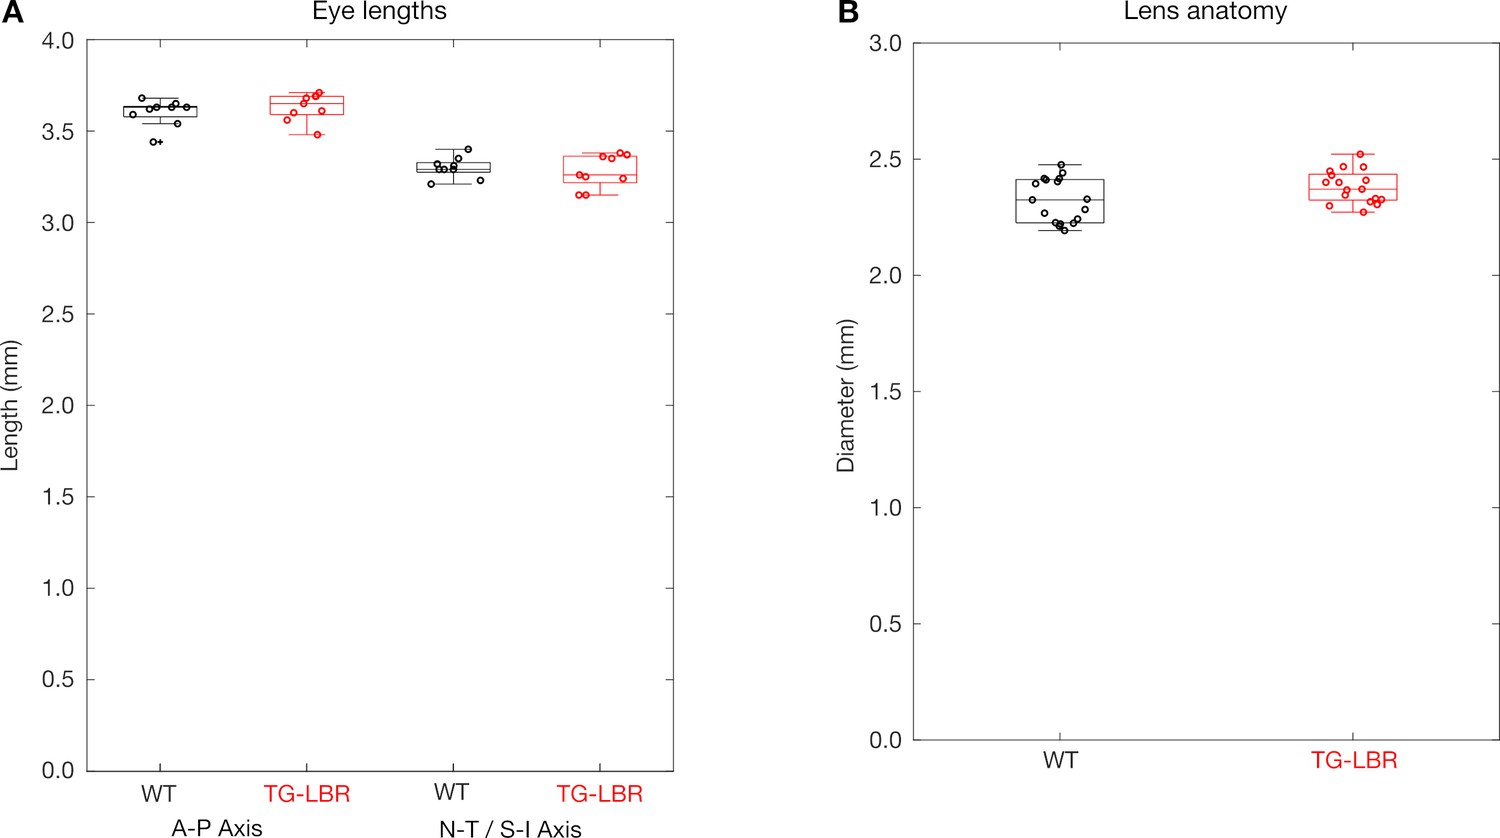
Ocular parameters of WT and TG-LBR mice are comparable.
(A) The overall size of the eye as measured by length of the eye along the anterior - posterior (A–P) axis and the naso-temporal (N–T) or superior-inferior (S–I) axes (N = 9 eyes each) and (B) the measured diameter of the lens (N = 19 lens each) are comparable for WT and TG-LBR adult mice.
Figure 4—figure supplement 3
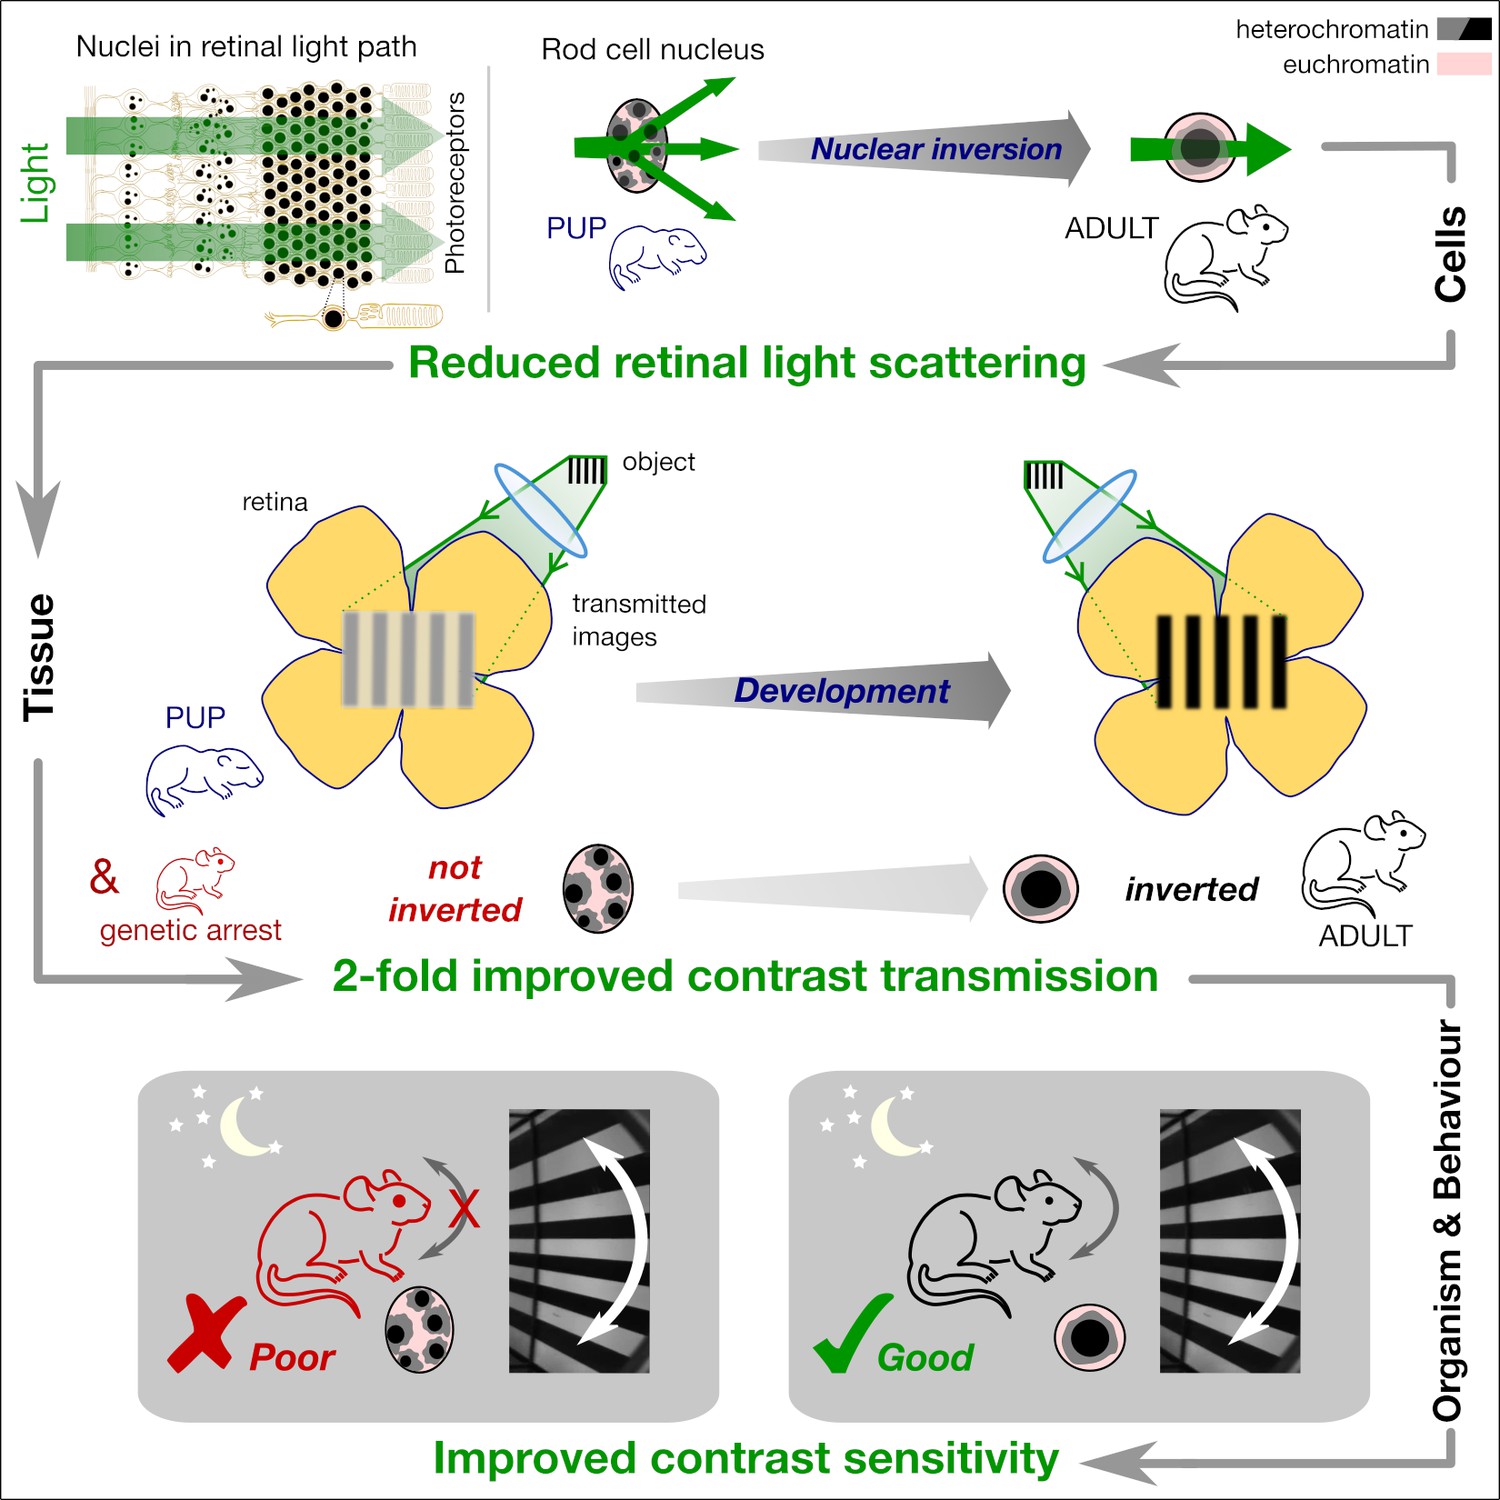
Model of nuclear adaptation enhancing nocturnal vision.
The abundance of rod nuclei in the nocturnal mammalian retina presents a significant barrier to light. The fusion of heterochromatic chromocenters reduces the volume-specific scattering mainly at large angles. This results in a reduced light scattering at the tissue level leading lower scattering induced veil. Reduction in light scattering leads to a near two-fold improvement in the contrast transmission by the retina. Improved image quality transmitted by the retina finally enables greater contrast sensitivity exclusively at nocturnal conditions.
Author response image 1
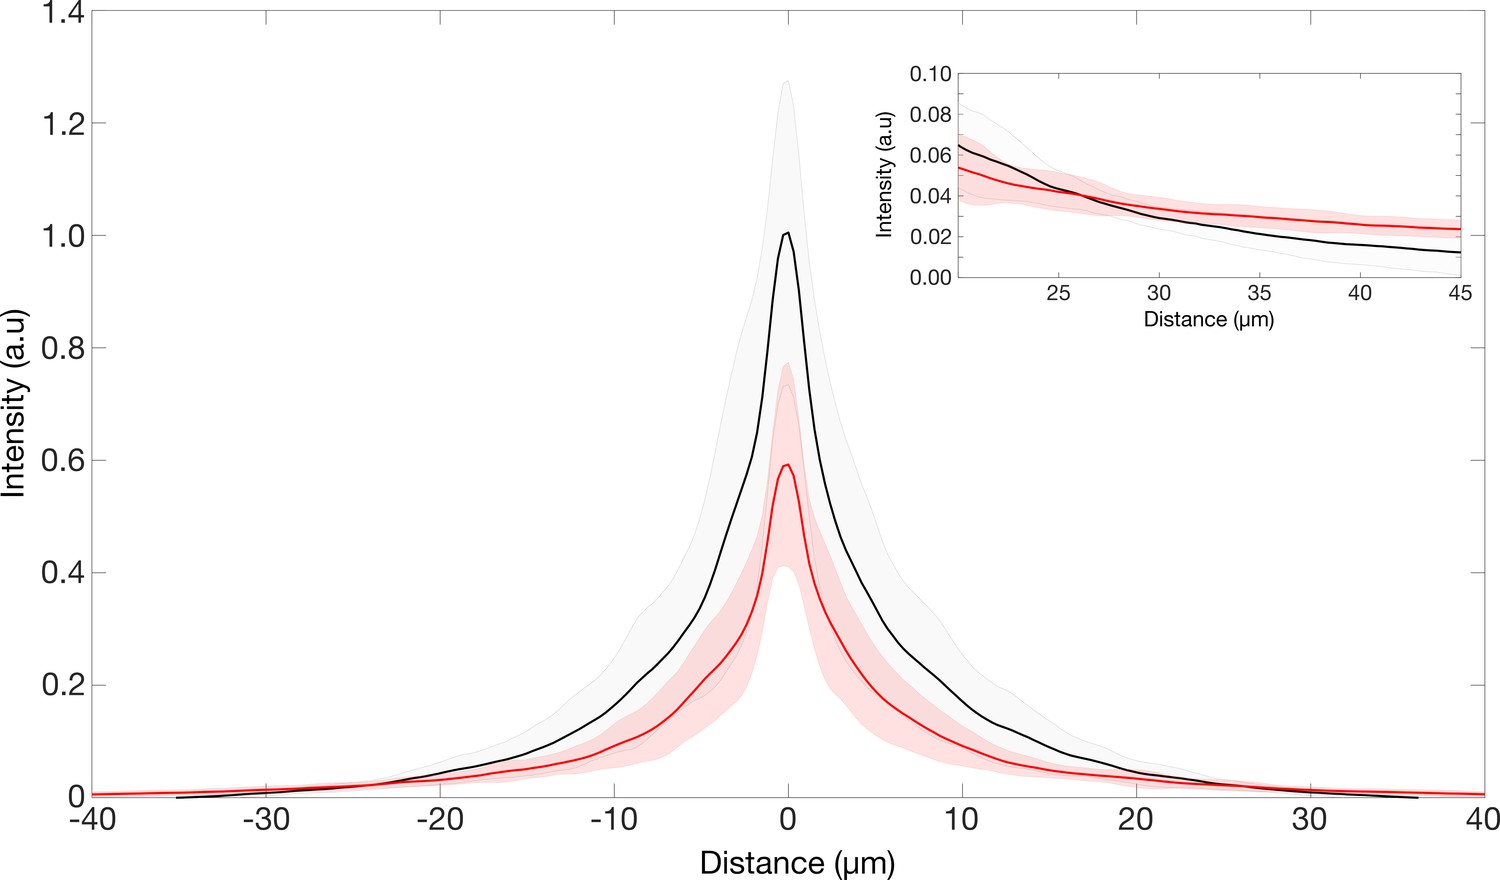
Point spread function of the retinae.
PSF intensities of retina transmitted point source images. Inset showing region where the intensities of the TG-LBR retina is higher than that of WT retina such the total normalized intensities in both cases is the same.
Author response image 2

Modelling light propagation in mouse rod OS.
(Top panels) RI distribution in the rod OS assumed at a contrast of 6-8% and OS cylinder diameter assumed 1.6um and 25um long. (Bottom) Intensity distribution of a plane wave propagating longitudinally in the cylindrical outer segment structures indicating a guiding effect. Simulations performed using Biobeam (Weigert et al., 2018).
Author response image 3
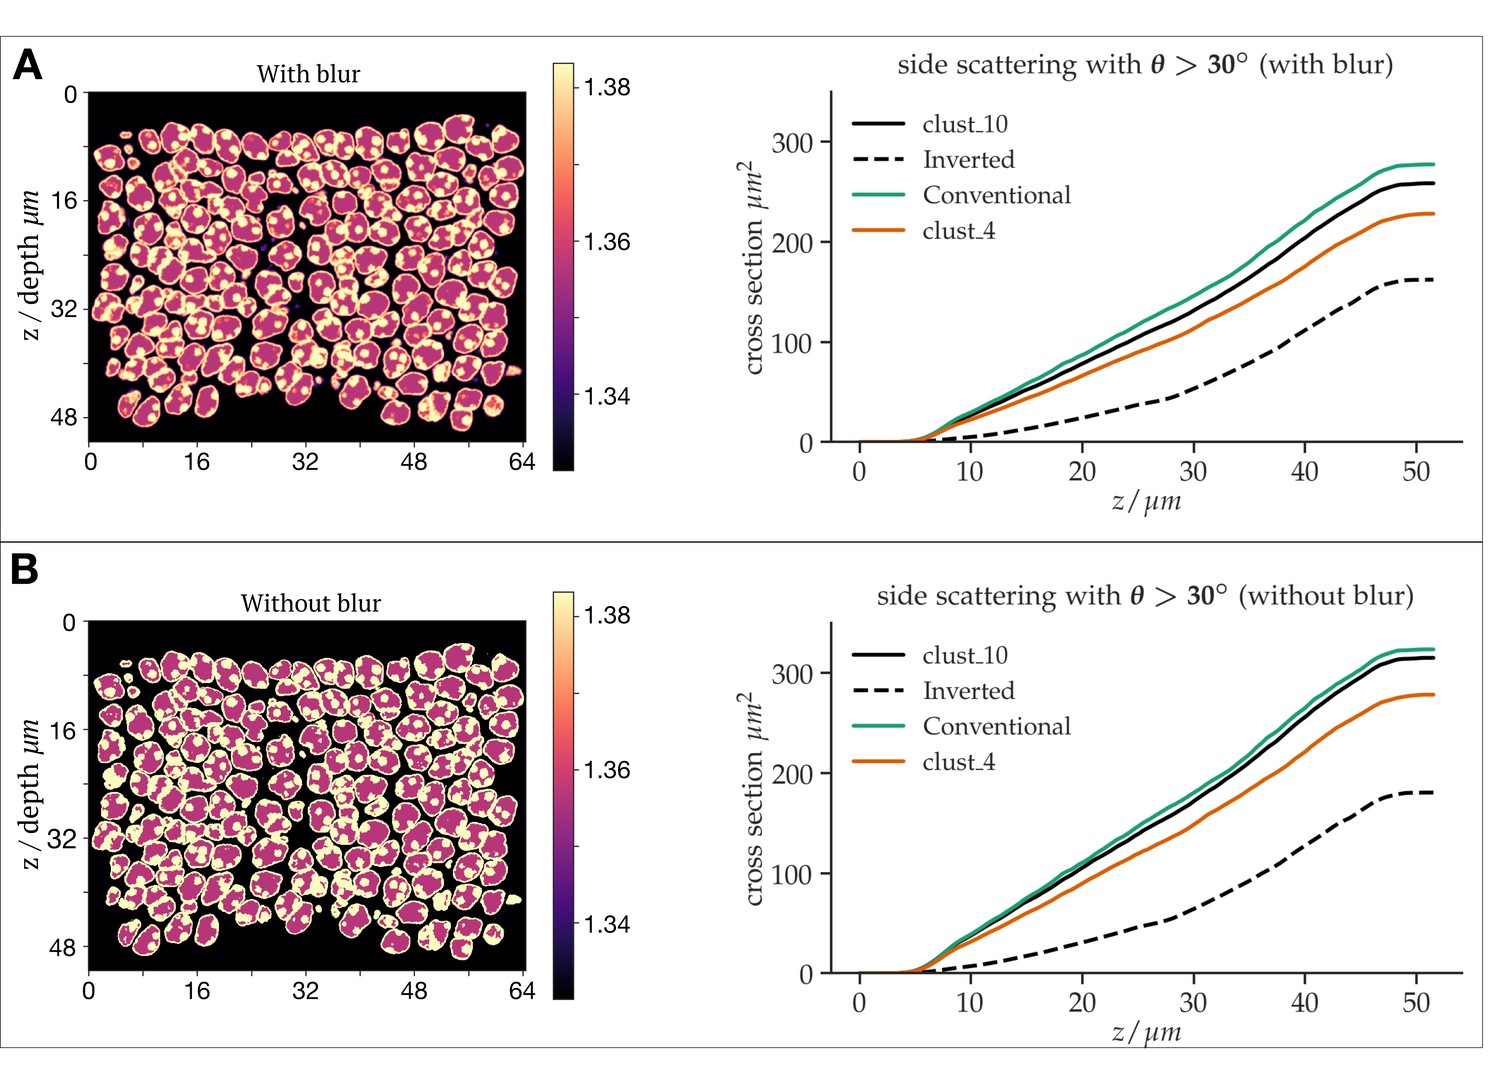
Differential simulations of light propagation in the ONL, illustrating differences between the use of a refractive index maps with (A) and without (B) blurring of the refractive index distributions.
Videos
Video 1
2 photon volumetric image of WT mouse retina.
Video 2
3D morphological models of ONL RI distribution used in light propagation simulations.
Video 3
Behaving mouse in an Optomotor response set up.
Tables
Key resources table
| Reagent type (species) or resource | Designation | Source or reference | Identifiers | Additional information |
|---|---|---|---|---|
| Strain, strain background (M. musculus) | C57BL/6NRj, (WT) | Janvier Labs | Colony maintained at biomedical facility of MPI-CBG | |
| Strain, strain background (M. musculus) | Tg(Nrl-EGFP) | Kind Gift from Jung-Woong Kim (Anand Swaroop laboratory, Ophthalmology and Visual Sciences, University of Michigan, Ann Arbor). | (Akimoto et al., 2006) | |
| Strain, strain background (M. musculus) | ROSA26-eGFP-DTA | Kind gift from Dr. Dieter Saur Klinikum rechts der Isar, Technische Universität München | (Ivanova et al., 2005) | |
| Strain, strain background (M. musculus) | TG-LBR (Nrl-Lbr) | This paper, Dr. Irina Solovei, LMU Munich (Solovei et al., 2013) | biomedical facility of MPI-CBG | Materials and methods Tissue preparation for optical characterization and Flow cytometry |
| Strain, strain background (M. musculus) | Rd1/Cpfl1-KO | Ader Lab, CRTD Dresden, TU Dresden | Animal facility of CRTD | Materials and methods |
| Strain, strain background (M. musculus) | Rho-/- | (Humphries et al., 1997; Jaissle et al., 2001) | Animal facility of CRTD | Materials and methods |
| Cell line (M. musculus) | Neuro-2a (Neuroblast cells) | DSMZ | ACC-148; RRID: CVCL_0470 | Cell line maintained as per ATCC recommendations |
| Biological sample (M. musculus) | Retina | This paper | biomedical facility of MPI-CBG,Animal facility of CRTD | Materials and methods Tissue preparation for optical characterization and Flow cytometry |
| Biological sample (M. musculus) | Brain sections | This paper | biomedical facility of MPI-CBG | Materials and methods Flow cytometry |
| Antibody | anti-lamin B (Goat, polyclonal) | Santa Cruz | SC-6217, RRID: AB_648158 | IF (1:50) |
| Antibody | anti-LBR (Guinea pig, polyclonal) | Kind gift from Dr.H.Herrmann (DKFZ, Heidelberg) | IF (1:50) | |
| Antibody | anti- H4K5ac (Mouse monoclonal) | Kind gift from Dr.H.Kimura (Tokyo Institute of Technology, Yokohama) | Clone 4A7 | IF (1:100) |
| Sequence-based reagent | FISH Probes | This paper, Refer to methods for primer sequences. | PCR primers | (Solovei, 2010; Solovei et al., 2007). |
| Commercial assay or kit | Papain dissociation system kit | Worthington Biochemical Corporation | PDS LK003150 | |
| Software, algorithm | Mie calculations | MATLAB Script | omlc-mie | (Mätzler, 2002) |
| Software, algorithm | Calculation of MTF | MATLAB | https://de.mathworks.com/products/matlab.html | Version 2017b, 2018b, |
| Software, algorithm | Retinal light propagation | biobeam | biobeam | (Weigert et al., 2018) |
| Software, algorithm | SPSS | IBM, SPSS | ibm-spss | Version 25 |
| Software, algorithm | Optodrum | Striatech GmbH | Striatech | |
| Other | Alexa555 | Invitrogen | A31570; RRID: AB_2536180 | Fluorescent dyes |
| Other | Alexa 488 | Invitrogen | A21202; RRID: AB_141607 | Fluorescent dyes |
| Other | Hoechst | Thermo Scientific | 33342 | Fluorescent dyes |
| Other | Vectashield | Vector Laboratories, Inc, USA | Cat. No. H-1000–10 | Antifade media |
| Other | Aqua Poly-Mount | Polysciences, Inc, USA | Cat. No. 18606–20 | Antifade media |
| Other | FACS tubes | Corning Inc, USA | REF 352054 | Falcon round bottom polystyrene |
| Other | Research Beads | BD Biosciences | 655050 | BD FACSDiva CS and T |
| Other | Silica beads | Whitehouse Scientific | MSS002, MSS004a | |
| Other | ND-1.2 filter | Rosco Laboratories Inc | e-color+ #299, |
Additional files
Download links
A two-part list of links to download the article, or parts of the article, in various formats.
Downloads (link to download the article as PDF)
Open citations (links to open the citations from this article in various online reference manager services)
Cite this article (links to download the citations from this article in formats compatible with various reference manager tools)
Rod nuclear architecture determines contrast transmission of the retina and behavioral sensitivity in mice
eLife 8:e49542.
https://doi.org/10.7554/eLife.49542


