Intravital quantification reveals dynamic calcium concentration changes across B cell differentiation stages
- Charité – Universitätsmedizin Berlin, corporate member of Freie Universität Berlin and Humboldt-Universität zu Berlin, Department of Rheumatology and Clinical Immunology, Charitéplatz 1, Germany
- Immune Dynamics, Deutsches Rheuma-Forschungszentrum Berlin, ein Institut der Leibniz-Gemeinschaft, Germany
- Biophysical Analytics, Deutsches Rheuma-Forschungszentrum, ein Institut der Leibniz-Gemeinschaft, Germany
- Universität des Saarlandes, Germany
- Friedrich-Alexander-Universität Erlangen-Nürnberg, Germany
- Charité – Universitätsmedizin Berlin, corporate member of Freie Universität Berlin and Humboldt-Universität zu Berlin, Department of Neuropathology, Charitéplatz 1, Germany
- Veterinary Medicine, Freie Universität Berlin, Germany
Figures
Figure 1 with 1 supplement
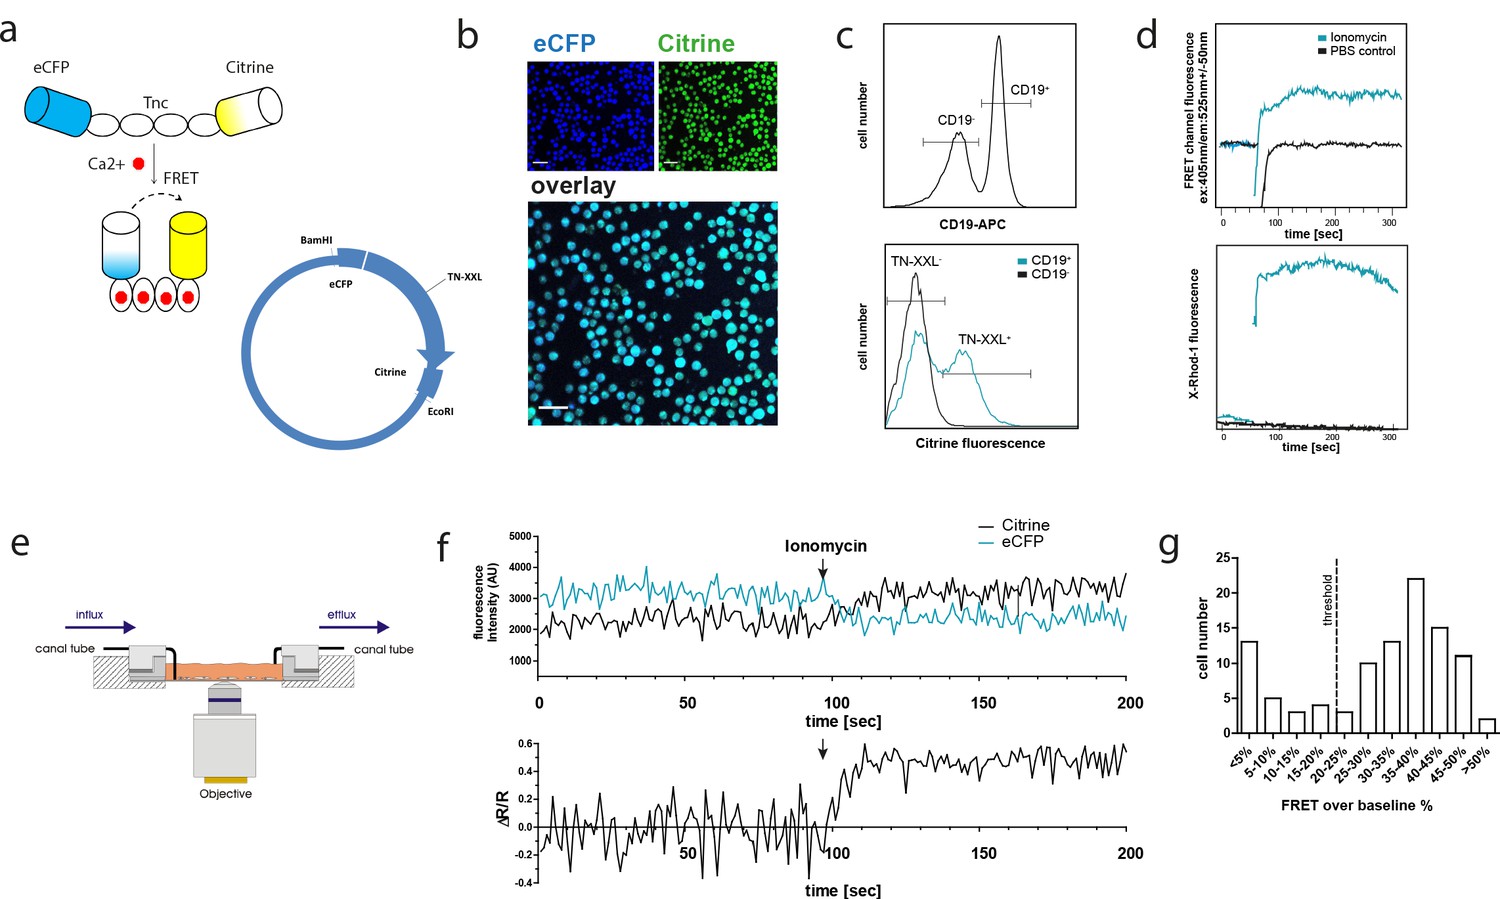
The genetically encoded calcium indicator (GECI) TN-XXL is functionally expressed in CD19+ B cells of YellowCaB mice.
(a) Schematic representation of the genetically encoded calcium indicator TN-XXL with the calcium-sensitive domain troponin C (TnC) fused to donor fluorophore eCFP and acceptor fluorophore citrine. Binding of Ca2+ ions within (up to) four loops of TnC leads to quenching of eCFP and Förster resonance energy transfer (FRET) to citrine. (b) Confocal image of freshly isolated CD19+ B cells. Overlapping blue and yellow-green fluorescence of eCFP and citrine, respectively, can be detected after Cre-loxP-mediated expression of the TN-XXL vector in YellowCaB mice. (c) Flow cytometric analysis of TN-XXL expression in lymphocytes from YellowCaB mice. (d) Flow cytometric measurement of calcium flux after addition of ionomycin and phosphate buffered saline control. (e) Continuous perfusion imaging chamber for live cell imaging. (f) Confocal measurement of mean fluorescence intensity and FRET signal change after addition of ionomycin to continuously perfused YellowCaB cells. Data representative for at least 100 cells out of three independent experiments. (g) Frequency histogram of > 100 YellowCaB single cells, FRET analyzed after ionomycin stimulation. Threshold chosen for positive FRET signal change = 20% over baseline intensity.
Figure 1—figure supplement 1
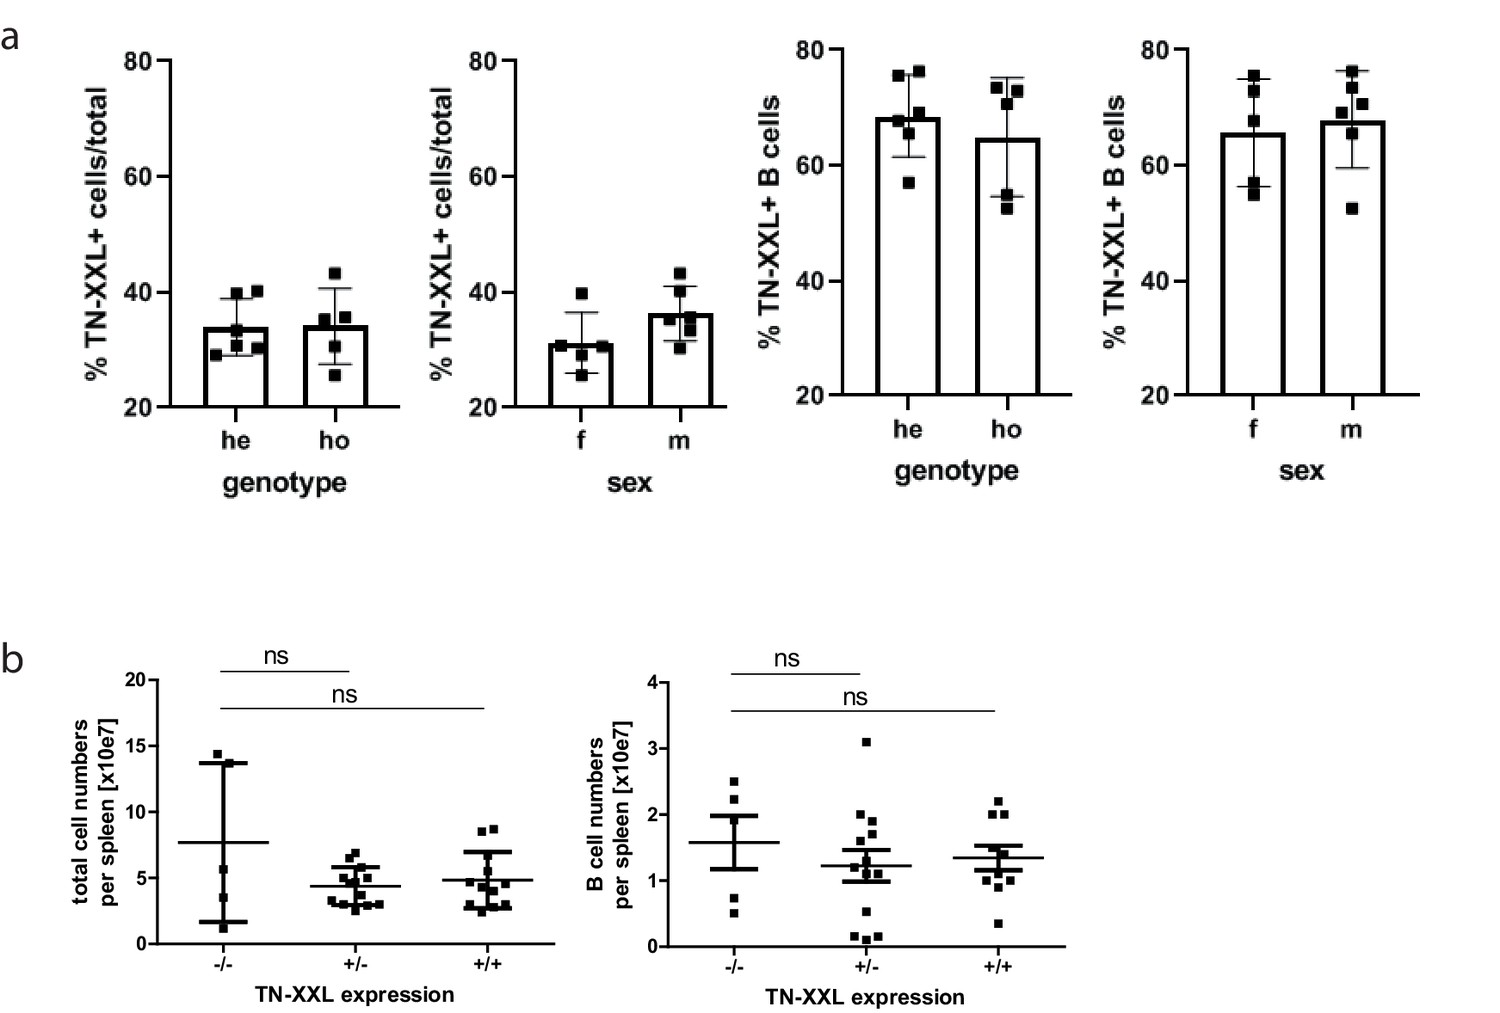
Genotyping of YellowCaB mice and cell numbers.
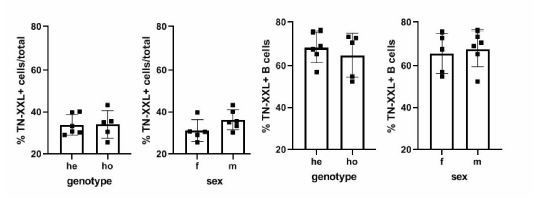
(a) Exemplary flow cytometric analysis of splenocytes from six YellowCaB mice before and after CD19+magnetic-assisted cell sorting in 525 ± 25 nm channel after 488 nm excitation. Comparison of heterozygous and homozygous YellowCaB mice, as well as male and female mice. (b) Total cell numbers (top) and B cell numbers (bottom) of heterozygous YellowCaB mice, homozygous YellowCaB mice, and wild-type mice. Different ages and sexes pooled.
Figure 2 with 1 supplement
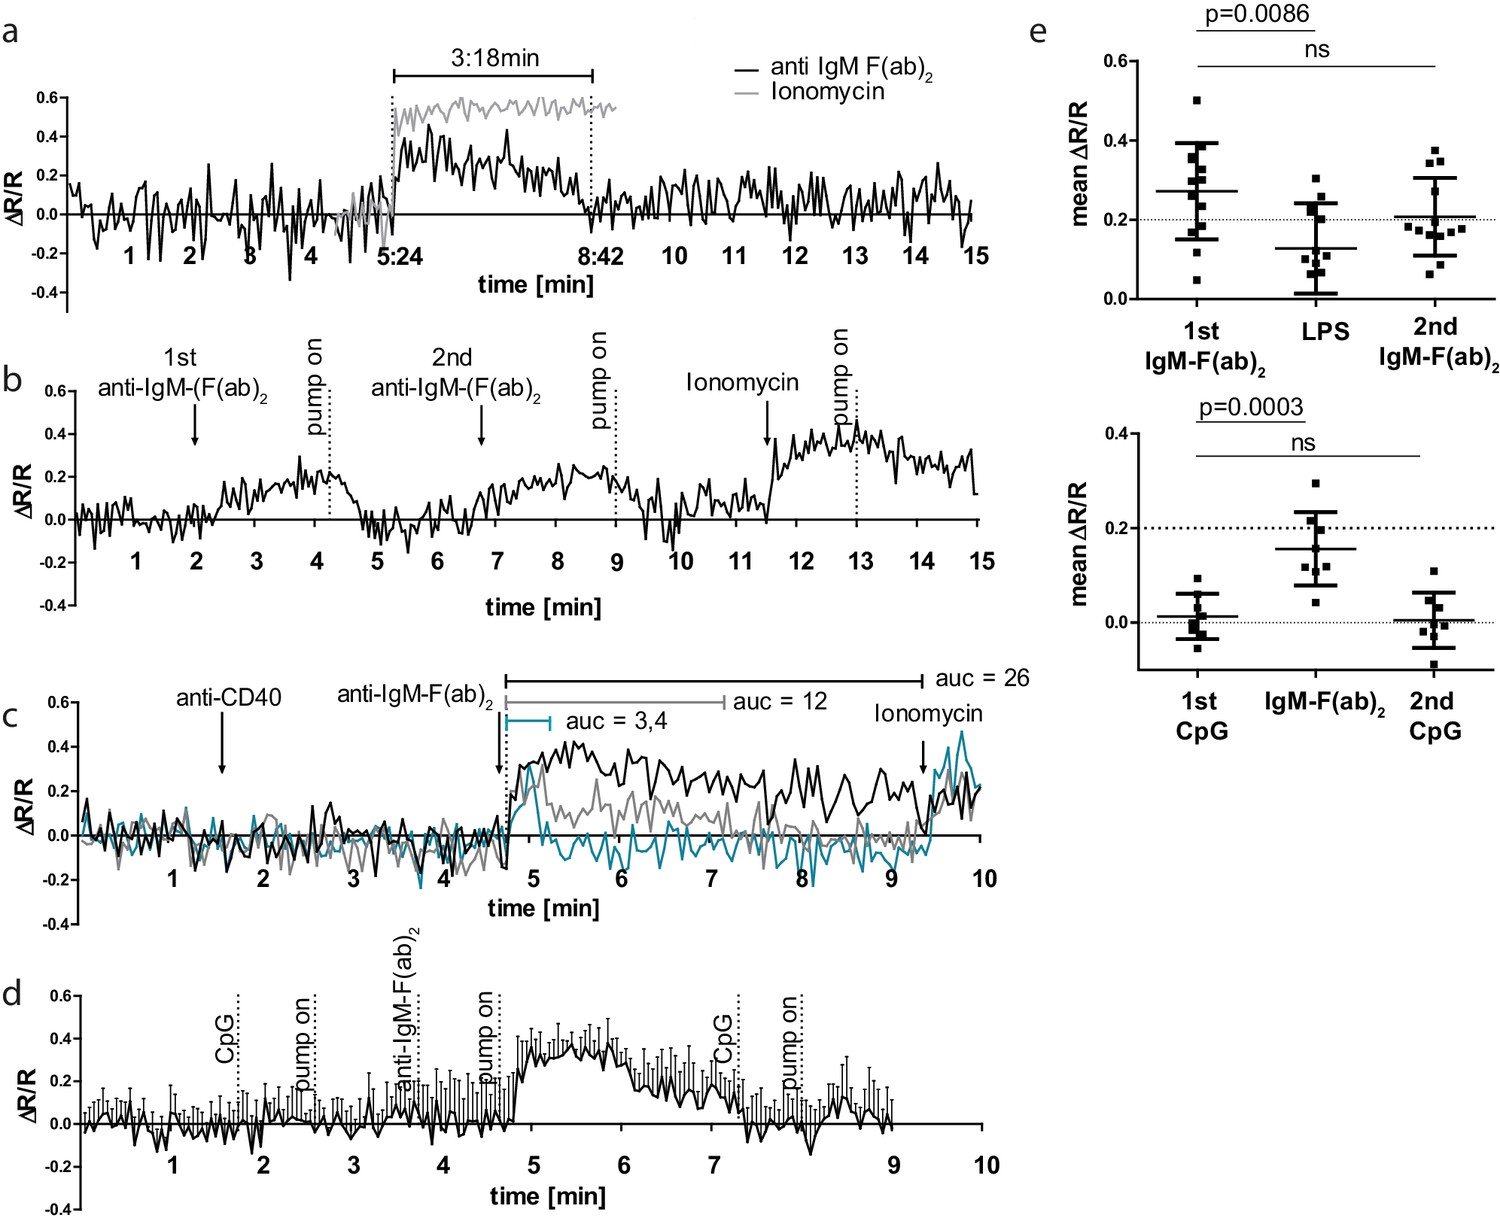
B cell receptor (BCR) stimulation specifically leads to calcium mobilization in YellowCaB cells in vitro.
(a) Confocal measurement of Förster resonance energy transfer (FRET) duration (ΔR/R > 0) in non-perfused primary polyclonal YellowCaB cells after addition of 10 µg/ml anti-IgM-F(ab)2 (black) and ionomycin control (gray). Data representative for at least 35 single cells in four independent experiments. (b) Confocal measurement of FRET signal change after repeated addition of anti-IgM-F(ab)2 to perfused primary polyclonal YellowCaB cells. Data representative for at least 50 cells out of five independent experiments. (c) Confocal measurement of FRET signal change after addition of anti-IgM-F(ab)2 to perfused primary polyclonal YellowCaB cells following stimulation with anti-CD40 antibody and ionomycin as positive control. Examples of transient cytoplasmic (blue), intermediate (gray), and sustained calcium mobilization shown, area under the curve compared. Data representative for 26 cells out of two independent experiments. (d) Resulting FRET curve out for n = 7 primary polyclonal YellowCaB cells perfused with toll-like receptor (TLR)9 stimulator cytosine phosphate guanine (CpG) in Ringer solution and subsequent addition of anti-IgM-F(ab)2. (e) Mean FRET signal change over time after addition of TLR4 or TLR9 stimulation in combination with BCR crosslinking by anti-IgM-F(ab)2 in perfused polyclonal YellowCaB cells. n = 12 (top) and n = 8 (bottom), one-way ANOVA. Error bars: SD/mean.
Figure 2—figure supplement 1
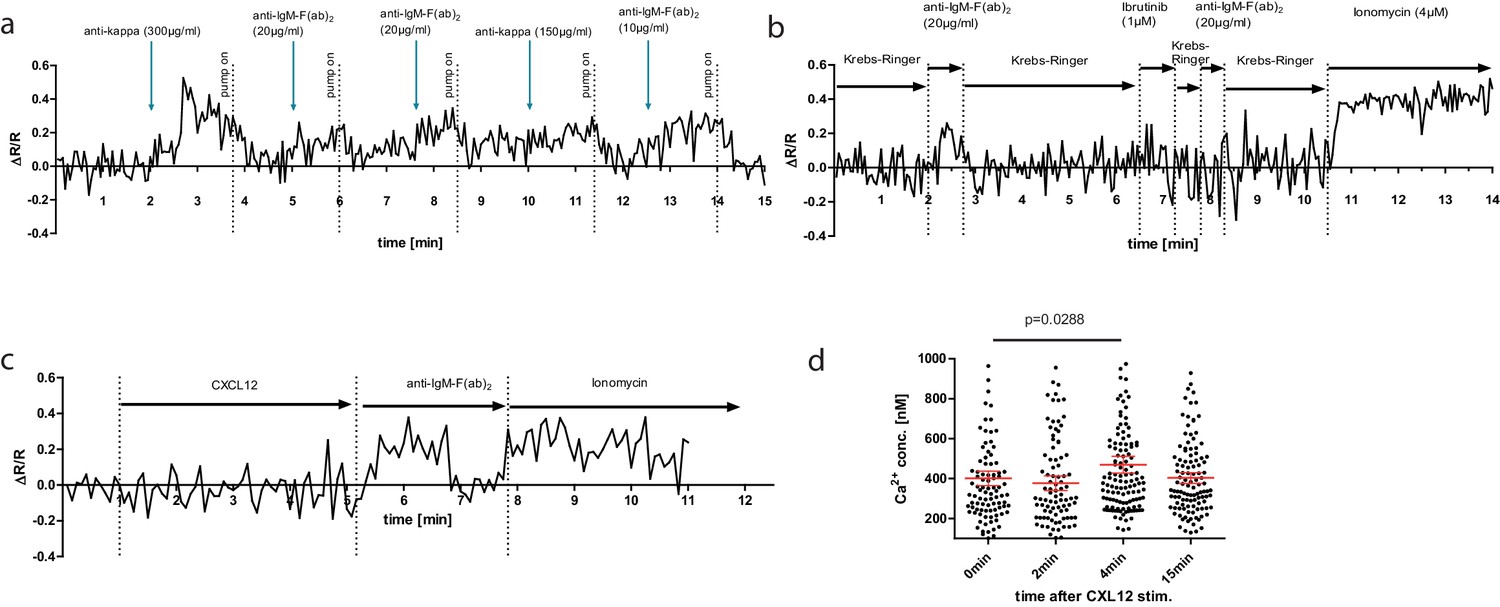
Confocal measurement and plot of TN-XXL ΔR/R over time.
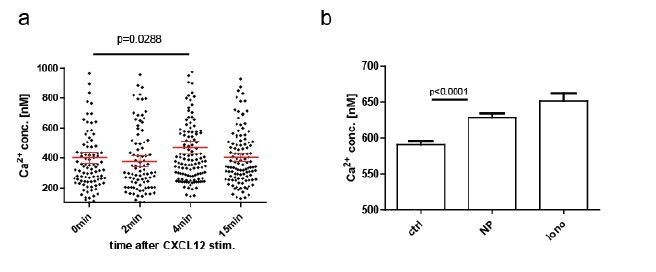
(a) In an open perfused system (Krebs–Ringer solution 6 mM Ca2+), single cells were stimulated with indicated concentrations of B cell receptor anti-light- or anti-heavy chain antibody (arrows). Antibodies were added directly to the imaging chamber volume. Perfusion pump was switched off during stimulation and switched on again at indicated time points (dashed lines). (b) Open perfusion of single cells with 6 mM Ca2+ Krebs–Ringer solution or 6 mM Ca2+ Krebs–Ringer plus reagents indicated. Here, the stimulation was performed under continuous flow via changing the reservoir of the afferent buffer solution. (c) Ratiometric measurement over time of isolated YellowCaB cells after stimulation with CXCL12. Experimental set-up as described in (b). (d) Absolute calcium concentration measured using fluorescence lifetime imaging after CXCL12 stimulation of ex vivo lipopolysaccharide-induced plasmablasts at indicated time points.
Figure 3 with 1 supplement

YellowCaB cells form productive germinal centers in vivo and show active B cell receptor signaling after cell-to-cell contacts.
(a) Histological analysis of host mouse lymph nodes after adoptive transfer of YellowCaB cells. TN-XXL (green)-positive cells cluster in IgD (blue)-negative regions; a germinal center phenotype is confirmed by PNA staining (red). Scale bar 50 µm. (b) Stills of ratiometric intravital imaging of adoptively transferred YellowCaB cells. 3D surface rendering and single-cell tracking (track line in yellow) with relative color coding ranging from blue = low ΔR/R to red = high ΔR/R (c) Histogram showing segmented objects binned due to colocalization intensity within bin width of 20 AU and biexponential fit of data. Total number of objects = 6869. A curve decay of <10% was set as threshold, parting transient from strong B cell–FDC contact. All cells with colocalization intensity <1 were assigned negative. (d) Colocalization intensities of tracked cells 1 and 2 over time versus Förster resonance energy transfer signal change of cells 1 and 2 over time. Contact events to FDCs were assigned numbers #1, #2, and #3.
Figure 3—figure supplement 1

Cell velocity versus calcium flux.
Intravital imaging parameters of germinal center YellowCaB cell making multiple contacts with FDCs (#1–3, red dashed lines). Top: ΔR/R Förster resonance energy transfer signal change of tracked cell over time; the first five time points were taken as baseline. Middle: instantaneous velocity over time. Bottom: first derivative of displacement rate (DR) in direction of X (orange), Y (green), and Z (blue). All DR′=0 means complete halt of cell dislocation.
Figure 4 with 1 supplement
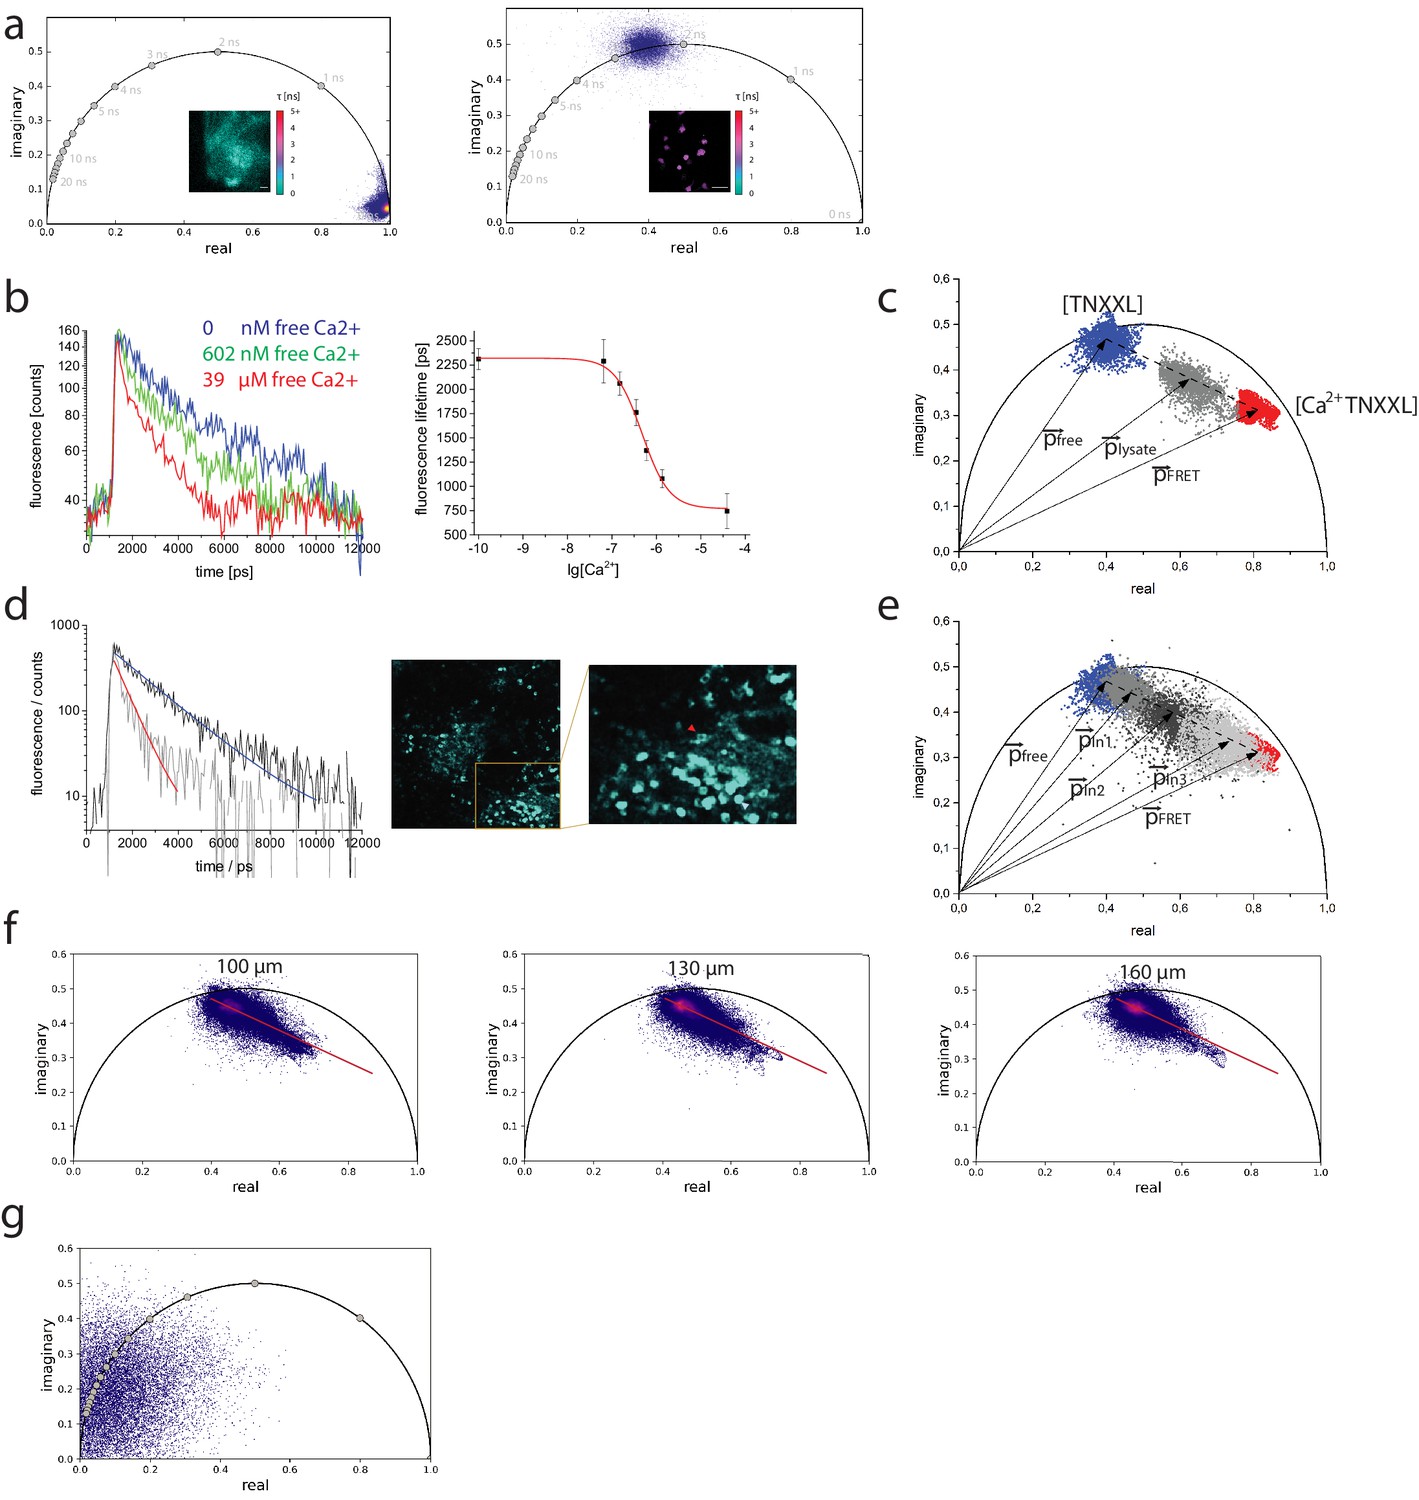
Calibration of the TN-XXL construct using fluorescence lifetime imaging of its Förster resonance energy transfer donor.
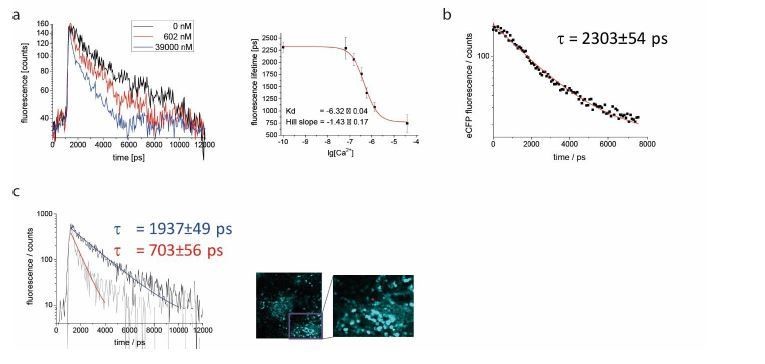
(a) Left panel: phasor plot of second harmonic generation signal of potassium dihydrogen phosphate crystals and lifetime image (inset, scale in picoseconds) corresponding to the instrument response function (τ = 80 ± 10 ps). λexc = 940 nm, λdetection = 466±20 nm. Right panel: phasor plot of GFP fluorescence expressed in HEK cells and fluorescence lifetime image (inset, the same scale as in the left panel), corresponding to mono-exponential decay GFP fluorescence (τ = 2500 ± 100 ps). λexc = 900 nm, λdetection = 525±25 nm. (b) Left panel: fluorescence decays of CFP in TN-XXL construct from lysates of B lymphocytes at 0 nM, 602 nM, and 39 µM free calcium. Right panel: titration curve of TN-XXL resulting from the time-domain evaluation of decay curves as shown in the left panel (three independent experiments). λexc = 850 nm, λdetection = 466±20 nm. (c) Phasor plot of representative data shown in (b) – time-resolved fluorescence images 422 × 422 pixels (200 × 200 µm²); time-bin = 55 ps; time window = 12.4 ns. Blue phasor cloud (with central phase vector free) corresponds to 0 nM free calcium, gray cloud (with central phase vector lysate) to 602 nM free calcium, and red cloud (with central phase vector FRET) to 39 µM free calcium. The dotted line connects the centers of the blue and red clouds, respectively, whereas the gray cloud is located on this line. The dotted line corresponds to the calibration segment as it results from measurements of TN-XXL in cell lysates. (d) Left panel: representative fluorescence decays of eCFP in two B lymphocytes (indicated by red and blue arrowheads in the inset image, right panel) expressing TN-XXL in the medullary cords of a popliteal lymph node of a YellowCaB mouse (right panel) and corresponding mono-exponential fitting curves (red fitting curve: τ = 703 ± 56 ps; blue fitting curve: τ = 1937 ± 49 ps). We measured τ = 2303 ± 53 ps in splenocytes expressing only CFP. (e) Phasor plot showing time-resolved CFP fluorescence data from three lymph nodes, in three YellowCaB mice (light gray – with central phase vector ln3, gray – with central phase vector p ln1, and dark gray – with central phase vector ln2) – time-resolved fluorescence images 505 × 505 pixels (512 × 512 µm²); time-bin = 55 ps; time window = 12.4 ns. Additionally, the calibration segment (dotted line) and the phasor clouds measured in lysates of B lymphocytes expressing TN-XXL at 0 nM and 39 µM free calcium from (c) are displayed. (f) Phasor plots of the CFP fluorescence (time-resolved fluorescence images 505 × 505 pixels / 512 × 512 µm²) acquired at three different depths (100, 130, and 160 µm from the organ capsule surface) in the popliteal lymph node of a YellowCaB mouse. The red line in each phasor plot represents the calibration segment also displayed in (c) and (e). (g) Phasor plot of signal acquired in the lymph node of a non-fluorescent mouse. λexc = 850 nm, λdetection = 466±20 nm.
Figure 4—figure supplement 1
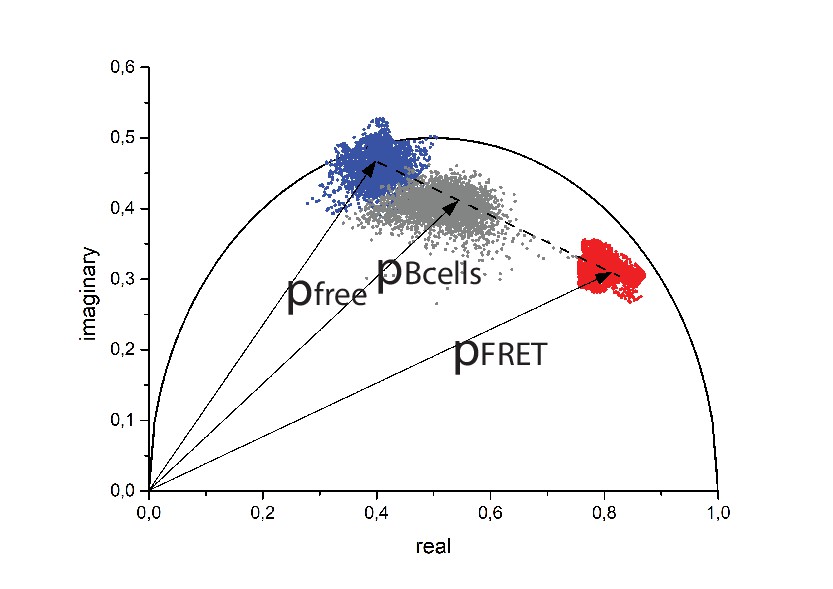
Phasor plot showing time-resolved CFP fluorescence data of B lymphocytes from YellowCaB mice in culture (gray cloud – with central phase vector Bcells) – time-resolved fluorescence images 471 × 471 pixels (250 × 250 µm²); time-bin = 55 ps; time window = 12.4 ns.
Additionally, the calibration segment (dotted line) and the phasor clouds measured in lysates of B lymphocytes expressing TN-XXL at 0 nM (blue cloud) and 39 µM (red cloud) free calcium from Figure 4c are displayed. lexc = 850 nm, ldetection = 466 ± 20 nm.
Figure 5 with 1 supplement
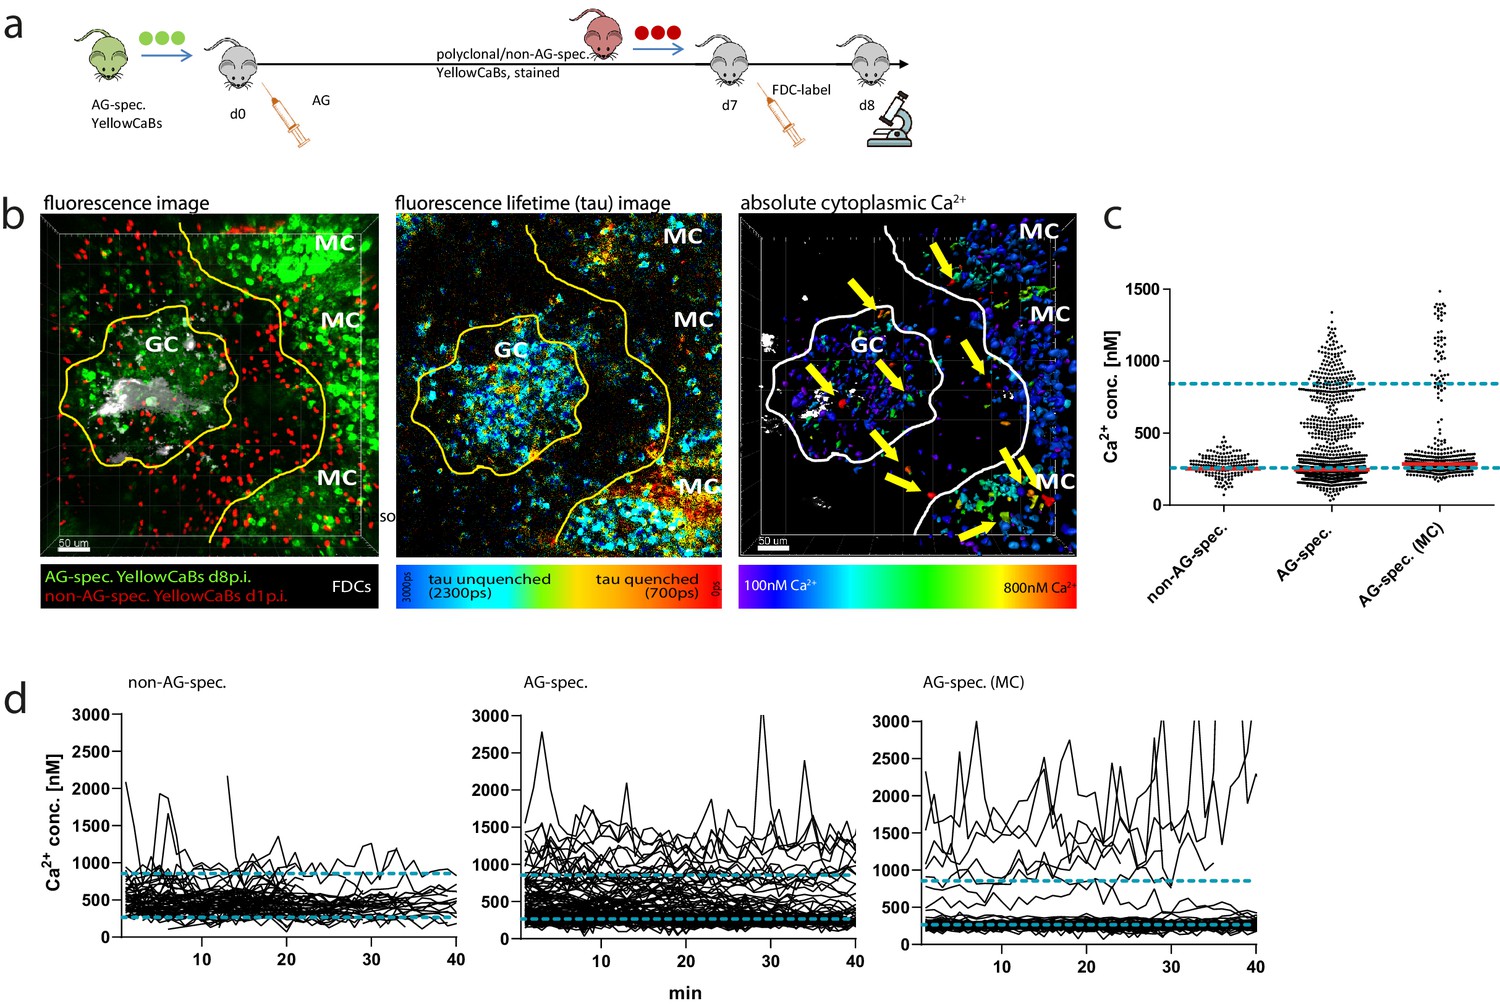
Determination of absolute calcium concentration by intravital fluorescence lifetime imaging of germinal center (GC) B cell populations.
(a) Cell transfer and immunization strategy for intravital imaging of antigen (AG)-specific and polyclonal YellowCaB cells. (b) Left: maximum intensity projection of a z-stack, intravitally imaged GC, and medullary cords (MCs). B cells were distinguished as polyclonal, non-AG-specific YellowCaB cells (red), AG-specific YellowCaB cells, and AG-specific cells inside the MC. Middle: color-coded fluorescence lifetime image with lifetimes of unquenched eCFP depicted in blue and lifetimes of quenched eCFP in red. Right: 3D-rendered, color-coded z-stack showing absolute calcium concentrations in GC and MC. Yellow arrows point to cells containing high cytoplasmic calcium. (c) Bulk analysis of absolute calcium concentrations in segmented single-cell objects from B cell subsets at any given time point measured. The dynamic range of the genetically encoded calcium indicator (GECI) TN-XXL is indicated by blue dashed lines. (d) Time-resolved analysis of calcium concentrations in tracked segmented objects corresponding to B cell subsets in (c). 2 frames per minute. Non-AG-specific YellowCaB cells (left, n = 92 tracks); AG-specific YellowCaB cells (middle, n = 169 tracks); and extrafollicular AG-specific YellowCaB cells in MC (right, n = 69 tracks). The dynamic range of the GECI TN-XXL is indicated by blue dashed lines.
Figure 5—figure supplement 1
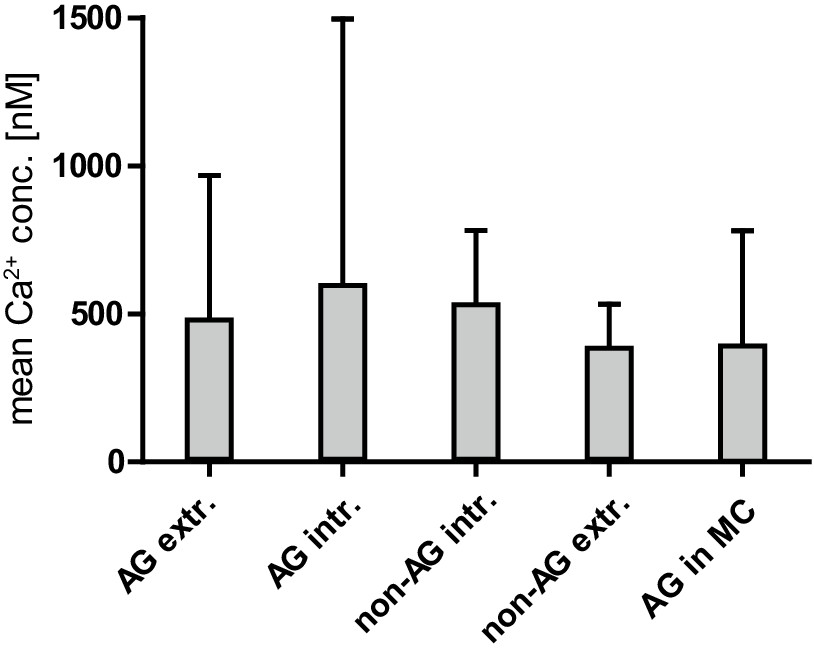
Mean calcium concentration and SD in non-antigen (AG)-specific and AG-specific YellowCaB cells distinguished by localization.
Figure 6 with 3 supplements
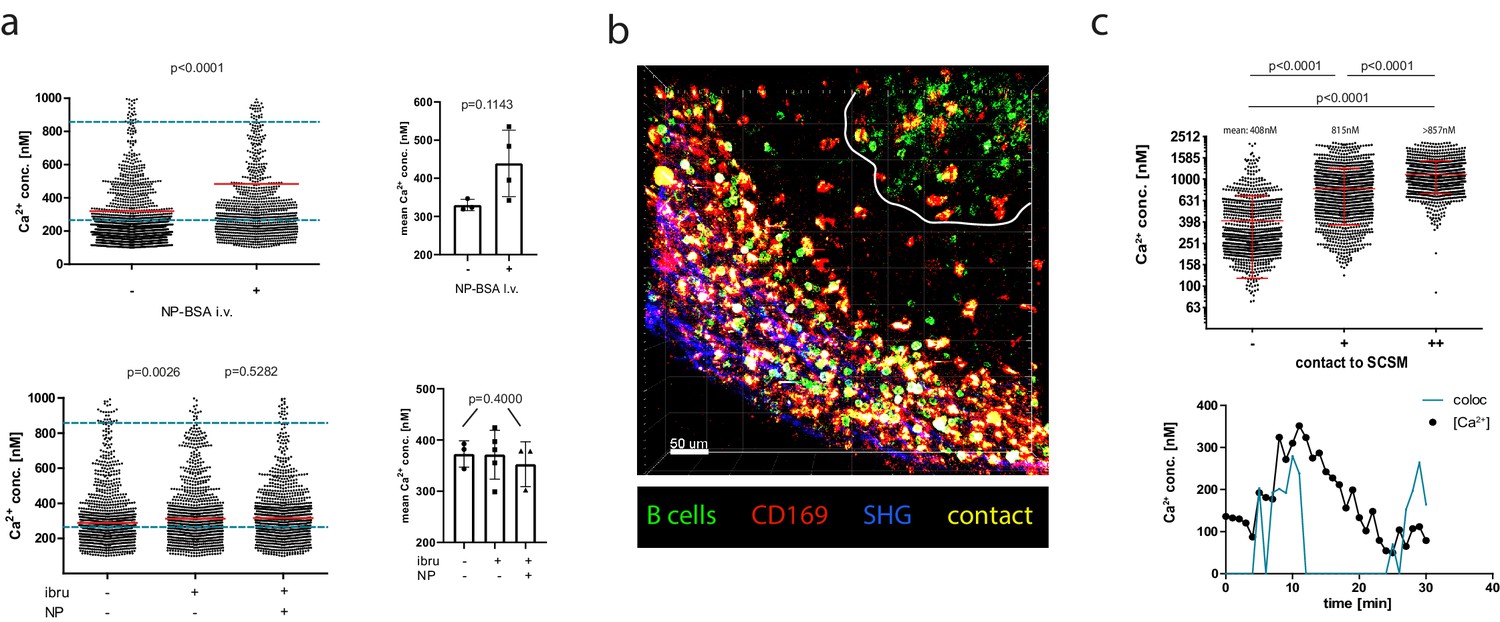
Antigen dependency of calcium elevation in germinal center (GC) and extrafollicular B cells.
(a) Top panel: absolute calcium concentrations measured in antigen (AG)-specific GC B cells before and after in vivo injection of NP-BSA. Exemplary results (left) and pooled data from three imaged mice (right). Bottom panel: absolute calcium concentrations measured in AG-specific GC B cells before and after in vivo injection of the Bruton’s tyrosine kinaseinhibitor ibrutinib, followed by injection of NP-BSA. Exemplary results (left) and pooled data from three imaged mice (right). (b) z-stack of intravitally imaged lymph node with GC (white line) and subcapsular sinus (indicated by SHG, blue). CD169+ macrophages (red, contacts [yellow], YellowCaB cells [green]). Size 500 × 500 × 78 µm. Scale bar 60 µm. (c) Top: Fluorescence lifetime imaging measurement of mean absolute calcium concentration of YellowCaB cells showing no (–), transient (+), or strong (++) overlap with CD169+ signal. n = 1000, ANOVA analysis, mean and SD. Bottom: Single-cell track of a YellowCaB cell making transient contact to a macrophage; blue: colocalization intensity (AU); black: change of absolute calcium concentration.
Figure 6—figure supplement 1
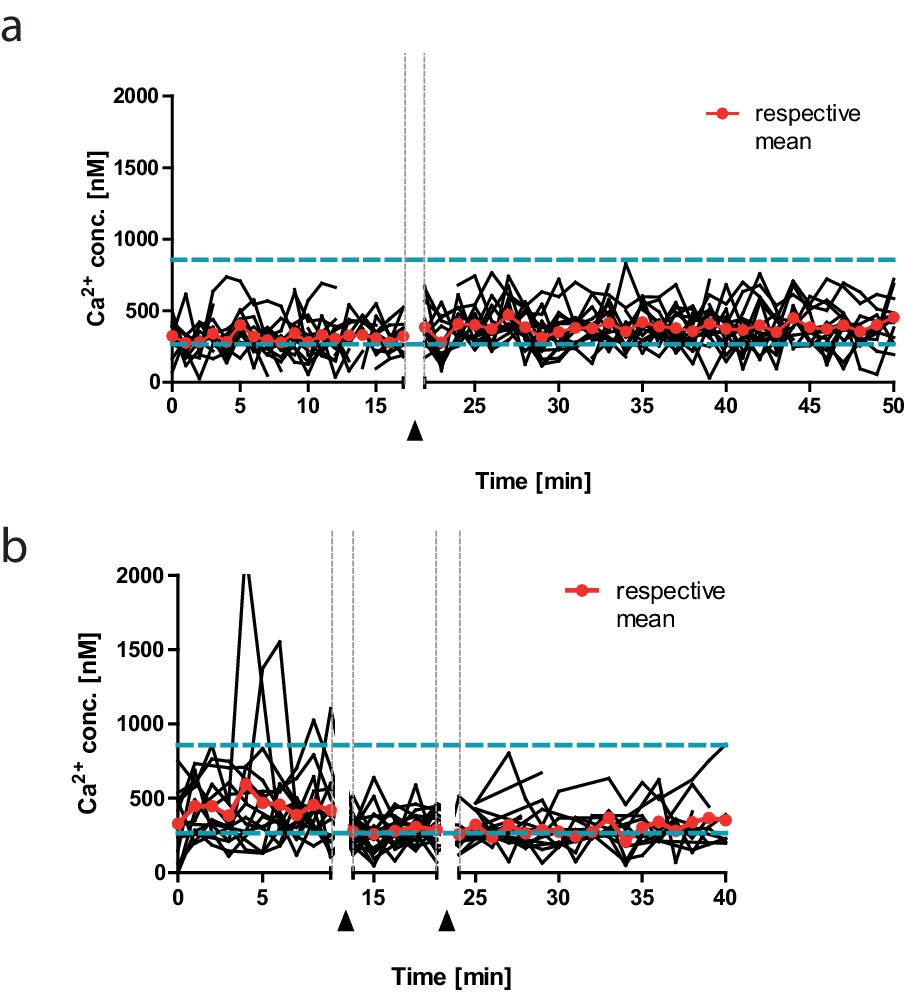
Calcium concentration change detected by in vivo fluorescence lifetime imaging measurements over time, exemplary single germinal center (GC) B cell tracks, before and after injection(s) of compounds.
(a) Absolute calcium measured over time in GC B cell tracks before (left segment, n = 15) and after (right segment, n = 20) intravenous (i.v.) injection of NP-BSA. (b) Absolute calcium measured over time in GC B cell tracks before (left segment, n = 15) and after (middle segment, n = 22) i.v. injection of ibrutinib (gray arrow), followed by injection of NP-BSA (right segment, n = 11, black arrow). Space between dashed lines represents dynamic range of TN-XXL.
Figure 6—figure supplement 2

Absolute calcium concentration of fluorescence lifetime imaging measured after NP-BSA stimulation of ex vivo lipopolysaccharide-induced plasmablasts.
Mann–Whitney test, SEM.
Figure 6—figure supplement 3
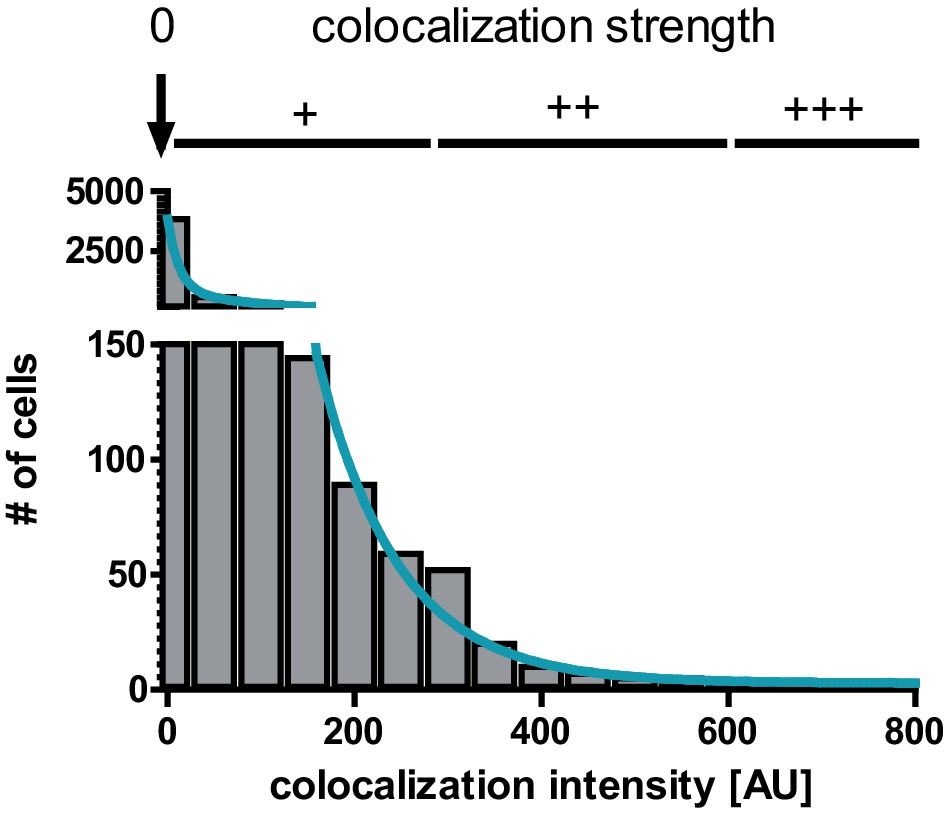
Colocalization histogram and exponential fit for analysis of colocalization between CD169+ macrophages and extrafollicular YellowCaB cells.
Colocalization intensity was determined via setting Intensity thresholds for red (macrophages) and green (YellowCaB cells) and calculation of overlap in each pixel. Colocalization intensity of <1 was considered non-colocalized, and colocalization intensity >1 was considered colocalized with weak (+), intermediate (++), or strong (+++) contact depending on decay rates (<25% for ++, <10% for +++ contact) of biexponential fit.
Author response image 1
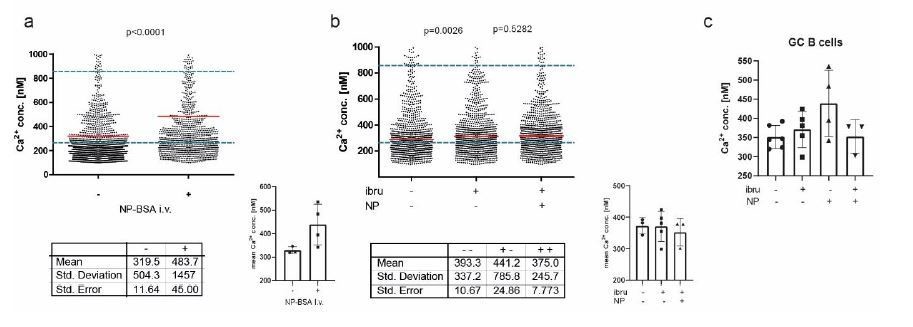
A: intravital imaging of GC B cells before and after i.
v. application of NP-BSA B: intravital imaging of GC B cells before and after i.v. application of ibtutinib, followed by NP-BSA injection. C: Cumulated data of revised intravital imaging experiments.
Author response image 2
CXCL12 stimulation of LPS-induced B1-8 PB, B: NP stim of LPS-induced B1-8 PB.
Author response image 3
A: exemplary monoexponential decays for Ca2+ free (black), Ca2+ saturated (blue) and 602nM Ca2+ medium (red), and calibration curve for lysate of YellowCaB cells.
Measured concentrations (3 replicates): 0nM, 100nM, 150nM, 351nM, 602nM, 1,35μM, 39μM. B: unquenched fluorescence lifetime of eCFP was validated to be 2303+/- 53 ps in splenic tissue of mice with ubiquitous GFP expression. C: exemplary decays for plasma blasts with high (tau = 703 ps, red arrow) and lower (tau = 1937ps, white arrow) Ca2+ concentration.
Author response image 4
Videos
Video 1
Detail of intravital ratiometric imaging (day 8 p.i.) within germinal center.
YellowCaB cells had been adoptively transferred, and FDCs were in vivo-labeled with anti-CD21/35 antibody (white). 3D surface rendering and single-cell tracking (track line in yellow) with color coding ranging from blue = low ΔR/R to red = high ΔR/R. 103 frames, 7 frames per second (fps), scale bar 50 µm.
Video 2
Side-by-side depiction of fluorescence, fluorescence lifetime imaging, and cell-based phasor data of intravitally imaged germinal center (day 8 p.i.), single z-plane.
Left: fluorescence data with antigen (AG)-specific YellowCaB cells (green) and stained non-AG-specific YellowCaB cells transferred 1 day prior to imaging (red; autofluorescence of capsule also visible in the same channel). 4 fps, scale bar 50 µm. Middle: false color-coded presentation of fluorescence lifetime τ (0–3000 ps, see range scale in Figure 5b). 4 fps, scale bar 50 µm. Right: raw cell-based phasor plot with cells segmented according to fluorescence and spatial distribution, subsets indicated. 4 fps.
Video 3
Detail of Video 2 within medullary cords and side-by-side depiction of fluorescence and fluorescence lifetime imaging data, single z-plane.
Left: fluorescence data with antigen-specific YellowCaB cells (green) and autofluorescence of capsule (red). 4 fps, scale bar 50 µm. Right: false color-coded presentation of fluorescence lifetime τ (0–3000 ps, see range scale in Figure 5b). 4 fps.
Video 4
3D projection of intravital imaging of germinal center and subcapsular sinus.
YellowCaB cells (green, with track lines) and subcapsular sinus macrophages (red), stained by CD169 in vivo labeling. White circles highlight antigen-specific B cells migrating along subcapsular space. 4 fps, scale bar 50 µm.
Tables
Key resources table
| Reagent type (species) or resource | Designation | Source or reference | Identifiers | Additional information |
|---|---|---|---|---|
| Mouse | R26CAG-TNXXLflox | Mank et al., 2008 | - | Plasmid available at addgene (#45797) |
| Mouse | CD19 cre | Rickert et al., 1997 | Stock# 004126 jaxmice | |
| Mouse | B1-8high | Shih et al., 2002a | Stock# 007775 jaxmice | |
| Antibody | Rabbit anti-GFP-Alexa488 polyclonal | Rockland, in-house coupling DRFZ Berlin | Cat# 600-401-215 | 1:200 |
| Antibody | Rat anti-CD21/35-Fab-Atto590 7G6 | DRFZ Berlin | – | 10 µg/mouse |
| Antibody | Hamster anti-IgD-Alexa594 11.26 c | DRFZ Berlin | –- | – |
| Antibody | Rat anti-CD21/35-Alexa647 7G6 | DRFZ Berlin | – | – |
| Antibody | Rat anti-CD19-Cy5 1D3 | DRFZ Berlin | – | – |
| Antibody | Rat anti-CD40 3/23 | BD Pharmingen | Cat# 553788 | As indicated |
| Antibody | Goat anti-IgM-F(ab)2 polyclonal | Southern Biotech | Cat#1023-01 | As indicated |
| Antibody | Rat anti-kappa 187.1 | DRFZ Berlin | – | As indicated |
| Recombinant DNA reagent | CpG | Tib Molbiol Berlin | Request #1668 and 1826 sequence ID: 1746437/8 | As indicated |
| Peptide, recombinant protein | Peanut-agglutinin, biotinylated | Vector Biolabs | Cat# B-1075-5 | 1:200 |
| Other | Lipopolysaccharide (LPS) from Escherichia coli | Sigma | Cat# L4391 | As indicated |
| Peptide, recombinant protein | NP-CGG ratio > 20 | Biosearch Technologies | Cat# N-5055C-5-BS | 10 µg/mouse |
| Peptide, recombinant protein | Streptavidin-Alexa555 | Thermo Fisher Scientific | Cat# S32355 | 1:2000 |
| Other | X-Rhod-1 | Molecular Probes | Cat# X14210 | Manufacturer’s protocol |
| Software, algorithm | Python 2.7 | Python Software Foundation | ||
| Software, algorithm | MATLAB | MathWorks | ||
| Software, algorithm | Imaris | Bitplane | ||
| Software, algorithm | Phasor-based-numerical analysis of eCFP lifetime data | Own work, https://github.com/ulbrica/Phasor-FLIM.git; swh:1:rev:8ae5bfc17ec019fcc8ec7e4627442646e52cc3c5; Ulbricht, 2021. |
Additional files
-
Source code 1
Annotated Python-based code for phasor analysis.
- https://cdn.elifesciences.org/articles/56020/elife-56020-code1-v2.docx.zip
-
Transparent reporting form
- https://cdn.elifesciences.org/articles/56020/elife-56020-transrepform-v2.docx
Download links
A two-part list of links to download the article, or parts of the article, in various formats.
Downloads (link to download the article as PDF)
Open citations (links to open the citations from this article in various online reference manager services)
Cite this article (links to download the citations from this article in formats compatible with various reference manager tools)
Intravital quantification reveals dynamic calcium concentration changes across B cell differentiation stages
eLife 10:e56020.
https://doi.org/10.7554/eLife.56020


