All-trans retinoic acid induces synaptic plasticity in human cortical neurons
- Department of Neuroanatomy, Institute of Anatomy and Cell Biology, Faculty of Medicine, University of Freiburg, Germany
- Department of Neurosurgery, Medical Center and Faculty of Medicine, University of Freiburg, Germany
- Center for Basics in Neuromodulation (NeuroModulBasics), Faculty of Medicine, University of Freiburg, Germany
- Institute of Clinical Neuroanatomy, Dr. Senckenberg Anatomy, Neuroscience Center, Goethe-University Frankfurt, Germany
- Center Brain Links Brain Tools, University of Freiburg, Germany
Figures
Figure 1 with 1 supplement
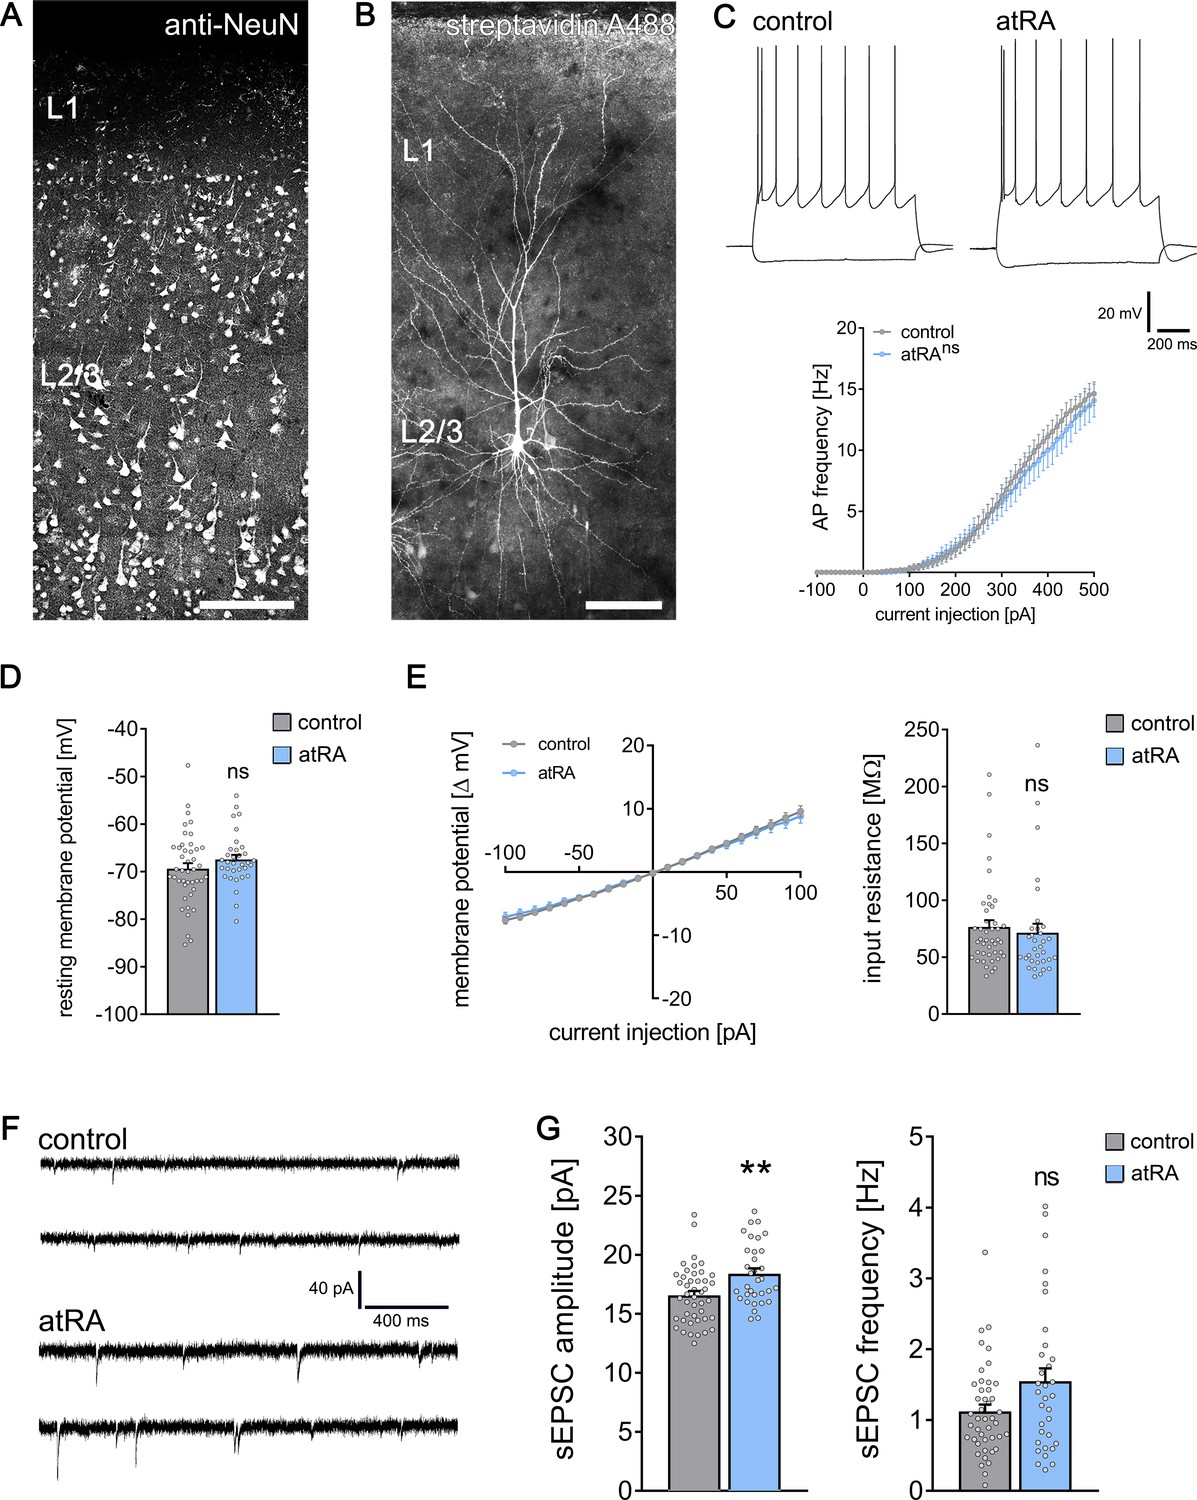
All-trans retinoic acid (atRA) induces plasticity of excitatory synapses in human cortical slices.
(A) A representative human cortical slice stained for NeuN. Scale bar = 200 µm. (B) Recorded and post hoc-labeled superficial (layer 2/3) pyramidal neuron. Scale bar = 100 µm. (C) Sample traces of input/output-curves of cortical neurons from atRA- (1 µM, 6–10 hr) and vehicle-only-treated slices (responses to −100 pA and +350 pA current injection illustrated). Action potential frequency of human neocortical neurons from atRA- and vehicle-only-treated slices (ncontrol = 38 cells, natRA = 33 cells in six samples each; RM two-way ANOVA followed by Sidak’s multiple comparisons). (D, E) Passive membrane properties, that is, resting membrane potential (D) and input resistance (E) from atRA- and vehicle-only-treated neurons (ncontrol = 43 cells, natRA = 33 cells in six samples each; Mann–Whitney test). (F, G) Sample traces and group data of AMPA receptor-mediated spontaneous excitatory postsynaptic currents (sEPSCs; ncontrol = 44 cells, natRA = 33 cells in six samples each; Mann–Whitney test, U = 454 for sEPSC amplitude analysis, p=0.12 for sEPSC frequency). Individual data points are indicated by gray dots. Values represent mean ± s.e.m. (ns, non-significant difference, **p<0.01).
Figure 1—figure supplement 1

All-trans retinoic acid (atRA) induces excitatory synaptic strengthening in human superficial (layer 2/3) pyramidal neurons – an in-sample control analysis.
(A) A total amount of eight human neocortical samples were collected for this study, while cortical slices from six samples were included in this dataset. In each sample, acute cortical slices were randomly assigned to the atRA- or vehicle-only-treated group. In every sample, an increase in sEPSC amplitude can be observed (ncontrol = 44 cells, natRA = 33 cells in six samples each; sample 1: ncontrol = 10 cells, natRA = 5 cells (one cell excluded from further analysis with 38.4 pA/6.5 Hz sEPSC amplitude/frequency, respectively); sample 2: ncontrol = 4 cells, natRA = 3 cells; sample 3: ncontrol = 10 cells, natRA = 8 cells; sample 4: ncontrol = 9 cells, natRA = 8 cells; sample 6: ncontrol = 6 cells, natRA = 4 cells; sample 7: ncontrol = 5 cells, natRA = 5 cells). (B) Paired statistical analysis of mean sEPSC amplitude of atRA-treated slices and their respective in-sample vehicle-only-treated slices reveals a significant increase in sEPSC amplitude following atRA treatment (n = 6 samples; Wilcoxon matched-pairs signed-rank test). (C, D) Analysis of sEPSC frequency with a paired statistical approach does not reveal a significant increase in sEPSC frequency upon atRA treatment. Individual data points are indicated by gray or blue dots, respectively. Values represent mean ± s.e.m. (ns, non-significant difference, *p<0.05).
Figure 2 with 1 supplement
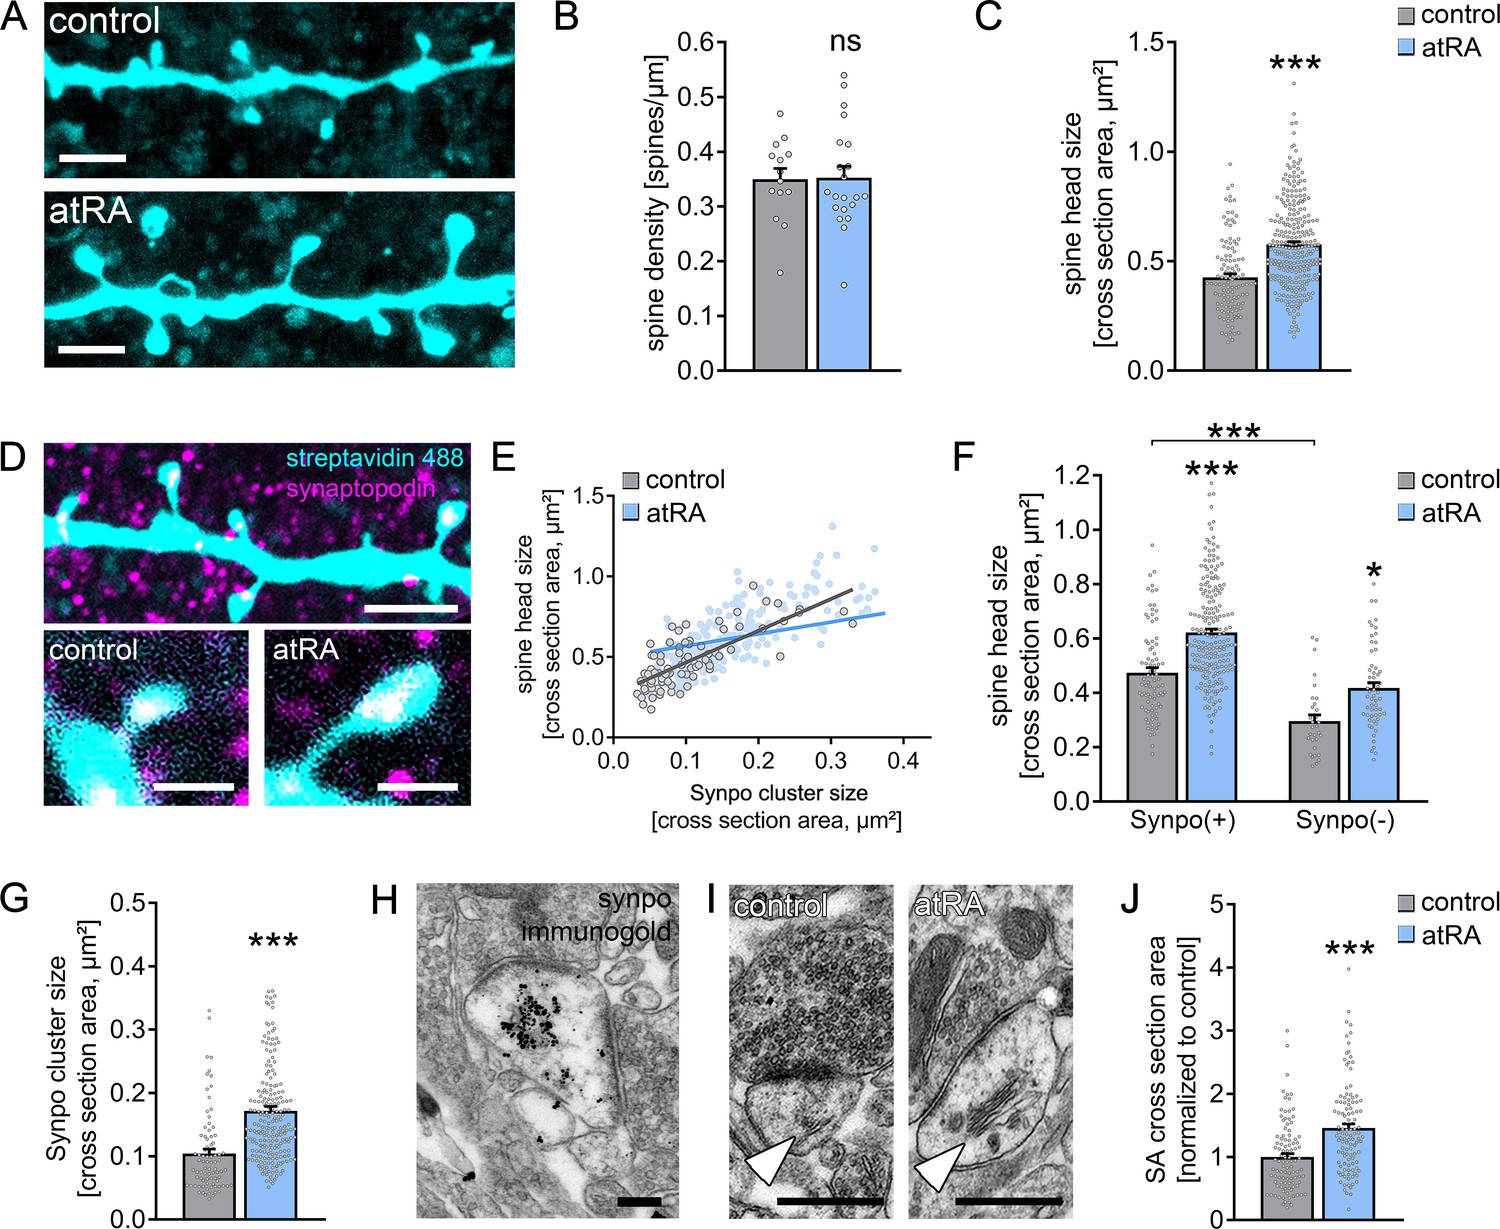
All-trans retinoic acid (atRA) induces dendritic spine plasticity in human cortical slices.
(A) Example of dendritic segments of post hoc-labeled superficial (layer 2/3) pyramidal neurons in atRA- (1 µM, 6–10 hr) and vehicle-only-treated slices. Scale bars = 3 µm. (B, C) Group data for spine densities (ncontrol = 14 dendritic segments, natRA = 21 dendritic segments from three samples each; Mann–Whitney test) and spine head sizes (ncontrol = 115 dendritic spines from 14 dendritic segments, natRA = 267 from 21 dendritic segments, three samples each; Mann–Whitney test, U = 8653). (D) Representative images of synaptopodin (Synpo) stained dendritic segments. Scale bar (upper panel) = 5 µm, scale bars (lower panels) = 1 µm. (E–G) Correlation of synaptopodin cluster size and spine head size (E, ncontrol = 84 dendritic spines, natRA = 208 dendritic spines; Spearman r control = 0.73*** and atRA = 0.69***; three data points outside the axis limits in the atRA-treated group), group data of spine head sizes in synaptopodin-positive and -negative spines (F, synaptopodin-positive spines: ncontrol = 84, natRA = 208; synaptopodin-negative spines: ncontrol = 31, natRA = 59; Kruskal–Wallis test followed by Dunn’s multiple comparisons; one data point outside the axis limits in the atRA-treated group of synaptopodin-positive spines), and synaptopodin cluster sizes in atRA- and vehicle-only-treated slices (G, ncontrol = 84, natRA = 208; Mann–Whitney test, U = 3992; three data points outside the axis limits in the atRA-treated group). (H) Electron micrograph of synaptopodin immunogold-labeled spine apparatus (SA). Scale bar = 250 nm. (I, J) Examples and group data of SA (white arrowheads) cross-sectional areas in atRA- and vehicle-only-treated slices (ncontrol = 103, natRA = 114 from three samples each; values were normalized to the mean cross-section area in the vehicle-only-treated group; Mann–Whitney test, U = 3489). Scale bar = 500 nm. Individual data points are indicated by gray dots. Values represent mean ± s.e.m. (ns, non-significant difference, *p<0.05, ***p<0.001).
Figure 2—figure supplement 1
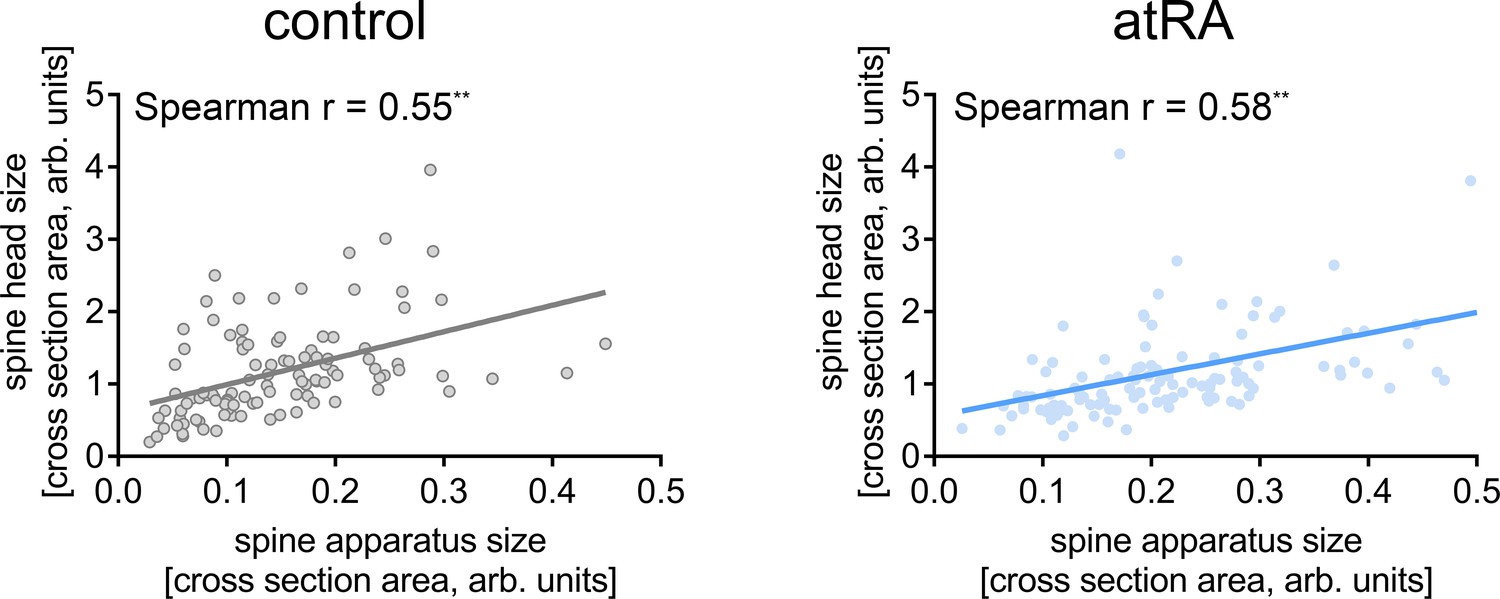
Ultrastructural analysis of excitatory synapses reveals a positive correlation between sizes of the spine head and the spine apparatus organelle.
XY-plots of paired spine head and spine apparatus organelle size (cross section area) were created for both vehicle-only- and atRA-treated human neocortical slices. A positive correlation can be detected that is preserved following atRA treatment (ncontrol = 103, natRA = 114; linear regression fit, Spearman rcontrol = 0.55** and ratRA = 0.58**; two data points outside the axis limits in the atRA group). Individual data points are indicated by gray or blue dots, respectively (**p<0.01).
Figure 3 with 2 supplements
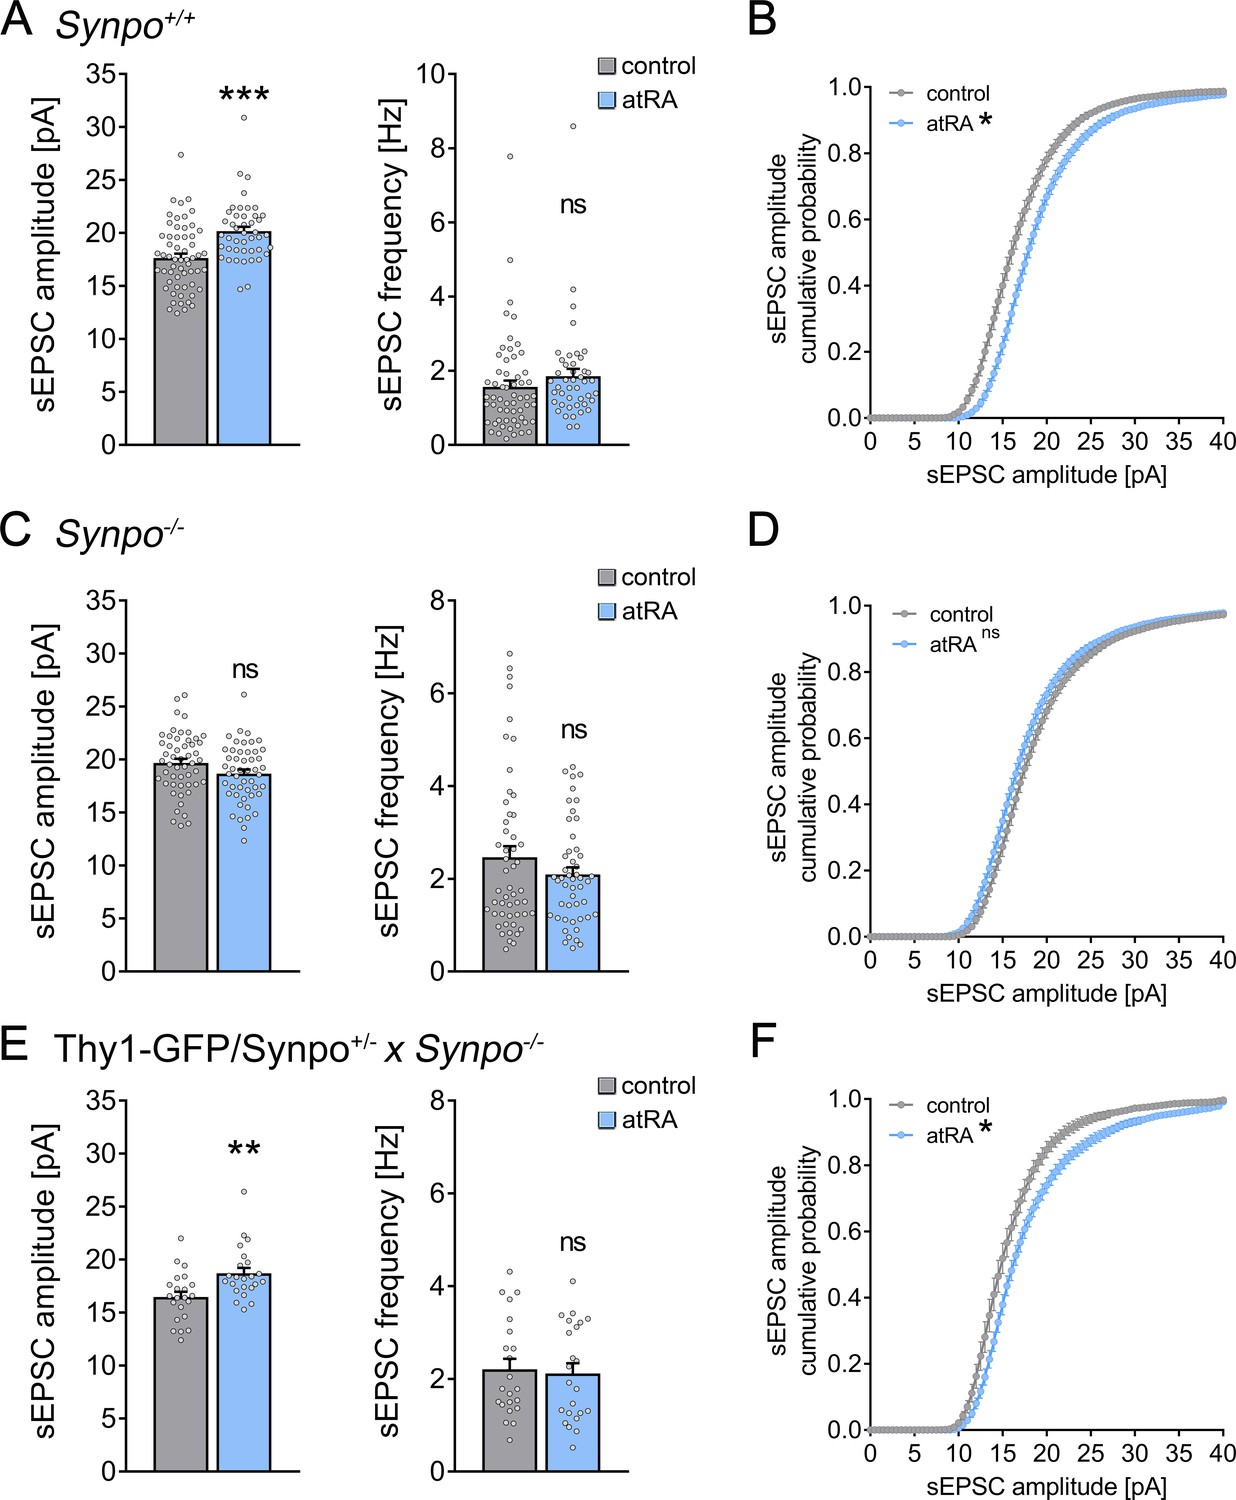
Effects of all-trans retinoic acid (atRA) in cortical slices prepared from synaptopodin-deficient mice.
(A, B) Group data (A) of AMPA receptor-mediated spontaneous excitatory postsynaptic currents (sEPSCs) recorded from superficial (layer 2/3) pyramidal neurons of the dorsomedial prefrontal cortex in slices prepared from wild-type animals (Synpo+/+) and cumulative distribution (B) of sEPSC amplitudes (ncontrol = 58 cells, natRA = 44 cells in seven independent experiments; Mann–Whitney test for column statistics, UsEPSC amplitude = 684; RM two-way ANOVA followed by Sidak’s multiple comparisons for statistical evaluation of cumulative sEPSC amplitude distributions). (C, D) Group data (C) of AMPA receptor-mediated sEPSCs recorded from superficial (layer 2/3) pyramidal neurons of the dorsomedial prefrontal cortex in slices prepared from synaptopodin-deficient mice (Synpo−/−) and cumulative distribution (D) of sEPSC amplitudes (ncontrol = 51 cells, natRA = 49 cells in seven independent experiments; Mann–Whitney test for column statistics and RM two-way ANOVA followed by Sidak’s multiple comparisons for statistical evaluation of cumulative sEPSC amplitude distributions). (E, F) Group data (E) of sEPSC recordings and cumulative distribution (F) of sEPSC amplitudes in cortical slices prepared from transgenic mice expressing GFP-tagged synaptopodin under the control of the Thy1.2 promotor on synaptopodin-deficient genetic background (Thy1-GFP/Synpo+/−x Synpo–/–; ncontrol = 22 cells, natRA = 23 cells in three independent experiments; Mann–Whitney test for column statistics, UsEPSC amplitude = 125; RM two-way ANOVA followed by Sidak’s multiple comparisons for statistical evaluation of cumulative sEPSC amplitude distributions). Individual data points are indicated by gray dots. Values represent mean ± s.e.m. (ns, non-significant difference, ***p<0.001, **p<0.01).
Figure 3—figure supplement 1
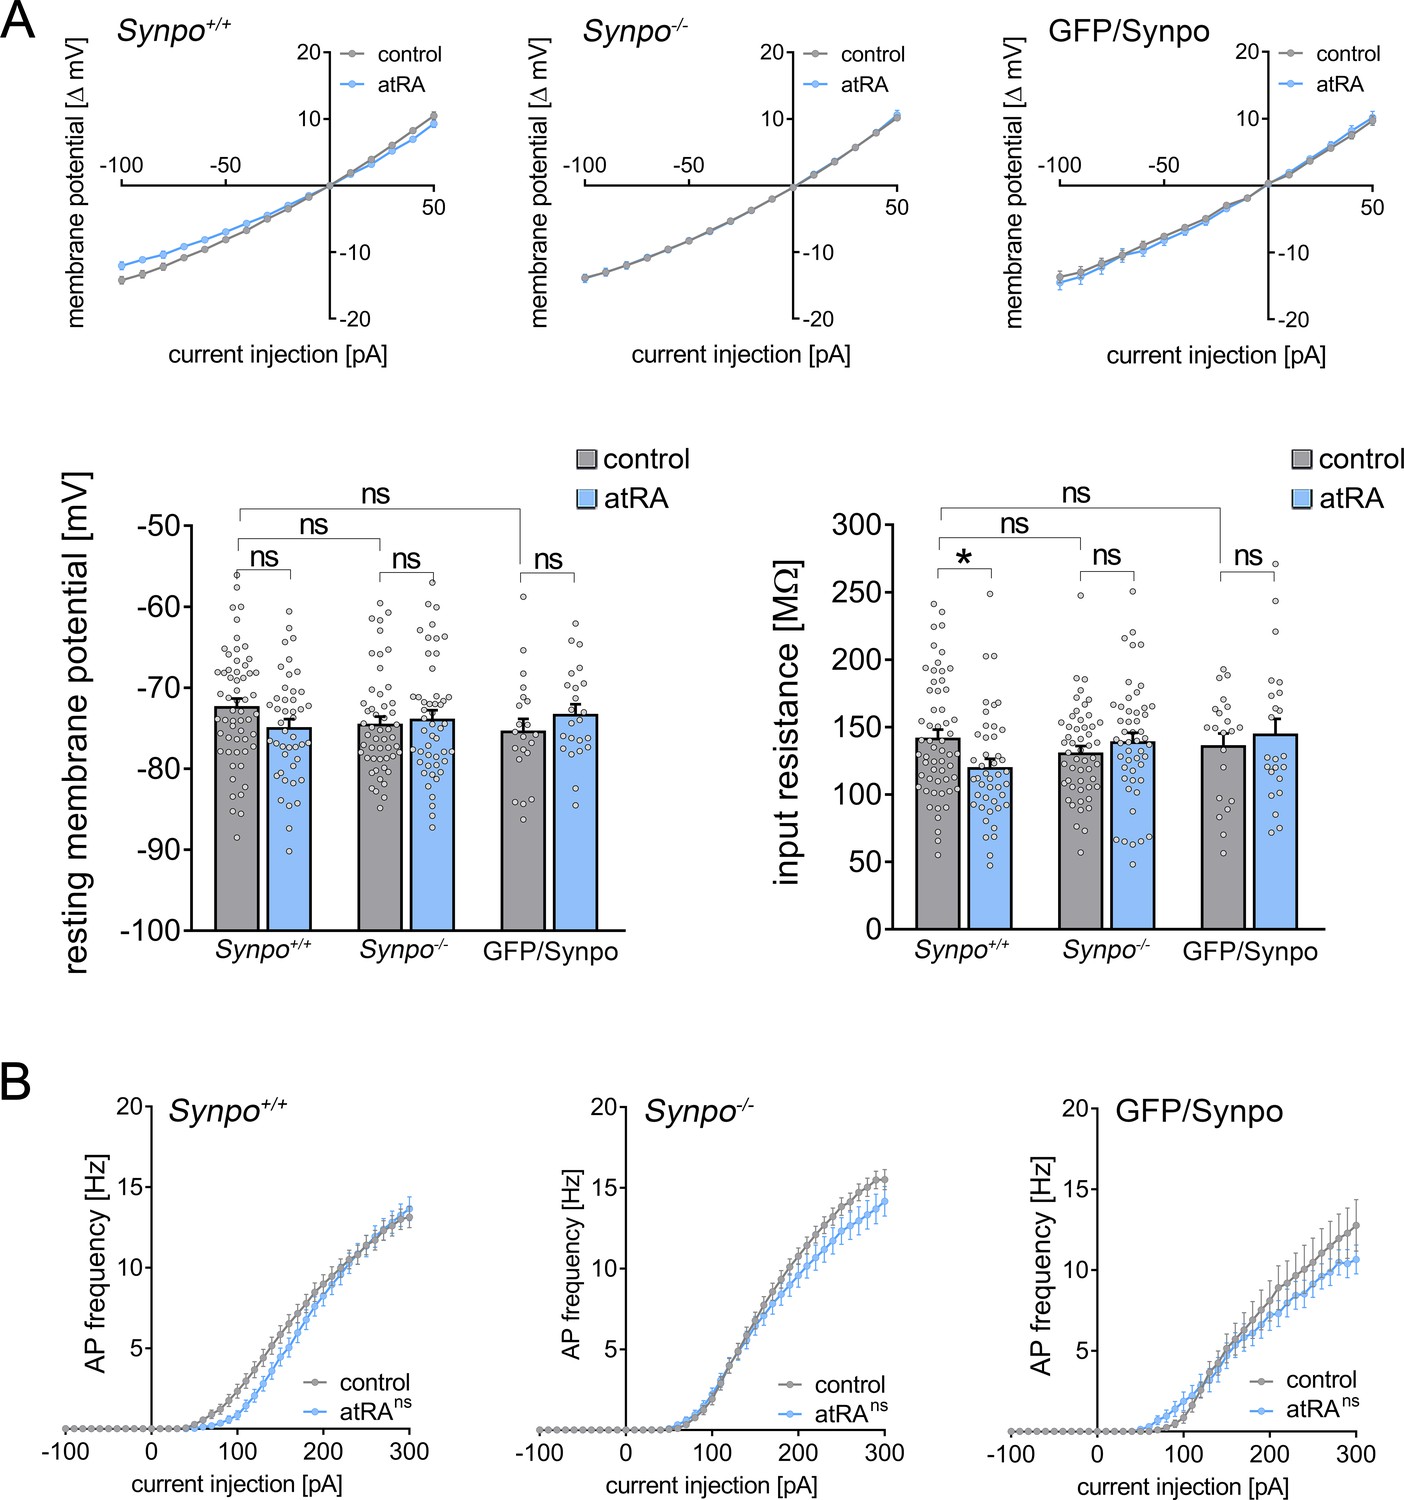
Analysis of intrinsic cellular properties from superficial pyramidal neurons in wild-type and synaptopodin-deficient slices upon atRA treatment.
(A) Input–output curves of superficial pyramidal neurons and group data of the input resistance and the resting membrane potential in wild-type (Synpo+/+) and synaptopodin-deficient slices (Synpo–/–). While the resting membrane potential is not affected in both animal cohorts, the input resistance is significantly decreased in wild type but not synaptopodin-deficient preparations upon atRA treatment. Notably, no significant difference in passive membrane properties can be detected between wild-type and synaptopodin-deficient superficial pyramidal neurons (Synpo+/+: ncontrol = 57 cells, natRA = 44 cells in seven independent experiments; Synpo–/–: ncontrol = 51 cells, natRA = 49 cells in seven independent experiments; Thy1-GFP/Synpo: ncontrol = 21 cells, natRA = 23 cells in three independent experiments Kruskal–Wallis test followed by Dunn’s multiple comparisons). (B) XY-plots of the action potential frequency from the same cells in both animal cohorts. atRA did not elicit changes in AP frequency regardless of the presence of synaptopodin (RM two-way ANOVA followed by Sidak’s multiple comparisons), while synaptopodin-deficient neurons seemed to display higher firing rates upon increasing current injections compared to wild-type neurons. Individual data points are indicated by colored dots. Values represent mean ± s.e.m. (ns, non-significant difference, *p<0.05).
Figure 3—figure supplement 2

Comparison of baseline spontaneous excitatory synaptic transmission in wild-type, synaptopodin-deficient, and transgenic GFP/Synpo superficial pyramidal neurons of the medial prefrontal cortex.
We found a significant higher tone of both sEPSC amplitude and frequency in synaptopodin-deficient preparations under baseline conditions when compared to wild-type preparations. Of note, no difference in sEPSC amplitude but frequency was evident in transgenic GFP/Synpo expressing preparations (Synpo+/+: n = 58 cells, Synpo–/–: n = 51 cells in seven independent experiments each; Thy1-GFP/Synpo: n = 22 cells in three independent experiments; Kruskal–Wallis followed by Dunn’s multiple comparisons). Individual data points are indicated by individual dots. Values represent mean ± s.e.m. (**p<0.01, ***p<0.001; ns, non-significant difference).
Figure 4 with 1 supplement

All-trans retinoic acid (atRA)-induced strengthening of excitatory synapses depends on mRNA translation, but not gene transcription.
(A, B) Group data (A) of AMPA receptor-mediated spontaneous excitatory postsynaptic currents (sEPSCs) recorded from superficial (layer 2/3) pyramidal neurons of the dorsomedial prefrontal cortex in slices prepared from wild-type mice treated with atRA in the presence of actinomycin D (5 µg/ml) or vehicle-only (vehicle-only: ncontrol = 27 cells, natRA = 21 cells in four independent experiments; actinomycin D: ncontrol = 39 cells, natRA = 37 cells in six independent experiments; Kruskal–Wallis test followed by Dunn’s multiple comparisons). Cumulative distribution (B) of sEPSC amplitudes in actinomycin D co-incubated slices confirms the atRA-induced strengthening of spontaneous excitatory neurotransmission (B; RM two-way ANOVA followed by Sidak’s multiple comparisons). (C, D) Group data (C) of AMPA receptor-mediated sEPSCs recorded from superficial (layer 2/3) pyramidal neurons of the dorsomedial prefrontal cortex in slices prepared from wild-type mice treated with atRA in the presence of anisomycin (10 µM) or vehicle-only (vehicle-only: ncontrol = 27 cells, natRA = 22 cells in four independent experiments; anisomycin: ncontrol = 38 cells, natRA = 40 cells in six independent experiments; Kruskal–Wallis test followed by Dunn’s multiple comparisons). Cumulative distribution (D) of sEPSC amplitudes in anisomycin co-incubated slices confirms that anisomycin blocks atRA-mediated plasticity at excitatory synapses (RM two-way ANOVA followed by Sidak’s multiple comparisons). Individual data points are indicated by gray dots. Values represent mean ± s.e.m. (ns, non-significant difference, *p<0.05, **p<0.01).
Figure 4—figure supplement 1
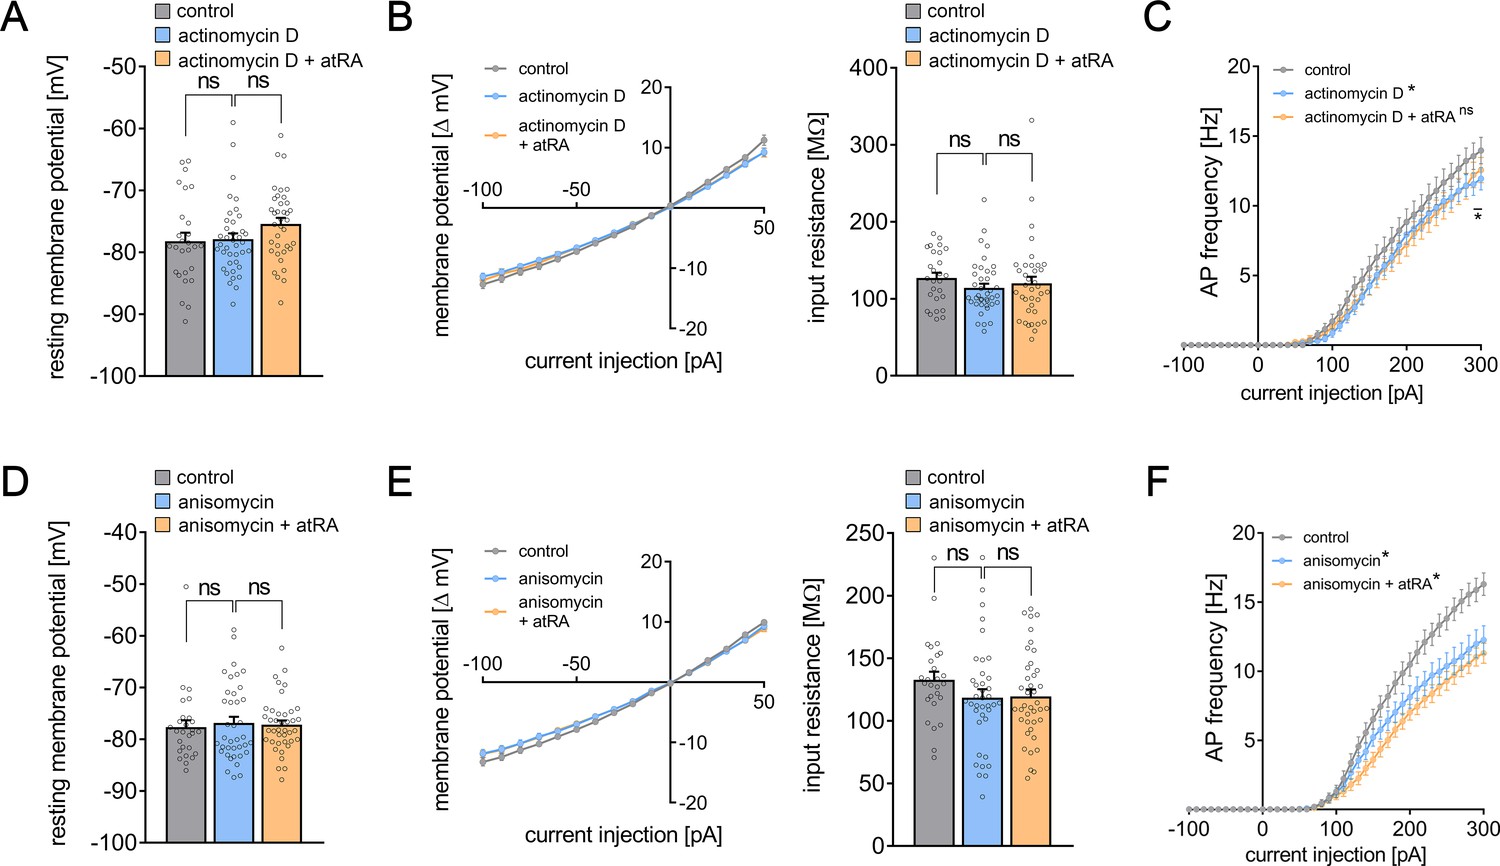
Intrinsic cellular properties of superficial pyramidal neurons upon atRA treatment and simultaneous pharmacological inhibition of either gene transcription or mRNA translation.
(A–C) Actinomycin D (5 µg/ml) was used to pharmacologically inhibit gene transcription during the atRA treatment. When co-incubated with actinomycin D, atRA did change neither the resting membrane potential nor the input-output properties, that is, the input resistance of mouse superficial pyramidal neurons in the mPFC (A, B). Furthermore, actinomycin D incubation results in comparable passive membrane properties as reported for vehicle-only-treated slices excluding major toxic effects of actinomycin D in our experimental setting. (C) Assessing action potential frequency upon increasing current injections, we found no difference in the actinomycin D-treated groups upon atRA co-incubation. Notably, a subsidiary but significant decrease in AP frequency was detected between vehicle-only- and actinomycin D-treated slices in higher current injections (ncontrol = 27 cells in four independent experiments; nactinomycin D = 39, nactinomycin D+atRA = 37 cells in seven independent experiments; one cell excluded from action potential frequency analysis in the actinomycin group; Kruskal–Wallis test followed by Dunn’s multiple comparisons; the XY-plot in the AP frequency was statistically evaluated using an RM two-way ANOVA followed by Tukey’s multiple comparisons). (D–F) In another set of experiments, anisomycin (10 µM) was used to block mRNA translation during the atRA treatment. We ruled out major toxic effects of anisomycin since passive membrane properties, that is, the resting membrane potential and the input resistance were not altered when compared to vehicle-only-treated slices (D, E). Nevertheless, anisomycin treatment significantly reduced cellular excitability although a dynamic increase upon increasing current injections was evident (F). When atRA co-incubated with anisomycin, atRA-mediated changes in either passive or active membrane properties became evident (ncontrol = 27 cells in four independent experiments; nanisomycin = 38, nanisomycin+atRA = 40 cells in seven independent experiments; Kruskal–Wallis test followed by Dunn’s multiple comparisons; the XY-plot in the AP frequency was statistically evaluated using an RM two-way ANOVA followed by Tukey’s multiple comparisons). Individual data points are indicated by individual dots. Values represent mean ± s.e.m. (ns, not significant difference; *p<0.05, **p<0.01).
Figure 5
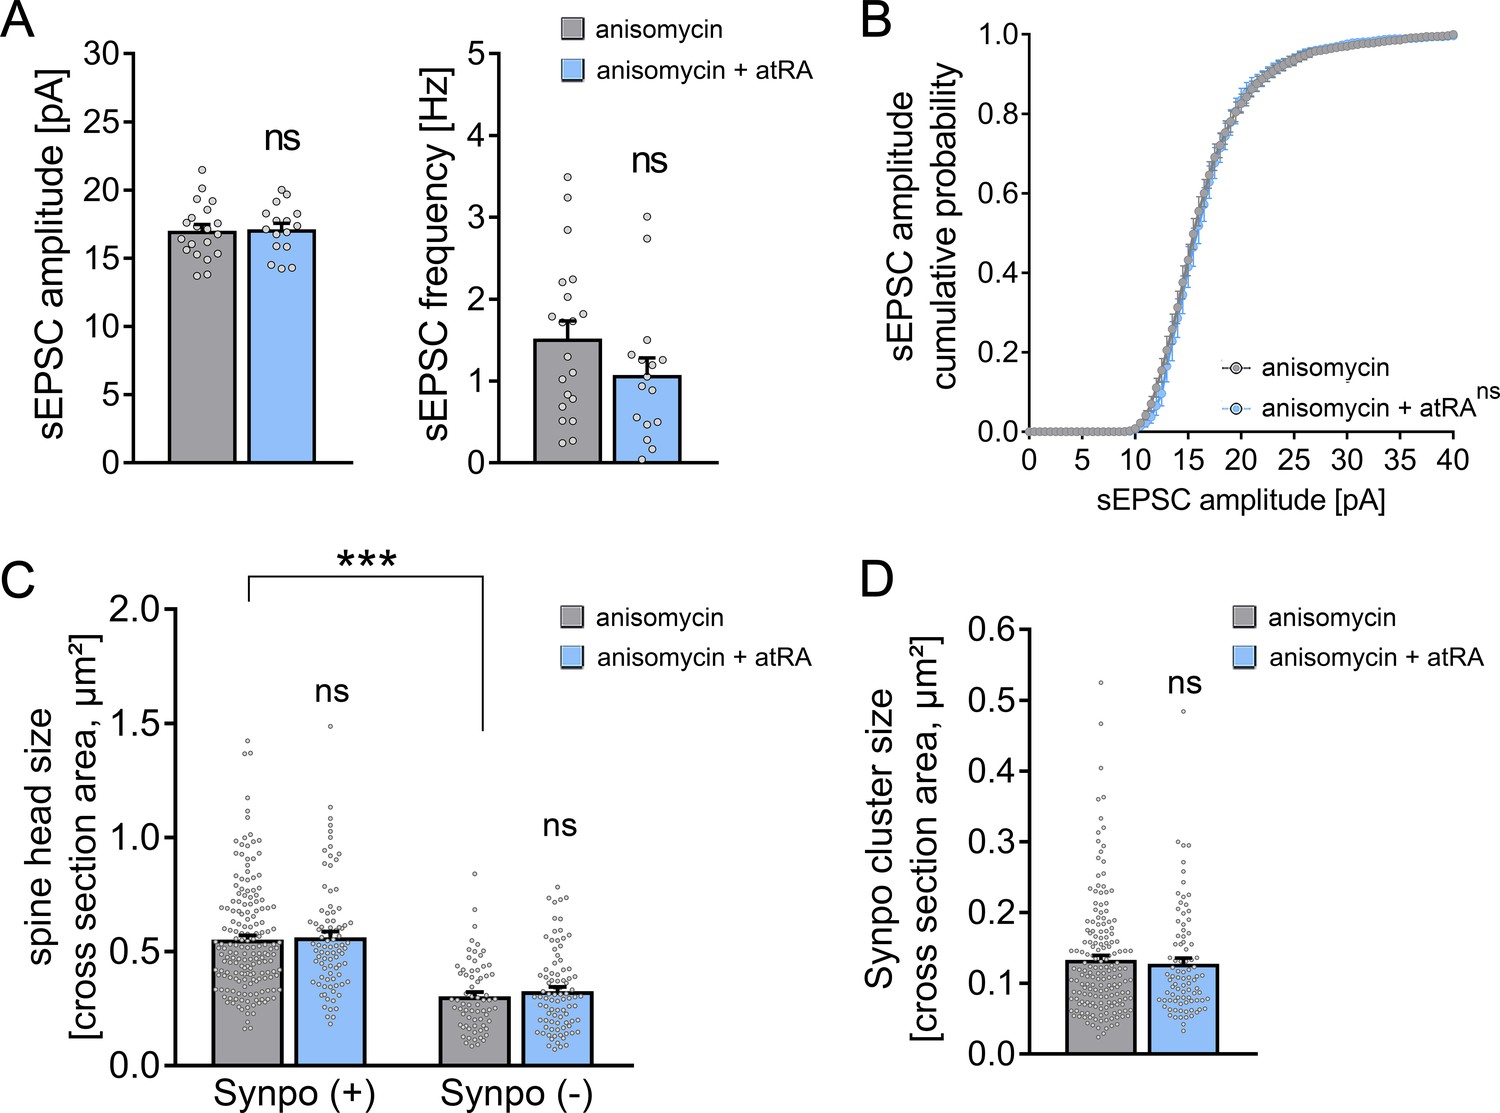
Pharmacologic inhibition of mRNA translation prevents all-trans retinoic acid (atRA)-induced synaptic plasticity in human cortical slices.
(A, B) Group data (A) of AMPA receptor-mediated spontaneous excitatory postsynaptic currents (sEPSCs) and cumulative distribution (B) of sEPSC amplitudes recorded from superficial (layer 2/3) pyramidal neurons in adult human cortical slices treated with atRA (1 µM, 6–10 hr) or vehicle-only in the presence of anisomycin (10 µM; ncontrol = 20 cells, natRA = 16 cells in three independent experiments; Mann–Whitney test for column statistics; RM two-way ANOVA followed by Sidak’s multiple comparisons for statistical evaluation of cumulative sEPSC amplitude distribution). (C, D) Spine head sizes (C) and synaptopodin cluster sizes (D) in human cortical slices treated with atRA or vehicle-only in the presence of anisomycin (c.f., Figure 2F,G; synaptopodin-positive spines: ncontrol = 175, natRA = 88; synaptopodin-negative spines: ncontrol = 69, natRA = 88, 1–11 segments per sample in three independent experiments; Kruskal–Wallis test followed by Dunn’s multiple comparisons for spine head size and Mann–Whitney test for synaptopodin cluster size). Individual data points are indicated by gray dots. Values represent mean ± s.e.m. (ns, non-significant difference, ***p<0.001).
Tables
Key resources table
| Reagent type (species) or resource | Designation | Source or reference | Identifiers | Additional information |
|---|---|---|---|---|
| Antibody | Anti-Synaptopodin (Rabbit polyclonal) | Synaptic Systems | Cat#: 163002 RRID:AB_887825 | IF (‘1:1000’) EM (‘1:100’) |
| Antibody | Anti-NeuN (Rabbit polyclonal) | Abcam | Cat#: ab104225 RRID:AB_10711153 | IF (‘1:500’) |
| Antibody | Anti-Rabbit IgG (H+L) Highly Cross-Adsorbed Secondary Antibody, Alexa Fluor 488 (Goat polyclonal) | Invitrogen | Cat#: A-11034, RRID:AB_2576217 | IF (‘1:1000’) |
| Antibody | Anti-Rabbit IgG (H+L) Highly Cross-Adsorbed Secondary Antibody, Alexa Fluor Plus 555 (Goat polyclonal) | Invitrogen | Cat#: A-32732, RRID:AB_2633281 | IF (‘1:1000’) |
| Antibody | Anti-Rabbit IgG Nanogold-Fab' (goat polyclonal) | Nanoprobes | Cat#: 2004 RRID:AB_2631182 | EM (‘1:100’) |
| Biological sample (Homo sapiens), male and female | Sample | Biobank of the Department for Neurosurgery at the Faculty of Medicine, University of Freiburg, AZ 472/15_160880 | Approval of the Local Ethics Committee, University of Freiburg, AZ 593/19 | |
| Chemical compound, drug | DAPI (1 mg/ml in water) | Thermo Scientific | Cat#: 62248 | IF and post hoc labeling (‘1:5000’) |
| Chemical compound, drug | Pierce16% Formaldehyde (w/v), methanol-free | Thermo Scientific | Cat#: 28906 | Final concentration: (4% in PBS) |
| Chemical compound, drug | Glutardialdehyd | Carl Roth | Cat#: 4157.2 | Final concentration: 2.5% (TEM) and 0.1% (Immunogold) |
| Chemical compound, drug | All-trans retinoic acid | Sigma–Aldrich | Cat#: R2625 | Final concentration: 1 µM |
| Chemical compound, drug | Anisomycin | Abcam | Cat#: ab120495 | Final concentration: 10 µM |
| Chemical compound, drug | Actinomycin D | Sigma–Aldrich | Cat#: A9415 | Final concentration: 5 µg/ml |
| Commercial assay, kit | HQ Silver Enhancement Kit | Nanoprobes | Cat#: 2012 | |
| Genetic reagent Mus musculus, male | B6.129-Synpotm1Mndl/Dllr; Synpo−/− | Vlachos et al., 2013 PMID:23630268 | MGI: 6423115 | Obtained from Deller Lab (Frankfurt) |
| Genetic reagent Mus musculus, male | B6.Cg-Synpotm1MndlTg(Thy1-Synpo/GFP)1Dllr/Dllr; Thy1-GFP/Synpo+/− x Synpo−/− | Vlachos et al., 2013 PMID:23630268 | MGI: 6423116 | Obtained from Deller Lab (Frankfurt) |
| Peptide, recombinant protein | Streptavidin, Alexa Fluor 488-Conjugate | Invitrogen | Cat#: S32354 RRID:AB_2315383 | Post hoc labeling (‘1:1000’) |
| Software, algorithm | Prism | GraphPad | RRID:SCR_002798 | |
| Software, algorithm | Clampfit (pClamp software package) | Molecular Devices | RRID:SCR_011323 | |
| Software, algorithm | ImageJ | RRID:SCR_003070 | ||
| Software, algorithm | Photoshop | Adobe | RRID:SCR_014199 | |
| Strain, strain background Mus musculus | C57BL/6J; Synpo+/+ | Jackson Laboratory | RRID: IMSR_JAX:000664 |
Additional files
-
Supplementary file 1
Cortical resection samples.
- https://cdn.elifesciences.org/articles/63026/elife-63026-supp1-v1.docx
-
Transparent reporting form
- https://cdn.elifesciences.org/articles/63026/elife-63026-transrepform-v1.pdf
Download links
A two-part list of links to download the article, or parts of the article, in various formats.
Downloads (link to download the article as PDF)
Open citations (links to open the citations from this article in various online reference manager services)
Cite this article (links to download the citations from this article in formats compatible with various reference manager tools)
All-trans retinoic acid induces synaptic plasticity in human cortical neurons
eLife 10:e63026.
https://doi.org/10.7554/eLife.63026


