The olfactory critical period is determined by activity-dependent Sema7A/PlxnC1 signaling within glomeruli
- Department of Brain Function, School of Medical Sciences, University of Fukui, Japan
- Department of Animal Science and Biotechnology, School of Veterinary Medicine, Azabu University, Japan
- Department of Molecular and Cell Biology, Graduate School of Agricultural Science, Tohoku University, Japan
Figures
Figure 1 with 1 supplement
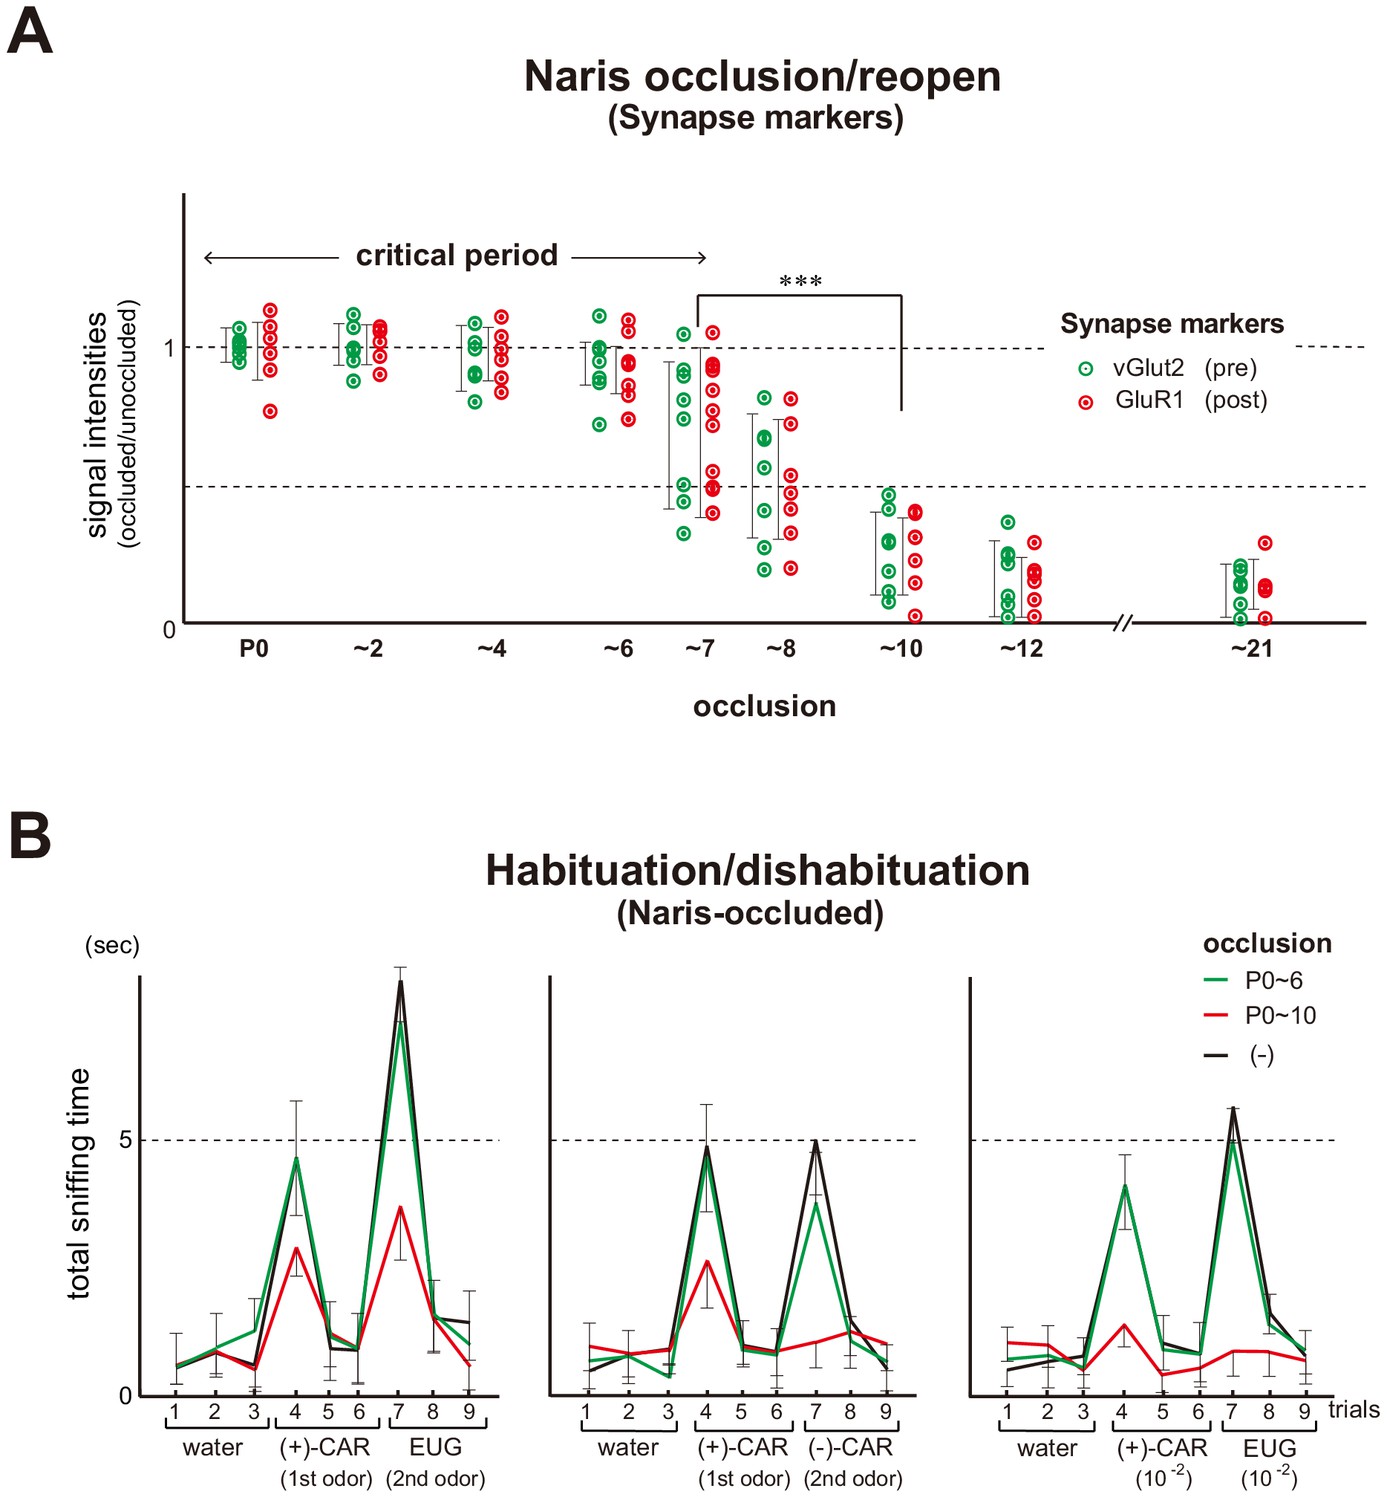
Unilateral naris occlusion in the mouse neonates.
(A) Effects of naris occlusion on the expression of synapse markers within glomeruli. Mice were unilaterally occluded at P0 and the occluded naris was reopened at various time points. OB samples were isolated at P21 and analyzed by immunostaining for pre- and post-synapse markers, vGlut2 and GluR1, respectively. Relative staining levels of these markers in the glomerular layer are compared. Error bars are SD (n = 10 glomeruli for each condition). See also Figure 1—figure supplement 1. (B) Odor detection in the naris-occluded mice. Six-week-old mice used in this assay were unilaterally naris-occluded at P0 and the occluded naris was reopened at P6 (green) or P10 (red). Mice without occlusion (–) were analyzed as controls (black). Mice were habituated to the cage and then a filter paper spotted with 0.5 μl of distilled water was presented for 3 min. This was repeated three times with 1 min intervals (control trials 1–3). Next, a filter paper spotted with the 1st odor was presented three times (detection trials 4–6). Then, a filter paper spotted with the 2nd odor was presented three times (detection trials 7–9). Investigation times (sec) observed during each presentation were measured. Odorant pairs examined were as follows: left, 6.2 M (+)-CAR and 6.4 M EUG; middle, 6.2 M (+)-CAR and 6.3 M (–)-CAR; and right, 62 mM (+)-CAR and 64 mM EUG. Error bars are SD (n = 15, 12, 10 animals, 10 litters). ***p<0.005 (Student’s t-test). n.s., not significant. CAR, carvone; EUG, eugenol.
-
Figure 1—source data 1
Odor detection in the naris-occluded mice.
Six-week-old mice used in this assay were unilaterally naris-occluded at P0 and the occluded naris was reopened at P6 or P10. Mice without occlusion (–) were analyzed as controls. Mice were habituated to the cage and then a filter paper spotted with 0.5 μl of distilled water was presented for 3 min. This was repeated three times with 1 min intervals (control trials 1–3). Next, a filter paper spotted with the 1 st odor was presented three times (detection trials 4–6). Then, a filter paper spotted with the 2nd odor was presented three times (detection trials 7–9). Investigation times (s) observed during each presentation were measured. Odorant pairs examined were as follows: top, 6.2 M (+)-CAR and 6.4 M EUG; middle, 6.2 M (+)-CAR and 6.3 M (–)-CAR; and bottom, 62 mM (+)-CAR and 64 mM EUG. CAR, carvone; EUG, eugenol. The average values of investigation times are shown.
- https://cdn.elifesciences.org/articles/65078/elife-65078-fig1-data1-v1.xlsx
Figure 1—figure supplement 1
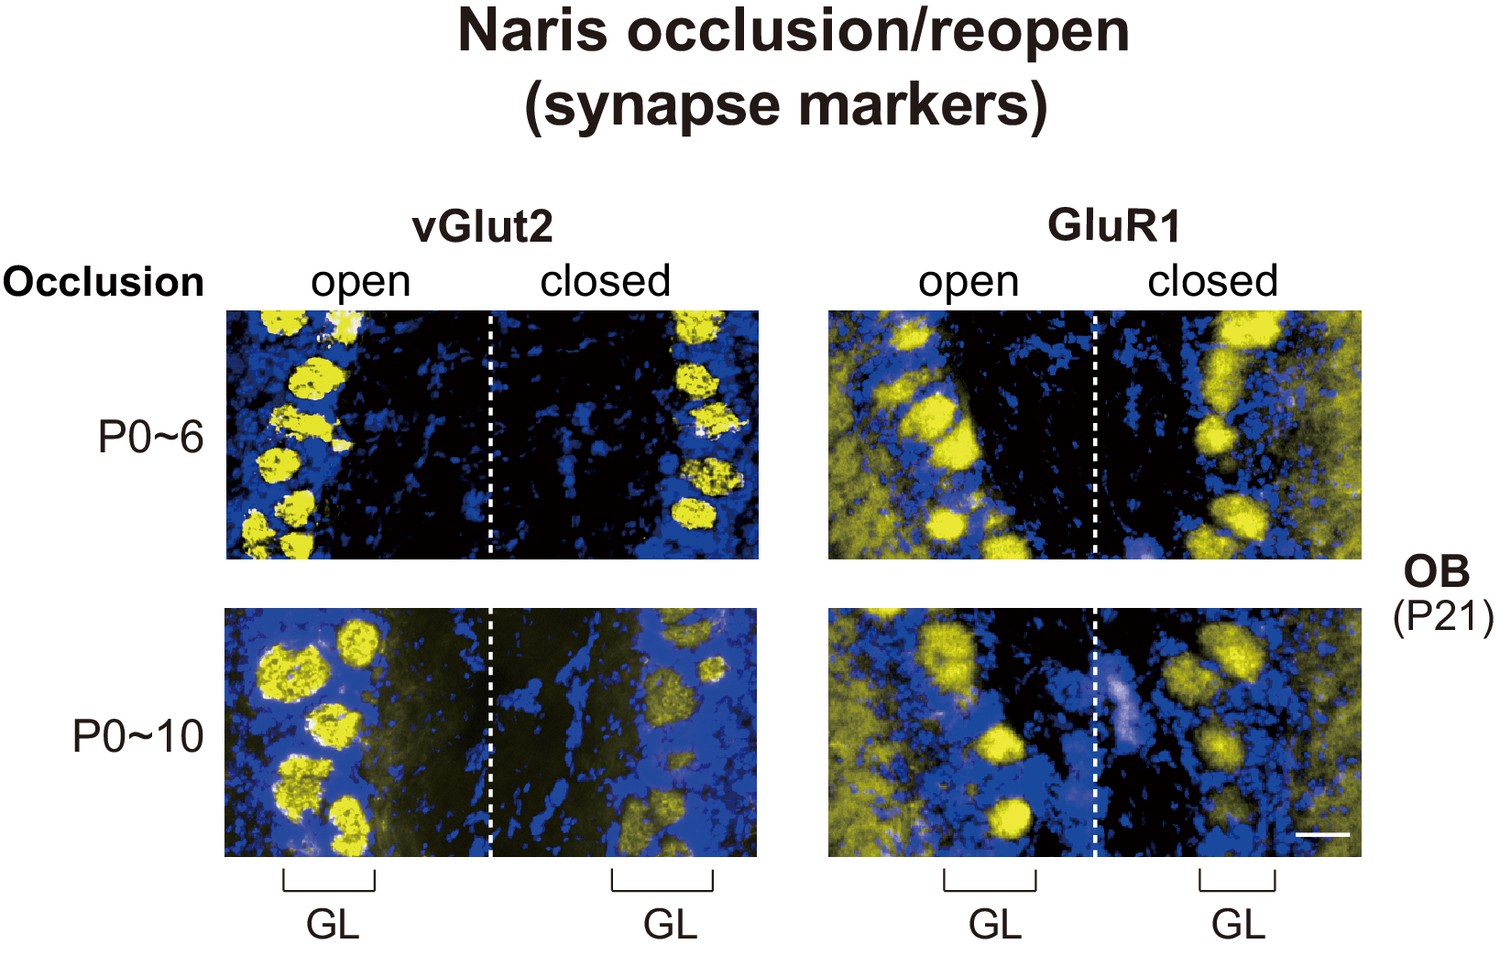
Effects of naris occlusion on the expression of synapse markers within glomeruli.
Mice were unilaterally occluded at P0 and the occluded naris was reopened at P6 or 10. OB samples were isolated at P21 and analyzed by immunostaining for pre- and post-synapse markers, vGlut2 and GluR1, respectively. See also Figure 1A. Scale bar, 20 μm. GL, glomerular layer.
Figure 2

Effects of neonatal odor experience on odor perception in adults.
Odor detection in the vanillin (VNL)-conditioned mice. Mice were habituated to the cage and then a filter paper spotted with 0.5 μl of distilled water was presented for 3 min. This was repeated three times with 1 min intervals (control trials 1–3). Then, a filter paper spotted with 0.5 μl of 20 mM VNL or 6.4 M eugenol (EUG) was presented three times (detection trials 4–6). Investigation times (sec) observed during each presentation were measured. Mice were conditioned to VNL at P2~4 (green) or P9~11 (red), and were analyzed as adults at 6w. Mice without VNL conditioning (–) were analyzed as controls (black). Odorants with 10−3 dilution were also analyzed and shown in the right of each figure set. Error bars are SD (n = 5, 6, 7 animals, 5 litters).
-
Figure 2—source data 1
Odor detection in the vanillin (VNL)-conditioned mice.
Mice were habituated to the cage and then a filter paper spotted with 0.5 μl of distilled water was presented for 3 min. This was repeated three times with 1 min intervals (control trials 1–3). Then, a filter paper spotted with 0.5 μl of 20 mM VNL or 6.4 M eugenol (EUG) was presented three times (detection trials 4–6). Investigation times (s) observed during each presentation were measured. Mice were conditioned to VNL at P2~4 or P9~11, and were analyzed as adults at 6 weeks (6w). Mice without VNL conditioning (–) were analyzed as controls. Odorants with 10−3 dilution were also analyzed. The average values of investigation times are shown.
- https://cdn.elifesciences.org/articles/65078/elife-65078-fig2-data1-v1.xlsx
Figure 3 with 3 supplements
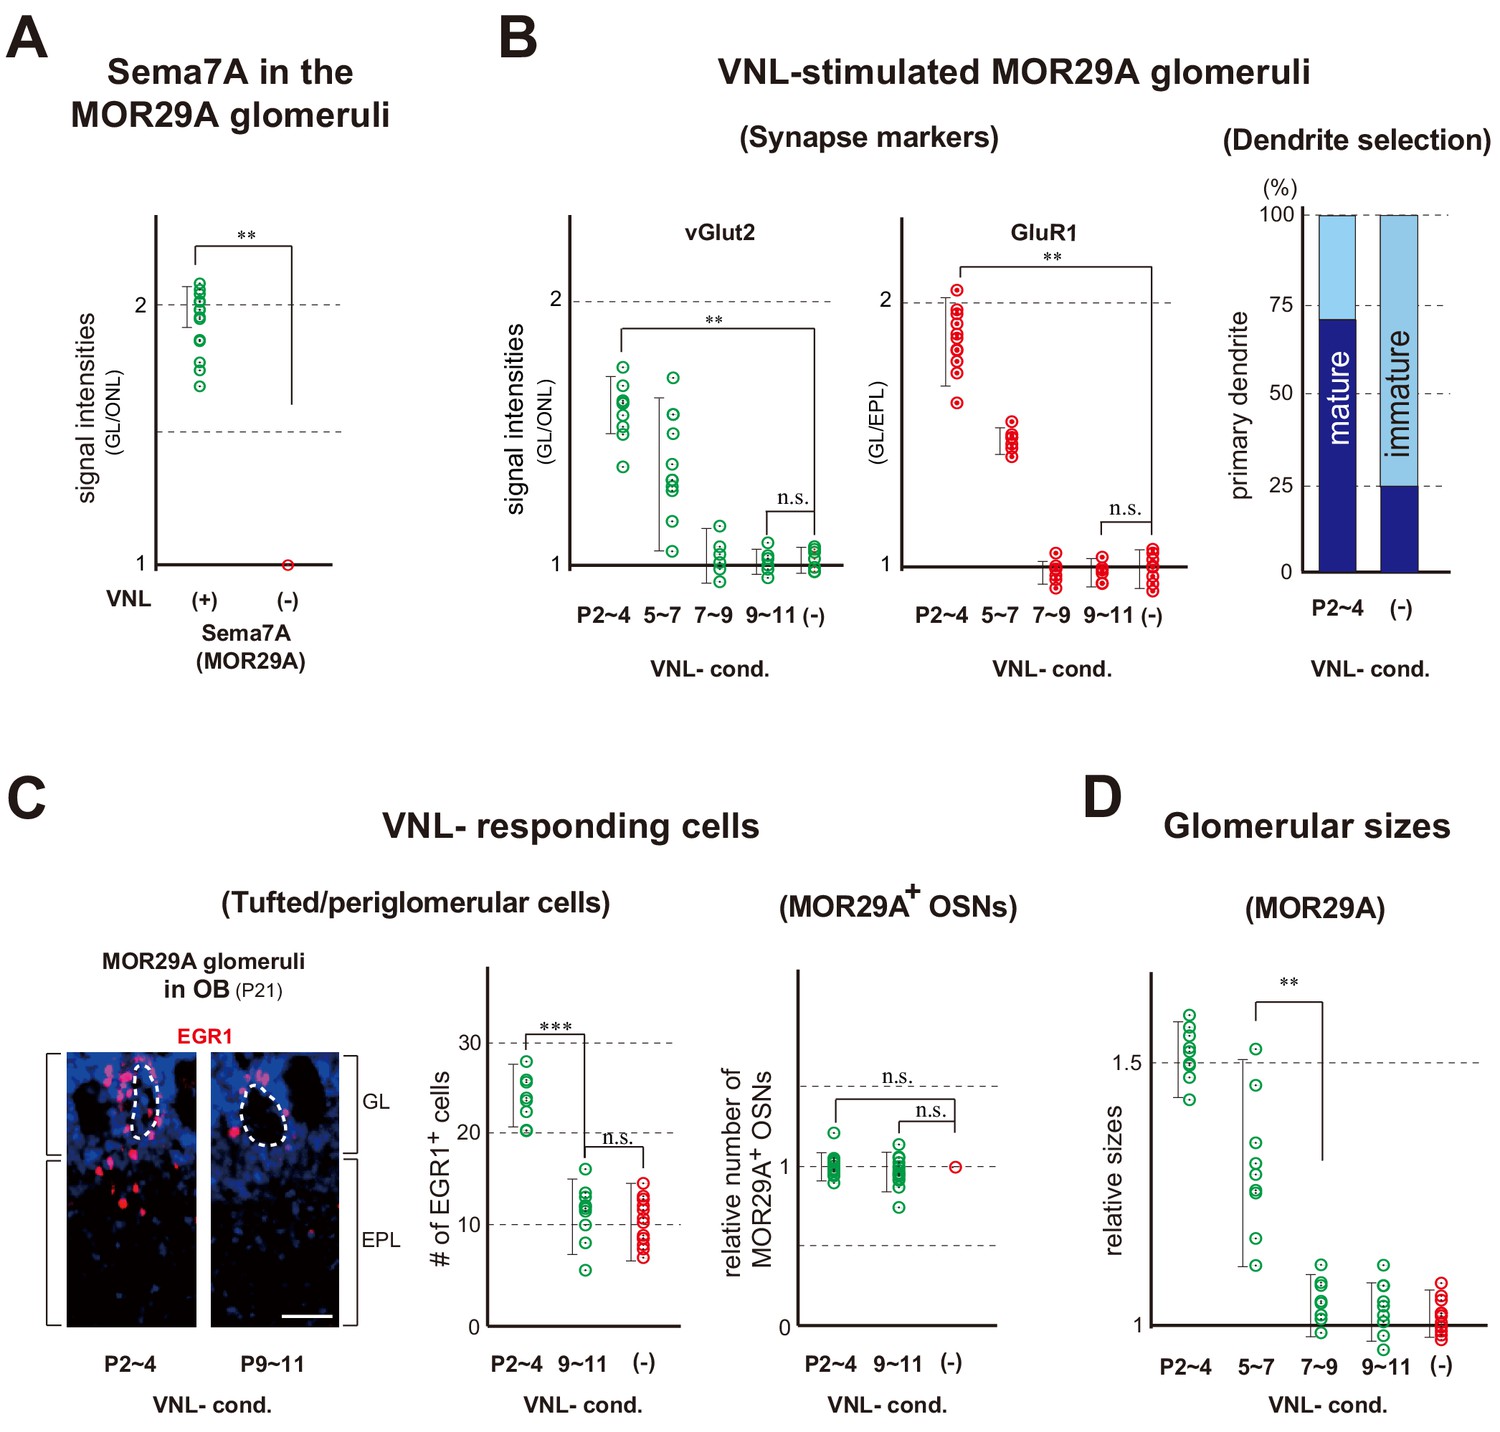
Glomerular changes by odor exposure in neonates.
(A) Sema7A expression stimulated by VNL exposure. The ECFP-tagged MOR29A glomeruli were analyzed by immunohistochemistry after the exposure to VNL at P2~4. OB sections were immunostained at P4 using antibodies against Sema7A. Relative fluorescent signals within the MOR29A glomeruli were analyzed in the mice with (+) or without (–) VNL exposure. **p<0.01 (Student’s t-test). Error bars are standard deviation, SD (n = 6 animals for each condition). See also Figure 3—figure supplement 1A. (B) MOR29A glomeruli in the VNL-exposed mice. Left: Changes in the levels of synapse markers. Pups were exposed to VNL at different time periods, and the OB sections at P11 were immunostained for pre- and post-synapse markers, vGlut2 and GluR1, respectively. Signal intensities within the glomerular layer (GL) were normalized by those detected in the olfactory nerve layer (ONL) or external plexiform layer (EPL), and compared with the VNL-unexposed controls (–). **p<0.01 (Student’s t-test). n.s., not significant. Error bars indicate SD (n = 6, 3, 3, 5, 5 glomeruli for each condition). See also Figure 3—figure supplement 1B. Right: Dendrite selection within the MOR29A glomeruli. The mice conditioned to VNL (P2~4) and unconditioned (–) were analyzed. M/T cells at P4 were visualized by Lucifer yellow (LY) injection into the glomeruli (Figure 3—figure supplement 2). Intracellular LY injection was performed as previously described (Inoue et al., 2018). The numbers of M/T cells with one dendrite (mature) and those with multiple dendrites (immature) were counted in the MOR29A glomeruli. The ratios (%) of mature (dark blue) and immature (cyan) M/T cells are shown: VNL-cond., 12/17 (70.6 %); VNL-uncond., 4/16 (25.0 %). n = 6, 5 glomeruli. See also Figure 3—figure supplement 2. (C) VNL-responding cells connecting to the MOR29A glomeruli. Left: Detection of tufted and periglomerular cells activated by VNL. The MOR29A glomeruli were identified by ECFP signals. The sections were then counter-stained with DAPI. Levels of an immediate-early gene product EGR1 (red) surrounding the MOR29A glomeruli were analyzed at 3w by immunostaining of OB sections (25 μm-thick). The mice were conditioned to VNL at P2~4 or P9~11. Middle: Quantification of EGR1 signals. EGR1 signals in the glomerular layer (GL) and external plexiform layer (EPL) were counted as activated periglomerular cells and tufted cells, respectively. Mice without VNL exposure in neonates were analyzed as controls (–). Error bars are SD (n = 4, 4, 5 animals). The one-way ANOVA was applied on values. ***p<0.005 (Student’s t-test). n.s., not significant. Scale bar is 30 μm. Right: MOR29A-positive OSNs. ECFP-tagged MOR29A OSNs in the OE were counted at P21 after the exposure to VNL at P2~4 or P9~11. To identify the MOR29A-positive OSNs, OE sections were immunostained with antibodies against GFP. Relative numbers of MOR29A+ OSNs are compared for the mice with (P2~4, 9~11) or without (–) VNL exposure. n.s., not significant. Error bars are standard deviation, SD (n = 6, 5, 4 animals). See also Figure 3—figure supplement 1C. (D) Glomerular sizes with or without VNL conditioning. Relative sizes (ratios of diametral areas) of the MOR29A glomeruli were measured at 3w after the VNL exposure at different time periods in neonates. Glomeruli without VNL exposure (–) were analyzed as negative controls. Error bars are SD (n = 6, 3, 3, 5, 5 animals). VNL, vanillin; GL, glomerular layer; ONL, olfactory nerve layer; EPL, external plexiform layer.
Figure 3—figure supplement 1

MOR29A glomeruli in the VNL-exposed mice.
(A) Sema7A expression in the MOR29A glomeruli. OB sections were immunostained with anti-Sema7A antibodies. MOR29A glomeruli with or without VNL-stimulation (P5~7) are shown. See also Figures 3A and 4B. Scale bar, 10 μm. (B) Changes in the levels of synapse markers. Pups were exposed to VNL at P2~4, and the OB sections at P11 were immunostained for pre- and post-synapse markers, vGlut2 and GluR1, respectively. VNL-unexposed mice were analyzed as negative controls (–). See also Figure 3B. Scale bar, 20 μm. (C) Detection of tufted and periglomerular cells activated by VNL within the MOR29A glomeruli. The mice were conditioned to VNL at P2~4 or P9~11, then exposed to VNL, and analyzed at 3w by immunostaining of EGR1. See also Figure 3C. Scale bar, 20 μm. VNL, vanillin; GL, glomerular layer; ONL, olfactory nerve layer; EPL, external plexiform layer.
Figure 3—figure supplement 2
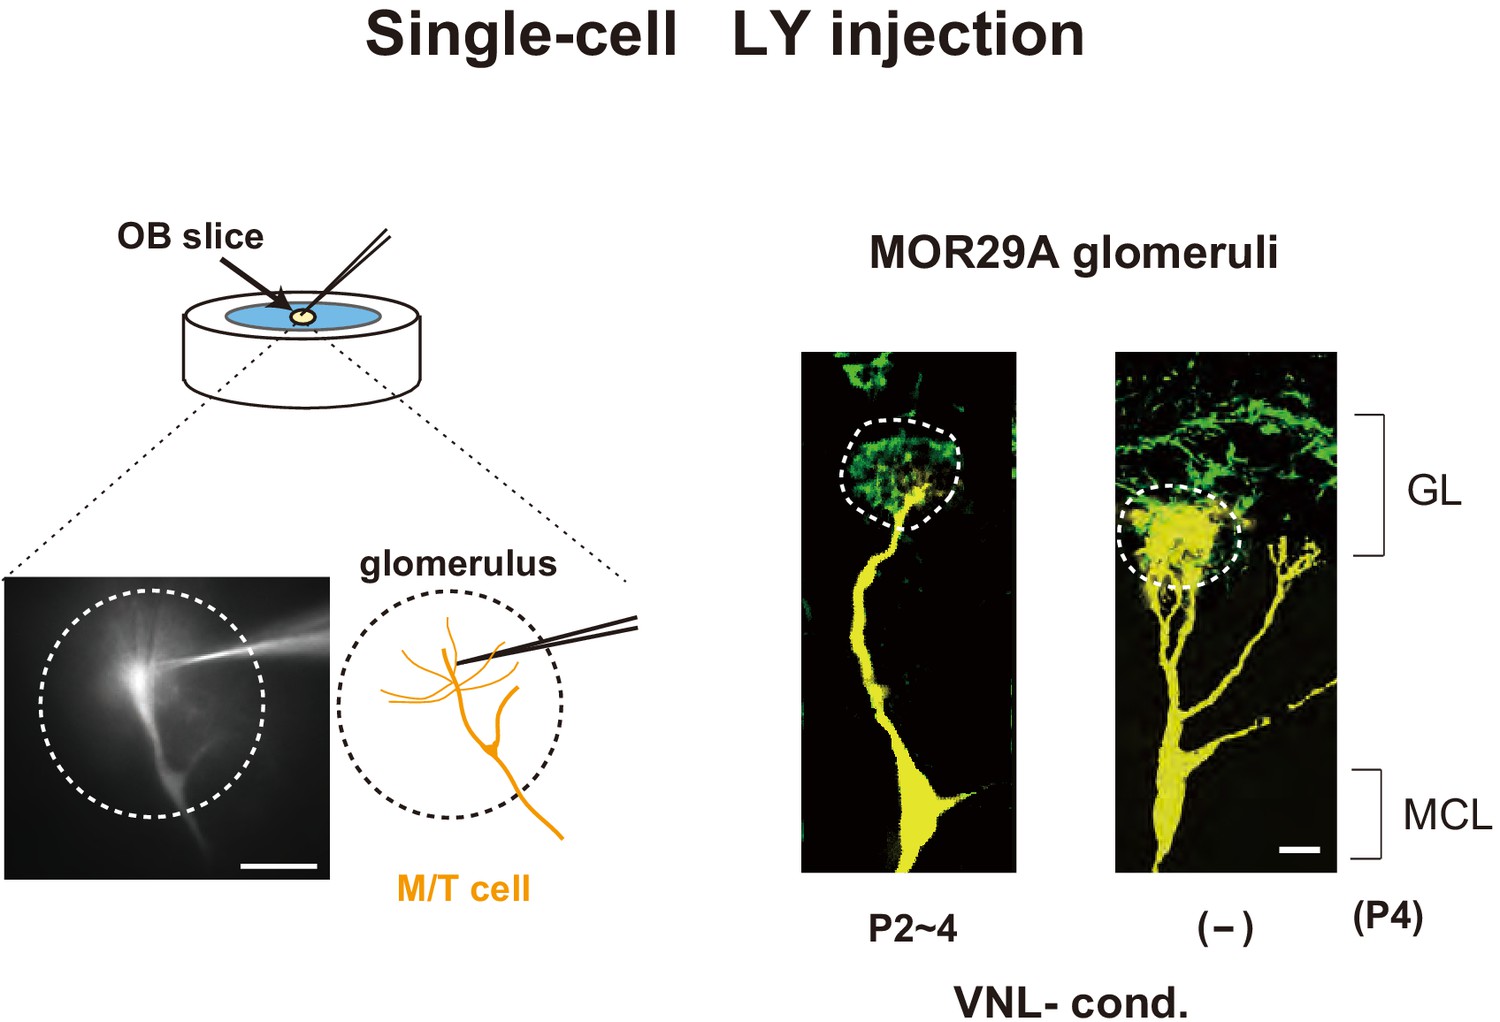
Lucifer yellow injection.
M/T cells were visualized by Lucifer yellow (LY) injection (Naritsuka et al., 2009; Inoue et al., 2018) into an OB slice containing the MOR29A glomerulus. The mice were exposed to vanillin (VNL) at P2~4 and analyzed at P4. The mice without VNL exposure (–) were used as negative controls. The MOR29A+ OSN axons were stained for ECFP. See also in Figure 3B, right. Scale bars, 10 μm. GL, glomerular layer; MCL, mitral cell layer.
-
Figure 3—figure supplement 2—source data 1
Dendrite selection within the MOR29A glomeruli.
The mice conditioned to VNL (P2~4) and unconditioned (–) were analyzed. M/T cells at P4 were visualized by Lucifer yellow (LY) injection into the glomeruli (Figure 3—figure supplement 2). Intracellular LY injection was performed as previously described (Inoue et al., 2018). The numbers of M/T cells with one dendrite (mature) and those with multiple dendrites (immature) were counted in the MOR29A glomeruli. The ratios (%) of mature (dark blue) and immature (cyan) M/T cells are shown: VNL-cond., 12/17 (70.6 %); VNL-uncond., 4/16 (25.0 %). n = 6, 5 glomeruli.
- https://cdn.elifesciences.org/articles/65078/elife-65078-fig3-figsupp2-data1-v1.xlsx
Figure 3—figure supplement 3

Changes within the MOR29A glomeruli in the naris-occluded mice.
The Tg-MOR29A mice tagged with ECFP were unilaterally naris-occluded at P0, P0~4, or P7~11. OB samples were analyzed at P21. Left: Synapse markers. Relative intensities of vGlut2 and GluR1 were measured in the MOR29A glomeruli. Error bars are SD (n = 9, 8, 9 glomeruli). Middle: Sizes of the MOR29A glomeruli. Relative glomerular sizes (occluded / unoccluded) were measured at P21 after occlusion at P0, P0~4, or P7~11. Error bars are SD (n = 8, 8, 9 glomeruli). Right: Tufted cells and periglomerular cells activated by VNL. Expression of EGR1 was analyzed in the cells surrounding the MOR29A glomeruli by immunostaining at P21 after the occlusion at P0, P0~4, or P7~11. Error bars are SD (n = 8, 8, 9 glomeruli). ***p<0.005 (Student’s t-test). n.s., not significant.
Figure 4 with 1 supplement
Expression of Sema7A and PlxnC1 in the neonatal OB.
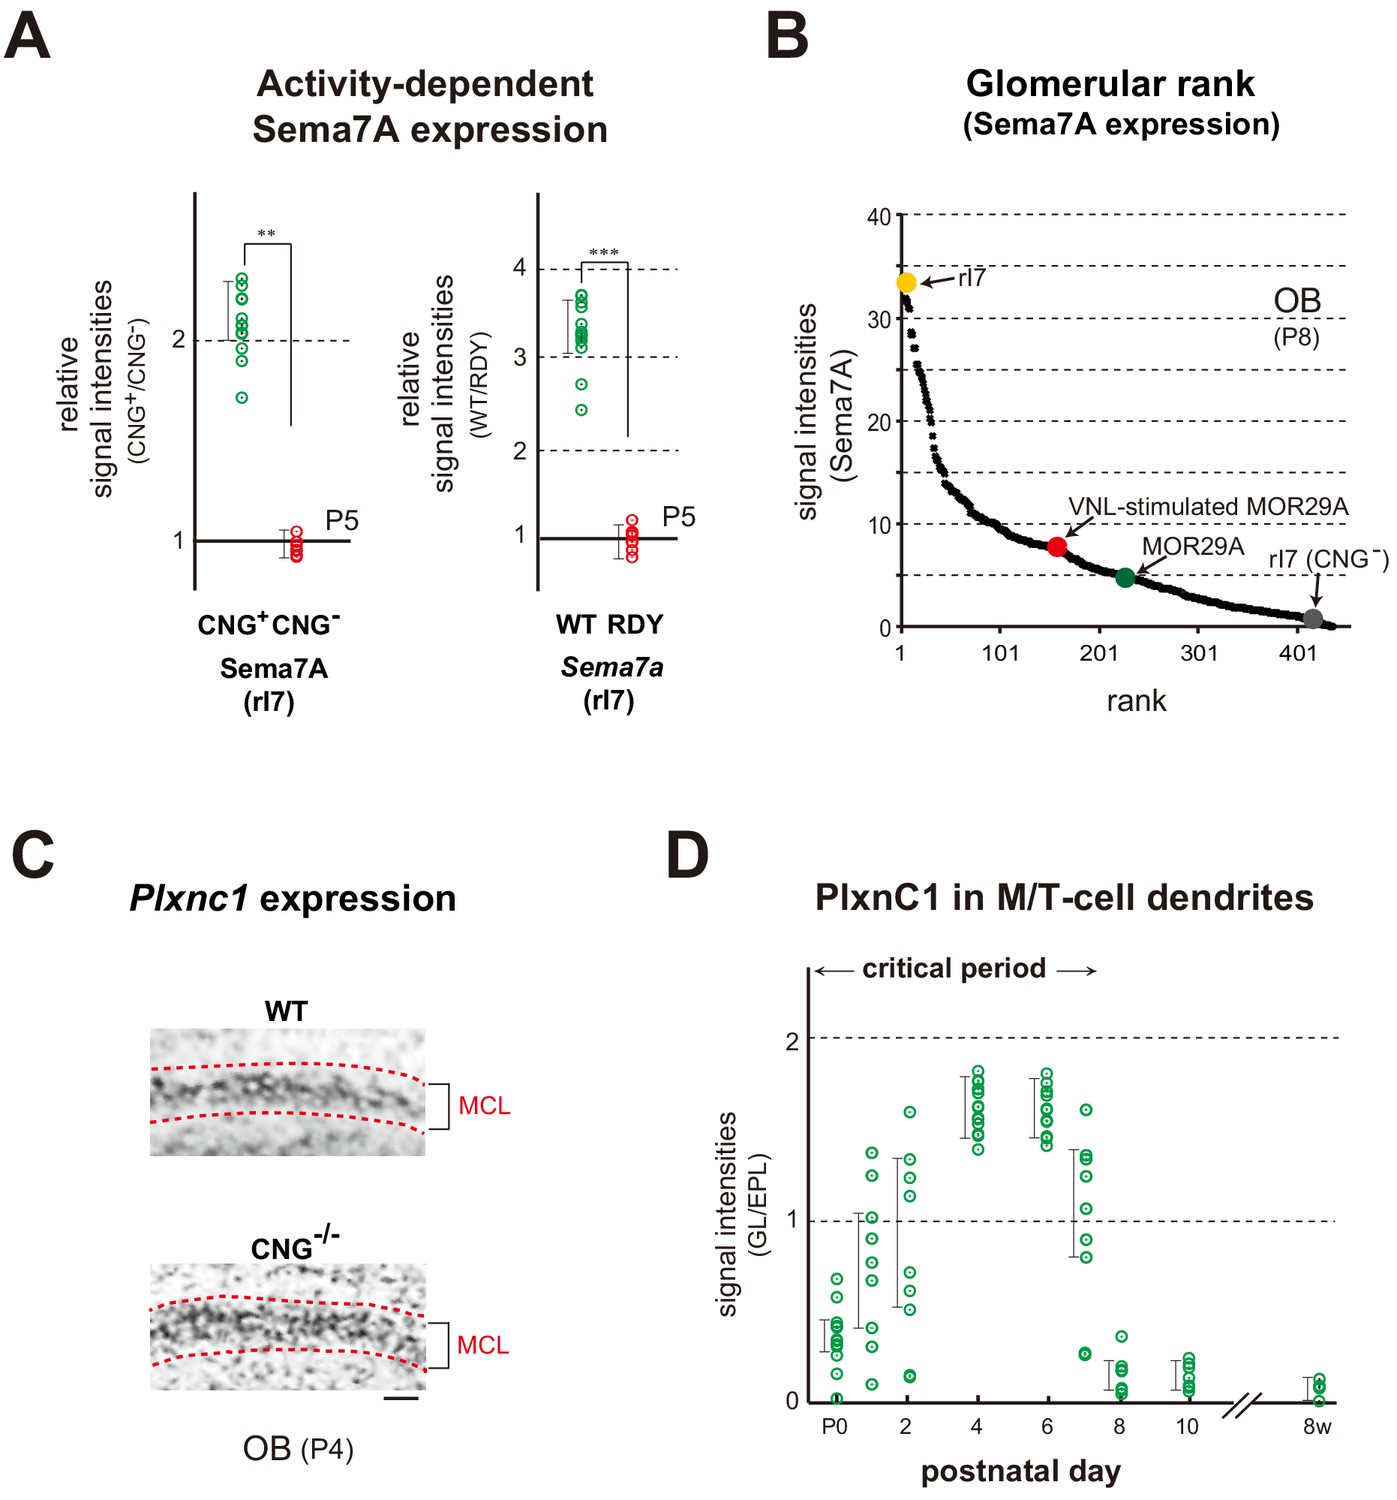
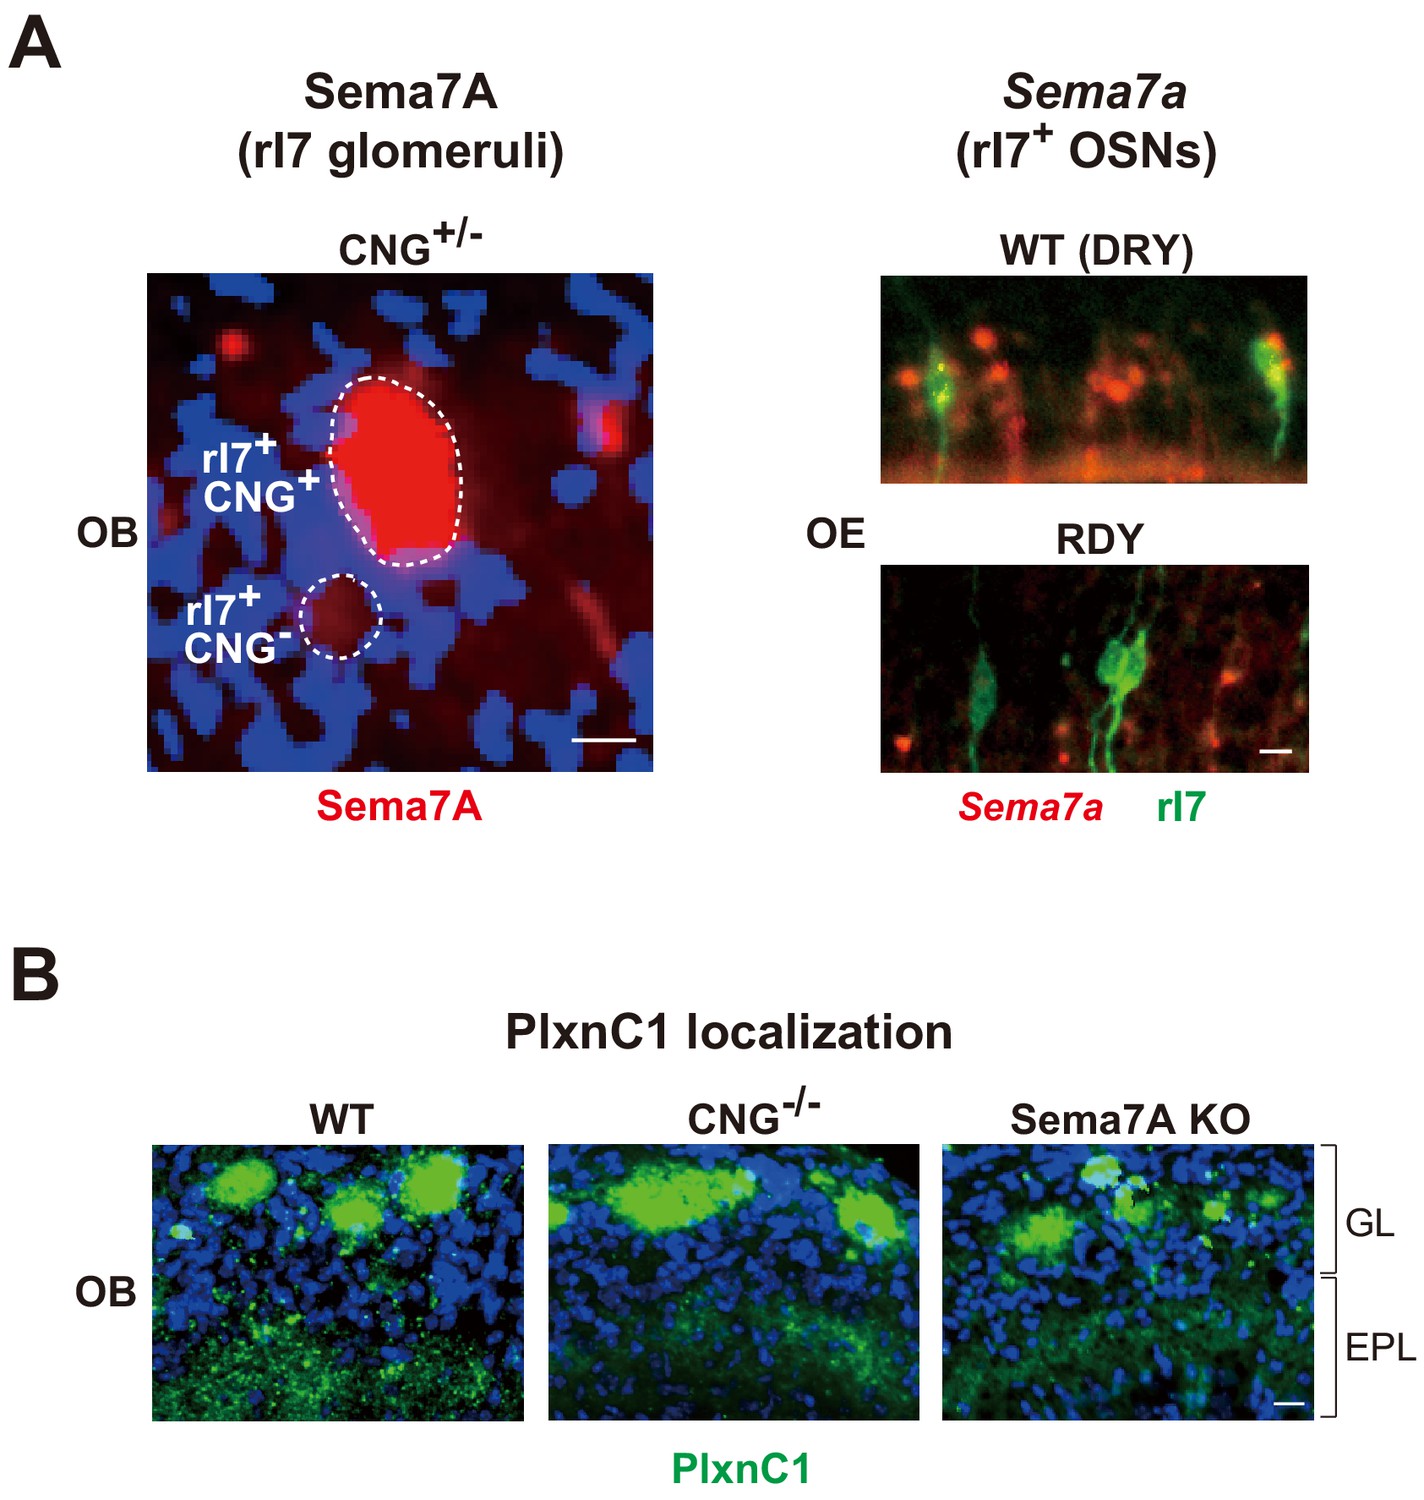
(A) Activity-dependent expression of Sema7A. Left: Analysis of the CNG-A2+/- mice. Duplicated glomeruli of rI7 were analyzed for Sema7A expression in the CNG-A2+/- female mice at P5. EYFP-tagged rI7 glomeruli were detected by immunostaining with anti-GFP antibodies. OB sections were immunostained with antibodies against CNG-A2 and Sema7A. Relative signal intensities of Sema7A (CNG+/CNG-) are compared between the CNG+ and CNG- glomeruli. **p<0.05 (Student’s t-test). Error bars indicate SD (n = 8 animals). Right: Effects of the DRY-motif mutation of OR on Sema7A expression. OE sections expressing the WT and DRY-motif mutant (RDY) of rI7 were analyzed by in situ hybridization for Sema7a transcripts at P5. The DRY-motif mutant suppresses Sema7a transcription because the mutant receptor does not produce cAMP that generates CNG-channel activity. OSNs expressing the EYFP-tagged rI7 were detected by immunostaining with anti-GFP antibodies. Relative signal intensities of Sema7a transcripts (WT/DRY) are compared between the WT and DRY-motif mutant of rI7. ***p<0.005 (Student’s t-test). Error bars indicate SD (n = 4 animals). See also Figure 4—figure supplement 1A. (B) Ranking of glomeruli for Sema7A expression. Individual glomeruli possess unique but different levels of Sema7A expression determined by intrinsic activity of ORs, forming the glomerular rank of Sema7A expression. OB sections were immunostained with anti-Sema7A antibodies. Intensities of Sema7A signals were determined for each glomerulus and plotted in order. Glomerular rank of fluorescent signals is shown for 437 different glomeruli in the OB at P8. Expression levels of Sema7A are indicated for the rI7 (yellow), MOR29A (green), VNL-stimulated (P5~7) MOR29A (red), and CNG- rI7 glomeruli (gray). See also Figure 3—figure supplement 1A and Figure 4—figure supplement 1A. (C) Expression of Plxnc1 in the OB. Both CNG+/+ and CNG-/- mice were analyzed. OB sections were analyzed at P4 by in situ hybridization using the Plxnc1 probe. Mitral cell layers (MCL) are circled by dotted lines. n = 6 animals. Scale bar, 20 μm. See also Figure 4—figure supplement 1B. (D) Localization of PlxnC1 in the M/T-cell dendrites. To detect PlxnC1, a receptor for Sema7A, OB sections were immunostained with PlxnC1 antibodies. Relative signal intensities (GL/EPL) are shown for different time points in the neonatal period. Note that PlxnC1 is found in the M/T-cell dendrites only during the first week after birth. n = 2 animals except for P4 (n = 6). GL, glomerular layer; EPL, external plexiform layer.
-
Figure 4—source data 1
Ranking of glomeruli for Sema7A expression.
Individual glomeruli possess unique but different levels of Sema7A expression determined by intrinsic activity of ORs, forming the glomerular rank of Sema7A expression. OB sections were immunostained with anti-Sema7A antibodies. Intensities of Sema7A signals were determined for each glomerulus and plotted in order. Glomerular rank of fluorescent signals is shown for 437 different glomeruli in the OB at P8. Expression levels of Sema7A are indicated for the rI7, MOR29A, VNL-stimulated (P5~7) MOR29A, and CNG- rI7 glomeruli.
- https://cdn.elifesciences.org/articles/65078/elife-65078-fig4-data1-v1.xlsx
Figure 4—figure supplement 1
Activity-dependent expression of Sema7A in OSNs and temporal localization of PlxnC1 in M/T-cell dendrites.
(A) Activity-dependent expression of Sema7A. Left; Sema7A expression within the CNG+/- rI7 glomeruli. OB sections were immunostained with anti-Sema7A antibodies. CNG+ and CNG- rI7 glomeruli are shown. Right; Sema7a expression in the DRY-motif mutant of rI7. OE sections expressing the WT rI7 and DRY-motif mutant (RDY) were analyzed for Sema7a expression at P5. OSNs expressing the EYFP-tagged rI7 were detected by immunostaining with anti-GFP antibodies. See also Figure 4A and B. Scale bars, 10 μm. (B) PlxnC1 in the M/T-cell dendrites. The WT, CNG-/-, and Sema7A KO mice were analyzed. OB sections were immunostained with anti-PlxnC1 antibodies. PlxnC1 localization in the GL is not affected by the CNG-/- or Sema7A KO. See also Figure 4C. Scale bar, 10 μm. GL, glomerular layer; EPL, external plexiform layer.
Figure 5 with 2 supplements
Sema7A is a key to synapse formation within glomeruli.
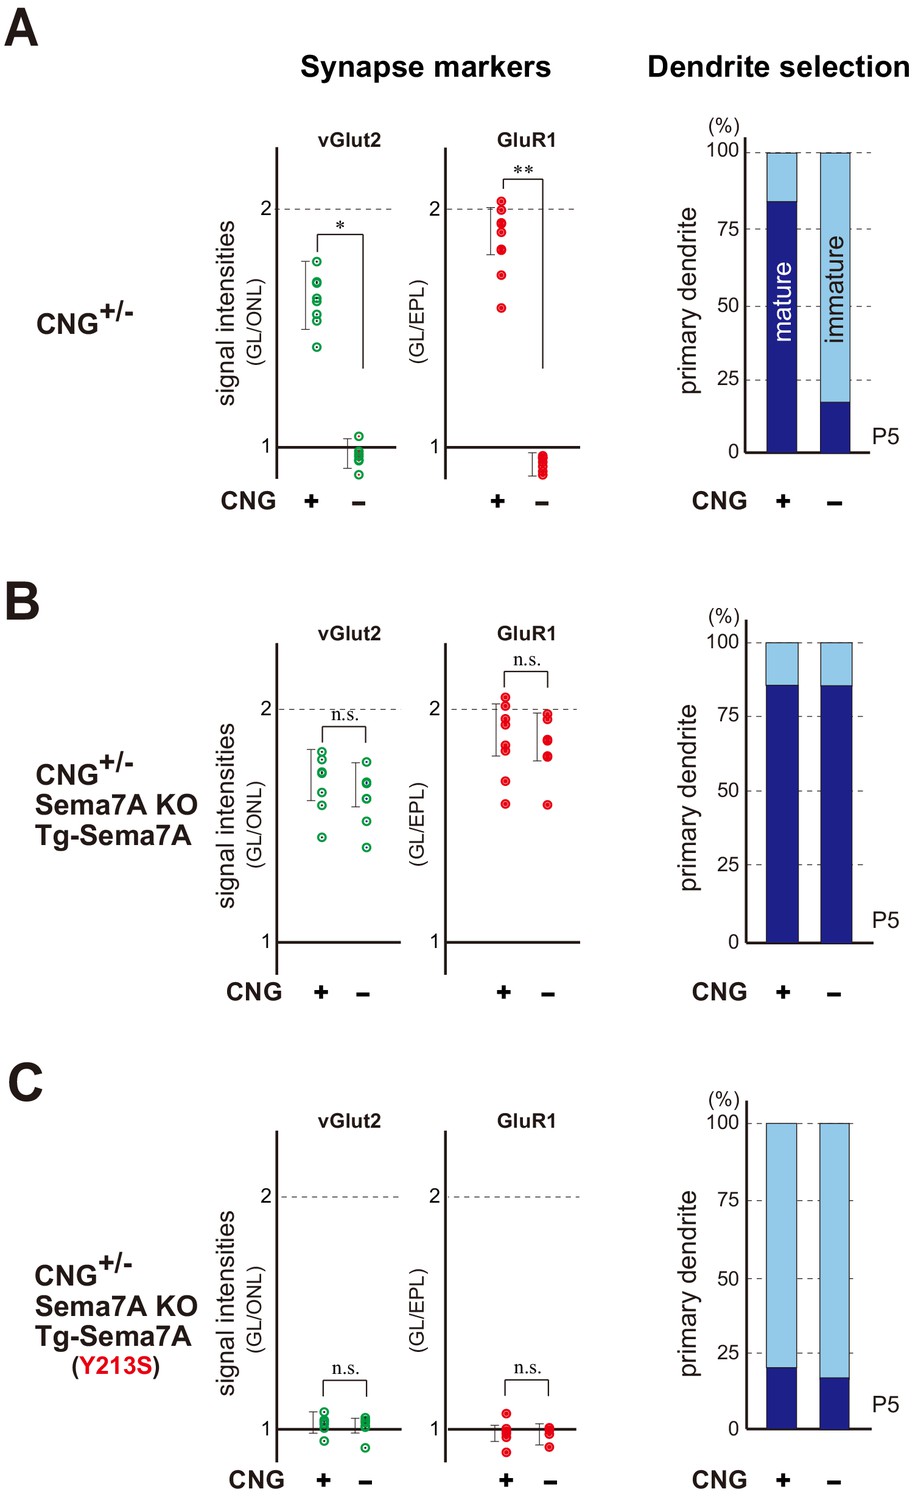
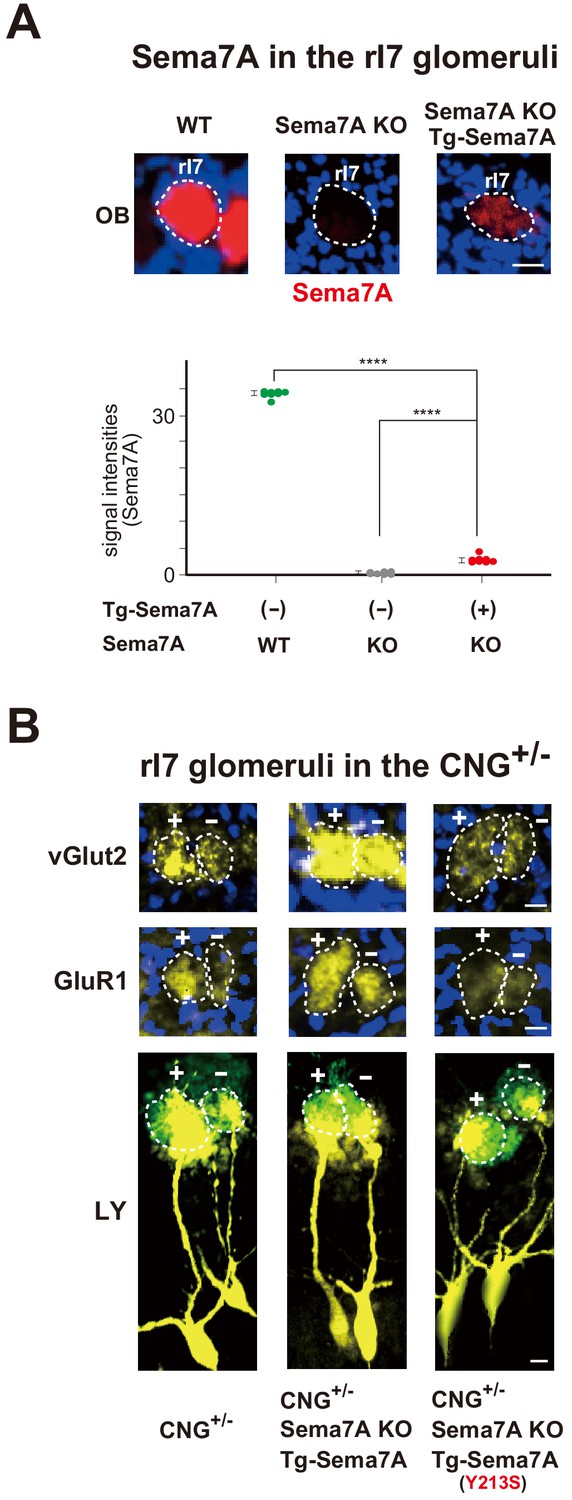
(A) Synapse markers in the hemizygous female KO of CNG-A2. Duplicated glomeruli (CNG+ and CNG-) of rI7 were analyzed at P5 (n = 8 pairs). Levels of both pre- and post-synapse markers (vGlut2 and GluR1) were reduced in the CNG- glomerulus compared with the CNG+ (left). Dendrite selection was delayed in the CNG- glomerulus (right). Dendrites were visualized by LY injection as shown in Figure 3—figure supplement 2. The ratios of M/T cells with one primary dendrite (mature) and those with multiple branched dendrites (immature) are compared in the rI7 glomeruli: CNG+, 14/17 (82.3 %); CNG-, 3/14 (21.4 %). See also Figure 5—figure supplement 1. (B) Rescue of synapse formation in the CNG-A2+/- mice. The Tg Sema7a gene was introduced into the hemizygous female mice of CNG-A2 with the Sema7A KO background. Activity-independent, constitutive expression of the Tg Sema7a was sufficient to rescue the defective phenotype of synapse formation (left) and dendrite selection (right) in the CNG-A2 KO glomeruli (n = 6 pairs). The ratios of mature and immature M/T cells are: Tg-Sema7A, CNG+, 15/18 (83.3 %); Tg-Sema7A, CNG-, 13/16 (81.3 %). (C) Rescue experiments with the interaction mutant of Sema7A in the CNG- A2+/- mice. The mutant Sema7A (Y213S) incapable of binding to PlxnC1 was used for the rescue experiment (n = 5 glomeruli). *p<0.05, **p<0.01 (Student’s t-test). n.s., not significant. The ratios of mature and immature M/T cells are: Tg-Sema7A (Y213S), CNG+, 3/13 (23.0 %); Tg-Sema7A (Y213S), CNG-, 2/9 (22.2 %). n = 8, 7 glomeruli. For the synapse markers, relative signal intensities were calculated for the glomerular layer (GL) in comparison to those in the olfactory nerve layer (ONL) or external plexiform layer (EPL). See also Figure 5—figure supplement 2.
-
Figure 5—source data 1
Dendrite selection within the rI7 glomeruli.
M/T cells at P5 were visualized by Lucifer yellow (LY) injection into the glomeruli (Figure 3—figure supplement 2). Intracellular LY injection was performed as previously described (Inoue et al., 2018). The numbers of M/T cells with one dendrite (mature) and those with multiple dendrites (immature) were counted in the MOR29A glomeruli. The ratios of M/T cells with one primary dendrite (mature) and those with multiple branched dendrites (immature) are compared in the rI7 glomeruli: CNG+, 14/17 (82.3 %); CNG-, 3/14 (21.4 %) in (A), Tg-Sema7A, CNG+, 15/18 (83.3 %); Tg-Sema7A, CNG-, 13/16 (81.3 %) in (B), and Tg-Sema7A (Y213S), CNG+, 3/13 (23.0 %); Tg-Sema7A (Y213S), CNG-, 2/9 (22.2 %) in (C).
- https://cdn.elifesciences.org/articles/65078/elife-65078-fig5-data1-v1.xlsx
Figure 5—figure supplement 1
Synapse formation in the CNG-A2-/- mice.
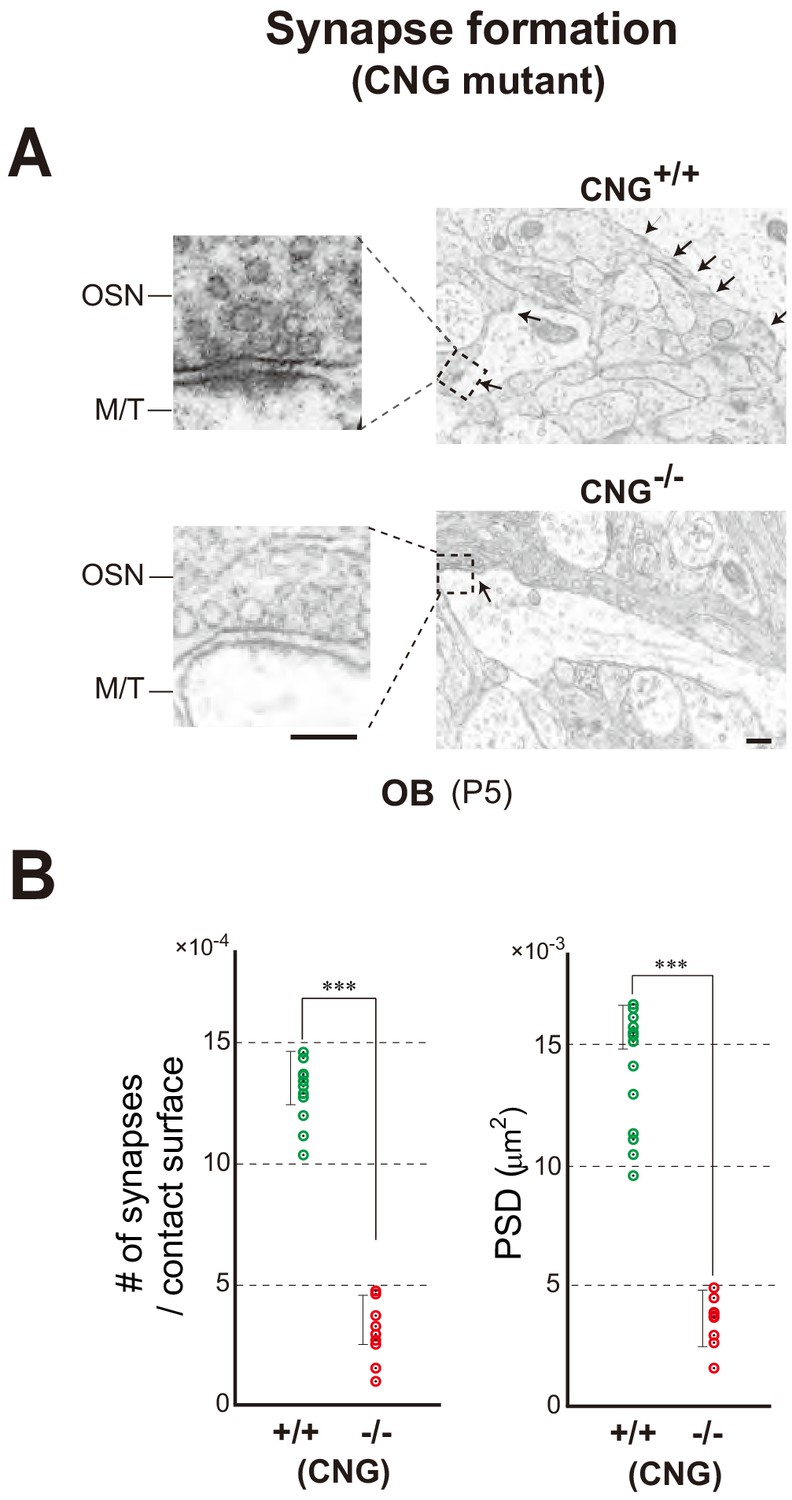
(A) Electron microscopy of OB sections. The CNG+/+ and CNG-/- (homozygous female) at P5 were analyzed for synapse formation (arrows). (B) The numbers of synaptic structures per contact surface. The areas of postsynaptic density (PSD) were quantified and compared between the CNG+/+ and CNG-/-. ***p<0.005 (Student’s t-test). Error bars indicate SD (n = 6 animals). See also Figure 5. Scale bars, 300 and 150 nm.
Figure 5—figure supplement 2
Activity-dependent synapse formation mediated by Sema7A signaling.
(A) Tg-Sema7A expression within the rI7 glomeruli. The rI7 glomeruli in the Sema7A KO with or without Tg-Sema7A were immunostained with anti-Sema7A antibodies using the WT rI7 glomeruli as positive controls. Signal intensities in the rI7 glomeruli are compared. Error bars are SD (n = 4 animals for each genotype). ****p<0.001 (Student’s t-test). See also Figure 5. Scale bar, 10 μm. (B) Synapse formation and dendrite maturation in the CNG-A2+/- mice. Duplicated rI7 glomeruli (CNG+ and CNG-) in the hemizygous female mice with or without Tg-Sema7A having the Sema7A KO background were analyzed at P5. The interaction mutant (Y213S) of Sema7A was also analyzed. The OB sections were immunostained for pre- and post-synapse markers, vGlut2 and GluR1, respectively. M/T cells were visualized by LY injection into an OB slice containing the rI7 glomerulus. See also Figure 5. Scale bars, 10 μm.
Figure 6
Blockage of Sema7A/PlxnC1 signaling affects social behaviors later in life.
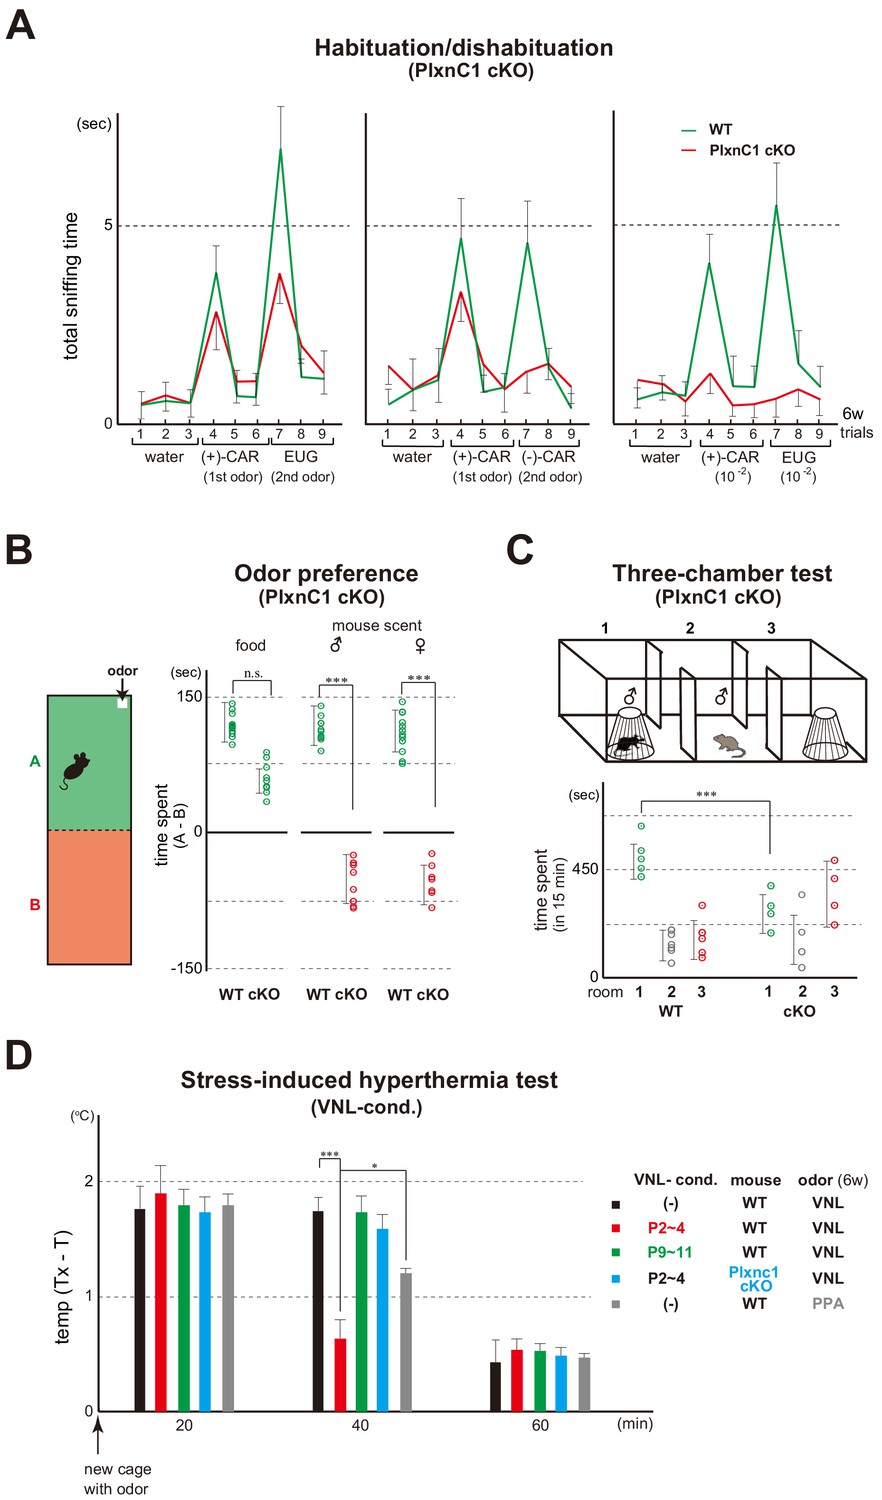
(A) Odor detection of the PlxnC1 cKO in the habituation/dishabituation test. Investigation times for odors were measured in the PlxnC1 cKO and WT male mice at 6w. Please see the legend to Figure 1B for the experimental procedure. Odorant pairs examined are as follows: left, 6.2 M (+)-CAR and 6.4 M EUG; middle, 6.2 M (+)-CAR and 6.3 M (–)-CAR; and right, 62 mM (+)-CAR and 64 mM EUG. Error bars are SD (n = 15, 6 animals, 6 litters). CAR, carvone; EUG, eugenol. (B) Social responses in the PlxnC1 cKO. Beds with the odor of unfamiliar mice were presented to the 6w-old WT male or to the PlxnC1 cKO where Sema7A signaling is blocked. The samples were presented in a plastic cup to avoid direct contacts with the mouse nose. Times (sec) spent in the room with or without a test odorant were measured during the 5-min test period. Differences of staying times in the two rooms (A - B) are shown. Mouse food (SLC Japan, Inc) and fresh beds without the mouse scents were used as positive and negative controls, respectively. Error bars are SD (n = 18, 7 animals, 7 litters). (C) Three-chamber test. The male WT and PlxnC1 cKO were analyzed at 6w. The mouse being tested was placed in the center chamber (2). An empty cage was placed to the right (3) and an unfamiliar male mouse in a plastic cage was to the left (1). Time duration (sec) spent in each room was measured during a 15-min test period. Error bars are SD (n = 5, 4 animals, 4 litters). (D) Stress-induced hyperthermia test in the VNL-conditioned PlxnC1 cKO. Pups of the WT (red and green) and PlxnC1 cKO (light blue) were exposed to VNL at P2~4 or P9~11 and analyzed at 6w. Immediately after the transfer to a new cage, a filter paper spotted with VNL was presented to the mice. The rectal temperature was measured every 20 min in each mouse during the test. Unconditioned mice without VNL exposure (–) were analyzed as negative controls (black). PPA was used as an attractive-odor control (gray). Temperature differences before (T) and after (Tx) the transfer are compared. Error bars are SD (n = 3, 4, 4, 3, 3 animals). *p<0.05; ***p<0.005 (Student’s t-test). VNL, vanillin; PPA, propionic acid.
-
Figure 6—source data 1
Odor detection of the PlxnC1 cKO in the habituation/dishabituation test.
Mice were habituated to the cage and then a filter paper spotted with 0.5 μl of distilled water was presented for 3 min. This was repeated three times with 1 min intervals (control trials 1–3). Next, a filter paper spotted with the 1st odor was presented three times (detection trials 4–6). Then, a filter paper spotted with the 2nd odor was presented three times (detection trials 7–9). Investigation times for odors were measured in the PlxnC1 cKO and WT male mice at 6w. Odorant pairs examined are as follows: left, 6.2 M (+)-CAR and 6.4 M EUG; middle, 6.2 M (+)-CAR and 6.3 M (–)-CAR; and right, 62 mM (+)-CAR and 64 mM EUG. CAR, carvone; EUG, eugenol. The average values of investigation times are shown.
- https://cdn.elifesciences.org/articles/65078/elife-65078-fig6-data1-v1.xlsx
-
Figure 6—source data 2
Stress-induced hyperthermia test in the VNL-conditioned PlxnC1 cKO.
Pups of the WT and PlxnC1 cKO were exposed to VNL at P2~4 or P9~11 and analyzed at 6 w. Immediately after the transfer to a new cage, a filter paper spotted with VNL was presented to the mice. The rectal temperature was measured every 20 min in each mouse during the test. Unconditioned mice without VNL exposure (–) were analyzed as negative controls. PPA was used as an attractive-odor control (gray). Temperature differences before (T) and after (Tx) the transfer are compared. Error bars are SD (n = 3, 4, 4, 3, 3 animals). *p<0.05; ***p<0.005 (Student’s t-test). VNL, vanillin; PPA, propionic acid.
- https://cdn.elifesciences.org/articles/65078/elife-65078-fig6-data2-v1.xlsx
Figure 7 with 1 supplement
Odor imprinting in the oxytocin (Oxt) KO.
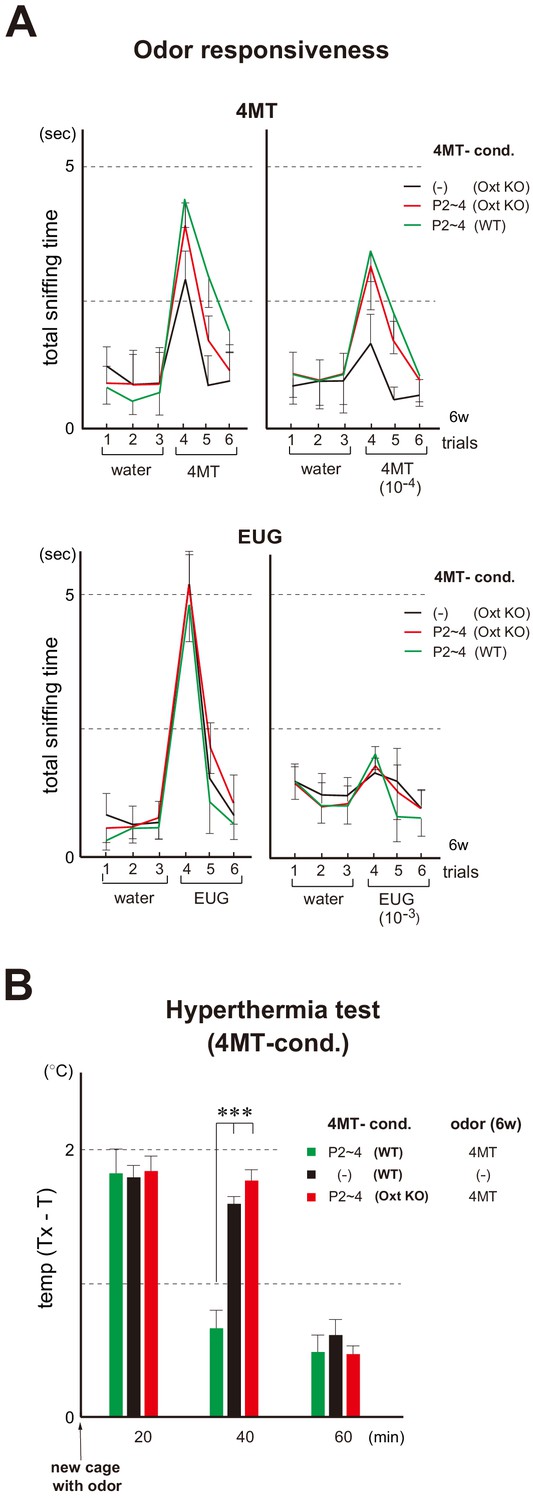
(A) Odor responsiveness in the Oxt KO. Sniffing times (sec) were measured in the habituation/dishabituation test. The WT and Oxt KO were conditioned to 4MT at P2~4. Mice without conditioning (–) were analyzed as negative controls (n = 4 animals). Odorants used were as follows: 100 mM and 10 μM for 4MT (left); 6.4 M and 6.4 mM for EUG (right). Error bars are SD (n = 4, 5 animals). See also Figure 1B for the procedure. (B) Stress-induced hyperthermia test in the 4MT-conditioned Oxt KO. Pups of the WT (green) and Oxt KO (red) were exposed to 4MT at P2~4 and analyzed at 6w. Immediately after the transfer to a new cage, a filter paper spotted with 4MT was presented to the mice. The rectal temperature was measured every 20 min in each mouse during the test. Unconditioned mice without 4MT exposure (–) were analyzed as negative controls (black). Temperature differences before (T) and after (Tx) the transfer are compared. Error bars are SD (n = 4, 3, 4 animals). ***p<0.005 (Student’s t-test). 4MT, 4-methyl-thiazole; EUG, eugenol.
-
Figure 7—source data 1
Odor responsiveness in the Oxt KO.
Sniffing times (s) were measured in the habituation/dishabituation test. The WT and Oxt KO were conditioned to 4MT at P2~4. Mice without conditioning (–) were analyzed as negative controls (n = 4 animals). Odorants used were as follows: 100 mM and 10 μM for 4MT (top); 6.4 M and 6.4 mM for EUG (bottom). The average values of total sniffing times are shown.
- https://cdn.elifesciences.org/articles/65078/elife-65078-fig7-data1-v1.xlsx
-
Figure 7—source data 2
Stress-induced hyperthermia test in the 4MT-conditioned Oxt KO.
Pups of the WT and Oxt KO were exposed to 4MT at P2~4 and analyzed at 6w. Immediately after the transfer to a new cage, a filter paper spotted with 4MT was presented to the mice. The rectal temperature was measured every 20 min in each mouse during the test. Unconditioned mice without 4MT exposure (–) were analyzed as negative controls. Temperature differences before (T) and after (Tx) the transfer are compared. 4MT, 4-methyl-thiazole; EUG, eugenol.
- https://cdn.elifesciences.org/articles/65078/elife-65078-fig7-data2-v1.xlsx
Figure 7—figure supplement 1
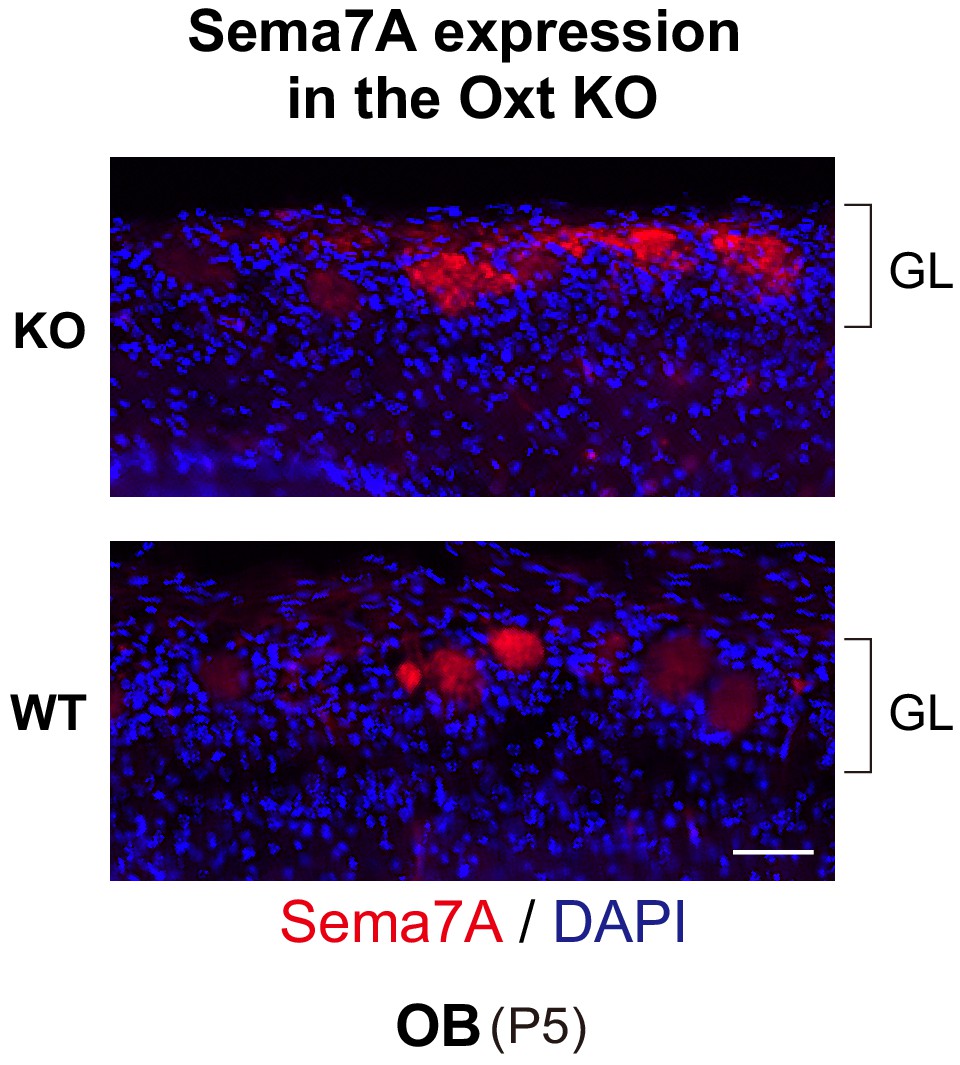
Expression of Sema7A in the Oxt KO.
OB sections (20 μm-thick) of the WT and Oxt KO were immunostained with anti-Sema7A antibodies (red) and counterstained with DAPI (blue). Mice were analyzed at postnatal day 5 (P5). Scale bar, 50 μm. GL, glomerular layer; OB, olfactory bulb.
Figure 8
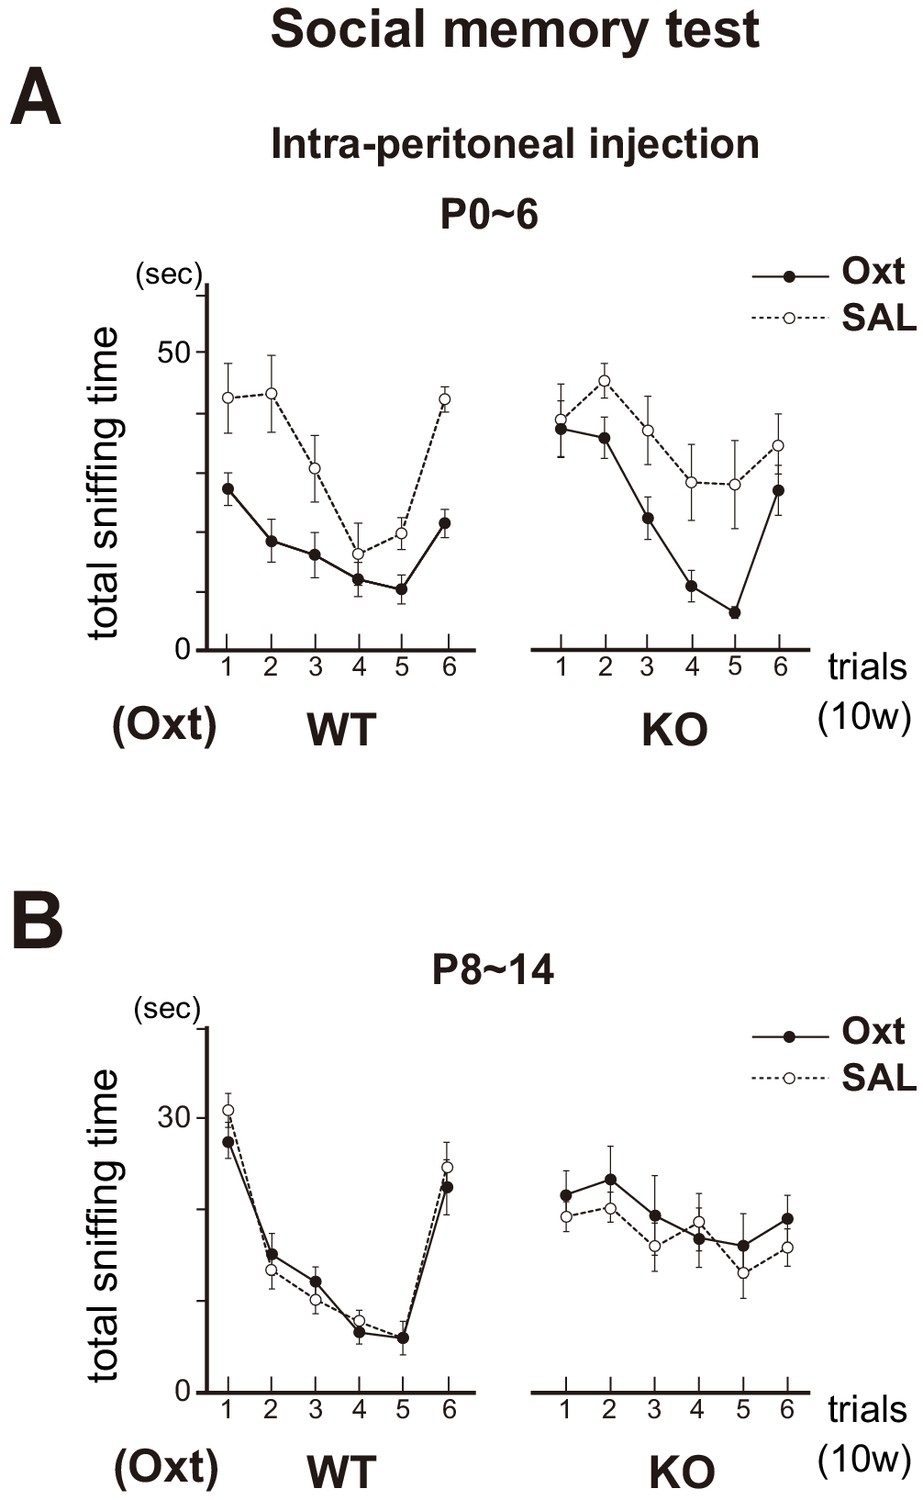
Social memory in the Oxt KO.
The KO mice were administrated with oxytocin (Oxt) or saline (SAL) by intraperitoneal injection at P0~6 (A) or P8~14 (B). In the Oxt KO treated with SAL, time duration of sniffing did not change for the subsequent presentations of the same unfamiliar female mouse (trials 1–5). In contrast, in the KO treated with Oxt, sniffing time progressively decreased for the subsequent presentations of the same female (trials 1–5), but increased for the newly introduced female (trial 6), as found in the WT control. Data are shown as mean ± standard error. The male mice used were (P0~6, 8~14): WT-SAL (n = 6, 7), WT-Oxt (n = 8, 8), KO-SAL (n = 6, 9), and KO-Oxt group (n = 6, 9).
-
Figure 8—source data 1
Social memory in the Oxt KO.
The KO mice were administrated with oxytocin (Oxt) or saline (SAL) by intraperitoneal injection at P0~6 (A) or P8~14 (B). Time duration of sniffing are shown after the presentations of the same unfamiliar female mouse (trials 1–6). Data also show mean ± standard error.
- https://cdn.elifesciences.org/articles/65078/elife-65078-fig8-data1-v1.xlsx
Tables
Key resources table
| Reagent type (species) or resource | Designation | Source or reference | Identifiers | Additional information |
|---|---|---|---|---|
| Genetic reagent (M. musculus) | Cnga2 KO | Jackson Laboratory | Stock #: 002905 RRID:MGI:3717661 | PMID:15071119 |
| Genetic reagent (M. musculus) | Sema7a KO | Jackson Laboratory | Stock #: 005128 RRID:MGI:2683896 | PMID:12879062 |
| Genetic reagent (M. musculus) | Oxytocin KO | PMID:8876199 | RRID:MGI:3603795 | Dr. Katsuhiko Nishimori (Tohoku University) |
| Genetic reagent (M. musculus) | BAC Olfr1510/1511 Tg | PMID:21105914 | Dr. Hitoshi Sakano (University of Fukui) | |
| Genetic reagent (M. musculus) | pOlfr16- Lofr226 | PMID:16990513 | RIKEN BRC (RBRC02931) | |
| Genetic reagent (M. musculus) | pOlfr16- Lofr226 (RDY) | PMID:16990513 | RIKEN BRC (RBRC02933) | |
| Genetic reagent (M. musculus) | Plxnc1flox/flox | PMID:29743476 | RIKEN BDR (Acc. #: CDB0908K) | |
| Genetic reagent (M. musculus) | pOlfr16- Lofr226-Sema7a | This paper | Dr. Hitoshi Sakano (University of Fukui) | |
| Genetic reagent (M. musculus) | pOlfr16- Lofr226-Sema7a (Y213S) | This paper | Dr. Hitoshi Sakano (University of Fukui) | |
| Genetic reagent (M. musculus) | Tg(Pcdh21-cre)BYoko | PMID:16106355 | RRID:MGI:4940883 | RIKEN BRC (RBRC02189) |
| antibody | anti-Sema7A | R and D Systems | Cat. #: AF-1835 | IF(1:3000) |
| antibody | anti-PlxnC1 | Abcam | discontinued | IF(1:3000) |
| antibody | anti-CNG-A2 | Alomone Labs | Cat. #:APC-045 | IF(1:200) |
| antibody | anti-vGlut2 | Millipore | Cat. #: AB2251-l | IF(1:1000) |
| antibody | anti-GluR1 | Abcam | Cat. #: ab51092 | IF(1:1000) |
| antibody | anti-GFP | Thermo Fisher Scientific | Cat. #: A-10260 | IF(1:1000) |
| antibody | anti-Lucifer yellow | Thermo Fisher Scientific | Cat. #: A-5750 | IF(1:2000) |
| antibody | anti-EGR1 | Abcam | Cat. #: ab6054 | IF(1:1000) |
Additional files
Download links
A two-part list of links to download the article, or parts of the article, in various formats.
Downloads (link to download the article as PDF)
Open citations (links to open the citations from this article in various online reference manager services)
Cite this article (links to download the citations from this article in formats compatible with various reference manager tools)
The olfactory critical period is determined by activity-dependent Sema7A/PlxnC1 signaling within glomeruli
eLife 10:e65078.
https://doi.org/10.7554/eLife.65078


