Quantitative mapping of human hair greying and reversal in relation to life stress
- Department of Psychiatry, Division of Behavioral Medicine, Columbia University Irving Medical Center, United States
- Department of Biostatistics, Mailman School of Public Health, Columbia University Irving Medical Center, United States
- Department of Psychiatry, Division of Molecular Therapeutics, Columbia University Irving Medical Center, United States
- New York State Psychiatric Institute, United States
- Proteomics and Macromolecular Crystallography Shared Resource, Columbia University Irving Medical Center, United States
- UCD Charles Institute of Dermatology & UCD Conway Institute, School of Medicine, University College Dublin, Ireland
- Dr. Phillip Frost Department of Dermatology & Cutaneous Surgery, University of Miami Miller School of Medicine, United States
- Centre for Dermatology Research, University of Manchester, United Kingdom
- Monasterium Laboratory, Germany
- Department of Neurology, H. Houston Merritt Center, Columbia Translational Neuroscience Initiative, Columbia University Irving Medical Center, United States
Figures
Figure 1 with 5 supplements
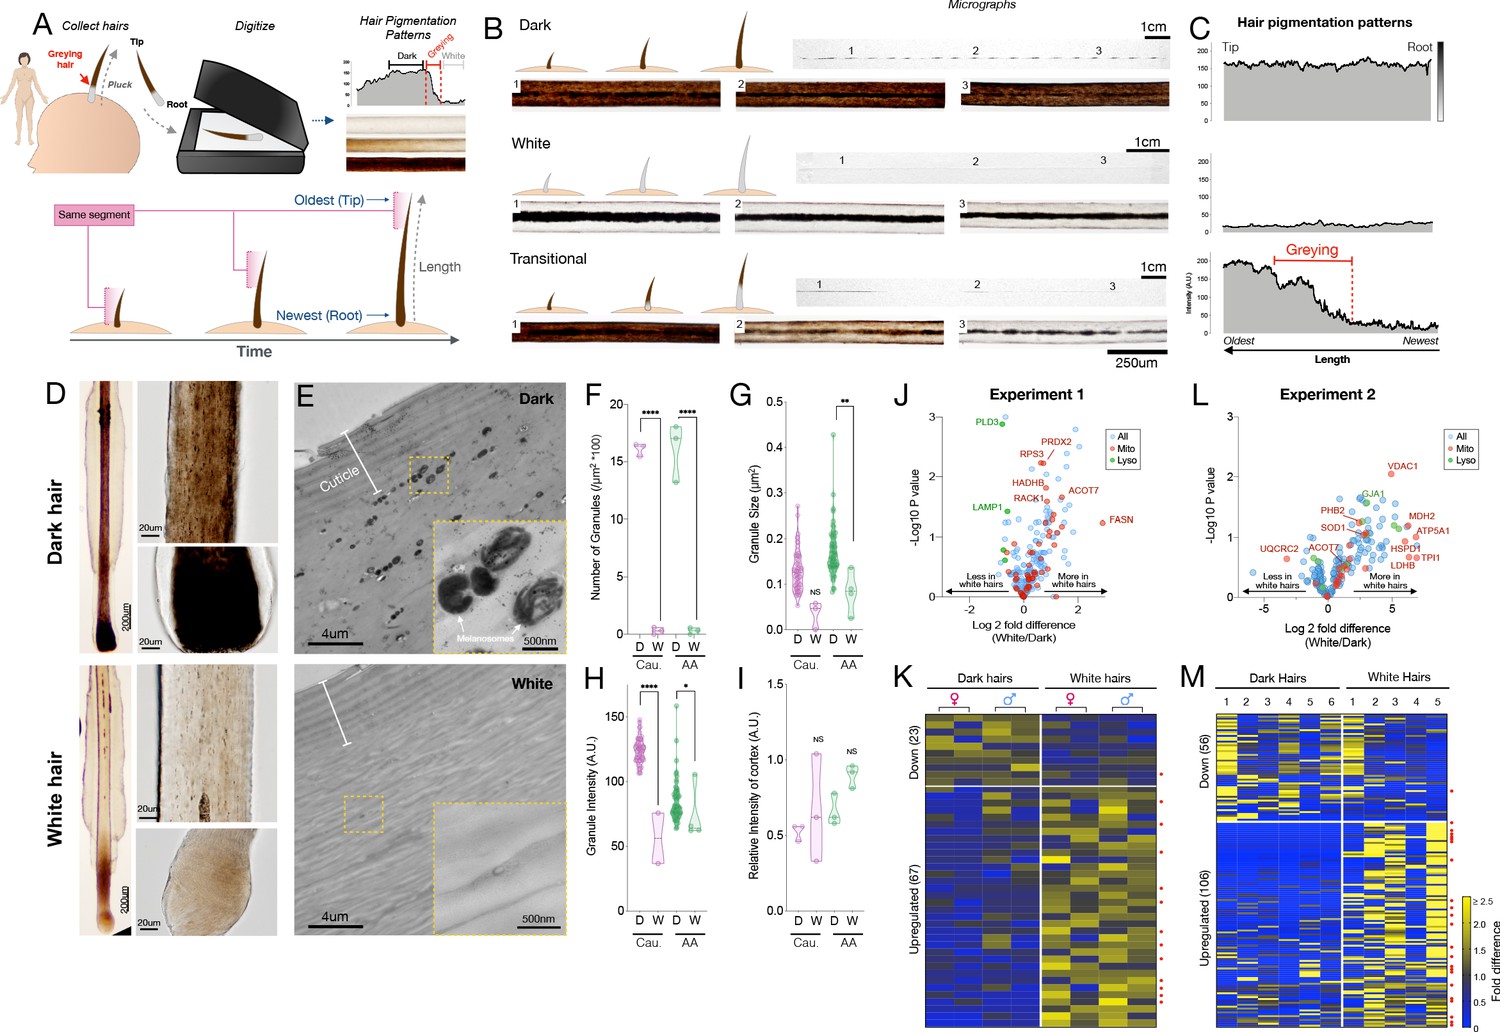
Quantitative analysis of human hair pigmentation patterns, greying, and associated proteomic changes.
(A) Diagram illustrating hair growth over time, method of hair collection, digitization, and hair pigmentation pattern (HPP) methodology. (B) Dark, white, and hairs undergoing natural age-related transitions from the younger dark state to the older white state at macroscopic and microscopic resolution. (C) Digitized HPPs for the hairs shown in (B). (D) Bright field microscopy images of hair follicles from plucked dark (top-panel) and white hair (bottom-panel) from the same Caucasian male individual illustrating the loss of pigmentation in the hair follicle pigmentary unit (HFPU). (E) Electron microscopic images of dark (top) and white (bottom) scalp hairs from a Caucasian male showing absent melanin granules in white hairs. (F) Quantification from dark (D) and white (W) hairs (n = 3 segments from each) from a Caucasian (Cau.) male and African-American (AA) male of melanin granule abundance, (G) size and (H) darkness. (I) Overall electron density of the hair matrix (excluding granules) (N.S.). (J) Volcano plot comparing dark and white hair proteomes and (K) heatmap of down- (<0.8 fold) and up-regulated (>1.5 fold) proteins that were detected in all samples (n = 90) for experiment 1 (duplicates of dark/white hairs from one female, one male, n = 8 samples). (L) Volcano plot and (M) heatmap for all proteins detected in >3 samples (n = 192) from experiment 2 (dark and white hairs from six individuals, n = 6 dark and 5 white hairs). Proteins annotated as mitochondrial (Mitocarta2.0) and lysosomal (The Human Lysosome Gene Database) are highlighted. Red dots to the right of heatmaps indicate mitochondrial proteins. *p<0.05, **p<0.01, ****p<0.0001 from one-way ANOVA, Tukey’s multiple comparisons.
-
Figure 1—source data 1
Source data for Figure 1.
- https://cdn.elifesciences.org/articles/67437/elife-67437-fig1-data1-v1.xlsx
Figure 1—figure supplement 1
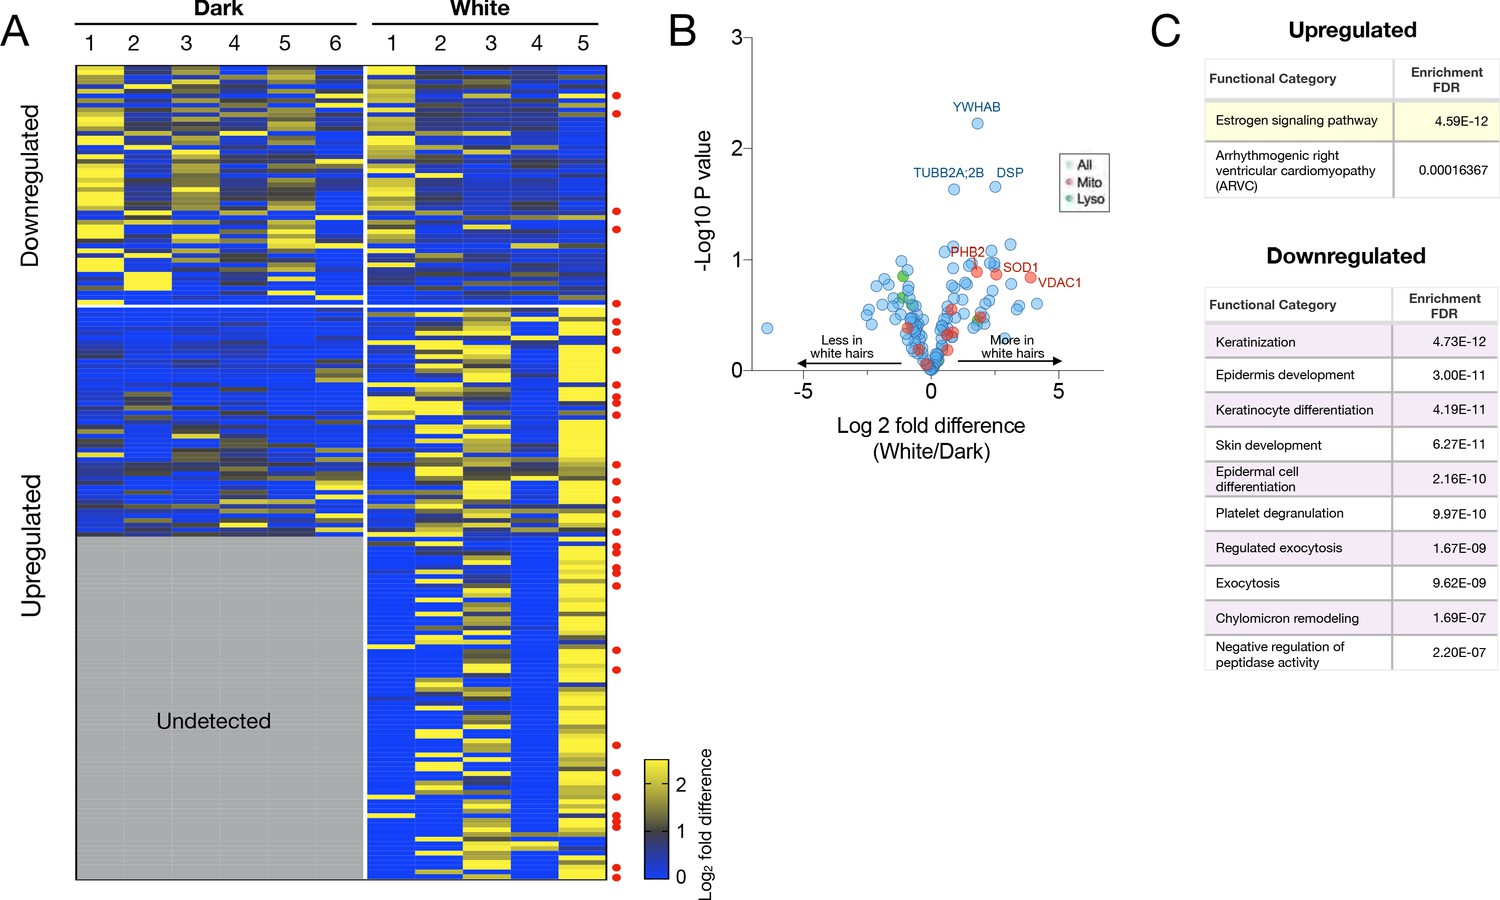
Sensitivity analysis of results from LC-MS:MS hair shaft proteomics experiment 2.
In this analysis, only proteins detected in at least 2/6 dark and 2/5 white hairs were selected. (A) Heatmap of down- and upregulated proteins across all dark and white hairs. Red dots to the left of heatmap indicate mitochondrial proteins, and (B) volcano plot of the hair proteome comparing white and dark hairs. (C) KEGG pathways functional enrichment analyses for upregulated and downregulated proteins.
-
Figure 1—figure supplement 1—source data 2
Source data for Figure 1—figure supplement 1.
- https://cdn.elifesciences.org/articles/67437/elife-67437-fig1-figsupp1-data2-v1.xlsx
Figure 1—figure supplement 2
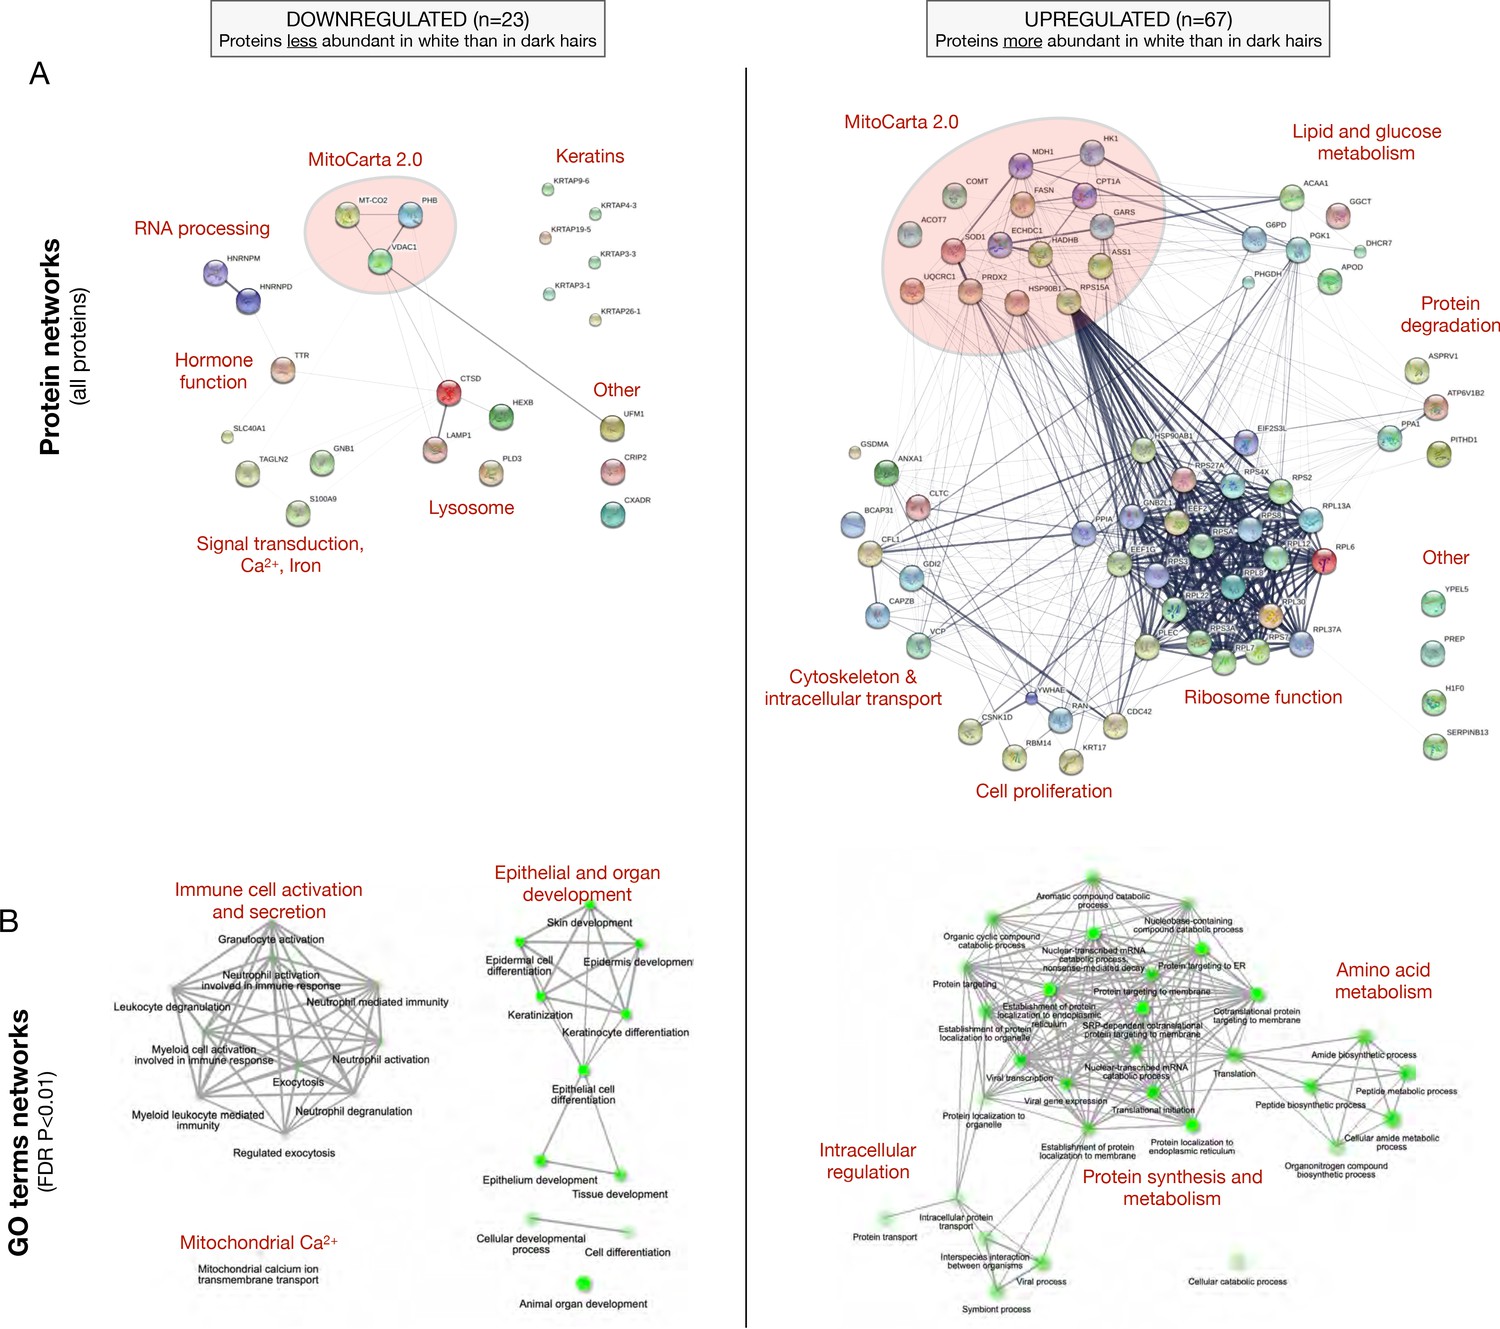
Functional enrichment analysis of up- and down-regulated proteins in white hair shafts relative to dark from experiment 1.
(A) Protein-protein interaction (PPI) networks from the STRING database for all upregulated (n = 67) and down regulated (n = 23) proteins. Nodes are proteins, edges reflect evidence of PPI where the thickness reflects the strength of evidence for protein-protein interaction (PPI). (B) Top gene ontology (GO) terms for the proteins shown in (A), illustrating various cellular processes overrepresented in each gene set. Nodes are GO categories, edges reflect similarity between GO categories (overlap in the genes that compose them). The size and intensity of nodes reflect the significance in the enrichment score, respectively.
Figure 1—figure supplement 3
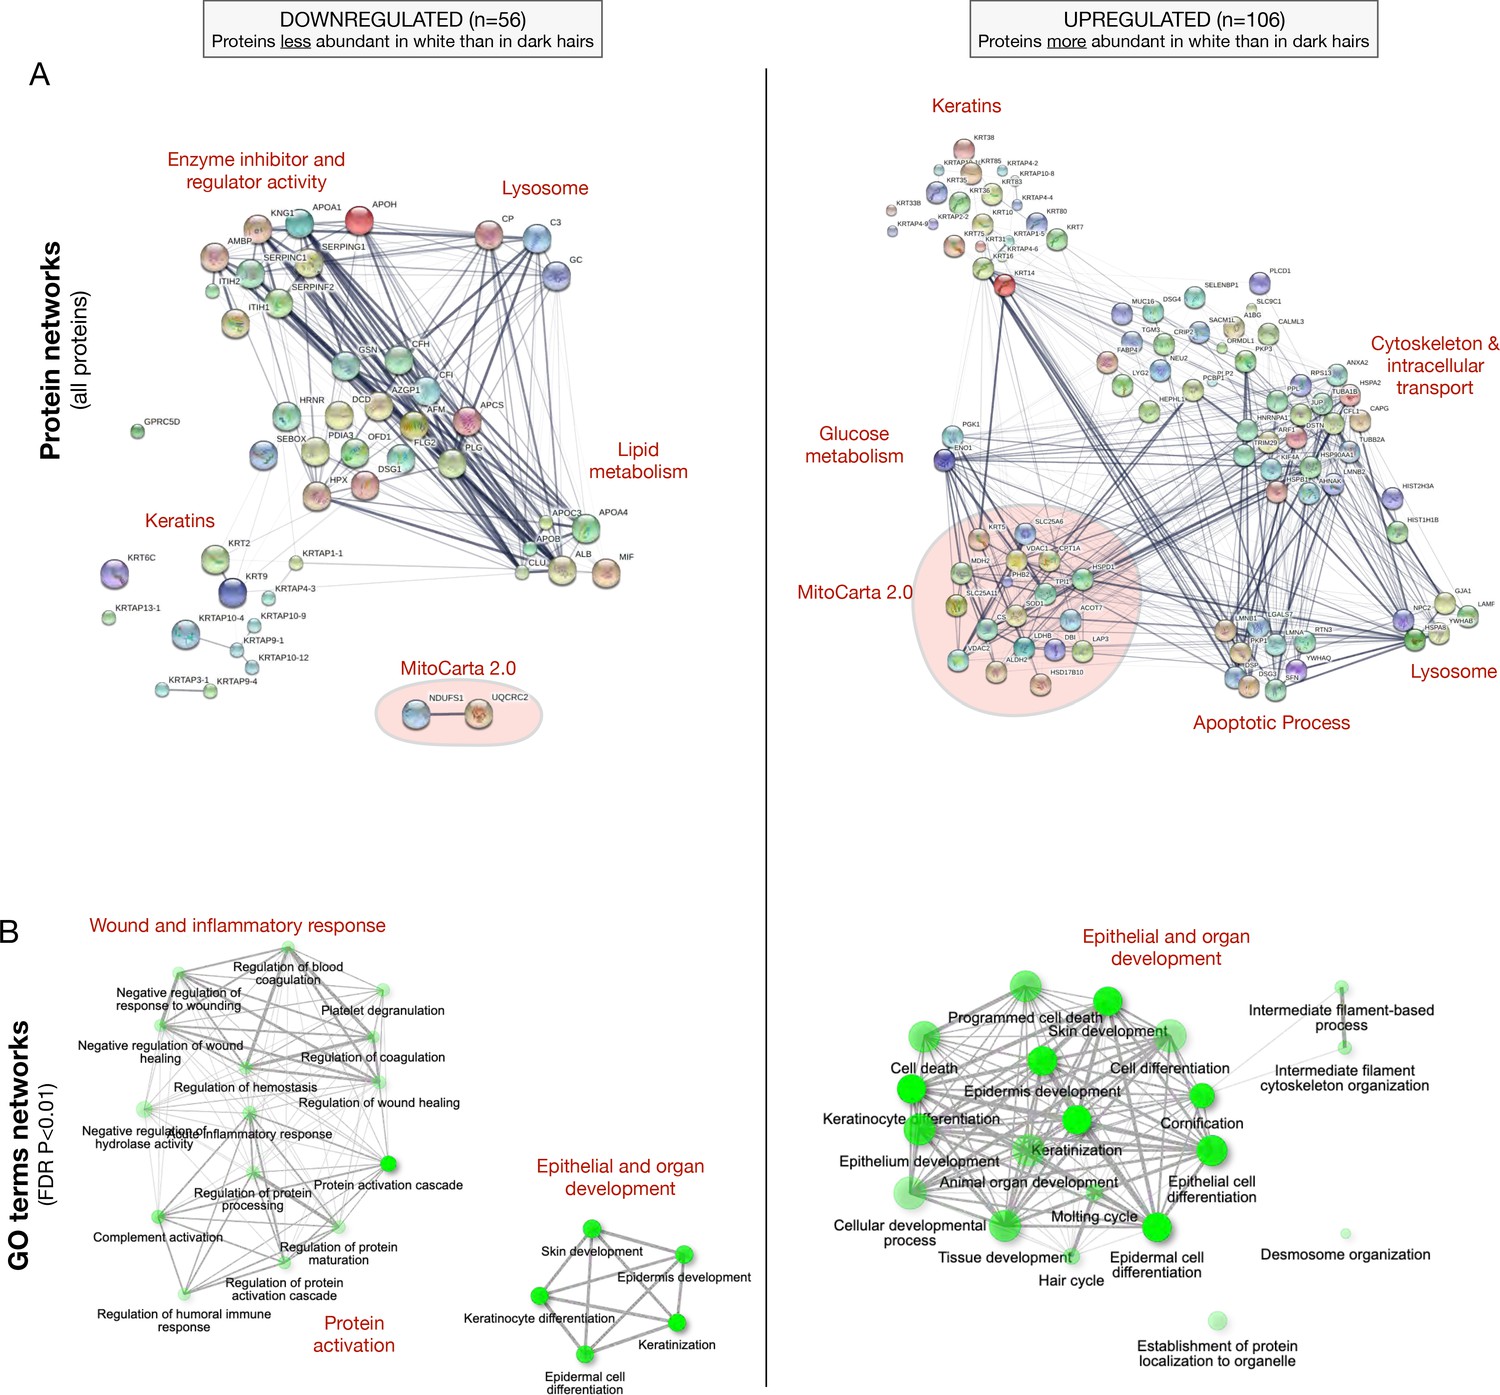
Functional enrichment analysis of up- and down-regulated proteins in white hair shafts relative to dark in experiment 2.
(A) PPI networks from the STRING database for all upregulated (n = 106) and down regulated (n = 56) proteins. Nodes are proteins, edges reflect evidence of PPI with the thickness reflecting to the strength of evidence. (B) Top gene ontology (GO) terms for the proteins shown in (A), illustrating various cellular processes overrepresented in each gene set. Nodes are GO categories, edges reflect similarity between GO categories based on overlap in genes, and size and intensity of nodes reflect the significance in the enrichment scores, respectively.
Figure 1—figure supplement 4
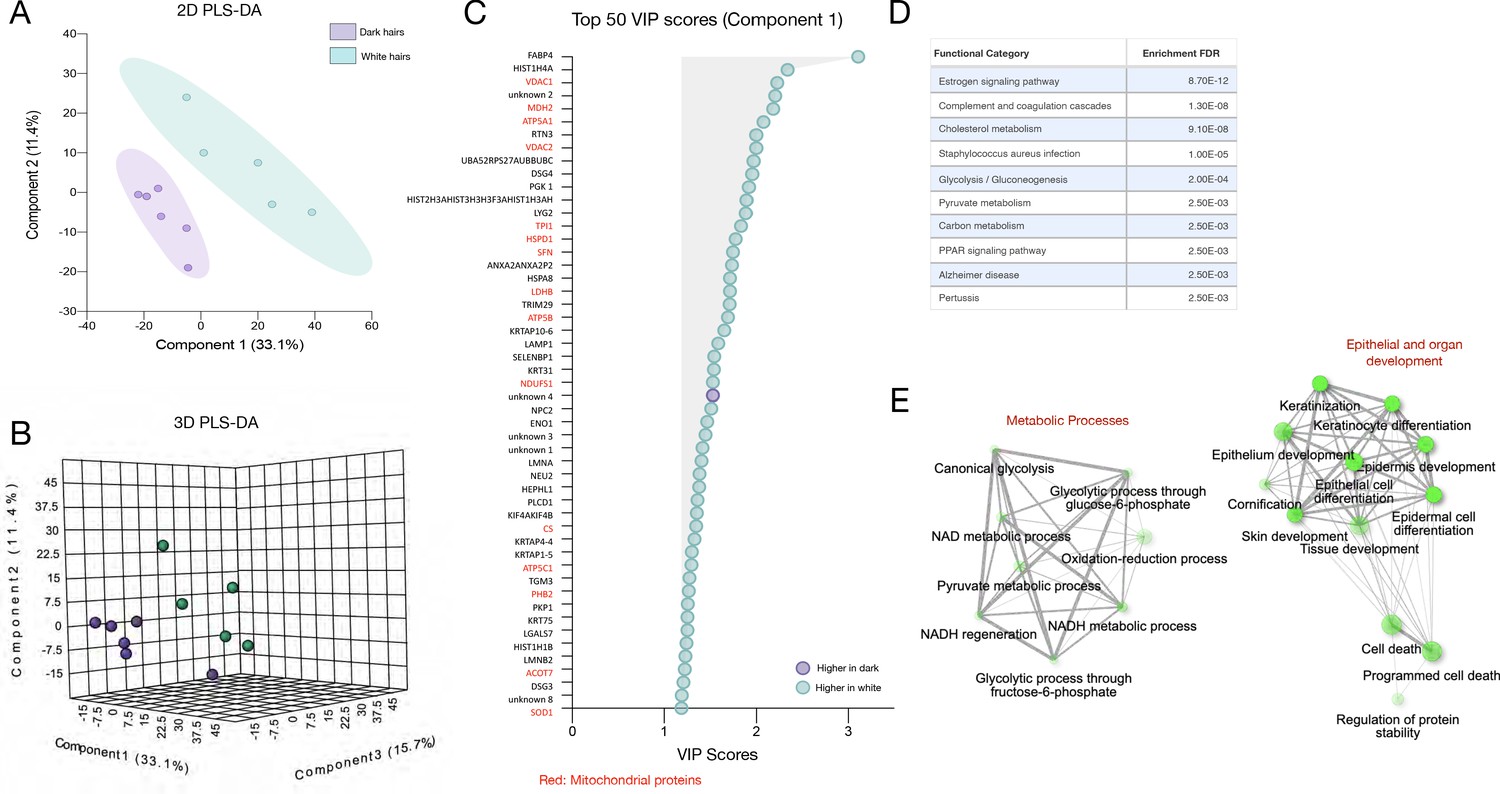
Partial least square discriminant analysis (PLS-DA) of dark and white hairs from experiment 2.
(A) 2D and (B) 3D score plot of dark and white HS generated from protein abundance (n = 192) quantified by LC-MS/MS. (C) The top 50 protein that maximally contribute to group separation ranked by their variable importance in projection (VIP) scores on the model’s first component, colored by up or down-regulation status in white HS relative to dark. Note that 49 of 50 proteins (98%) are upregulated (more abundant) in white hairs relative to dark. (D) KEGG functional annotation categories with enrichment p values. (E) GO term networks indicating coherent groups of categories related to metabolic processes involving NAD/NADH metabolic processes and substrate oxidation, as well as epithelial and organ development categories, including cell death. Nodes are GO categories, edges reflect similarity between GO categories based on overlap in genes, and size and intensity of nodes reflect the significance in the enrichment scores, respectively.
-
Figure 1—figure supplement 4—source data 1
Source data for Figure 1—figure supplement 4.
- https://cdn.elifesciences.org/articles/67437/elife-67437-fig1-figsupp4-data1-v1.xlsx
Figure 1—figure supplement 5
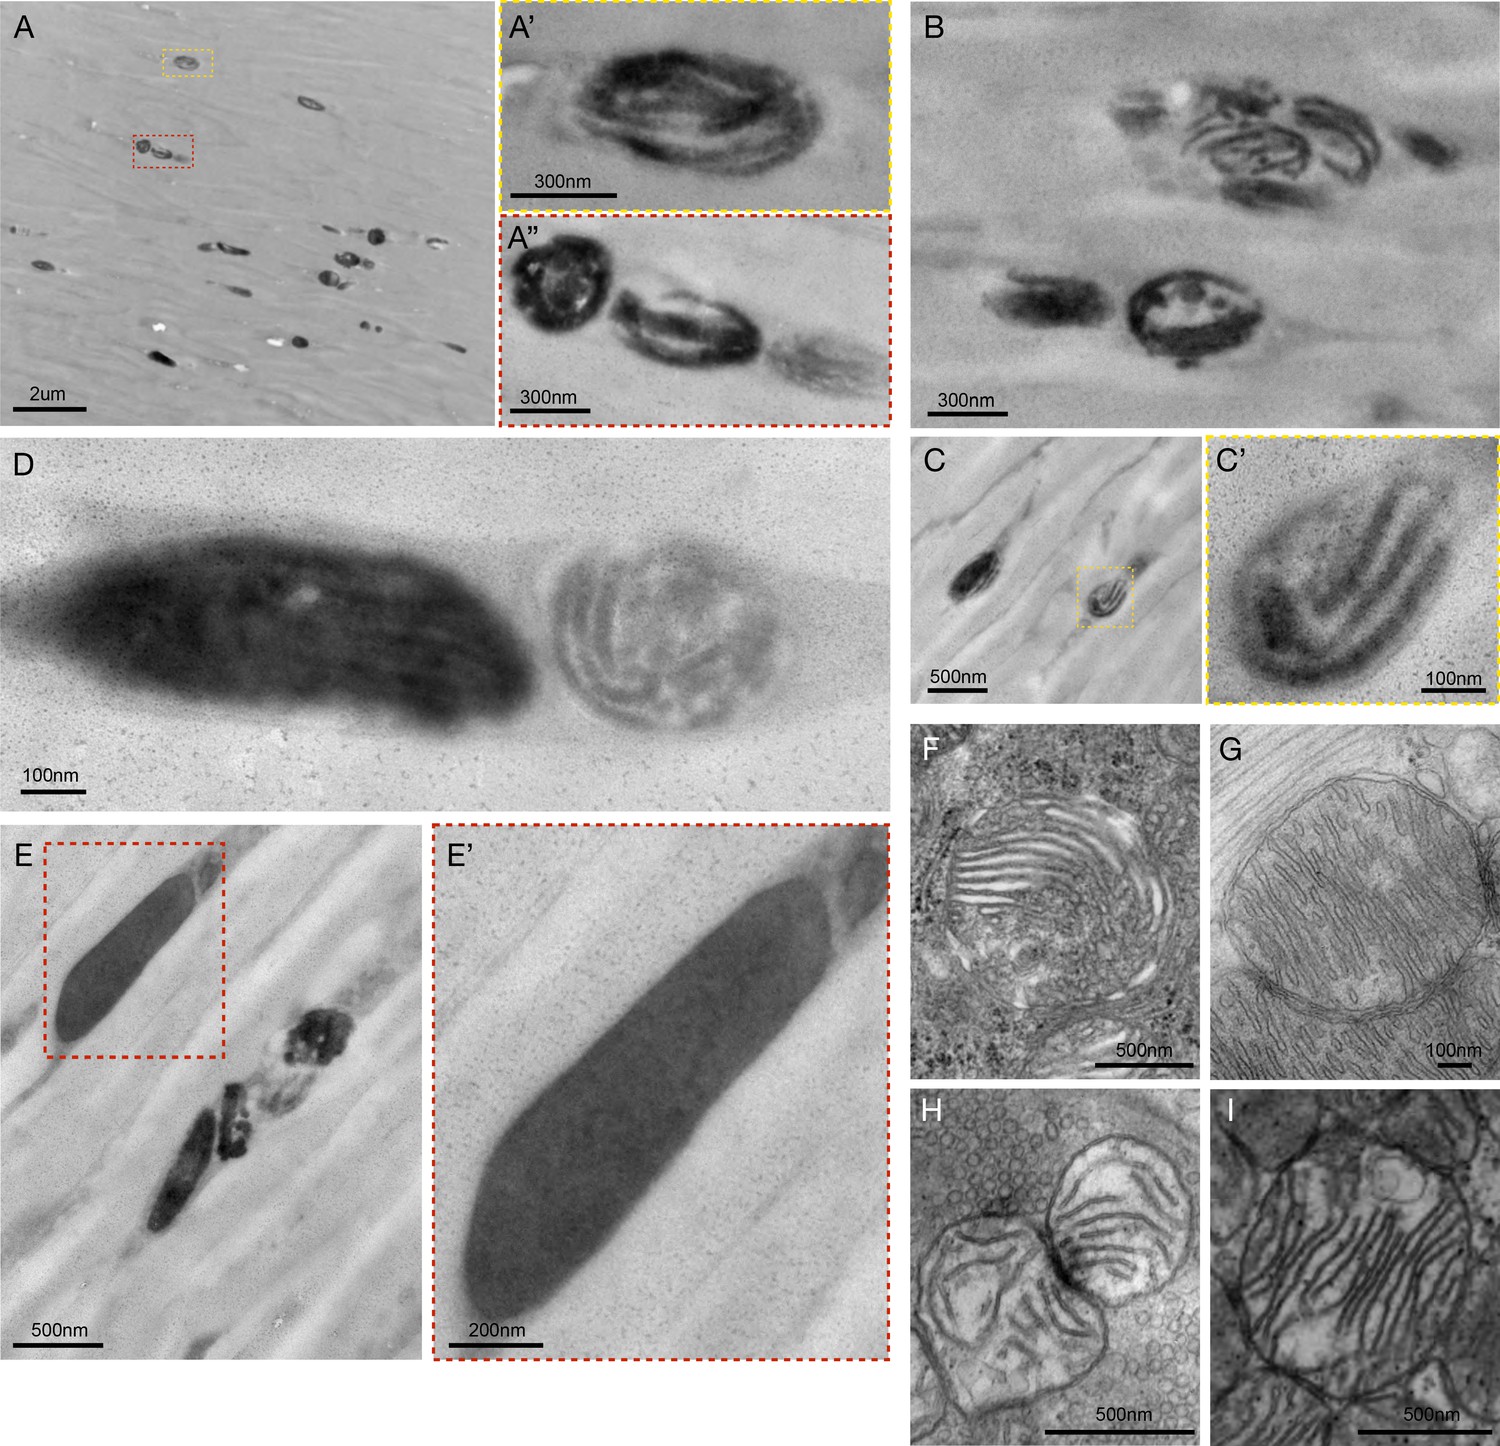
Ultrastructure of melanosomes and dense granules in human hair shafts.
(A–D) Electron micrographs of a dark hair from a 33-year-old Caucasian male with brown hairs. A variety of lamellar melanin granule (melanosomes) are shown. (E) Dense amorphous and uniform melanin granules coexist with lamellar melanosomes in the same hair. (F–I) Representative images of mitochondria from various tissues showing cristae structure not unlike what is typically ascribed as lamellar melanosomes in the hair. Mitochondria from the mouse adrenal gland (F), heart (G), presynaptic bouton of the neuromuscular junction (H), and skeletal muscle (I) are shown for illustrative purposes. On the basis of available evidence, it cannot be ruled out that some of the pigmented lamellar structures in the HS are remnants of mitochondria and mito-lysosomal hybrids.
Figure 2 with 1 supplement
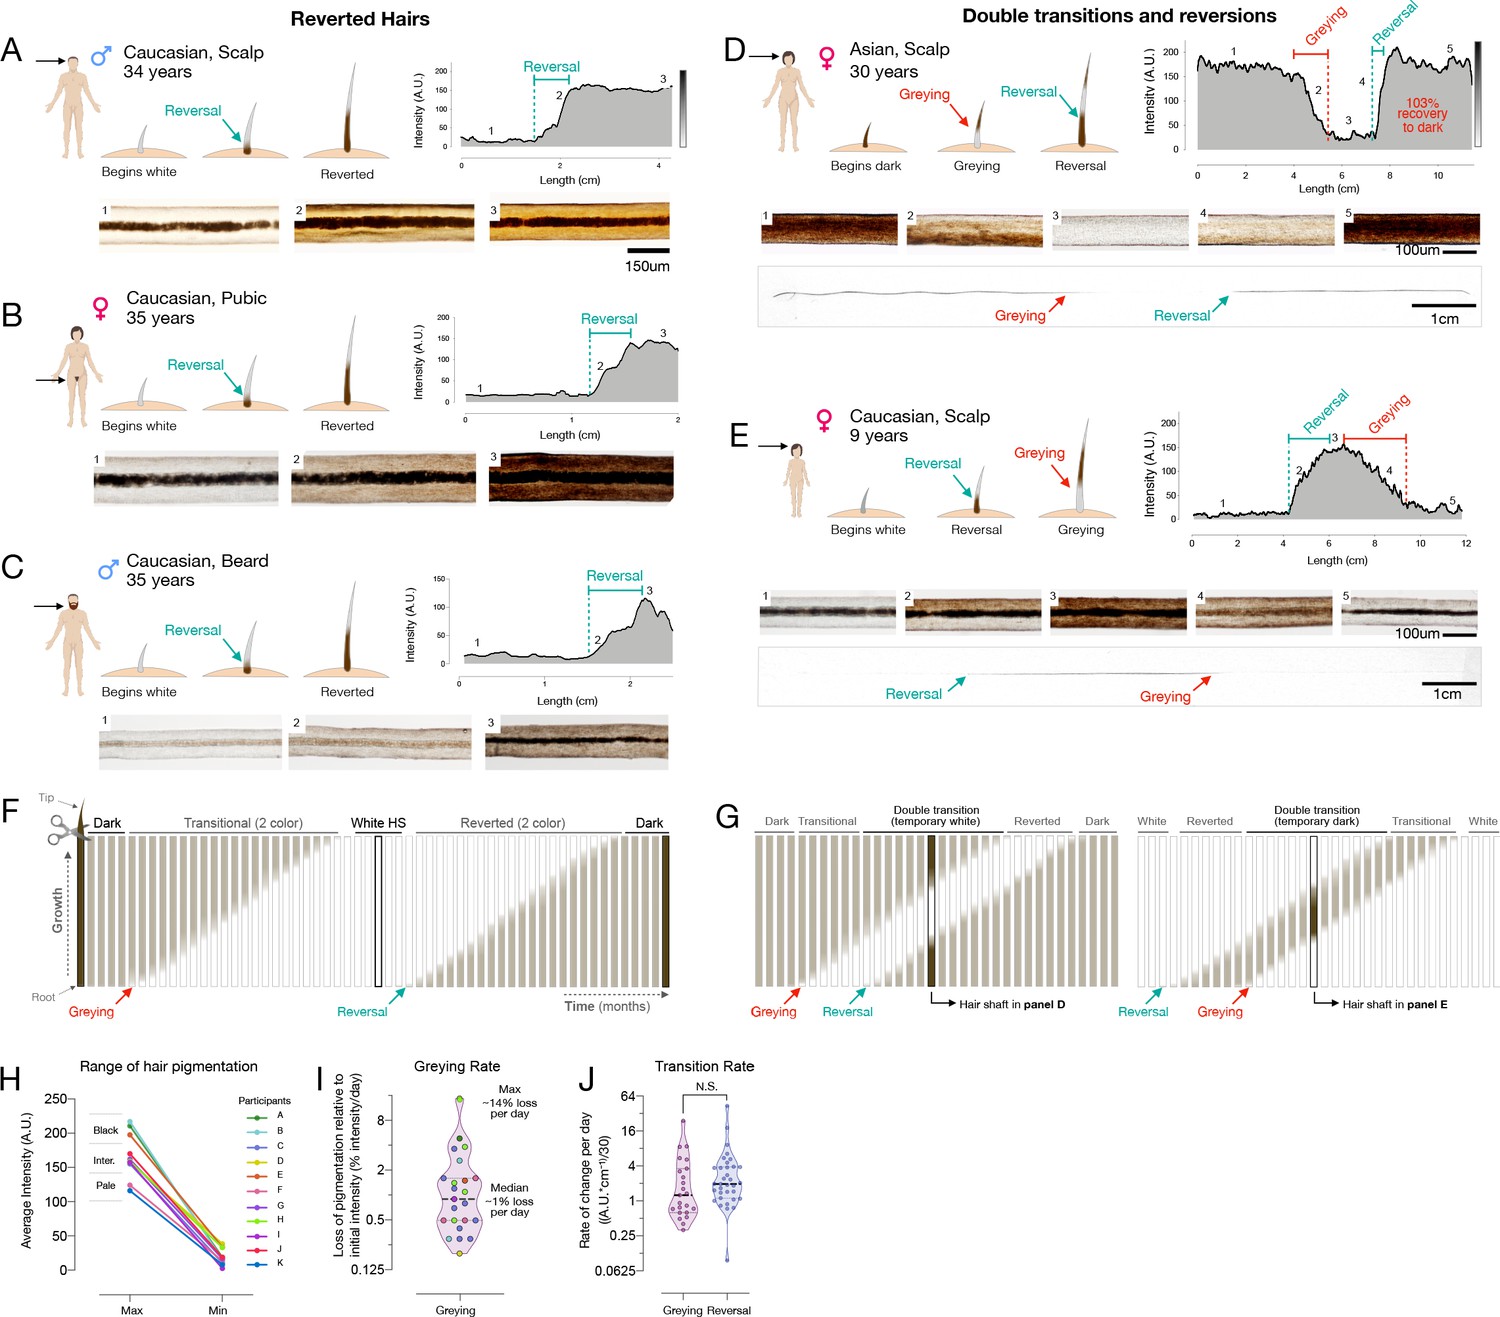
Reversal of hair greying across ages and body regions.
(A–G) Examples of HS greying and reversal including schematic of hair growth (top left), digitized HPP (top right), and light microscopy images (bottom) corresponding to numbered HS segments on the HPP plot. (A) Examples illustrating the reversal of greying along the length of scalp, (B) pubic, (C), and beard human HSs. (D) Example of segmental HS with double transitions, including temporary greying and (E) temporary reversal from an adult and a child, respectively. See Figure 2—figure supplement 1 for additional examples and Video 1 for animation. (F) Time course diagram illustrating the progression of a single dark HS undergoing greying followed by reversal back to its original color, and (G) closely occurring events of greying and reversal occurring, producing HS with double transitions. (H) Average maximum and minimum pigmentation intensity among transitioning hairs from participants with two-colored hairs (n = 11). Hairs with an average maximum intensity >180 A.U. are categorized as high intensity (black), 140–180 A.U. as intermediate intensity, and 100–140 A.U. as low intensity (pale color), indicating that these findings generalize across a range of pigmentation densities. (I) Rate of depigmentation per day in greying HS (n = 23), measured from the slope on HPP graphs expressed as % of starting intensity loss per day (assuming growth rate of 1 cm/month). (J) Comparison of the absolute rate of pigmentation change per day in greying (n = 23) and reverted (n = 34) HS. (I) and (J) are reported on a log2 scale to facilitate visualization.
-
Figure 2—source data 1
Source data for Figure 2.
- https://cdn.elifesciences.org/articles/67437/elife-67437-fig2-data1-v1.xlsx
Figure 2—figure supplement 1
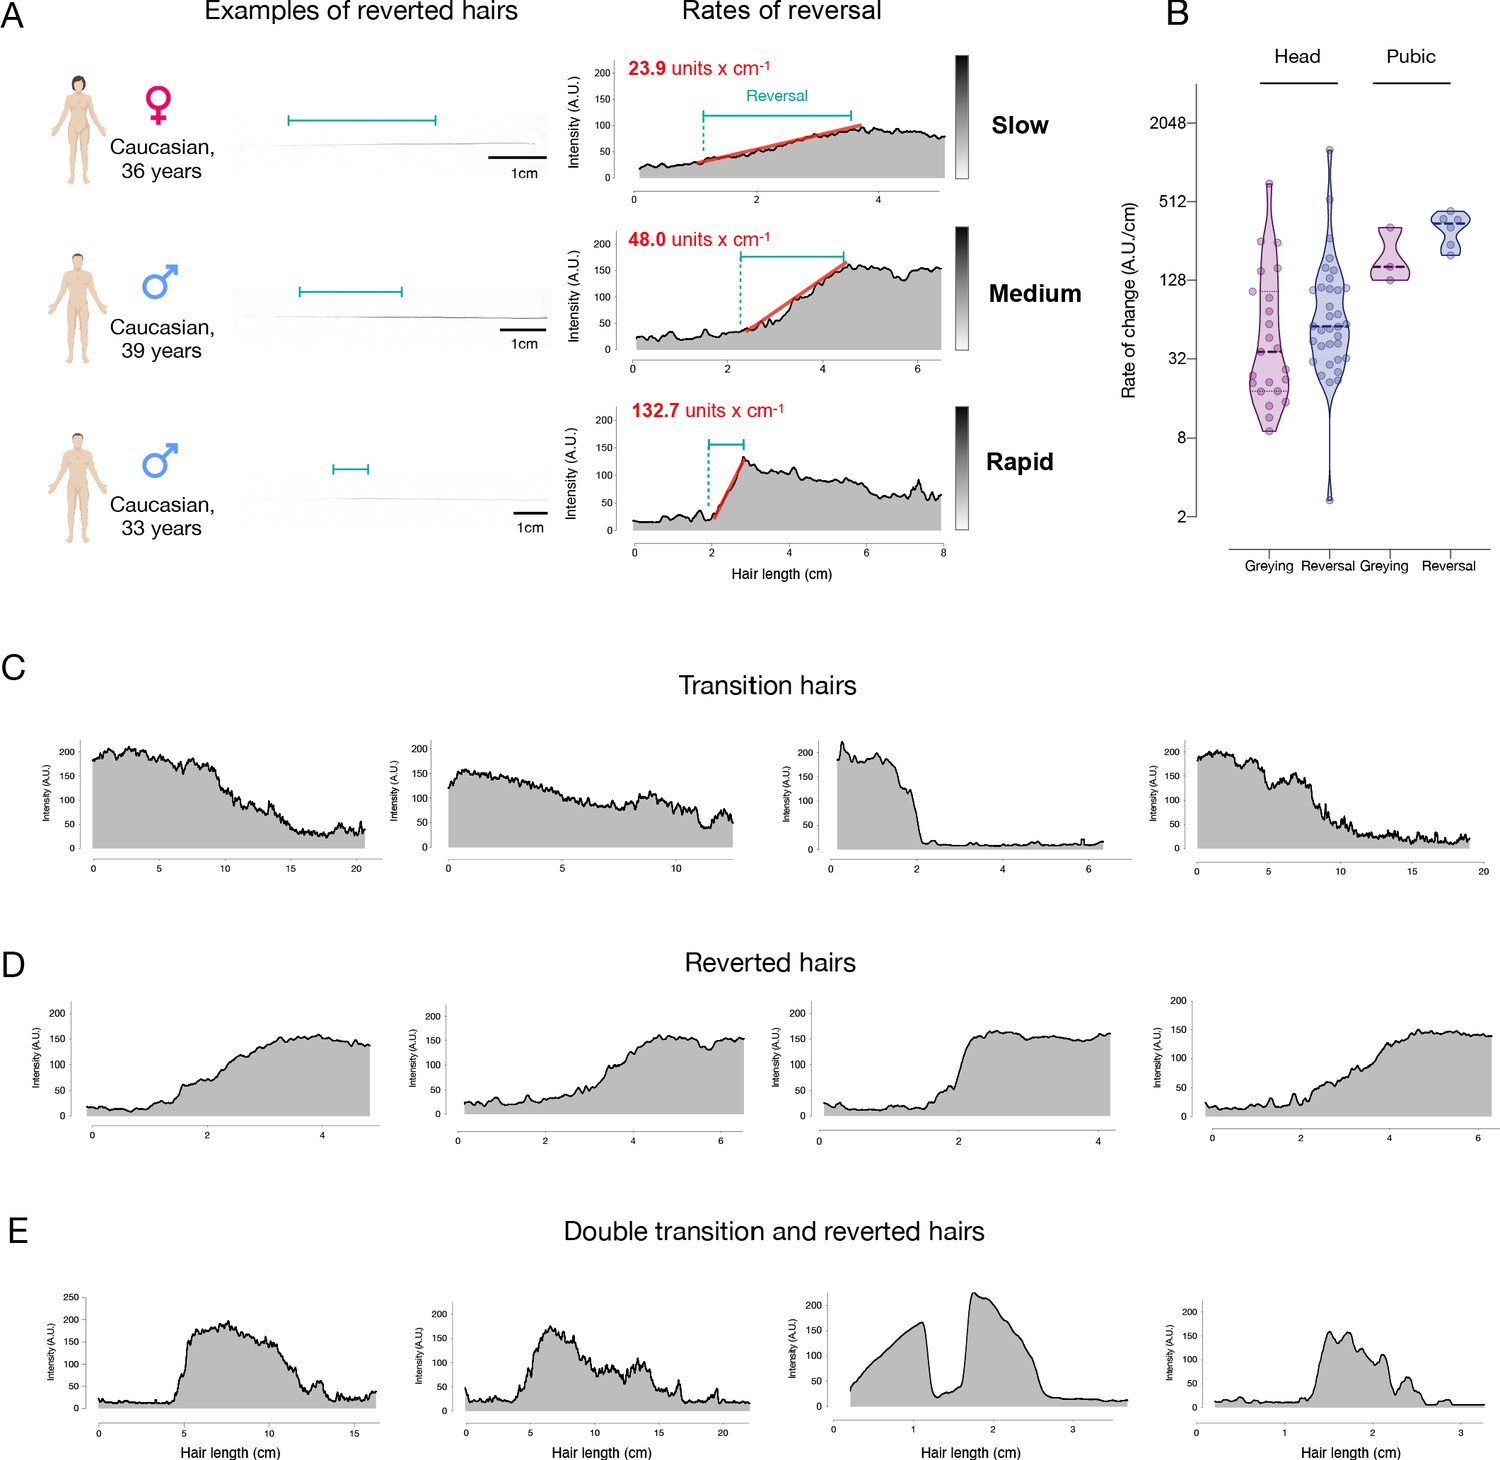
Hair pigmentation patterns across a range of individuals.
(A) Examples of greying reversal in hairs with various rates of re-pigmentation in three adult individuals, including slow, medium, and rapid events of repigmentation. The left side shows actual photographs of hairs and the length over which each hair shaft regains pigmentation. On the right are the corresponding hair pigmentation patterns (HPPs) for each hair and the computed slope reflecting the rate of greying reversal. (B) Quantification of the rate of change in pigmentation per day in greying and reverted hairs (n = 39) and pubic greying and reverted hairs (n = 9), reported on a log2 scale. (C) Examples of hairs undergoing the transition from dark to grey from a 40-year-old female, 35-year-old female, and 69-year-old male. (D) Additional examples of hairs undergoing greying reversal from a 39-year-old male, 36-year-old female, and a 33-year-old male. (E) Additional examples of hairs with double transitions and reversions from a 35-year-old female and a 36-year-old female.
-
Figure 2—figure supplement 1—source data 1
Source data for Figure 2—figure supplement 1.
- https://cdn.elifesciences.org/articles/67437/elife-67437-fig2-figsupp1-data1-v1.xlsx
Figure 3 with 2 supplements
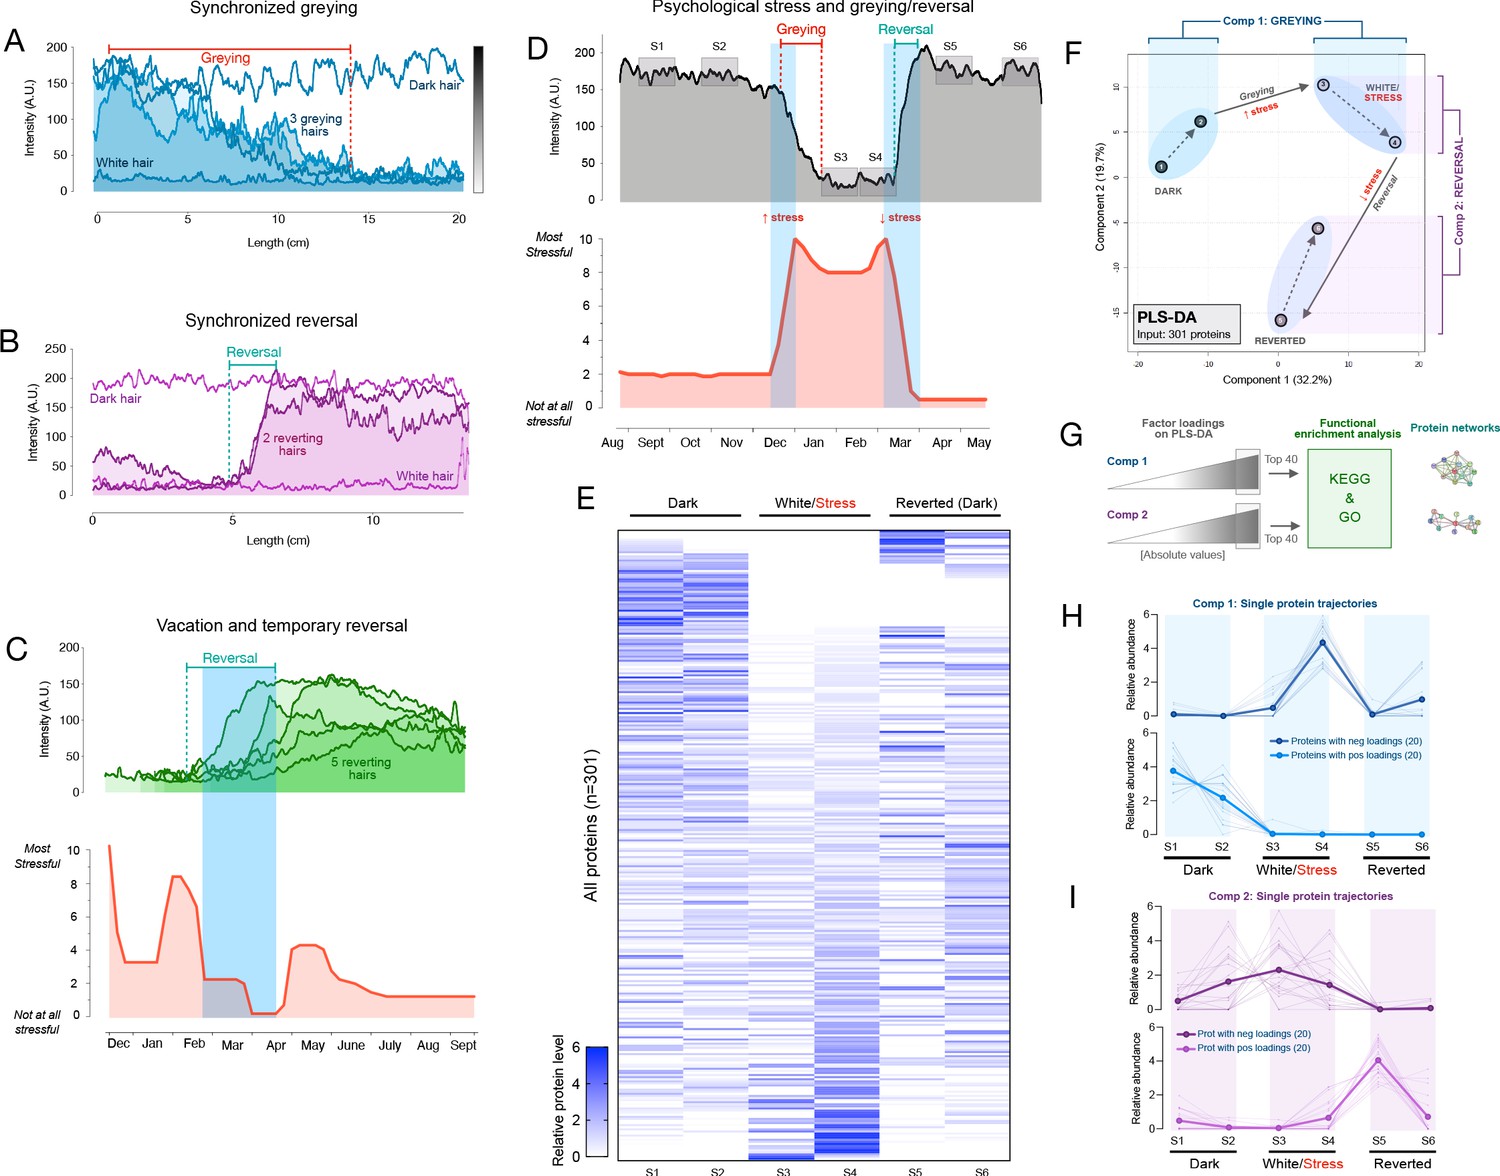
Synchronous greying and reversal behavior across multiple hairs and associations with psychosocial stress.
(A) In a 35-year-old Caucasian female, multiple HS (n = 3) undergoing greying simultaneously. (B) In a 37-year-old Caucasian female, two bi-color HS collected 2 months apart aligned based on a growth rate of 1 cm/month undergoing reversal nearly simultaneously. In A and B, simultaneously plucked dark and white hairs are plotted for reference. (C) In a 35-year-old Caucasian male, multiple bi-color HS (n = 5) undergoing reversal (top-panel) plotted against time-matched self-reported psychosocial stress levels (bottom-panel). (D) HS from a 30-year-old Asian female with 2 months of self-reported profound perceived stress associated with temporary hair greying and reversal. Note the synchronicity between the increase in stress and rapid depigmentation (i.e. greying), followed by complete (103%) recovery of HS pigmentation (i.e. reversal of greying) upon alleviation of life stress. (E) Heatmap of protein abundance (n = 301) across six segments: two dark prior to stress/greying, two white following greying, two dark segments after reversal. (F) Multivariate PLS-DA model of the six segments from the HS in E, highlighting the model’s first and second principal components related to greying and reversal, respectively. Numbers 1 to 6 correspond to HS segments on D. (G) Factor loadings for Components 1 and 2 were used to extract the most significant proteins, subsequently analyzed for functional enrichment categories in KEGG and GO databases, and STRING protein networks. (H) Trajectories of protein abundance from the top Component one and (I) Component two features across the six segments; proteins with positive (top) and negative loadings (bottom) are shown separately.
-
Figure 3—source data 1
Source data for Figure 3.
- https://cdn.elifesciences.org/articles/67437/elife-67437-fig3-data1-v1.xlsx
Figure 3—figure supplement 1
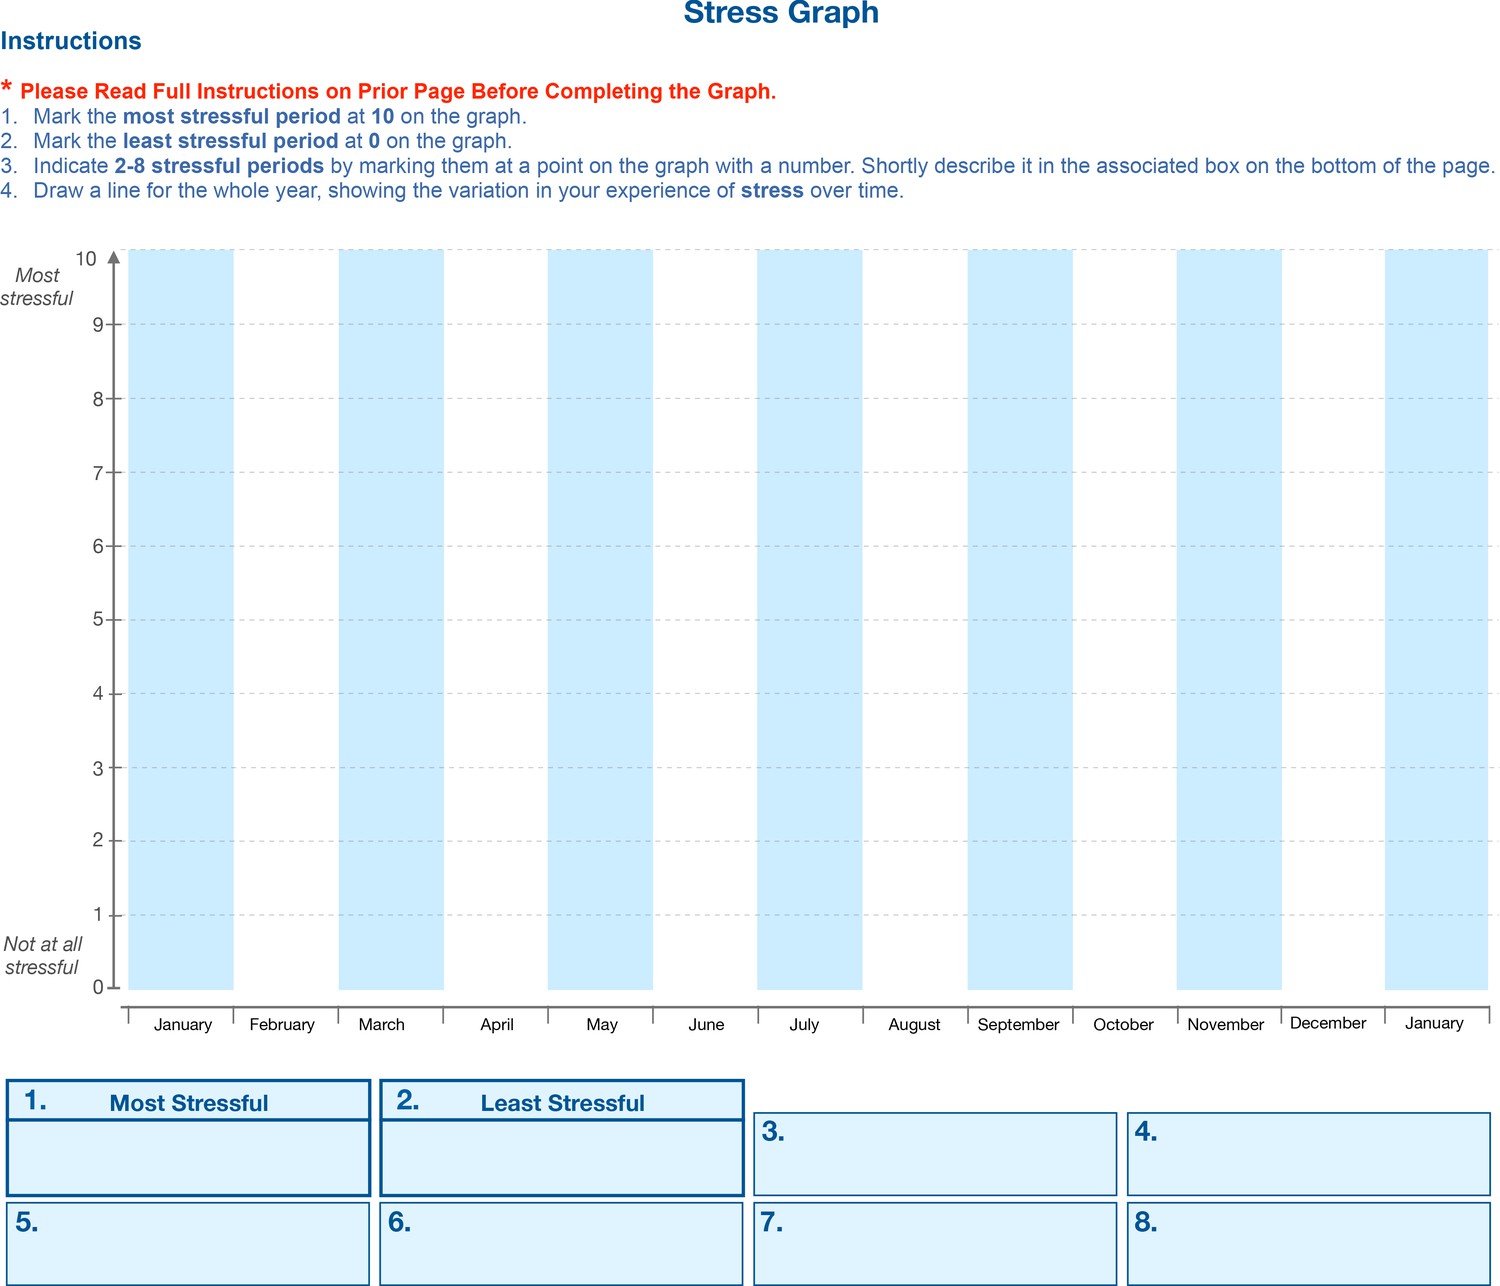
Retrospective stress assessment instrument.
Participants are asked to note the most and least stressful events over the past year (Boxes 1 and 2) and mark them with a corresponding point on the scheme above. Participants then indicate 2–6 noteworthy life events or periods over the past year and assign them scores ranging from most stressful to least stressful (10 and 0, respectively) and mark them on the timeline. Participants are asked to briefly name/describe each event, to help with recall. Participants then connect these events with a line. The stress graph is subsequently digitized and used in correlation analyses with hair pigmentation patterns (HPPs) as in Figure 3C and D.
Figure 3—figure supplement 2
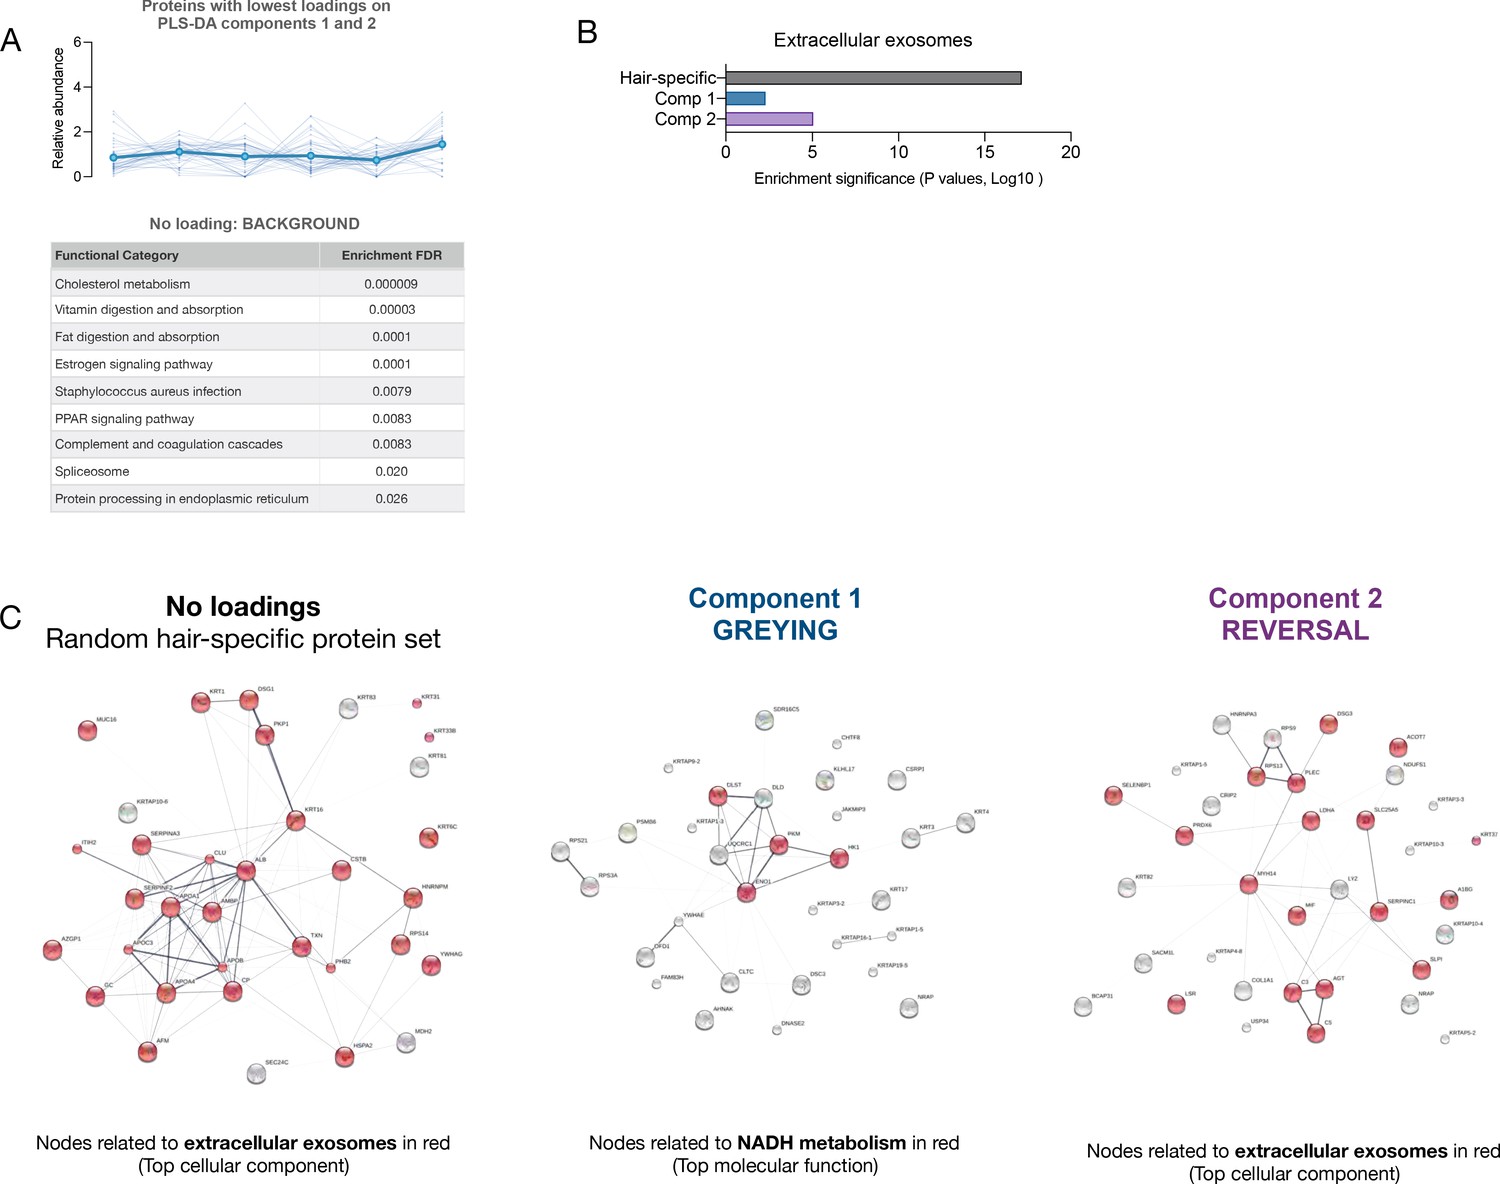
Single-hair multi-segment analysis.
(A) Abundance trajectories of the 20 proteins with lowest loadings on the PLS-DA model components 1 and 2, reflecting background protein composition not related to the greying process. The top KEGG categories enriched among these proteins is listed in the table. (B) Enrichment significance for the GO term ‘extracellular exosomes’ among proteins with highest loadings on components 1 and 2 compared with background proteins (lowest loadings) showing a marked decrease in exosome-related signature with greying (component 1), which is more modestly attenuated among component two proteins. (C) Protein-protein interaction networks (STRING) for background proteins with no loadings, component one proteins, and component two proteins, highlighting nodes relating to top GO cellular component or molecular function. Note the high number of proteins related to extracellular exosomes in background hair proteins, compared to proteins associated with hair greying. The molecular signature associated with component 2 (reversal) appears to show a re-enrichment for exosome and more closely resembles the non-specific proteins.
-
Figure 3—figure supplement 2—source data 1
Source data for Figure 3—figure supplement 2.
- https://cdn.elifesciences.org/articles/67437/elife-67437-fig3-figsupp2-data1-v1.xlsx
Figure 4 with 2 supplements
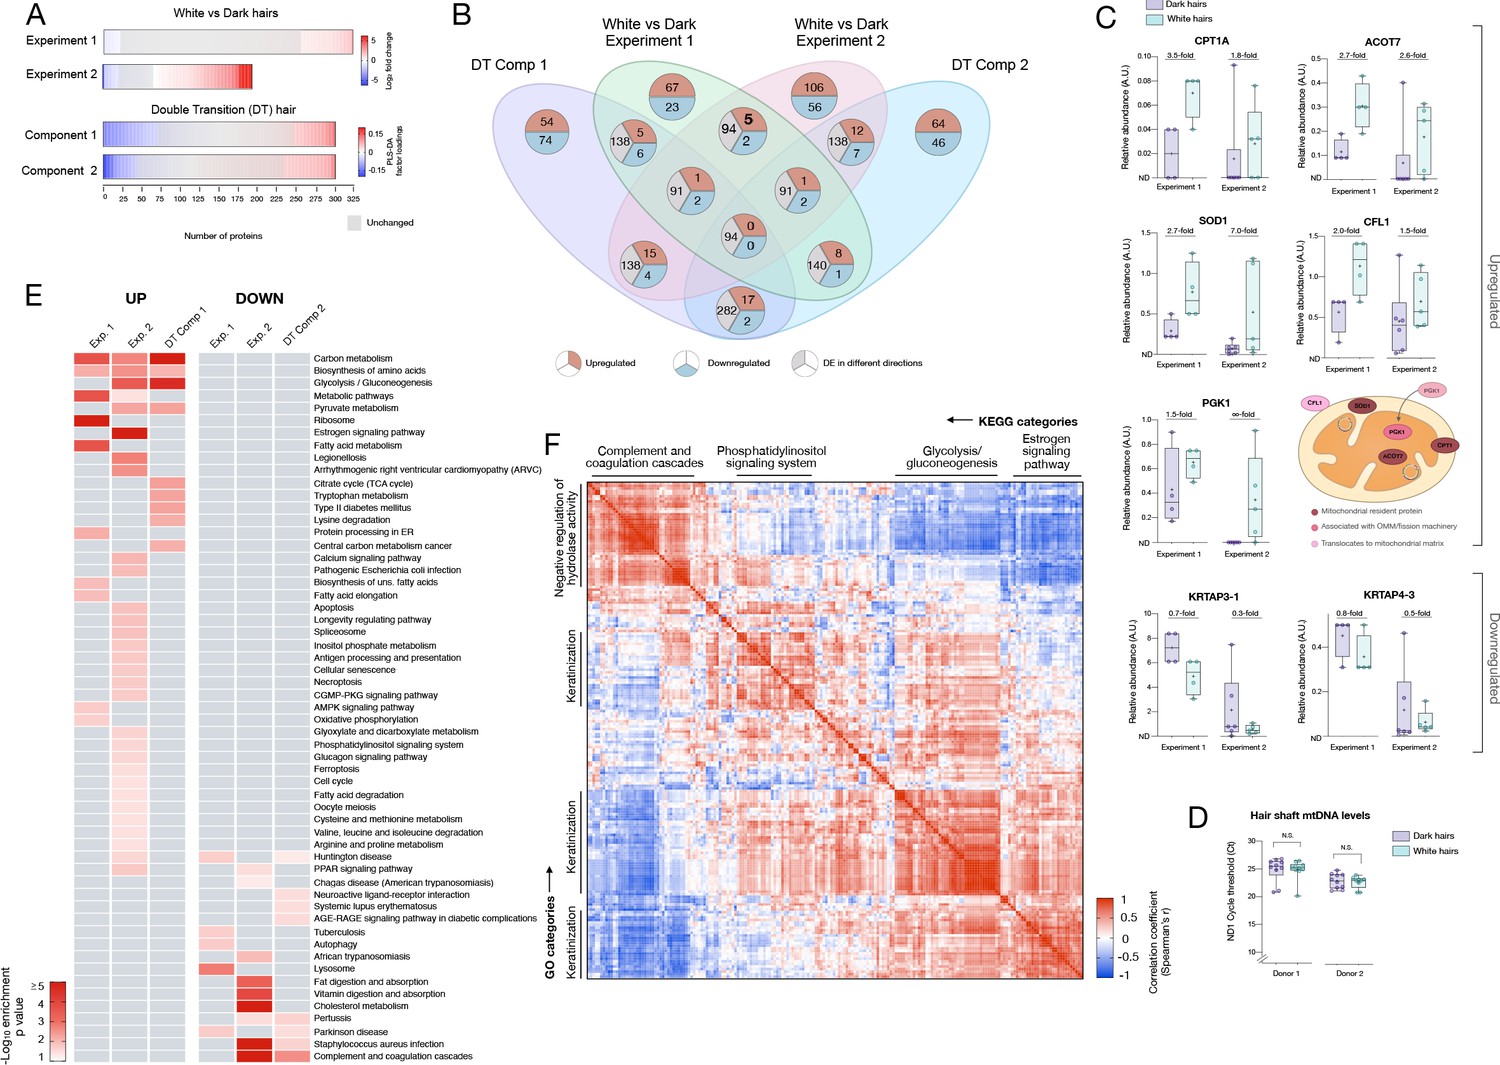
Meta-analysis of human hair proteomic findings comparing dark and white hairs.
(A) Number of downregulated (<0.8 fold, blue) and upregulated (<1.5 fold) proteins across datasets, and unchanged proteins shown in grey. (B) Venn diagram illustrating the intersection of datasets. The number of overlapping proteins across datasets that are either consistently down- or upregulated, or proteins not regulated in the same direction, are shown for each area of overlap. (C) Individual protein abundance for consistently upregulated (n = 5) and downregulated proteins (n = 2) across experiments 1 and 2 shown are shown as box and whiskers plots, with bars extending from the 25th-75th percentiles, and whiskers from min to max values. Lines indicate the median and '+' signs indicate the mean. Fold difference values are the mean fold differences relative to dark hairs. (D) Mitochondrial DNA abundance in human HS of the same two donors as in Figure 1F–I (AA male, Cau male). (E) Summary of significantly enriched KEGG categories across datasets, for upregulated (left) and downregulated (right) proteins. (F) Correlation matrix (Spearman’s r) of all detected proteins (n = 192) in experiment 2, illustrating general human hair protein co-expression across dark and white pigmented states (dark, white). Four main clusters are highlighted and labeled by their top KEGG category. N.S. from Mann Whitney Test.
-
Figure 4—source data 1
Source data for Figure 4.
- https://cdn.elifesciences.org/articles/67437/elife-67437-fig4-data1-v1.xlsx
Figure 4—figure supplement 1
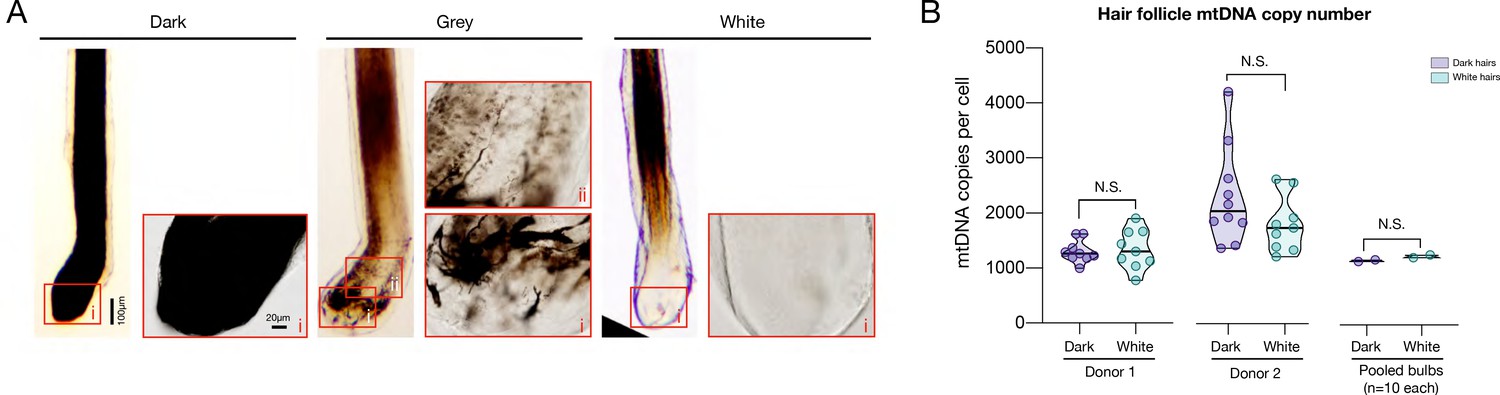
Mitochondrial DNA copy number in dark and white hair follicles.
(A) Typical examples of pigmented (dark), grey, and depigmented (white) plucked hair follicles, which include vital tissue from the precortical hair matrix and at least remnants of the hair follicle pigmentary unit (HFPU) imaged by light microscopy on freshly plucked HFs. Note the absence of pigmented melanocytes in the white HF. Boxed regions show magnified versions for each hair type. (B) Mitochondrial and nuclear DNA abundance were quantified from the hair follicles of plucked dark and white hairs, like in (A), from the same donors as the electron microscopy in Figure 1 were (male African-American, male caucasian). n = 10 hair follicles per condition. To rule out potential differences related to DNA abundance,10 follicles from each condition (donor and color) were pooled and included in a single PCR run (right). There is no evidence of mtDNA copy number (mtDNAcn) alterations in white vs dark hair follicles, similar to shafts shown in Figure 4D. Two-way ANOVA, Tukey’s multiple comparison test. N.S.: non-significant.
-
Figure 4—figure supplement 1—source data 1
Source data for Figure 4—figure supplement 1.
- https://cdn.elifesciences.org/articles/67437/elife-67437-fig4-figsupp1-data1-v1.xlsx
Figure 4—figure supplement 2
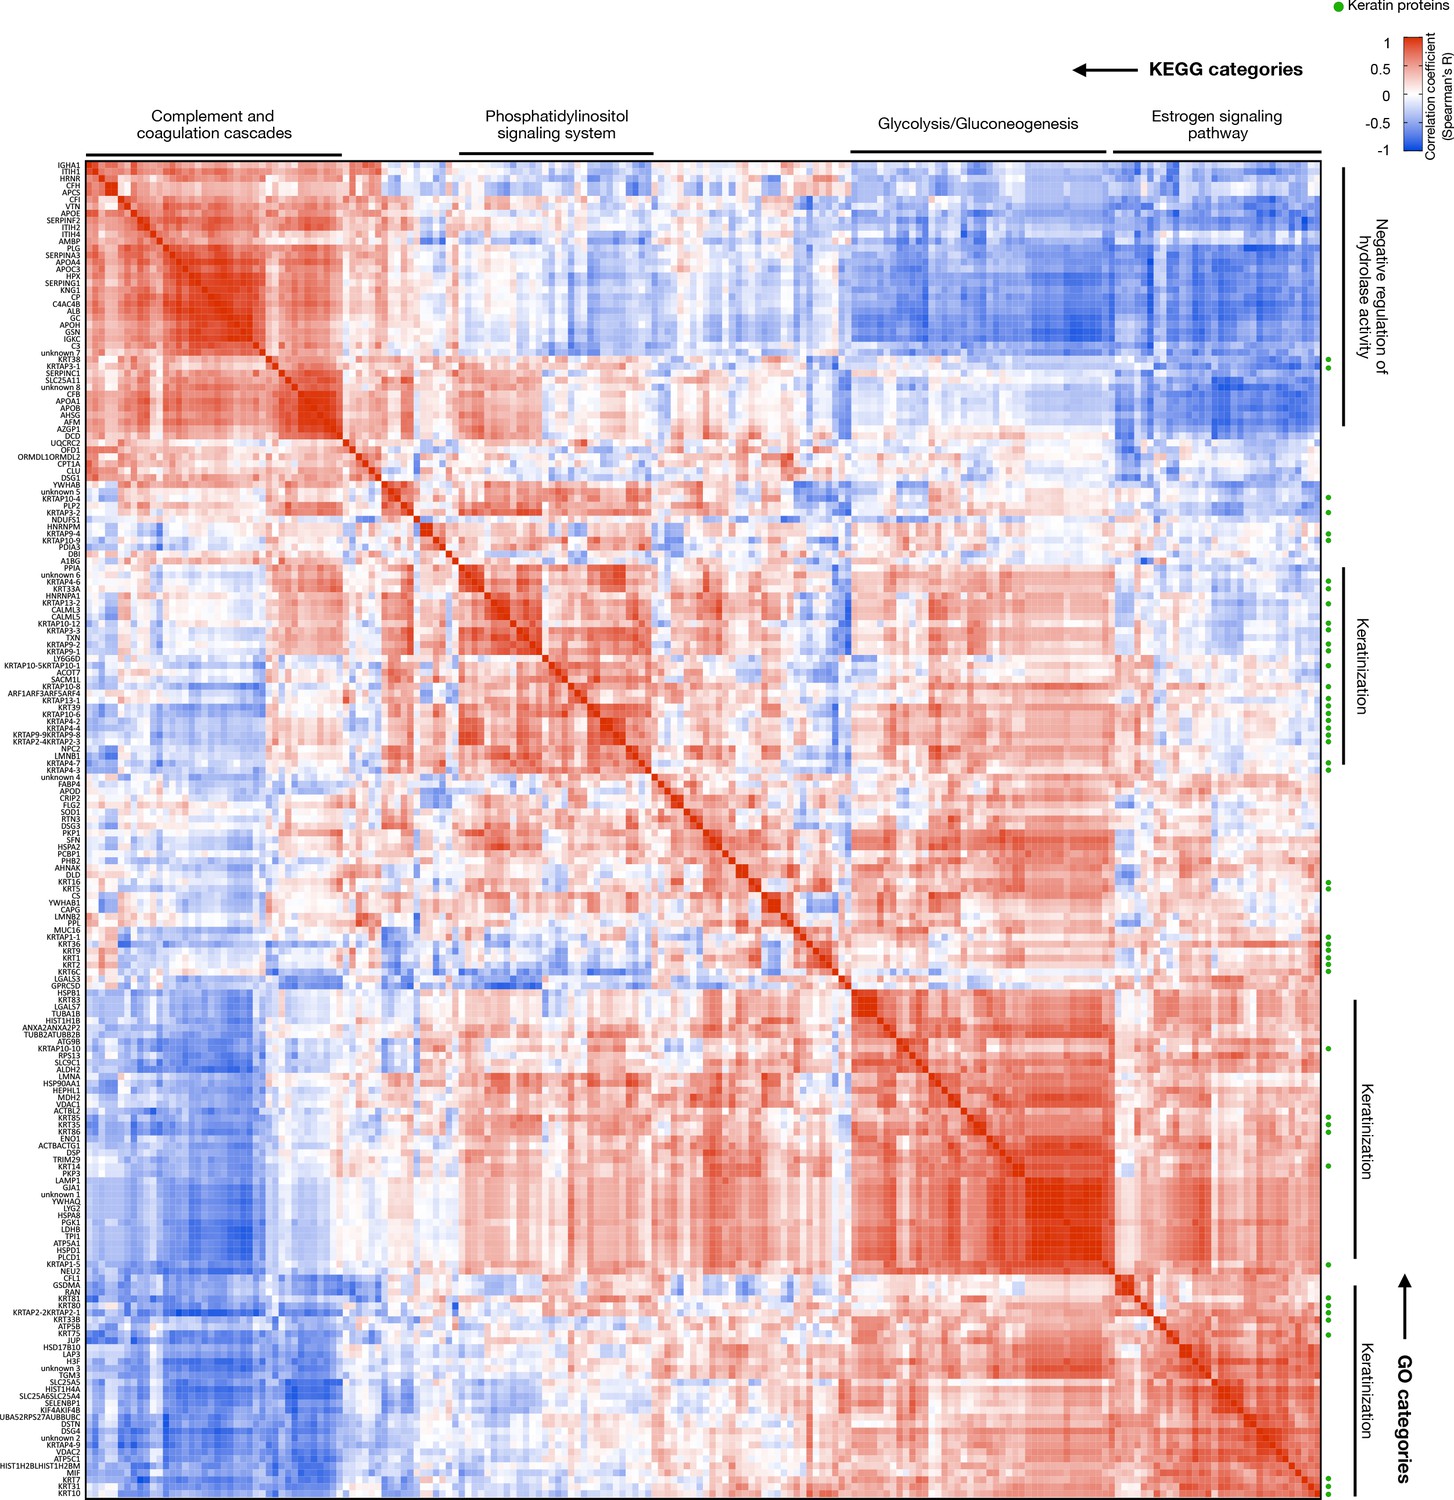
Correlation matrix reflection co-regulation of the human hair proteome (n = 192).
Higher resolution version of Figure 4F. Clusters are labeled by top KEGG (top) and GO biological function (right) annotations. Correlation strengths and direction are color coded as indicated, and keratin proteins are marked with a green marker. Data from LC-MS:MS experiment 2, n = 11 HS segments from six individuals.
Figure 5 with 2 supplements
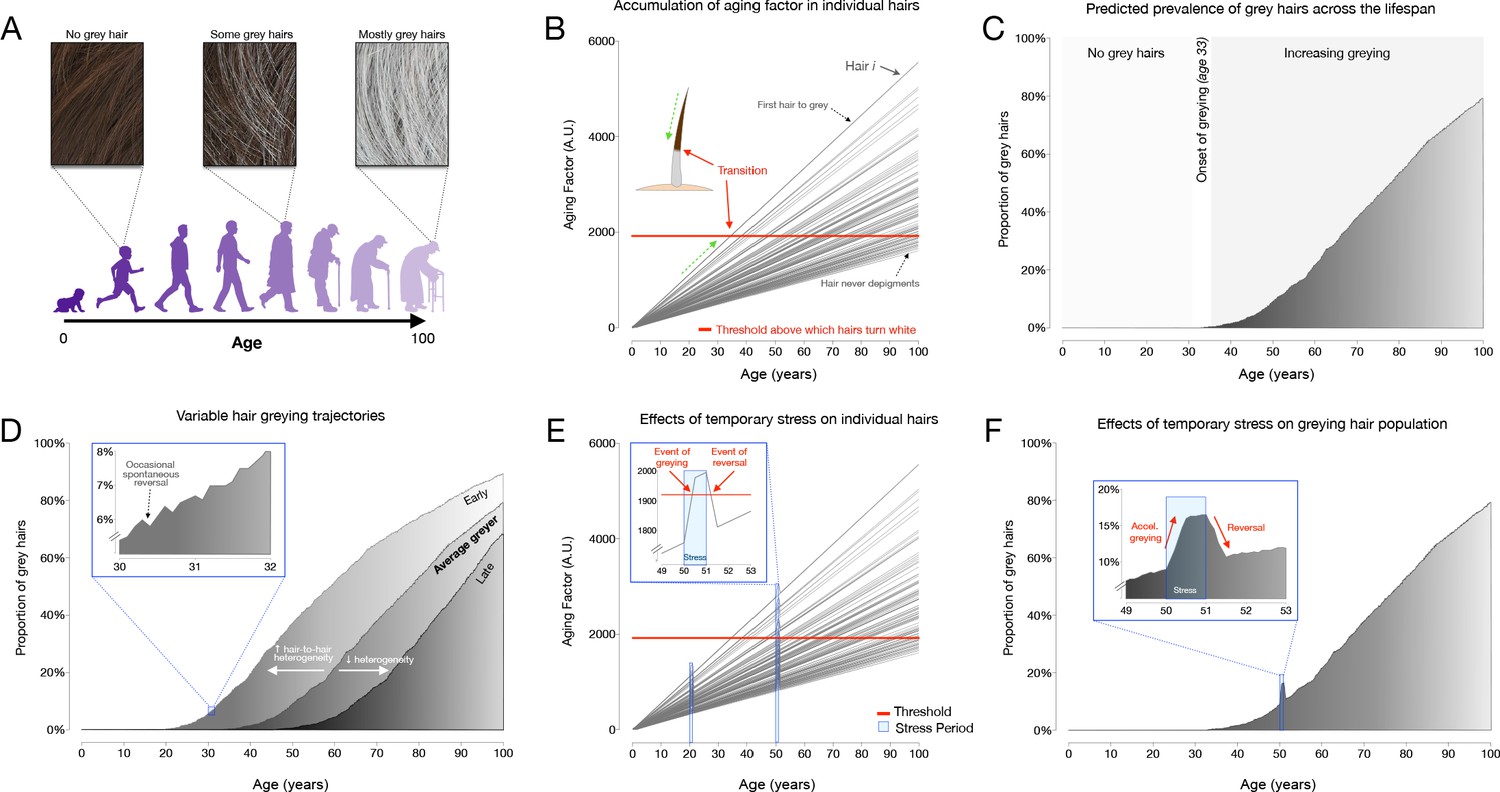
Modeling of hair greying and reversal across the human lifespan and in response to temporary stress.
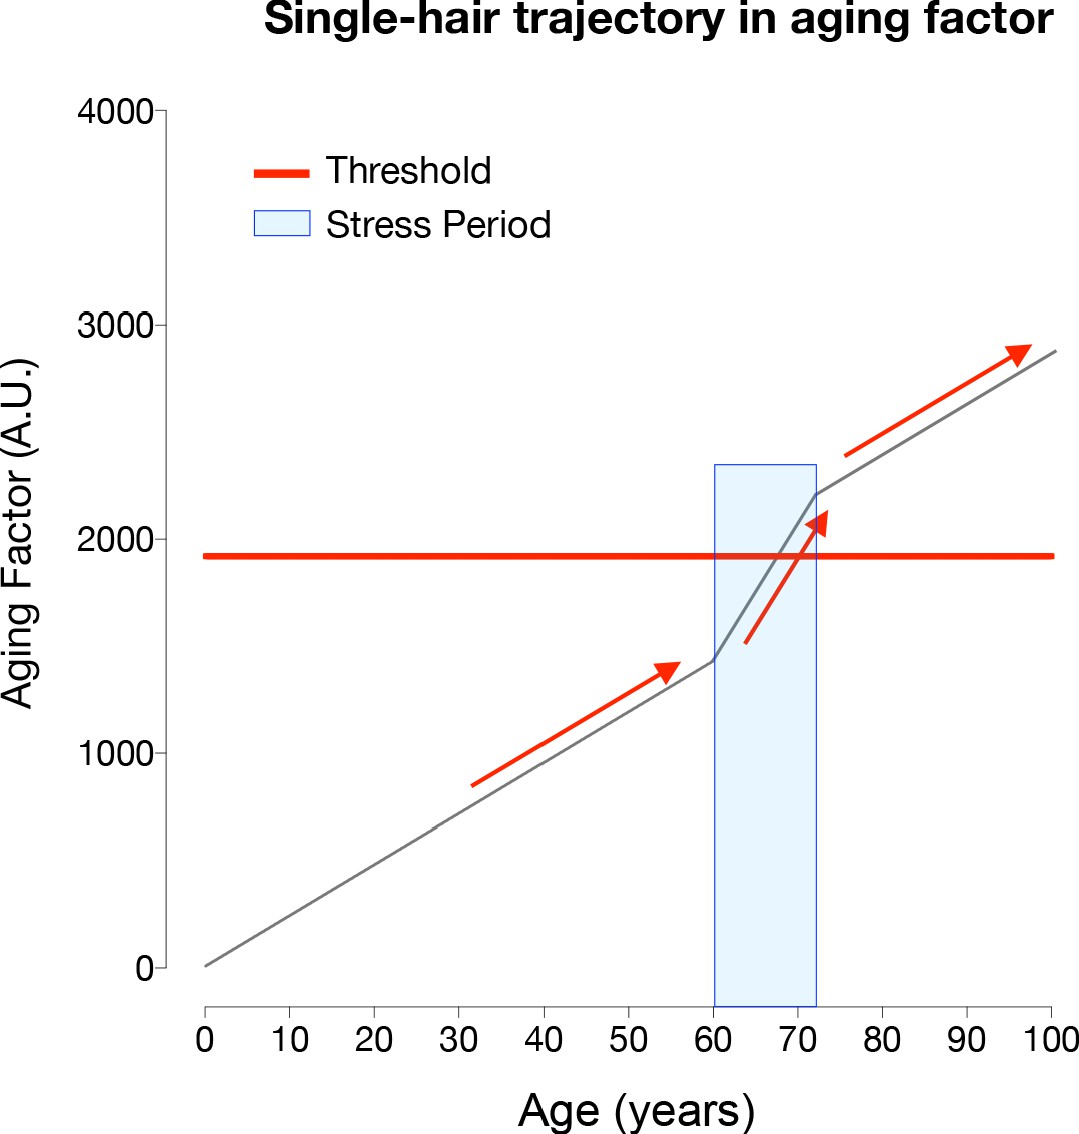
(A) Schematic overview of the average greying process across the lifespan involving the gradual loss of pigmentation, or accumulation of white hairs, mostly in the second two-thirds of life. (B) Depiction of individual hairs (each line is a hair, i) from a linear mixed effects model with random intercept and slopes predicting hair greying. The model assumes (i) a constant increase in a putative aging factor and (ii) a constant threshold above which hairs undergo depigmentation. All model parameters are listed in Supplementary file 4. (C) Predicted hair population behavior (n = 1000 hairs) shown as a cumulative frequency distribution of white hairs from the individual trajectories in panel (B). (D) Frequency distributions of grey hairs for individuals with early (left), average (middle), or late (right) hair greying phenotypes. The inset highlights a 2-year period during mid-life indicating gradual accumulation of white hairs, as well as the spontaneous repigmentation of a small fraction of white hairs (decrease in % white hairs), consistent with real-world data. (E) Single hair-level and (F) hair population-level results from the addition of two acute stress periods (each one year in duration, occurring at ages 20 and 50). The optimized model accounts for stress-induced greying in hairs whose aging factor is close to the depigmentation threshold, but not for young hairs or those far away from the threshold. Similarly, the removal of the stressor causes repigmentation of hairs when the aging factor returns below the threshold.
Figure 5—figure supplement 1
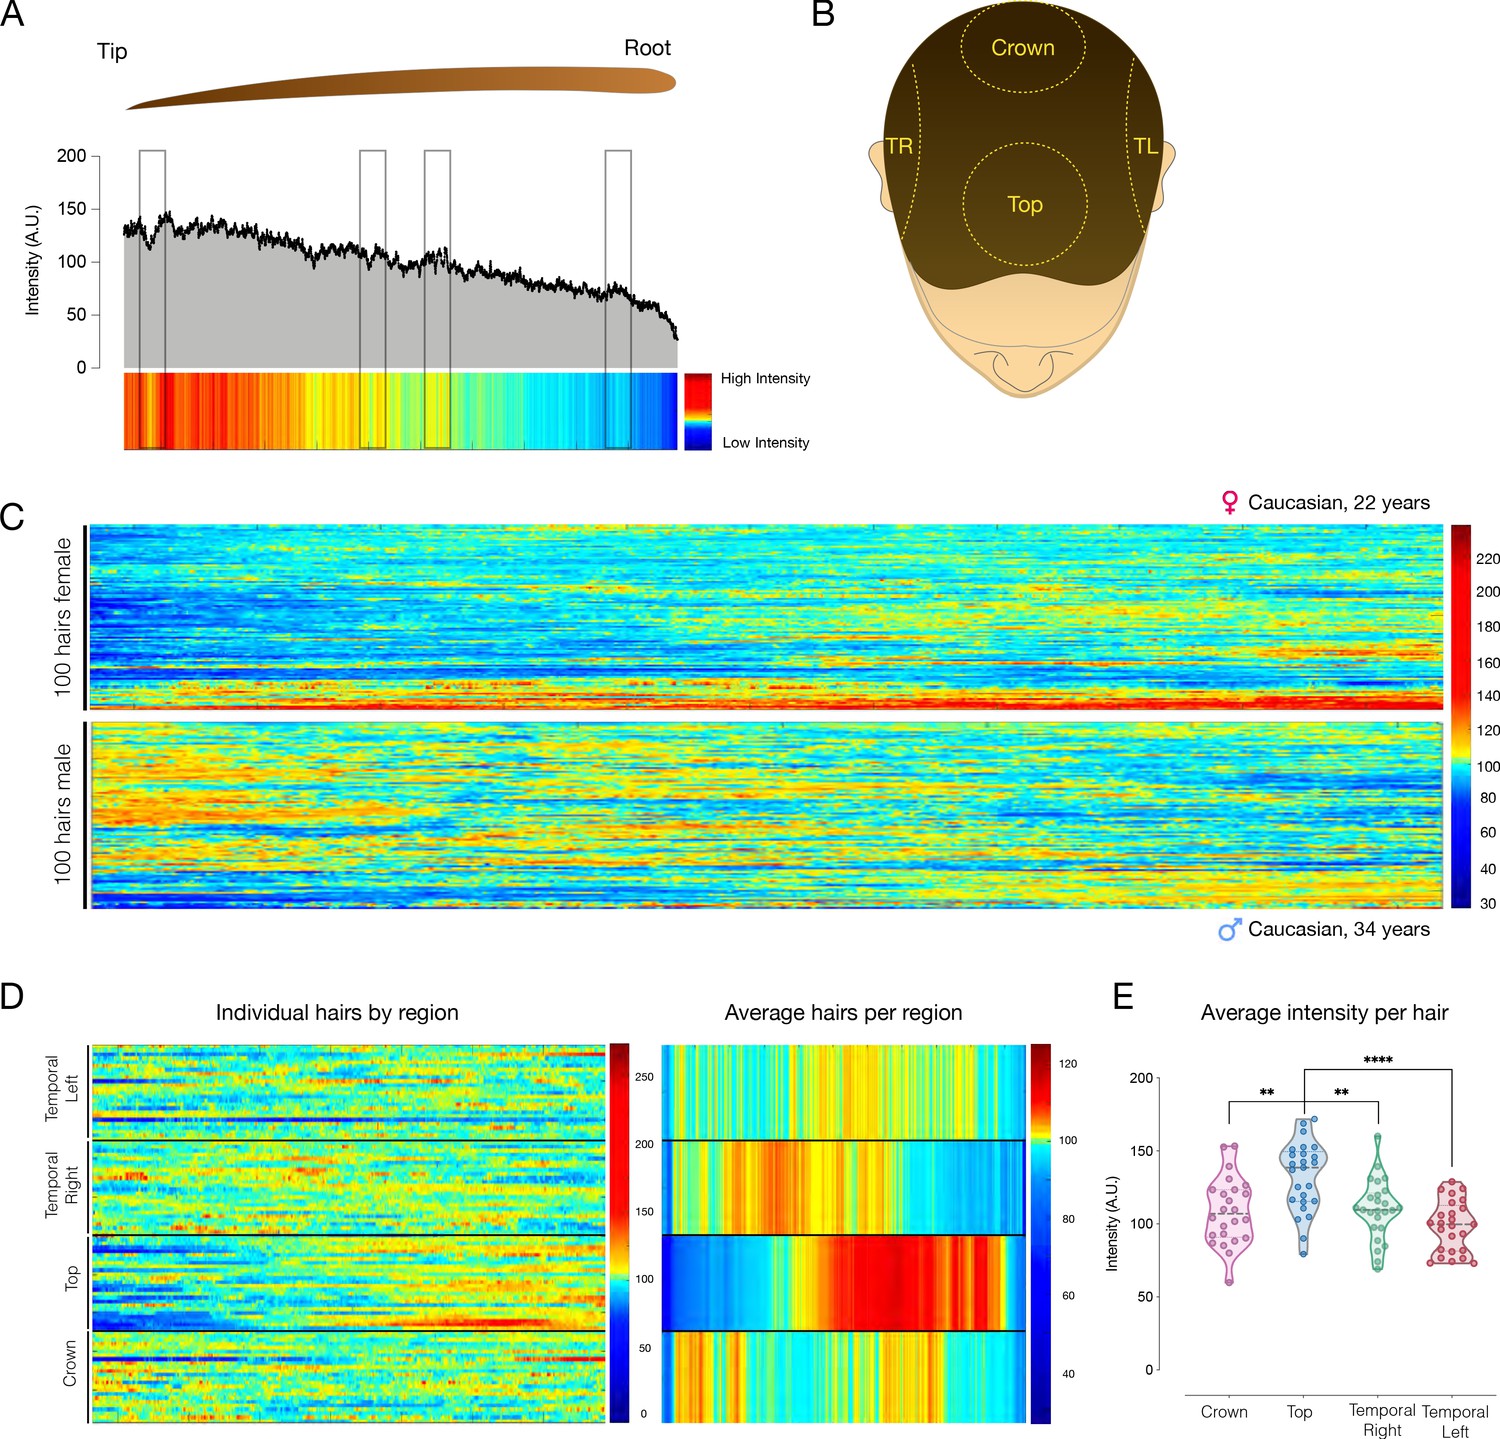
High-resolution analysis of hair pigmentation patterns.
(A) Example of HPP visualized as a heatmap, where dark red represents higher intensity pigmentation values (255 units, black), and dark blue represented lower intensity pigmentation values (20 units, white). The X axis represents the distance from the hair bulb, in pixels, with a resolution of 1252 pixels/cm. The boxed regions draw attention to some areas along the hair where there are minor changes in HPP, which are captured in the change in color on the heatmap. (B) Diagram representing the four regions of the scalp from which hairs were systematically collected; temporal left (TL) and right (TR), top, and crown. (C) Hair pigmentation analysis for 100 hairs from an adult female individual (top), and adult male individual (bottom) from the four head regions shown in B. Hairs are ordered by hierarchical clustering based on Euclidian distance, measuring the similarity of normalized hair pigmentation patterns. Each hair is intensity normalized to reflect deviation from the mean of each hair. (D) Same hairs as in (C, Male) but arranged by head regions showing HPP of individual hairs (left) or averages for each head region (right). (E) Average hair darkness (pigmentation intensity) arranged by head regions. Each datapoint is the average of a single hair. **p<0.01, ****p<0.0001, one-way ANOVA, Tukey’s multiple comparison test.
-
Figure 5—figure supplement 1—source data 1
Source data for Figure 5—figure supplement 1.
- https://cdn.elifesciences.org/articles/67437/elife-67437-fig5-figsupp1-data1-v1.xlsx
Figure 5—figure supplement 2
Alternative modeling of HPP greying transitions in response to stress.
Alternative model examining the influence of stress on the age-related increase in the aging factor. Compared to the successful model where stress causes a stepwise increase in the aging factor, in this model stress increases the slope in the aging factor during a stressful period, and removal of the stressor restores the initial slope of aging factor increase over time. Note that this ‘changing slope’ model fails to account for the reversal of greying upon alleviation of stress, even if the stressor and its removal occur close to the threshold.
Videos
Video 1
Microscopic visualization of hair greying and reversal in a single human hair shaft.
A greying transition followed by complete reversal in a single hair shaft, imaged from bulb to tip. Pigmentation intensity was dynamically captured on a motorized stage microscope at ×10 magnification from the plucked hair of a 30-year-old Asian participant (hair analyzed in Figure 2D).
Additional files
-
Supplementary file 1
Proteomic changes in greying hairs from experiment 1.
Fold changes are average abundance values for white relative to dark hair shafts (HS), determined by LC-MS/MS proteomics on matched white and dark HS from female and male individuals. The last column indicates overlap with known mitochondrial proteins listed in MitoCarta 2.0 and other database annotations.
- https://cdn.elifesciences.org/articles/67437/elife-67437-supp1-v1.xlsx
-
Supplementary file 2
Proteomic changes in greying hairs from experiment 2.
Fold changes are average abundance values for white relative to dark hair shafts (HS), determined by LC-MS/MS proteomics on white and dark HS from three female and three male individuals. The fourth column indicates overlap with known mitochondrial proteins listed in MitoCarta 2.0 and other database annotations. The fifth column indicates overlap with proteins that were found to be upregulated with increasing age of the donor (Plott et al., 2020).
- https://cdn.elifesciences.org/articles/67437/elife-67437-supp2-v1.xlsx
-
Supplementary file 3
LC-MS/MS proteomic changes in greying hairs from experiment 2.
Proteins undetected in dark hairs but detected in white HS from three female and three male individuals. Because these proteins are undetected in dark hairs, the fold change is infinity. The last column indicates overlap with known mitochondrial proteins listed in MitoCarta 2.0 and other database annotations.
- https://cdn.elifesciences.org/articles/67437/elife-67437-supp3-v1.xlsx
-
Supplementary file 4
Parameters used in hair greying simulation models.
Model parameters, descriptions, and values used in simulation models shown in Figure 5. Default values in the online simulation match those of Figure 5E and F.
- https://cdn.elifesciences.org/articles/67437/elife-67437-supp4-v1.xlsx
-
Transparent reporting form
- https://cdn.elifesciences.org/articles/67437/elife-67437-transrepform-v1.docx
Download links
A two-part list of links to download the article, or parts of the article, in various formats.
Downloads (link to download the article as PDF)
Open citations (links to open the citations from this article in various online reference manager services)
Cite this article (links to download the citations from this article in formats compatible with various reference manager tools)
Quantitative mapping of human hair greying and reversal in relation to life stress
eLife 10:e67437.
https://doi.org/10.7554/eLife.67437


