mRNA vaccine-induced T cells respond identically to SARS-CoV-2 variants of concern but differ in longevity and homing properties depending on prior infection status
- Department or Urology, University of California, San Francisco, United States
- Gladstone Institute of Virology, United States
- University of California, San Francisco, United States
- Medicine, University of California, San Francisco, United States
Figures
Figure 1 with 1 supplement
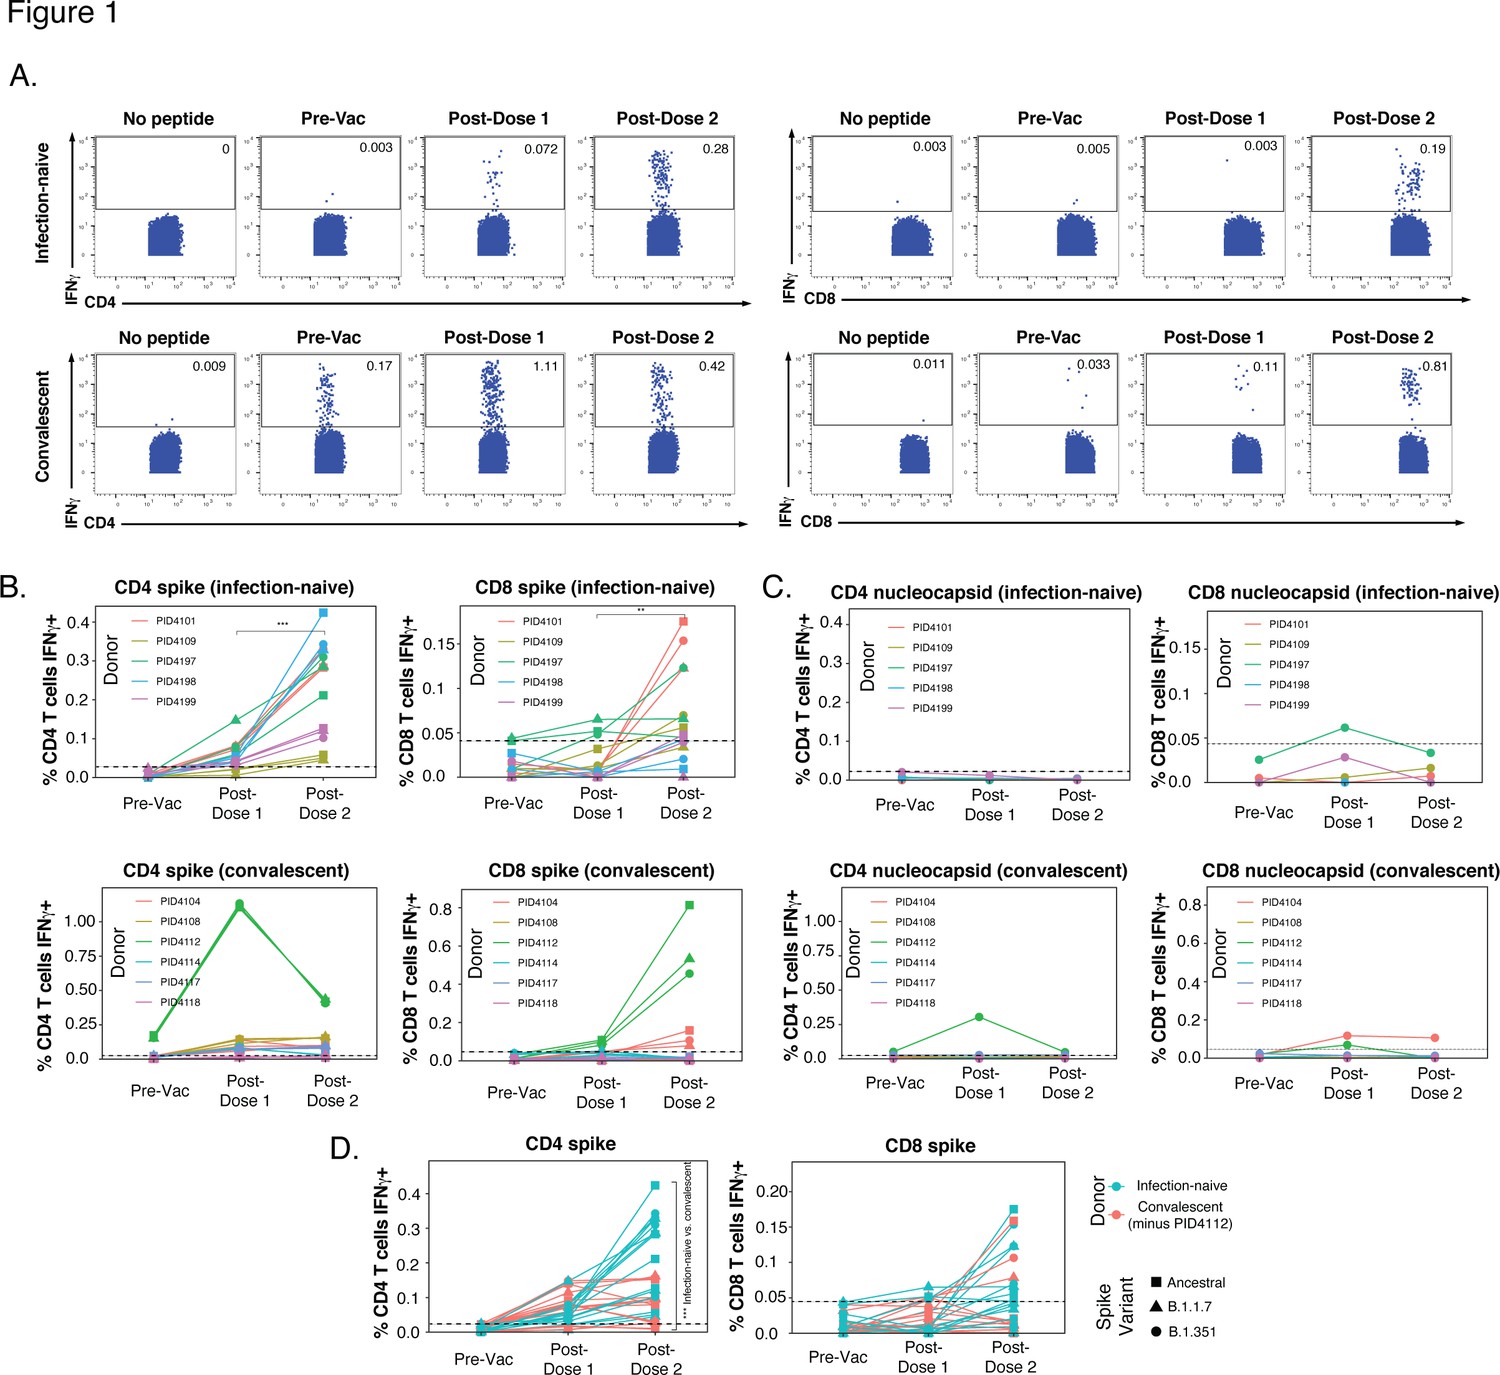
SARS-CoV-2-specific T cells elicited by vaccination recognize variants, and in a manner that differs among individuals with prior COVID-19.
(A) Identification of vaccine-elicited spike-specific T cells. PBMCs before vaccination (Pre-Vac) or 2 weeks after each dose of vaccination were stimulated with spike peptides and assessed by CyTOF 6 hr later for the presence of spike-specific (IFNγ-producing) CD4+ (left) or CD8+ (right) T cells. The ‘no peptide’ conditions served as negative controls. Shown are longitudinal data from an infection-naïve (PID4101, top) and convalescent (PID4112, bottom) individual. (B) Quantification of the spike-specific CD4+ (left) and CD8+ (right) T cells recognizing the ancestral (squares), B.1.1.7 (triangles), and B.1.351 (circles) spike peptides ininfection-naïve (top) and a convalescent (bottom) individuals before and after vaccination. Note the similar frequencies of T cells responding to all three spike proteins in each donor, the clear boosting of spike-specific CD4+ T cell frequencies in infection-naïve but not convalescent individuals, and the overall higher proportion of responding CD4+ than CD8+ T cells. The dotted line corresponds to the magnitude of the maximal pre-vaccination response in infection-naïve individuals and is considered as background. The y-axes are fitted based upon the maximal post-vaccination response values for each patient group and T cell subset. The p-values shown (**p < 0.01, ***p < 0.001) were calculated by student’s t-test. (C) As expected, nucleocapsid-specific T cell responses are generally low over the course of vaccination, with the exception of convalescent donor PID4112. Shown are the frequencies of nucleocapsid-specific CD4+ (left) and CD8+ (right) T cells, as measured by IFNγ production upon stimulation with ancestral nucleocapsid peptides, in infection-naïve (top) and convalescent (bottom) individuals. The dotted line corresponds to the magnitude of the maximal pre-vaccination response in infection-naïve individuals and is considered as the background signal. Y-axes are labeled to match the corresponding y-axes for spike-specific T cell responses in panel B. (D) The CD4+ T cell response is boosted by the second vaccine dose to a greater extent in infection-naïve than convalescents individuals. Shown are the frequencies of spike-specific CD4+ (left) and CD8+ (right) T cells stimulated by the three spike proteins (squares: ancestral; triangles: B.1.1.7; circles: B.1.351) among the infection-naïve (aqua) and convalescent (coral) donors, after removal of outlier PID4112. ***p < 0.001 comparing the infection-naïve vs. convalescent post-dose two specimens, were calculated using student’s t-test.
Figure 1—figure supplement 1
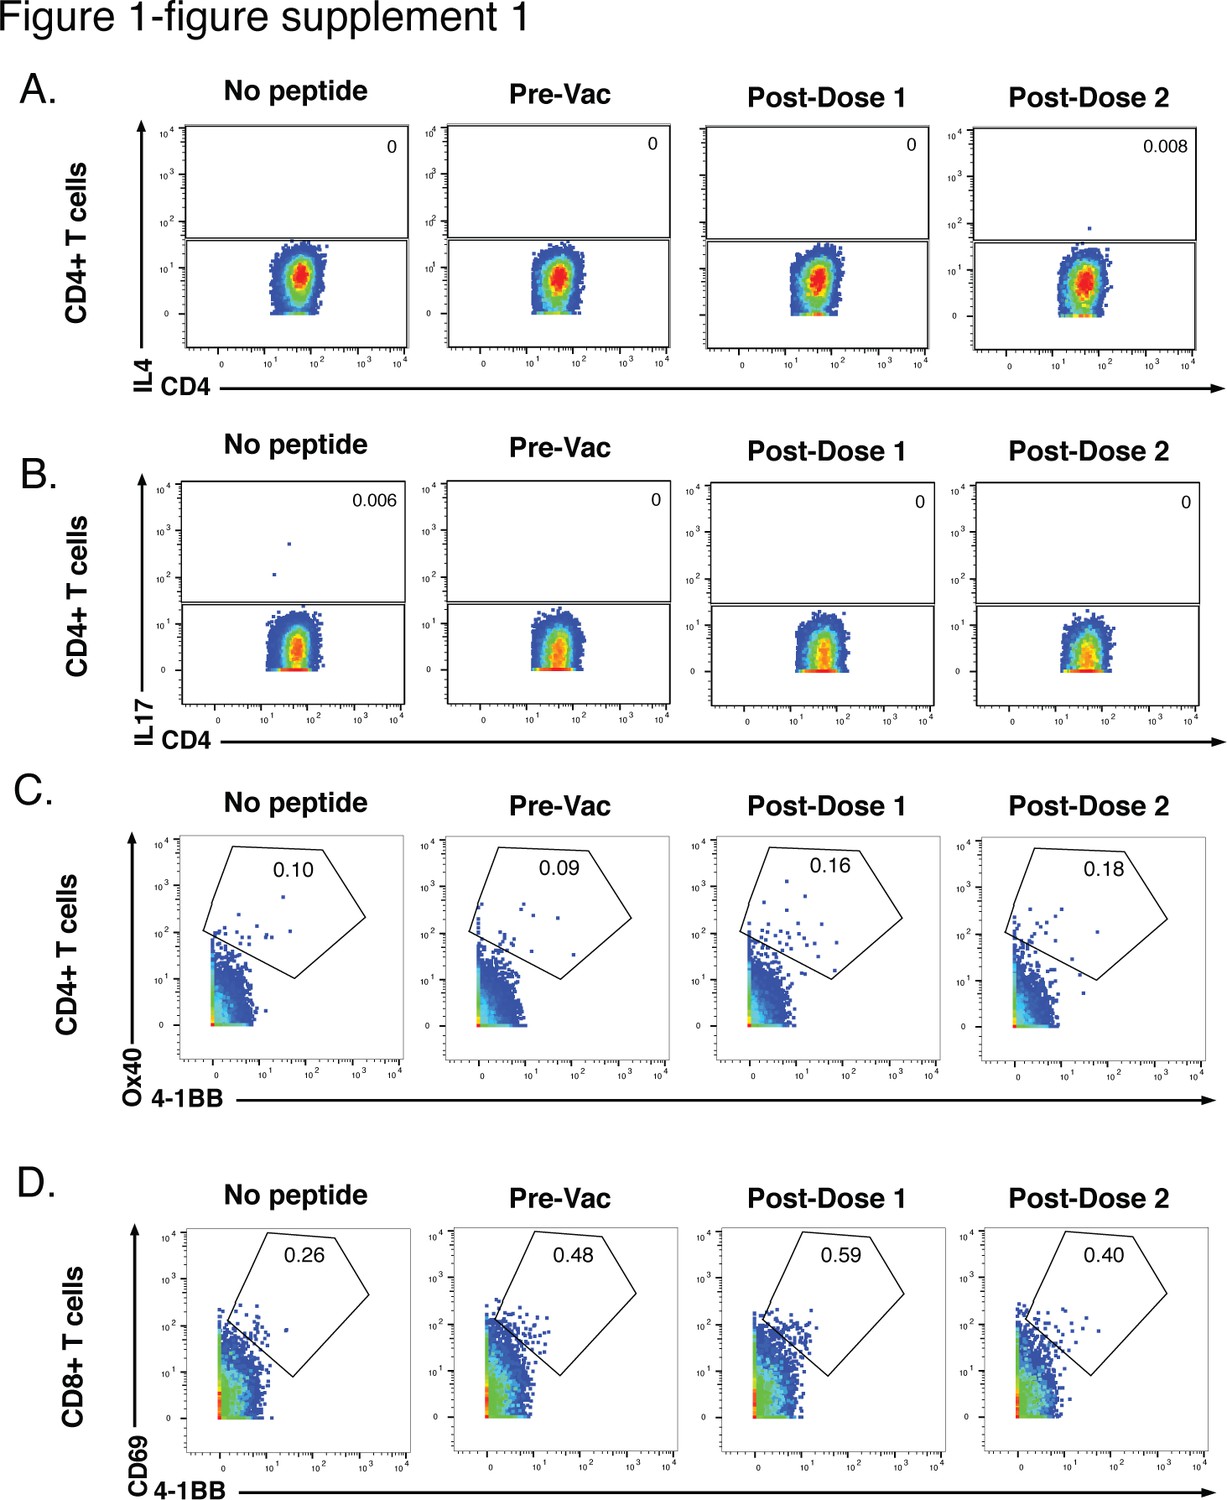
Six-hr stimulation with spike peptides does not induce significant expression of IL4, IL17, or activation markers in SARS-CoV-2-specific T cells.
(A, B) CD4+ T cells were assessed for expression of the Th2 cytokine IL4 (A) or the Th17 cytokine IL17 (B) following 6 hr of stimulation with ancestral spike peptides using PBMC specimens from a representative infection-naïve individual (PID4197) before vaccination (Pre-Vac), or 2 weeks after dose 1 or dose 2 of vaccination. (C) CD4+ T cells were assessed for co-expression of the activation-induced markers (AIM) Ox40 and 4-1BB following 6 hr of stimulation, using the same specimens as panel A. (D) CD8+ T cells were assessed for co-expression of the AIM CD69 and 4-1BB following 6 hr of stimulation, using the same specimens as panel A. Baseline specimens not treated with peptide are shown as a comparison control. Numbers correspond to percentages of cells within the gates. Note that the activated (AIM+) cells that appear in stimulated specimens probably do not reflect peptide-specific stimulation as AIM+ cells are also detected in the baseline specimens.
Figure 2 with 1 supplement

SARS-CoV-2-specific CD4+ T cells responding to B.1.1.7 and B.1.351 spike have the same phenotypes as those responding to ancestral spike.
(A) Datasets corresponding to spike-specific CD4+ T cells after vaccination were visualized as a multidimensional scaling (MDS) plot. Each datapoint reflects the cumulative phenotypes averaged across all the SARS-CoV-2-specific CD4+ T cells from a single stimulated sample. Data for both infection-naïve and convalescent individuals, and for both the post-dose one and post-dose two timepoints, are shown. The lack of segregation of the cells responding to the ancestral, B.1.1.7, and B.1.351 spike proteins suggest phenotypic similarities. (B) Visualization of the datasets by tSNE dot plots. CD4+ T cells responding to ancestral or variant spike stimulation by producing high amounts of IFNγ (right) segregate together and away from the total CD4+ T cell population (left). Each dot represents one cell. (C) CD4+ T cells responding to ancestral spike and its variants are phenotypically similar, as shown by their complete mingling on a tSNE dot plot. (D, E) Spike-responding CD4+ T cells are mostly memory cells, as indicated by high CD45RO and low CD45RA expression levels, and include those expressing high levels of Tcm, Tfh, activation, and respiratory tract migration markers. Shown is the tSNE depicted in panel C displaying the relative expression levels of the indicated antigens (Red: high; Blue: low). Heatmaps were scaled from 0 to the maximal signal in each channel. (F) CD4+ T cells responding to ancestral spike and its variants distribute in a similar fashion among the eight clusters identified by FlowSOM. Shown on the left is the distribution of T cells responding to ancestral or variant spike peptides on the tSNE depicted in panel C, colored according to the FlowSOM clustering. Shown on the right is the quantification of the FlowSOM distribution data. No significant differences were observed between the three groups in the distribution of their cells among the eight clusters, as calculated using a one-way ANOVA and adjusted for multiple testing (n = 8) using Holm-Sidak method (p > 0.05).
Figure 2—figure supplement 1
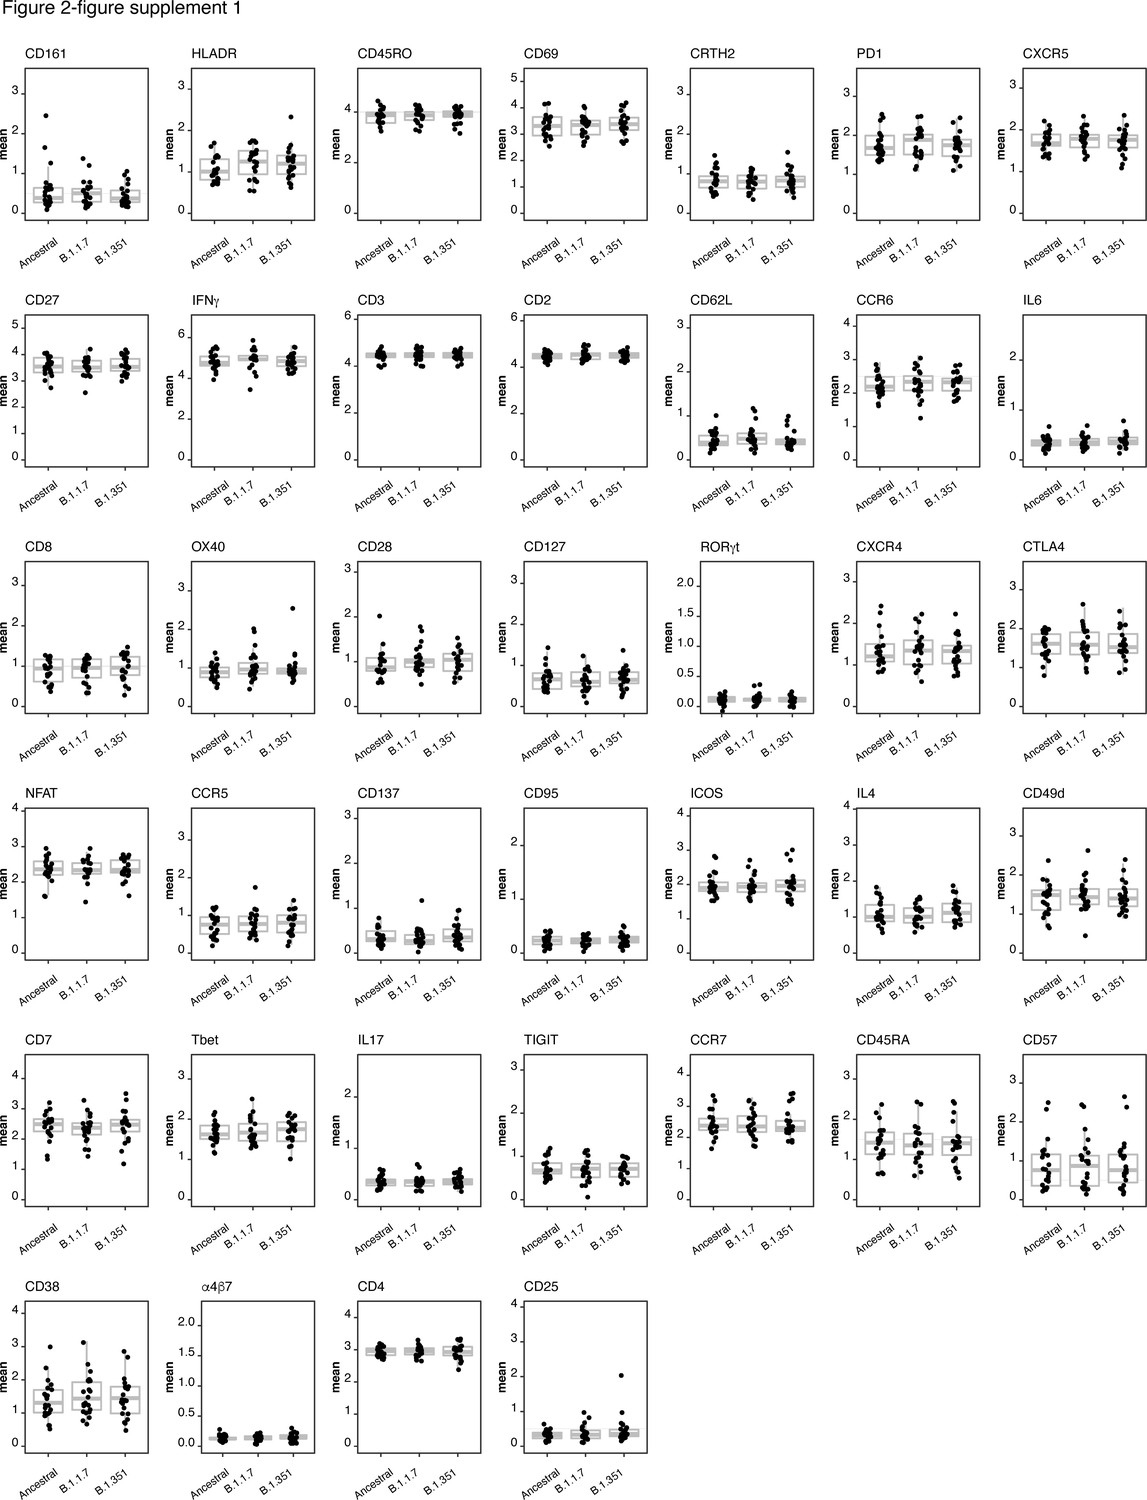
Expression levels of all CyTOF phenotyping markers are equivalent between CD4+ T cells responding to stimulation by spike from ancestral, B.1.1.7, and B.1.351 spike.
Shown are the mean expression levels of each antigen in post-vaccination spike-responding CD4+ T cells quantitated by CyTOF. Each datapoint corresponds to a single specimen. Data are presented as box plots. No significant differences were observed in expression levels for any of the antigens between any of the three groups, as assessed by one-way and ANOVA adjusted for multiple testing (n = 39) using the Holm-Sidak method (p > 0.05).
Figure 3
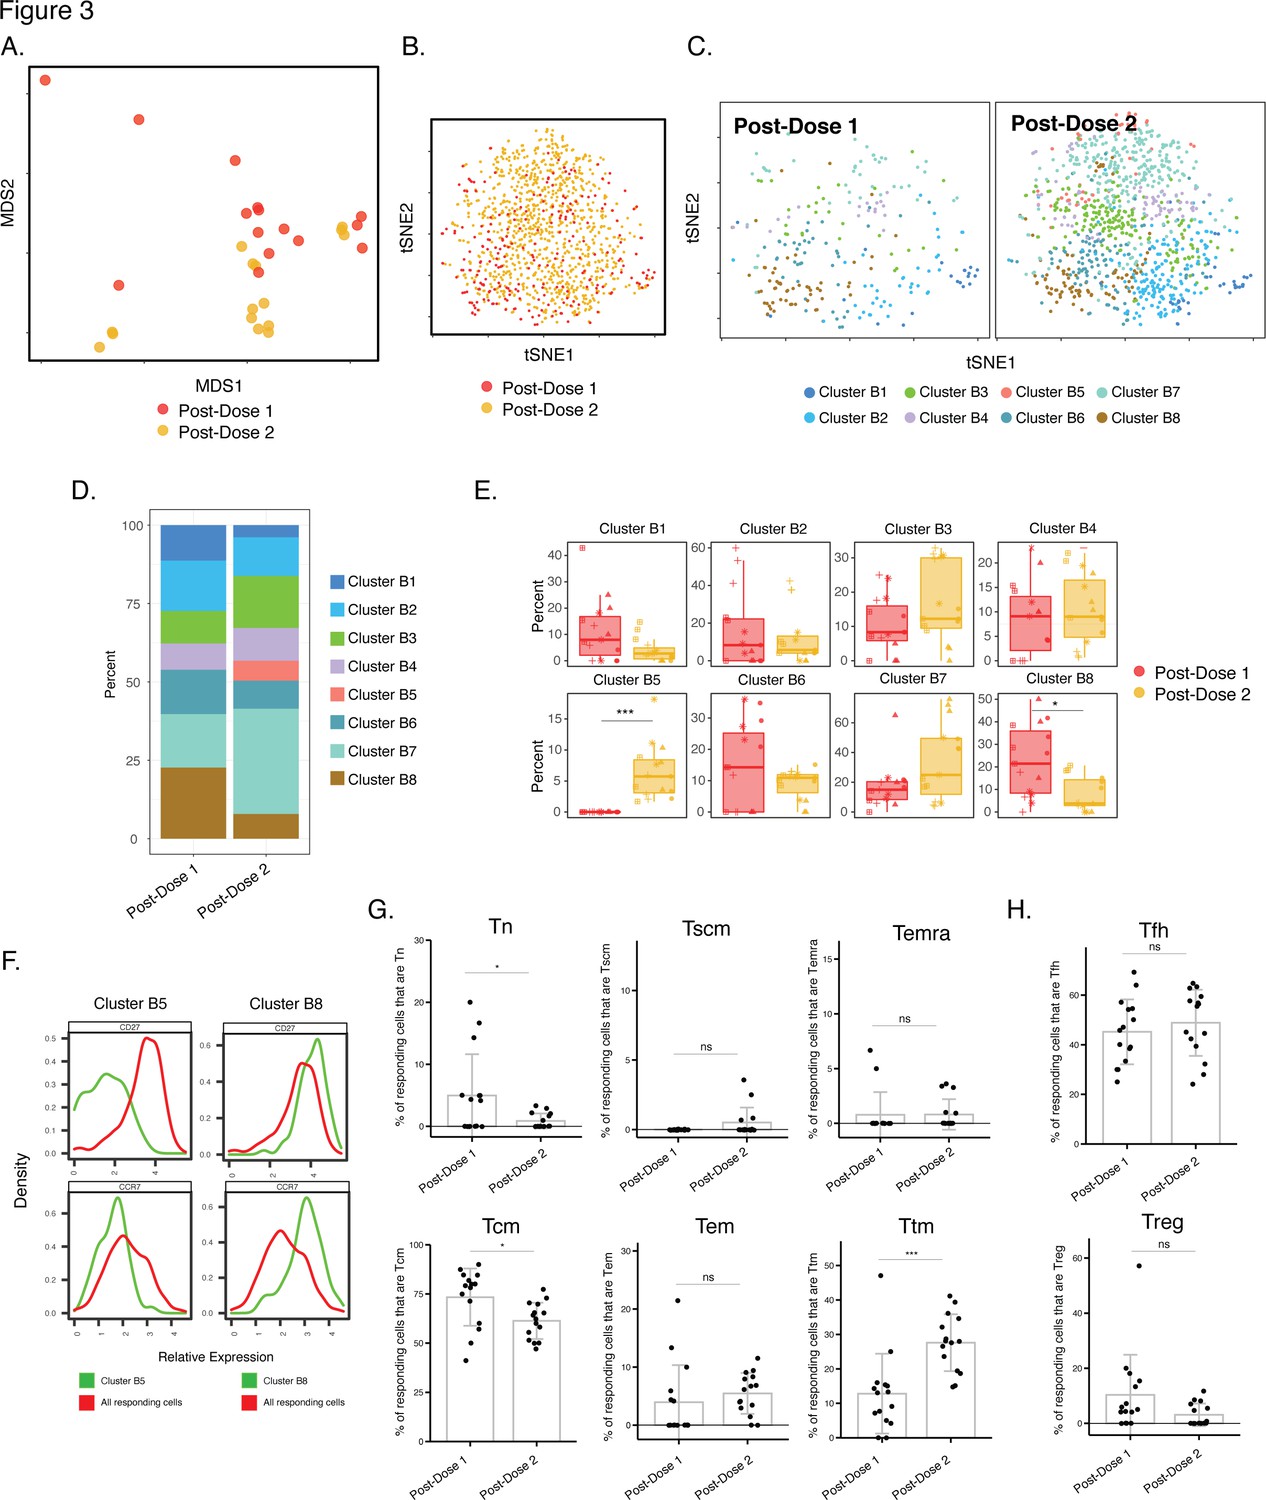
Phenotypes of spike-specific CD4+ T cells from infection-naïve individuals following first and second dose of vaccination.
(A) MDS plot depicting samples of spike-specific CD4+ T cells in vaccinated infection-naïve individuals, showing some interspersion of the cells from the two post-vaccination timepoints. Each dot represents a single specimen. (B) tSNE dot plot of spike-specific CD4+ T cells from vaccinated infection-naïve individuals. Each dot represents a single cell. (C) tSNE plots depicting cells from the two timepoints, colored according to the cells’ cluster classification as determined by FlowSOM. (D) Distribution among FlowSOM clusters of post-vaccination spike-specific CD4+ T cells from infection-naïve individuals between the two post-vaccination timepoints. (E) Two clusters of spike-specific CD4+ T cells (B5 and B8) are differentially abundant after the first vs. second vaccination doses. Data are presented as box plots. *p < 0.05, *** p < 0.001 as determined using student’s t-tests adjusted for multiple testing (n = 8) using Holm-Sidak method. (F) The Tcm markers CD27 and CCR7 are differentially expressed among Clusters B5 and B8, as depicted by histograms. (G) The proportions of Tn (CD45RO-CD45RA + CCR7+ CD95-), Tscm (CD45RO-CD45RA + CCR7+ CD95+), Temra (CD45RO-CD45RA + CCR7-), Tcm (CD45RO + CD45RA-CCR7+ CD27+), Tem (CD45RO + CD45RA-CCR7-CD27-), and Ttm (CD45RO + CD45RA-CCR7-CD27+) among spike-specific CD4+ cells in infection-naïve individuals after the first vs. second vaccination doses. *p < 0.05, ***p < 0.001, ns = non-significant as determined by student’s t-test. (H) The proportions of Tfh (CD45RO + CD45RA-PD1+ CXCR5+) and Treg (CD45RO + CD45RA-CD25+CD127low) among spike-specific CD4+ T cells are similar in infection-naïve individuals after the first vs. second vaccination doses. ns = non-significant as determined by student’s t-test. Error bars in panels G-H correspond to mean ± SD.
Figure 4 with 1 supplement
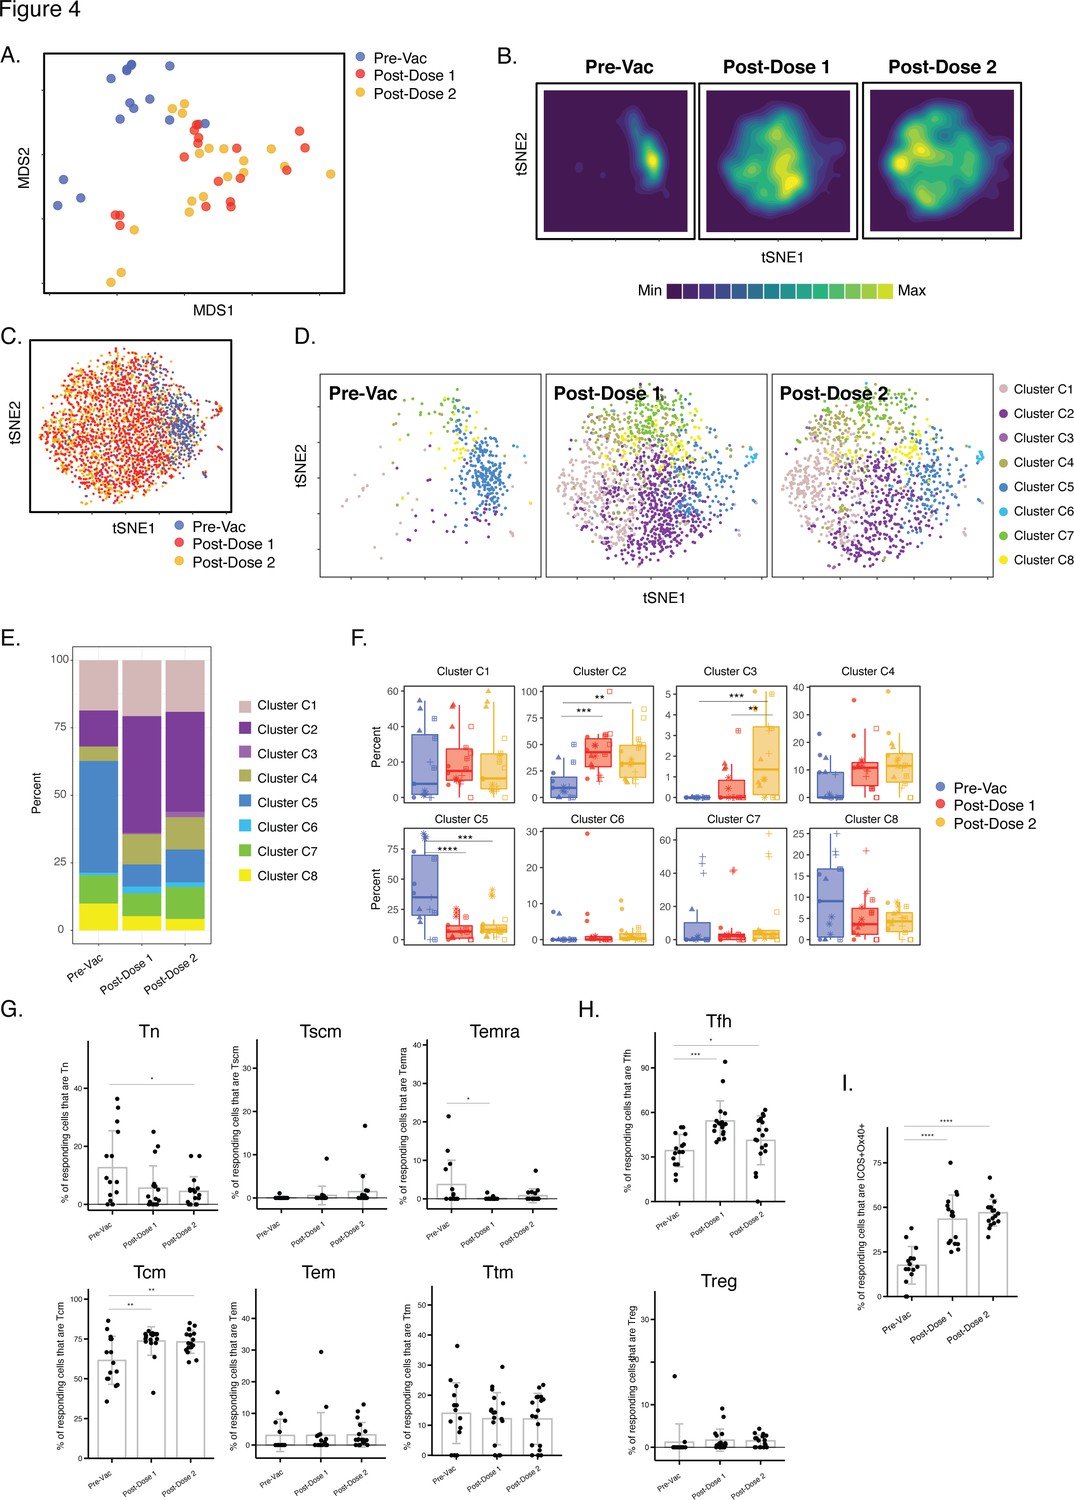
Differentiation of spike-specific memory CD4+ T cells after vaccination of convalescent individuals.
(A) MDS plot depicting datasets corresponding to spike-specific CD4+ T cells in convalescent individuals before and after vaccination. (B) tSNE contour heatmaps of spike-specific CD4+ T cells from convalescent individuals emphasizes phenotypic differences between the pre- and post-vaccination cells. Cell densities are represented by color. (C) tSNE dot plot of spike-specific CD4+ T cells from convalescent individuals, demonstrating the distinct localization of the pre-vaccination cells on the right. (D) Spike-specific CD4+ T cells are phenotypically distinct between the pre- and post-vaccination specimens. Shown are tSNE plots depicting cells from the three indicated timepoints, colored according to the cells’ cluster classification as determined by FlowSOM. (E) The distribution of spike-specific CD4+ T cells classified as FlowSOM clusters differs between the pre- and post-vaccination timepoints. (F) Multiple clusters of spike-specific CD4+ T cells are differentially abundant between the pre- and post-vaccination specimens. Data are presented as box plots. **p < 0.01, ***p < 0.001, ****p < 0.0001 as determined by one-way ANOVA and adjusted for multiple testing (n = 8) using the Holm-Sidak method followed by Tukey’s honestly significant difference (HSD) post-hoc test. (G) Spike-specific CD4+ Tcm increase in convalescent individuals after vaccination. Shown are the proportions of Tn, Tscm, Temra Tcm, Tem, and Ttm among spike-specific CD4+ cells in convalescent individuals before and after vaccination. (H) Spike-specific CD4+ Tfh increase in convalescent individuals after vaccination. Shown are the proportions of Tfh and Treg among spike-specific CD4+ T cells in convalescent individuals before and after vaccination. (I) Spike-specific CD4+ T cells expressing ICOS and Ox40 increase in convalescent individuals after vaccination. In panels G-I, *p < 0.05, **p < 0.01, ***p < 0.001, and ****p < 0.0001 as determined by one-way ANOVA followed by Tukey’s HSD post-hoc test. Error bars in panels G-I correspond to mean ± SD.
Figure 4—figure supplement 1

Antigens differentially expressed among Clusters C2 and C5, differentially represented among pre-vs. post-vaccination spike-specific CD4+ T cells from convalescent individuals.
Shown are histogram depictions of the expression levels of the indicated activation markers in Cluster C2 (A) or C5 (B) from convalescent individuals. Cluster C2 was more abundant post-vaccination, while Cluster C5 was more abundant pre-vaccination.
Figure 5 with 1 supplement
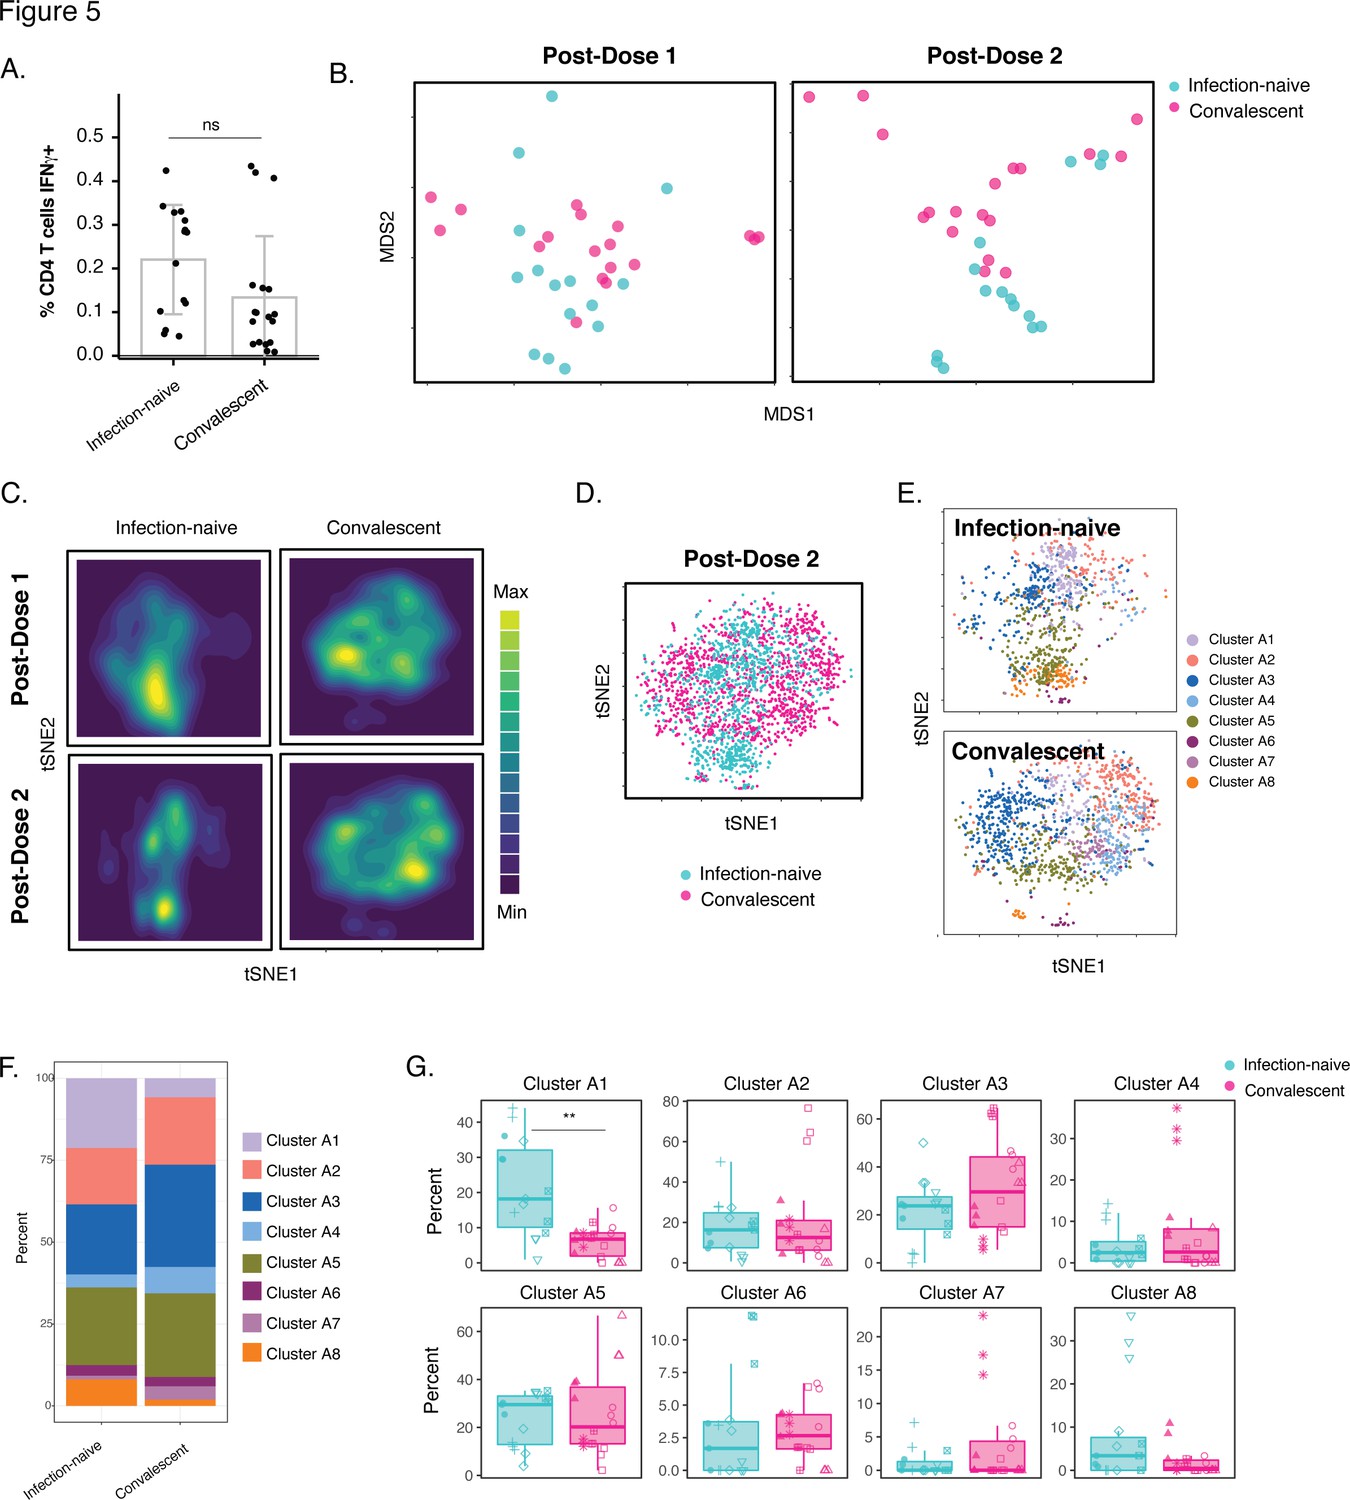
Phenotypic features of spike-specific CD4+ T cells differ between infection-naïve and convalescent individuals after vaccination.
(A) The frequency of spike-specific CD4+ T cells is similar in infection-naïve and convalescent individuals two weeks after the second vaccination dose. Note that when convalescent donor PID4112, who had an unusually high pre-vaccination frequency of spike-specific CD4+ T cells (Figure 1D), was excluded, the frequency was significantly lower among the convalescents. Error bars correspond to mean ± SD. (B) MDS plots of the phenotypes of spike-specific CD4+ T cells in infection-naïve and convalescent individuals after first and second dose vaccinations. (C) tSNE contour heatmaps of spike-specific CD4+ T cells from infection-naïve and convalescent individuals, after first and second dose vaccinations, highlighting the phenotypic differences between the two groups of patients. Cell densities are represented by color. (D) tSNE dot plot of spike-specific CD4+ T cells from infection-naïve and convalescent individuals after second dose of vaccination, demonstrating the segregation of the cells from the two groups of patients. (E) Spike-specific CD4+ T cells are phenotypically distinct between the infection-naïve and convalescent individuals. Shown are tSNE plots depicting cells after the second dose of vaccination, colored according to the cells’ cluster classification as determined by FlowSOM. (F) The distribution of spike-specific CD4+ T cells into FlowSOM clusters differs between the infection-naïve and convalescent individuals after the second vaccine dose. (G) Cluster A1 is over-represented in infection-naïve relative to convalescent individuals after the second dose of vaccination. Data are presented as box plots. **p < 0.01, as determined by student’s t-tests adjusted for multiple testing (n = 8) using the Holm-Sidak method.
Figure 5—figure supplement 1

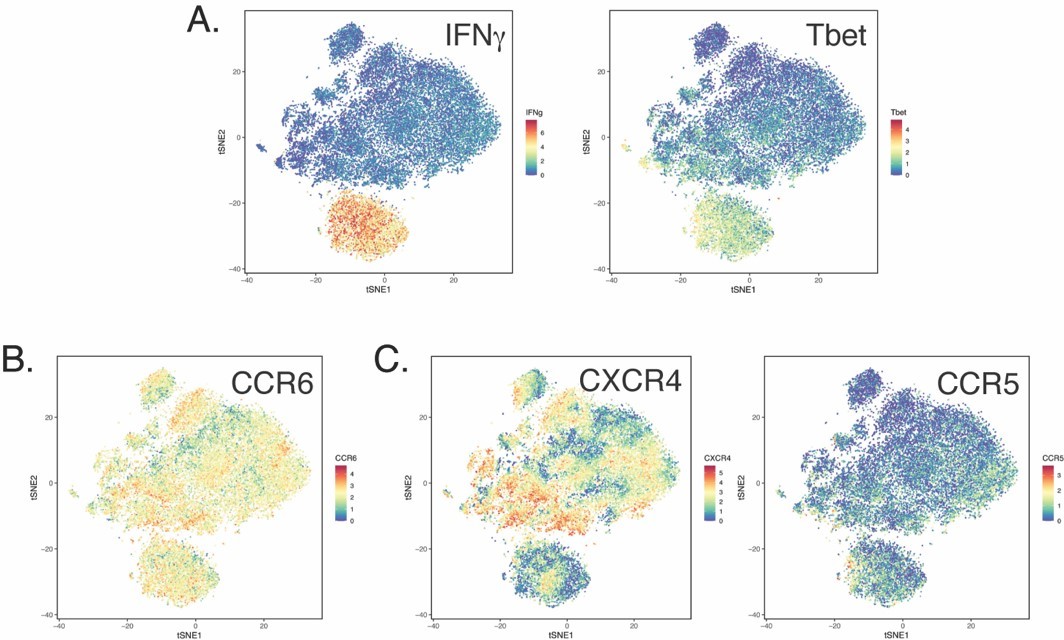
Cluster A1, enriched among spike-specific CD4+ T cells from infection-naïve relative to convalescent vaccinees, express low levels of markers of homeostatic proliferation and tissue homing.
(A) Shown are histograms of the expression levels of the alpha chain of the IL7 receptor (CD127), the chemokine receptor CXCR4, and the lymph node homing receptor CCR7, among clusters A1 or A3, the former of was enriched in infection-naïve relative to convalescent individuals after vaccination. Data were concatenated from all clustered cells. (B) Relative expression levels, as depicted by normalized mean signal intensity (MSI), of CD127, CXCR4, and CCR7 among all specimens of spike-specific CD4+ T cells from infection-naïve and convalescent individuals, after the second vaccination dose. Data are presented as box plots. *p < 0.05, **p< 0.01, ns = non-significant, as determined using student’s t-tests and corrected for multiple testing (n = 39) using the Holm-Sidak method.
Figure 6 with 1 supplement
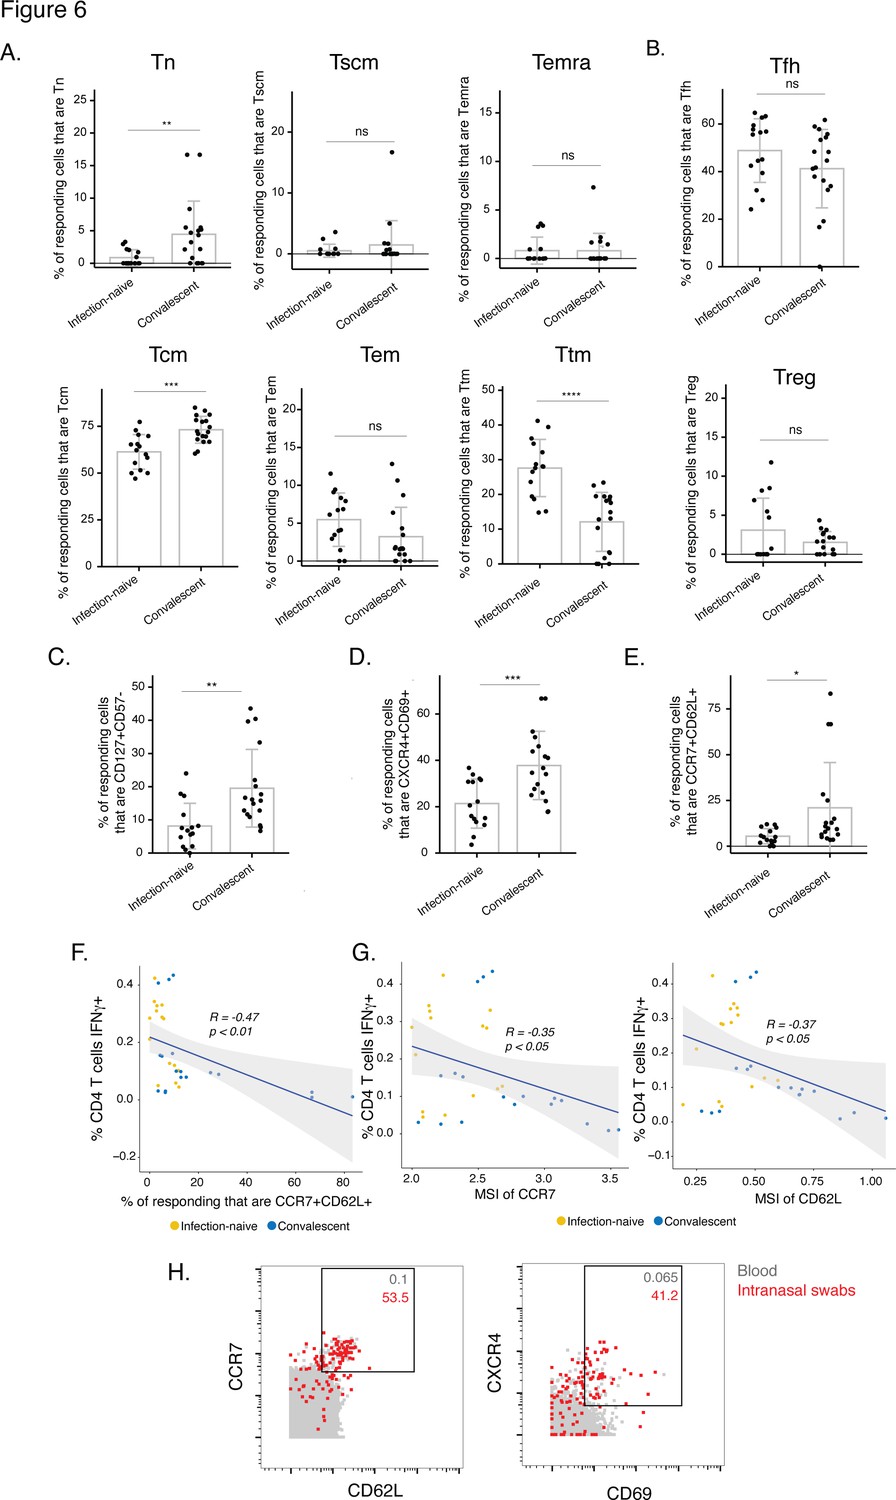
The post-vaccination spike-specific CD4+ T cells of convalescents harbor phenotypic features of elevated longevity and tissue homing.
(A) Spike-specific CD4+ T cells from convalescent vaccinated individuals harbor higher proportions of Tn and Tcm cells and lower proportions of Ttm cells than those from infection-naïve vaccinated individuals. The proportions of Tn, Tscm, Temra, Tcm, Tem, and Ttm cells among spike-specific CD4+ T cells were determined by manual gating. **p< 0.01, ***p < 0.001, ****p < 0.0001, ns = non-significant, as determined by student’s t-test. (B) The proportions of Tfh and Treg among spike-specific CD4+ T cells are similar in infection-naïve vs. convalescent individuals after vaccination. ns = non-significant, as determined by student’s t-test. (C) Spike-specific CD4+ T cells expressing the homeostatic proliferation marker CD127 and lacking expression of the terminal differentiation marker CD57 are more frequent in vaccinated convalescent than vaccinated infection-naïve individuals. **p < 0.01, as determined by student’s t-test. (D) Spike-specific CD4+ T cells expressing CXCR4, which directs cells to tissues including the lung, and CD69, a marker of T cell activation and tissue residence, are more frequent in convalescent vaccinated individuals. ***p < 0.001, as determined by student’s t-test. (E) Spike-specific CD4+ T cells expressing the lymph node homing receptors CCR7 and CD62L are more frequent in vaccinated convalescent individuals. *P < 0.05, as determined by student’s t-test. Error bars in panels A-E correspond to mean ± SD. (F) The proportions of CCR7+ CD62L + cells among spike-specific CD4+ T cells associate negatively with the frequencies of spike-specific CD4+ T cells after the second dose of vaccination (correlation coefficient (R) < 0). P-values were calculated using t distribution with n-2 degrees of freedom. (G) Expression levels (reported as mean signal intensity, or MSI) of CCR7 and CD62L among spike-specific CD4+ T cells associate negatively (R < 0) with overall frequencies of spike-specific CD4+ T cells after the second dose of vaccination. p-Values were calculated using t distribution with n-2 degrees of freedom. The 95 % confidence intervals of the regression lines in the scatter plots of panels F-G are shaded in grey. (H) CCR7+ CD62L + and CXCR4+ CD69+ CD4+ T cells are more frequent in nasopharynx than blood. Unstimulated CD4+ T cells from the blood (gray) or from an intranasal swab (red) were obtained on the same day from PID4101 and then phenotyped by CyTOF. Numbers indicate the percentages of the corresponding cell population within the gate. Results are gated on live, singlet CD3+ CD4+ CD8- cells.
Figure 6—figure supplement 1
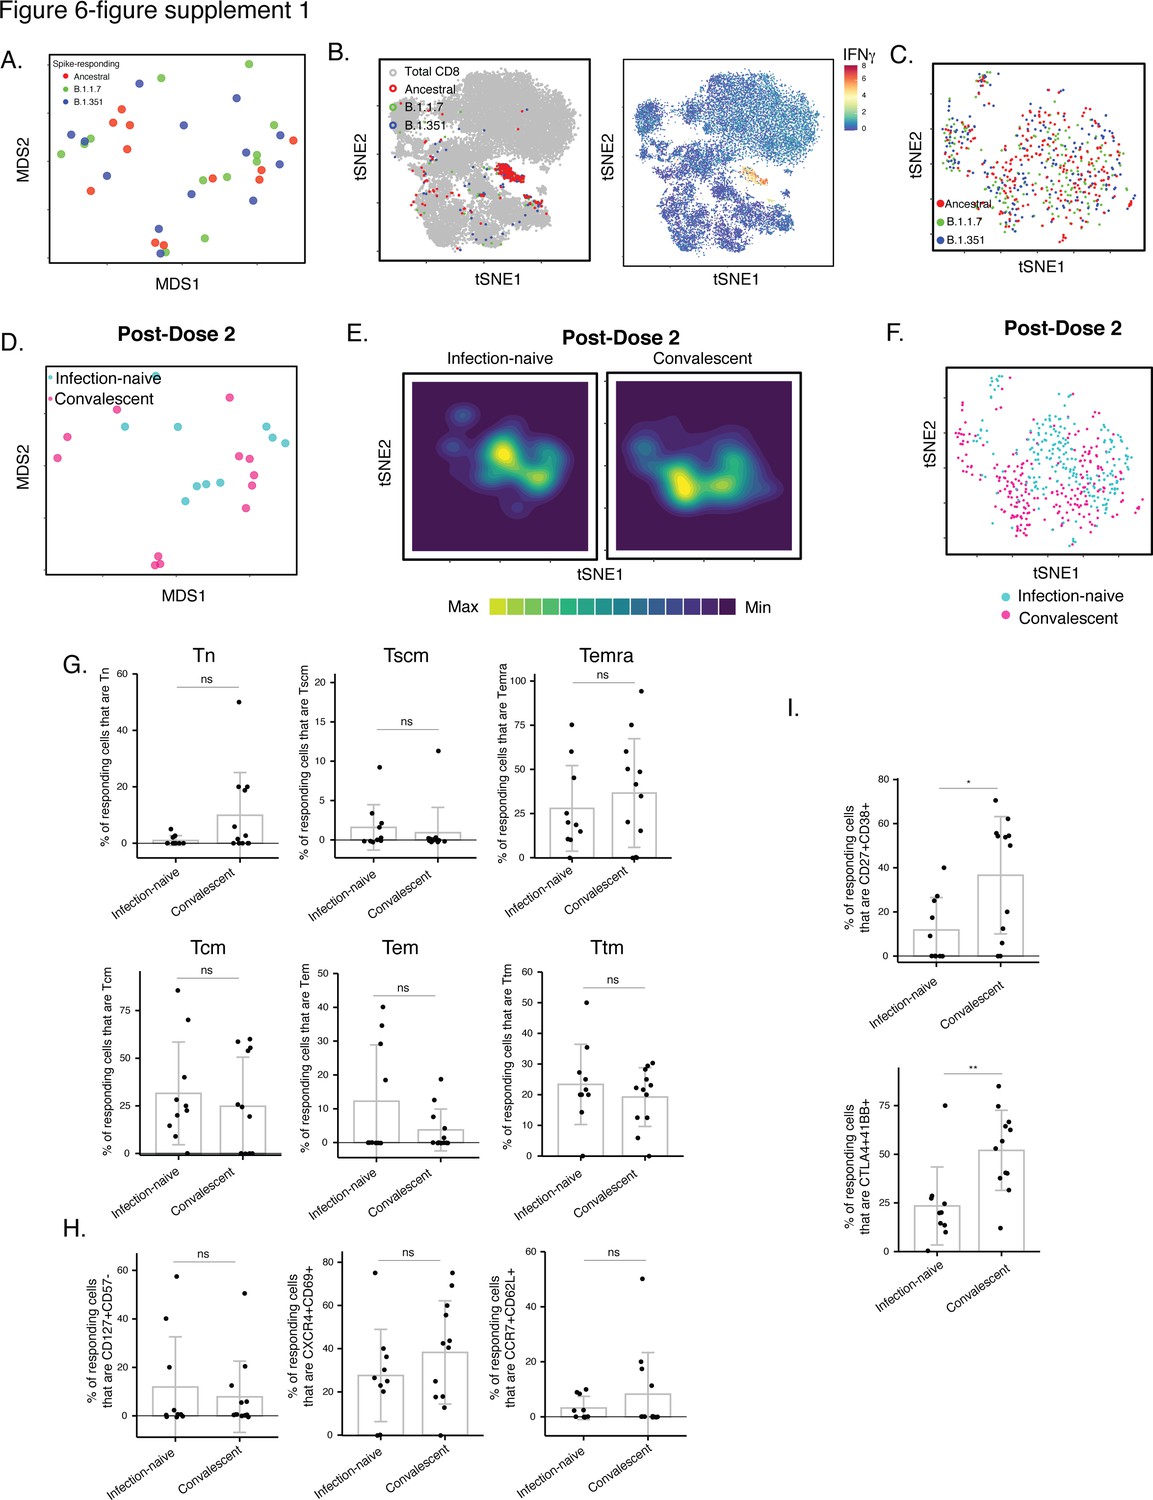
Phenotypic features of spike-specific CD8+ T cells from vaccinated, convalescent individuals are unique and differ from those of their CD4+ T cell counterparts.
(A–C) MDS (A) or tSNE (B, C) plots demonstrating phenotypic similarities between spike-specific CD8+ T cells responding to spike from the ancestral, B.1.1.7, or B.1.351 strains. Data are displayed in a format similar to that for CD4+ T cells presented in Figure 2A-C. (D) MDS plot depicting specimens of spike-specific CD8+ T cells in infection-naïve and convalescent individuals after second vaccination dose. (E) tSNE contour heatmaps depicting spike-specific CD8+ T cells from infection-naïve and convalescent individuals, after the second vaccination dose. Cell densities are represented by color. (F) tSNE dot plot of spike-specific CD8+ T cells from infection-naïve and convalescent individuals after second vaccination dose. (G) The distribution of spike-specific cells among the main canonical CD8+ T cell subsets (Tn, Tscm, Temra, Tcm, Tem, Ttm) is similar in infection-naïve vs. convalescent individuals after second vaccination dose. (H) T cell subsets that were differentially enriched in infection-naïve vs. convalescent individuals among spike-specific CD4+ T cells after second vaccination dose (Figure 6C) are not differentially enriched among spike-specific CD8+ T cells. Shown are the proportions of cells that are CD127+ CD57-, CXCR4+ CD69+, or CCR7+ CD62L+ cells among spike-specific CD8+ T cells as determined by manual gating. (I) Cells co-expressing CD27 and CD38, and CTLA4 and CD137, are elevated among spike-specific CD8+ T cells from vaccinated convalescent individuals relative to vaccinated infection-naïve individuals. *p < 0.05, **p < 0.01 as determined by student’s t-test. Error bars in panels G-I correspond to mean ± SD.
Author response image 1
Author response image 2
Tables
Table 1
Participant characteristics.
| Patient ID | Gender | Age | Prior infection status | Vaccine | Days post PCR+ test at pre-vaccination timepoint | Days post vaccine dose #1 | Days post vaccine dose #2 |
|---|---|---|---|---|---|---|---|
| PID4101 | Female | 45 | Uninfected | Pfizer/BioNT | NA | 13 | 12 |
| PID4109 | Male | 33 | Uninfected | Pfizer/BioNT | NA | 12 | 33 |
| PID4197 | Female | 76 | Uninfected | Pfizer/BioNT | NA | 14 | 13 |
| PID4198 | Male | 79 | Uninfected | Moderna | NA | 18 | 10 |
| PID4199 | Female | 32 | Uninfected | Pfizer/BioNT | NA | 14 | 10 |
| PID4104 | Female | 33 | Convalescent | Moderna | 212 | 14 | 14 |
| PID4108 | Female | 20 | Convalescent | Pfizer/BioNT | 226 | 13 | 38 |
| PID4112 | Female | 59 | Convalescent | Moderna | 254 | 16 | 13 |
| PID4114 | Female | 46 | Convalescent | Moderna | 216 | 16 | 50 |
| PID4117 | Female | 51 | Convalescent | Pfizer/BioNT | 82 | 16 | 6 |
| PID4118 | Female | 39 | Convalescent | Pfizer/BioNT | 173 | 18 | 28 |
Table 2
List of CyTOF antibodies used in study.
Antibodies were either purchased from the indicated vendor or prepared in-house using commercially available MaxPAR conjugation kits per manufacturer’s instructions (Fluidigm).
| Antigen target | Clone | Elemental isotope | Vendor |
|---|---|---|---|
| HLADR | TÜ36 | Qdot (112 Cd) | Thermofisher |
| RORγt* | AFKJS-9 | 115 In | In-house |
| CD49d (α4) | 9F10 | 141Pr | Fluidigm |
| CTLA4* | 14D3 | 142Nd | In-house |
| NFAT* | D43B1 | 143Nd | Fluidigm |
| CCR5 | NP6G4 | 144Nd | Fluidigm |
| CD137 | 4B4-1 | 145Nd | In-house |
| CD95 | BX2 | 146Nd | In-house |
| CD7 | CD76B7 | 147Sm | Fluidigm |
| ICOS | C398.4A | 148Nd | Fluidigm |
| Tbet* | 4B10 | 149Sm | In-house |
| IL4* | MP4-25D2 | 150Nd | In-house |
| CD2IL17* | TS1/8BL168 | 151Eu152Sm | FluidigmIn-house |
| CD62L | DREG56 | 153Eu | Fluidigm |
| TIGIT | MBSA43 | 154Sm | Fluidigm |
| CCR6 | 11A9 | 155Gd | In-house |
| IL6* | MQ2-13A5 | 156 Gd | In-house |
| CD8 | RPA-T8 | 157Gd | In-house |
| CD19 | HIB19 | 157Gd | In-house |
| CD14 | M5E2 | 157Gd | In-house |
| OX40 | ACT35 | 158Gd | Fluidigm |
| CCR7 | G043H7 | 159Tb | Fluidigm |
| CD28 | CD28.2 | 160Gd | Fluidigm |
| CD45RO | UCHL1 | 161Dy | In-house |
| CD69 | FN50 | 162Dy | Fluidigm |
| CRTH2 | BM16 | 163Dy | Fluidigm |
| PD-1 | EH12.1 | 164Dy | In-house |
| CD127 | A019D5 | 165Ho | Fluidigm |
| CXCR5 | RF8B2 | 166Er | In-house |
| CD27 | L128 | 167Er | Fluidigm |
| IFNγ* | B27 | 168Er | Fluidigm |
| CD45RA | HI100 | 169Tm | Fluidigm |
| CD3 | UCHT1 | 170Er | Fluidigm |
| CD57 | HNK-1 | 171Yb | In-house |
| CD38 | HIT2 | 172Yb | Fluidigm |
| α4β7 | Act1 | 173Yb | In-house |
| CD4 | SK3 | 174Yb | Fluidigm |
| CXCR4 | 12G5 | 175Lu | Fluidigm |
| CD25 | M-A251 | 176Yb | In-house |
| CD161 | NKR-P1A | 209 Bi | In-house |
-
*
Intracellular antibodies.
Key resources table
| Reagent type (species) or resource | Designation | Source or reference | Identifiers | Additional information |
| Antibody | HLADR(mouse monoclonal) | Thermofisher | Cat#Q22158 | (1 μg/100 μl) |
| Antibody | RORγt(rat monoclonal) | Fisher Scientific | Cat#5013565 | (1 μg/100 μl) |
| Antibody | CD49d (α4)(mouse monoclonal) | Fluidigm | Cat#3141004B | (1 μg/100 μl) |
| Antibody | CTLA4(mouse monoclonal) | Fisher Scientific | Cat#5012919 | (1 μg/100 μl) |
| Antibody | NFAT(rat monoclonal) | Fluidigm | Cat#3143023 A | (1 μg/100 μl) |
| Antibody | CCR5(mouse monoclonal) | Fluidigm | Cat#3144007 A | (1 μg/100 μl) |
| Antibody | CD137(mouse monoclonal) | Fisher Scientific | Cat#BDB555955 | (1 μg/100 μl) |
| Antibody | CD95(mouse monoclonal) | Fisher Scientific | Cat#MAB326100 | (1 μg/100 μl) |
| Antibody | CD7(mouse monoclonal) | Fluidigm | Cat#3147006B | (1 μg/100 μl) |
| Antibody | ICOS(hamster monoclonal) | Fluidigm | Cat#3148019B | (1 μg/100 μl) |
| Antibody | Tbet(mouse monoclonal) | Fisher Scientific | Cat#5013190 | (1 μg/100 μl) |
| Antibody | IL4(rat monoclonal) | Biolegend | Cat#500829 | (1 μg/100 μl) |
| Antibody | CD2(mouse monoclonal) | Fluidigm | Cat#3151003B | (1 μg/100 μl) |
| Antibody | IL17(mouse monoclonal) | Biolegend | Cat#512331 | (1 μg/100 μl) |
| Antibody | CD62L(mouse monoclonal) | Fluidigm | Cat#3153004B | (1 μg/100 μl) |
| Antibody | TIGIT(mouse monoclonal) | Fludigm | Cat#3154016B | (1 μg/100 μl) |
| Antibody | CCR6(mouse monoclonal) | BD Biosciences | Cat#559560 | (1 μg/100 μl) |
| Antibody | IL6(rat monoclonal) | Biolegend | Cat#501115 | (1 μg/100 μl) |
| Antibody | CD8(mouse monoclonal) | Biolegend | Cat#301053 | (1 μg/100 μl) |
| Antibody | CD19(mouse monoclonal) | Biolegend | Cat#302247 | (1 μg/100 μl) |
| Antibody | CD14(mouse monoclonal) | Biolegend | Cat#301843 | (1 μg/100 μl) |
| Antibody | OX40(mouse monoclonal) | Fluidigm | Cat#3158012B | (1 μg/100 μl) |
| Antibody | CCR7(mouse monoclonal) | Fluidigm | Cat#3159003 A | (1 μg/100 μl) |
| Antibody | CD28(mouse monoclonal) | Fluidigm | Cat#3160003B | (1 μg/100 μl) |
| Antibody | CD45RO(mouse monoclonal) | Biolegend | Cat#304239 | (1 μg/100 μl) |
| Antibody | CD69(mouse monoclonal) | Fluidigm | Cat#3162001B | (1 μg/100 μl) |
| Antibody | CRTH2(rat monoclonal) | Fluidigm | Cat#3163003B | (1 μg/100 μl) |
| Antibody | PD-1(mouse monoclonal) | Biolegend | Cat#329941 | (1 μg/100 μl) |
| Antibody | CD127(mouse monoclonal) | Fluidigm | Cat#3165008B | (1 μg/100 μl) |
| Antibody | CXCR5(rat monoclonal) | BD Biosciences | Cat#552032 | (1 μg/100 μl) |
| Antibody | CD27(mouse monoclonal) | Fluidigm | Cat#3167006B | (1 μg/100 μl) |
| Antibody | IFNγ(mouse monoclonal) | Fluidigm | Cat#3168005B | (1 μg/100 μl) |
| Antibody | CD45RA(mouse monoclonal) | Fluidigm | Cat#3169008B | (1 μg/100 μl) |
| Antibody | CD3(mouse monoclonal) | Fluidigm | Cat#3170001B | (1 μg/100 μl) |
| Antibody | CD57(mouse monoclonal) | Biolegend | Cat#359602 | (1 μg/100 μl) |
| Antibody | CD38(mouse monoclonal) | Fluidigm | Cat#3172007B | (1 μg/100 μl) |
| Antibody | CD4(mouse monoclonal) | Fluidigm | Cat#3174004B | (1 μg/100 μl) |
| Antibody | CXCR4(mouse monoclonal) | Fluidigm | Cat#3175001B | (1 μg/100 μl) |
| Antibody | CD25(mouse monoclonal) | Biolegend | Cat#356102 | (1 μg/100 μl) |
Additional files
Download links
A two-part list of links to download the article, or parts of the article, in various formats.
Downloads (link to download the article as PDF)
Open citations (links to open the citations from this article in various online reference manager services)
Cite this article (links to download the citations from this article in formats compatible with various reference manager tools)
mRNA vaccine-induced T cells respond identically to SARS-CoV-2 variants of concern but differ in longevity and homing properties depending on prior infection status
eLife 10:e72619.
https://doi.org/10.7554/eLife.72619


