Cdc6 is sequentially regulated by PP2A-Cdc55, Cdc14, and Sic1 for origin licensing in S. cerevisiae
- The PhD Program in Biochemistry, The Graduate Center, CUNY, United States
- Brooklyn College, United States
- University of Tartu, Estonia
- The Francis Crick Institute, United Kingdom
- Memorial Sloan-Kettering Cancer Center, United States
Figures
Figure 1
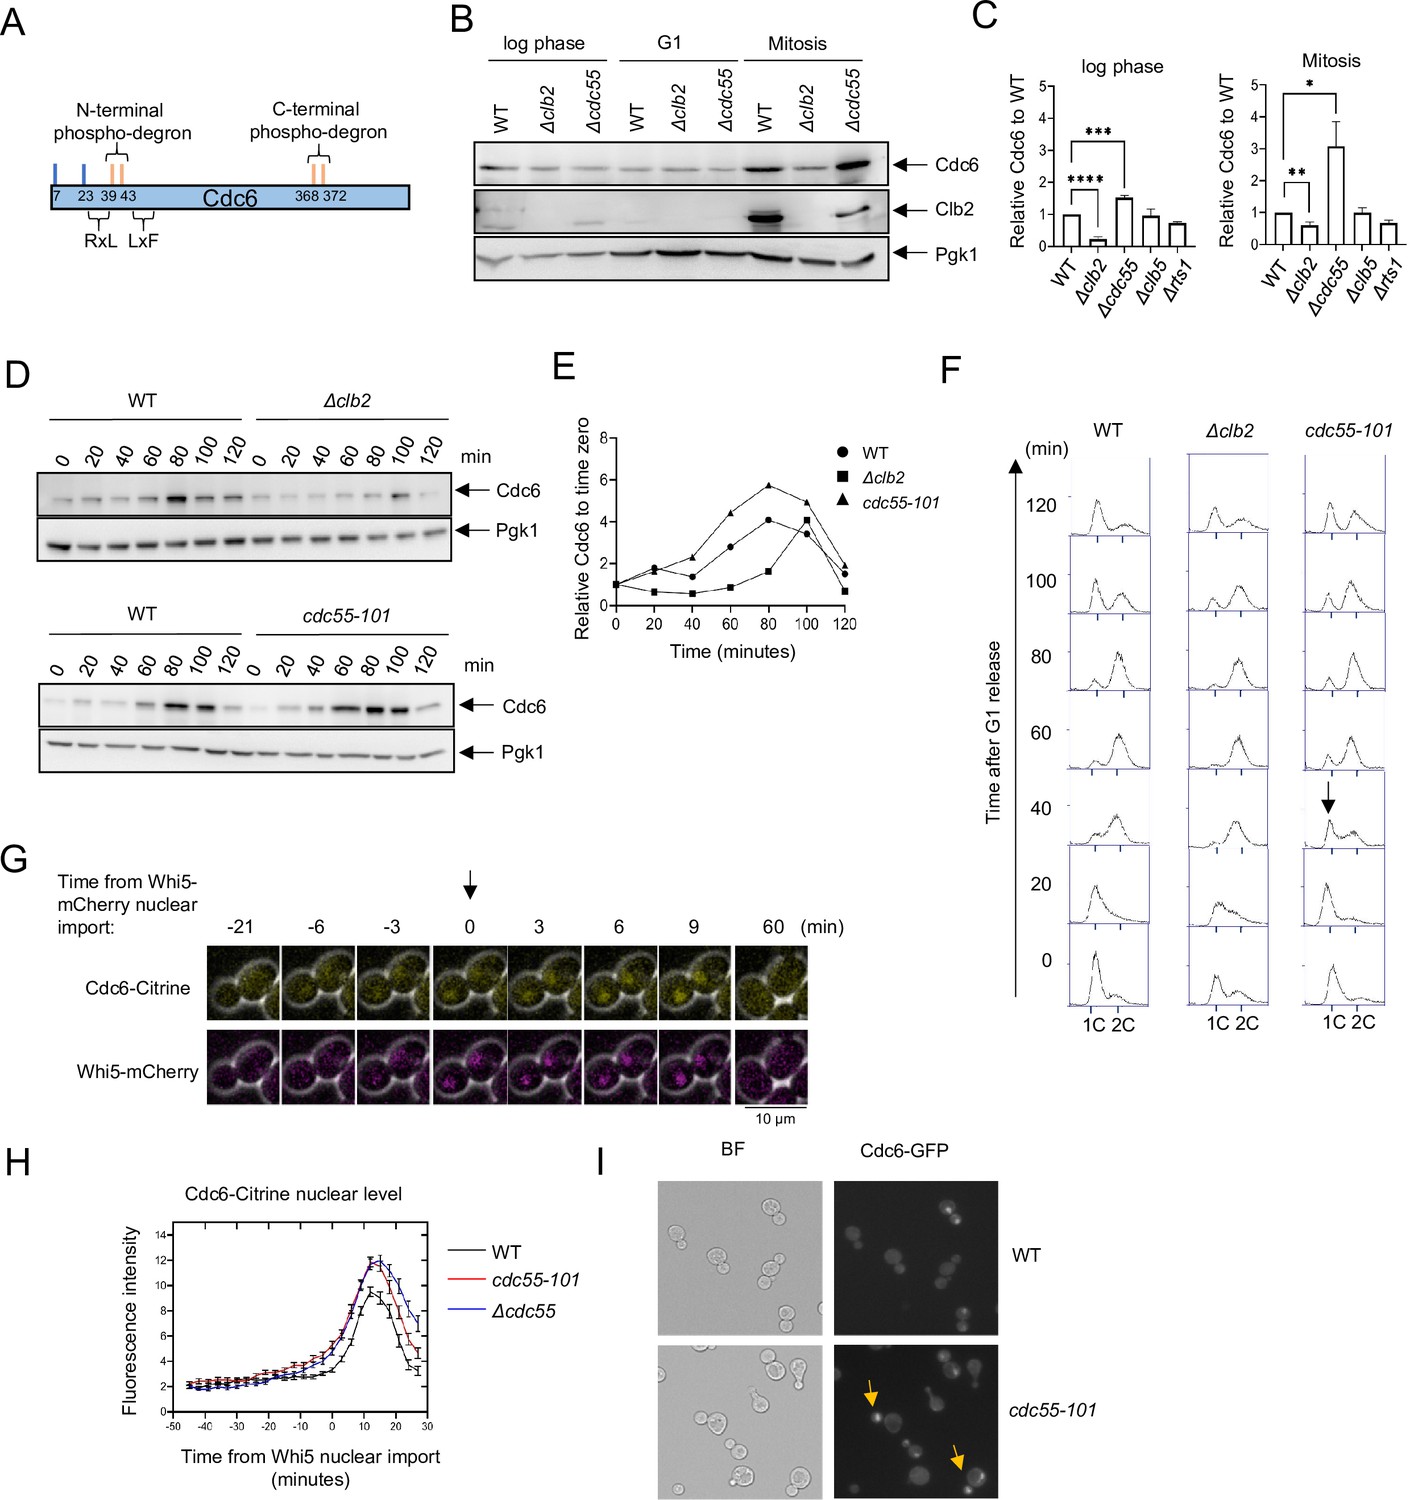
Cdc6 is more stabilized in Δcdc55 cells than in Δclb2.
(A) Cdc6 contains six functional Cdk1 phosphorylation sites including N- and C-terminal phospho-degrons at T39-S43 and S368-T372, respectively (orange bars). RxL and LxF motifs mediate cyclin interaction. (B) CDC6-9MYC (WT), CDC6-9MYC Δclb2 (Δclb2), or CDC6-9MYC Δcdc55 (Δcdc55) cells were incubated to log phase, or arrested in G1 by α-factor or mitosis by nocodazole. Protein was extracted and subjected to western blot analysis to visualize Cdc6-9MYC and Clb2. Pgk1 was used as a loading control. (C) Cdc6 protein levels from A were quantified and normalized to WT. Three independent biological replicates were performed. The average of relative Cdc6 band intensity compared to WT is shown. Error bars are standard error of the mean (SEM; n = 3; log phase Δclb2 ****p < 0.0001, Δcdc55 ***p = 0.0006, Mitosis Δclb2 **p = 0.0075, Δcdc55 *p = 0.0351 was calculated by unpaired Student’s t-test). (D) CDC6-PrA (WT), CDC6-PrA Δclb2 (Δclb2), and CDC6-PrA cdc55-101 (cdc55-101) were synchronized in G1 phase by α-factor and released. Samples were collected at indicated times. Cdc6-PrA was visualized by western blotting analysis. Pgk1 was used as a loading control. (E) The relative Cdc6 band intensity to time 0 from C is shown. (F) Samples from C were fixed and stained with propidium iodide (PI) to show cell cycle profile by flow cytometry. x-Axis is PI and y-axis is cell number. Arrow indicates S-phase entry delay. (G) CDC6-Citrine WHI5-mCherry cells were imaged by time-lapse microscopy. Time 0 was set when Whi5-mCherry is imported to the nucleus. Arrow marks Whi5 nuclear entry in late mitosis. (H) CDC6-Citrine (WT), CDC6-Citrine cdc55-101 (cdc55-101), or CDC6-Citrine Δcdc55 (Δcdc55) with Whi5-mCherry were imaged by time-lapse microscopy. Shown is the average Cdc6-Citrine fluorescence intensities of 100 cells per time point. Error bars are SEM (n = 100). (I) CDC6-GFP (WT) or CDC6-GFP cdc55-101 (cdc55-101) cells were grown to log phase and imaged using a fluorescence microscope.
Figure 2 with 1 supplement

Cdc6 and Clb2 are more tightly bound in Δcdc55 cells.
(A) CDC6-PrA (WT), CDC6-T368A-PrA, or Δclb2 CDC6-T368A-PrA cells were incubated to log phase or arrested in mitosis by nocodazole. Protein extracts were subjected to western blot analysis to visualize Cdc6-PrA. Pgk1 was used as a loading control. (B) Cdc6 protein levels in A were quantified and normalized to WT. Three independent biological replicates were performed. An average of the relative Cdc6 band intensity is shown. Error bars are standard error of the mean (SEM; n = 3; Δclb2 CDC6-T368A-PrA *p = 0.0442 was calculated using unpaired Student’s t-test). (C) Δclb2 strain was crossed with CDC6-T39A-T368A and tetrad analysis was performed. The genotype for each haploid progeny is shown. + is wild type and m is mutant. Top letter is for Δclb2 and bottom letter is for CDC6-T39A-T368A. (D) CDC6-9MYC (WT) or CDC6-9MYC Δcdc55 (Δcdc55) cells were arrested in mitosis by nocodazole. Samples were collected and protein was extracted (INPUT). Cdc6-9MYC was pulled down by anti-MYC agarose beads. Supernatant (Sup) or pull-down samples (IP) were analyzed by western blot to visualize Cdc6-9MYC and Clb2. Pgk1 was used as a loading control. (E) Band intensities from E were quantified. Cdc6 and Clb2 levels in Δcdc55 were normalized to those in WT. Three independent biological replicates of the experiment in E were performed. An average of the relative Cdc6 and Clb2 band intensities are shown. The ratio between Clb2 to Cdc6 was obtained and normalized to WT. Error bars are SEM (n = 3; Cdc6 Δcdc55 *p = 0.0205, Clb2 Δcdc55 ***p = 0.0003, and Clb2:Cdc6 Δcdc55 ****p = 0.0001 were calculated using unpaired Student’s t-test).
Figure 2—figure supplement 1
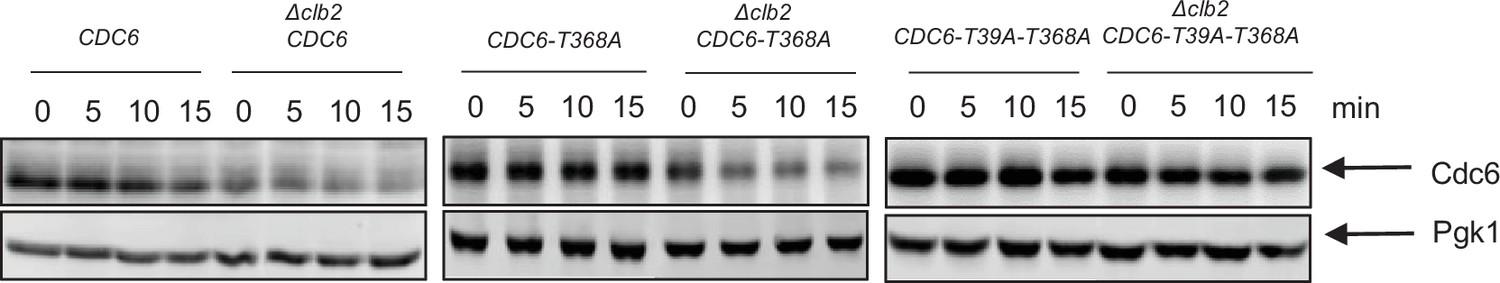
Cdc6 suppression in Δclb2 is through Cdc6 N-terminal phospho-degron.
GAL-CDC6-PrA (CDC6), GAL-CDC6-T368A-PrA (CDC6-T368A), GAL-CDC6-T39A-T368A-PrA (CDC6-T39A-T368A), Δclb2 GAL-CDC6-PrA (Δclb2 GAL-CDC6), Δclb2 GAL-CDC6-T368A-PrA (Δclb2 GAL-CDC6-T368A), and Δclb2 GAL-CDC6-T39A-T368A-PrA (Δclb2 GAL-CDC6-T39A-T368A) cells were in blocked in mitosis by nocodazole. Galactose was added to induce Cdc6 overexpression over 15 min. Protein was extracted and subjected to western blot analysis to visualize Cdc6-PrA. Pgk1 was used as a loading control.
Figure 3 with 2 supplements
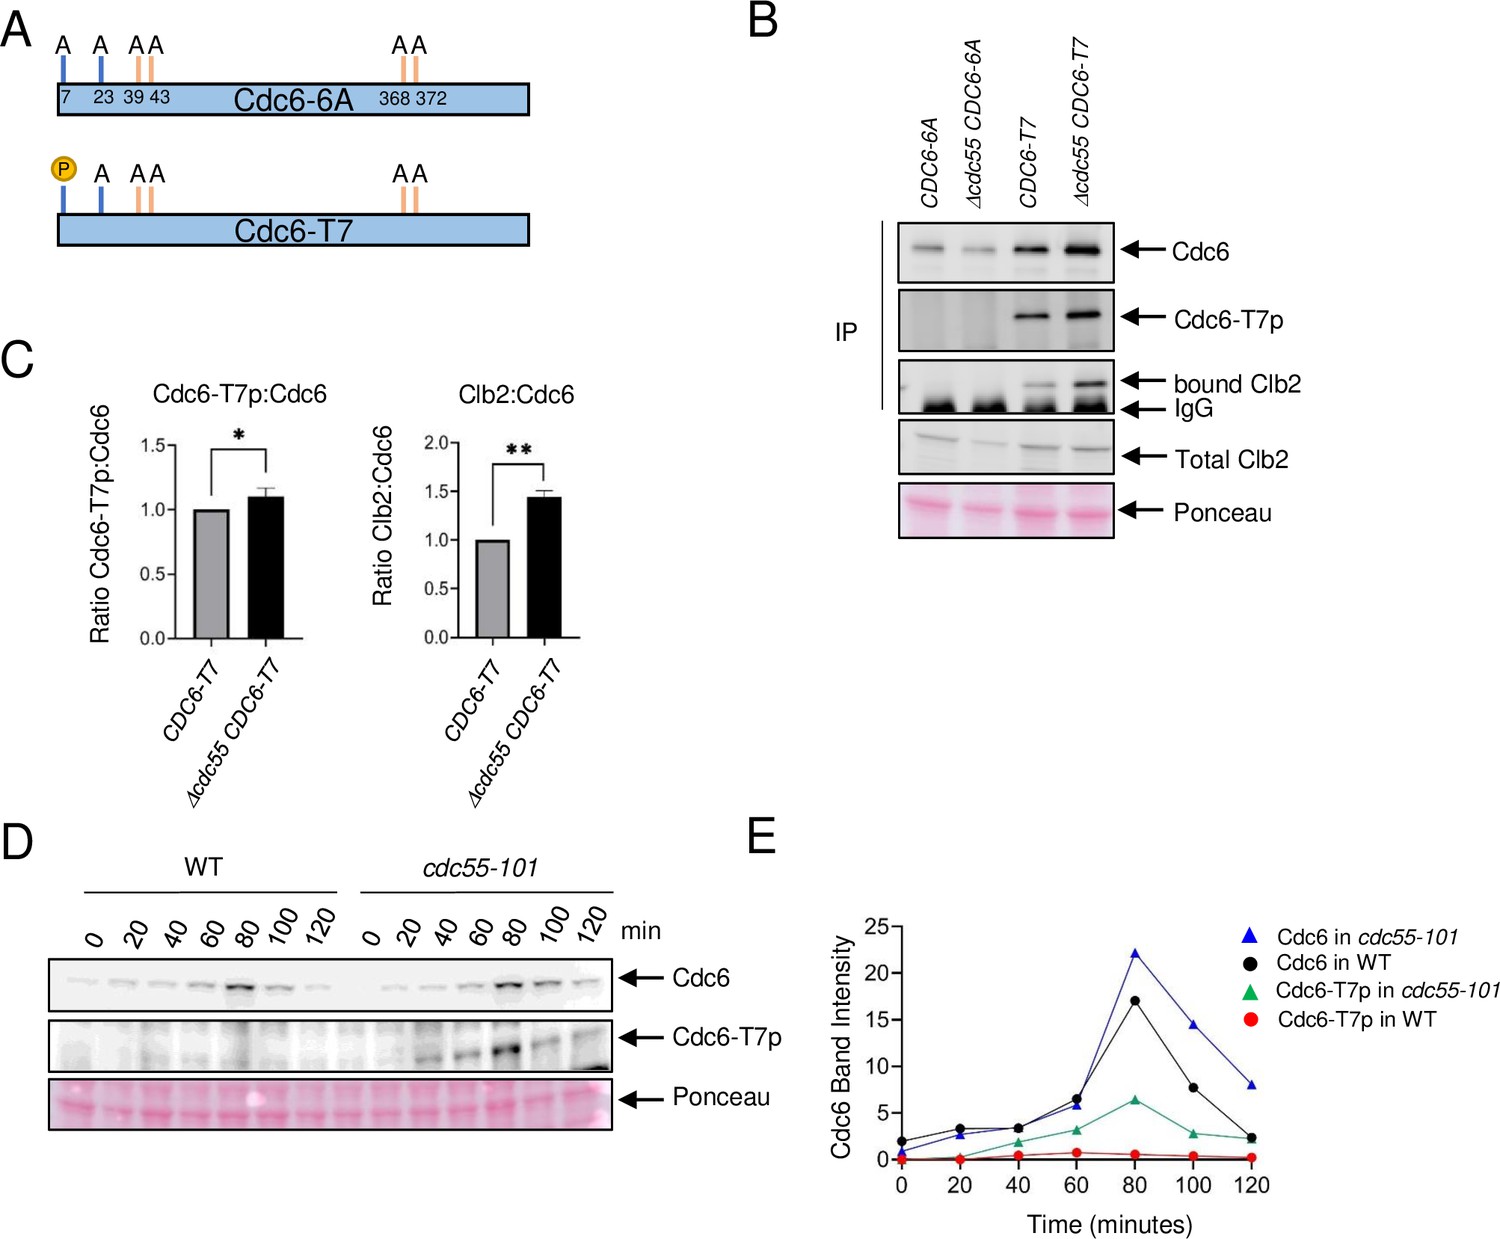
Cdc6-T7 is hyperphosphorylated in Δcdc55 cells.
(A) A schematic of Cdc6 phosphorylation mutants is shown. Alanine mutations are indicated as A with amino acid positions. P indicates CDK sites accessible for phosphorylation. (B) The indicated Cdc6 mutants were immunoprecipitated using anti-MYC agarose beads. A total Cdc6 and Cdc6-T7 phosphorylation were analyzed by western blot with anti-MYC and Cdc6-T7p antibodies, respectively. Clb2 was detected by anti-Clb2. (C) Bands from B were quantified and the ratio between Cdc6-T7p:Cdc6 and Clb2:Cdc6 are shown. Error bars are standard error of the mean (SEM; n = 3; Cdc6-T7p:Cdc6 *p = 0.0468 and Clb2:Cdc6 **p = 0.0034 were calculated using unpaired Student’s t-test). (D) CDC6-9MYC (WT) or CDC6-9MYC cdc55-101 (cdc55-101) cells were arrested in G1 by α-factor and released. Cdc6 was visualized by anti-MYC antibody. Cdc6-T7 phosphorylation was detected by T7p phospho-specific antibody. (E) Band intensities from D were quantified.
Figure 3—figure supplement 1

Cdc6-6A is not targeted by SCFCdc4.
cdc4-1 CDC6-9MYC (cdc4-1 CDC6), cdc4-1 CDC6-T7A-T23A-T39A-S43A-T368A-S372A-13MYC (cdc4-1 CDC6-6A), and cdc4-1 CDC6-T23A-T39A-S43A-T368A-S372A-13MYC (cdc4-1 CDC6-T7) cells were in blocked in mitosis by nocodazole at permissive temperature 23°C. Cells were transferred to 37°C, then samples were collected at the indicated time points. Protein was extracted and subjected to western blot analysis to visualize Cdc6-MYC.
Figure 3—figure supplement 2
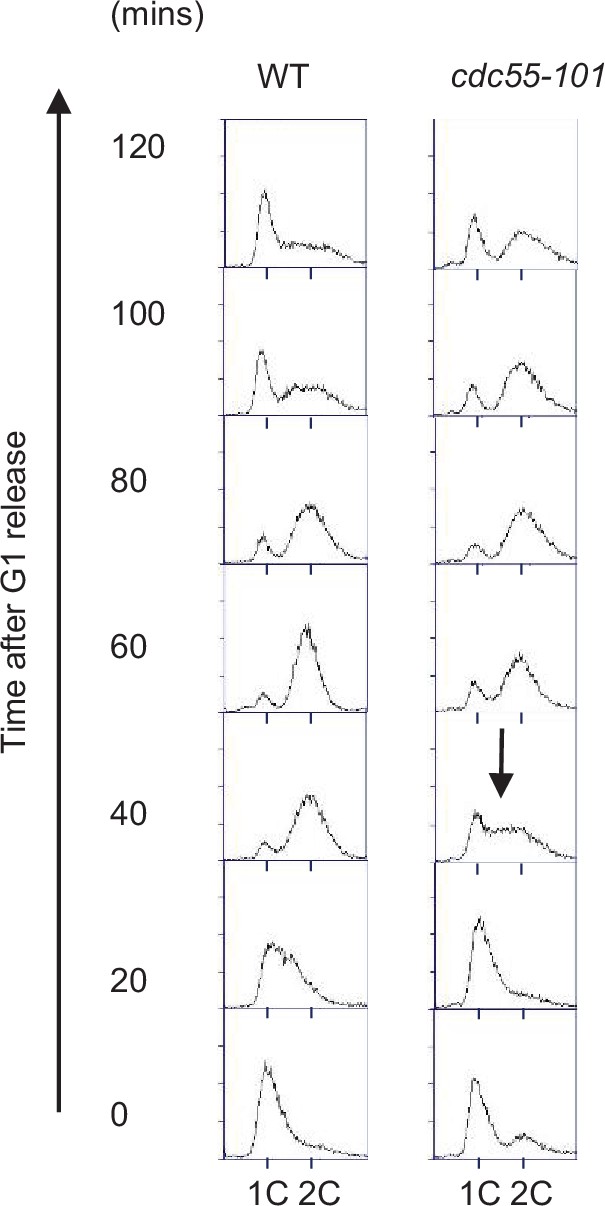
WT and cdc55-101 cells progress through the cell cycle.
Samples from Figure 3D were fixed and stained with propidium iodide (PI) to show cell cycle profile by flow cytometry. x-Axis is PI and y-axis is cell number. Arrow indicates S-phase entry delay.
Figure 4 with 2 supplements

PP2A and Cdc14 dephosphorylate Cdc6-T7, -T23, and T368-S372, respectively.
Full-length Cdc6 (A), Cdc6-T23A-T39A-S43A-T368A-S372A (Cdc6-T7) (B), Cdc6-T7A-T39A-S43A-T368A-S372A (Cdc6-T23) (C), and Cdc6-T7A-T23A-T39A-S43A (Cdc6-T368-S372) (D) were phosphorylated for 60 min at room temperature using purified Clb5–Cdk1 in the presence of [γ-32P]-ATP. At time 0, Sic1 and phosphatase Cdc14 or PP2ACdc55 were added to the reactions to inhibit Clb5–Cdk1. A time course was taken, and samples were measured for dephosphorylation. N-Swe1 was used as a positive control for PP2ACdc55 (E), and Csa1 for Cdc14 (F). The samples were loaded on sodium dodecyl sulfate–polyacrylamide gel electrophoresis (SDS–PAGE) and following electrophoresis, the gels were stained using Coomassie Brilliant Blue. Signals were quantified using ImageQuant TL. Three independent biological replicates of the phosphatase assays were performed. Error bars are standard error of the mean (SEM; n = 3).
Figure 4—figure supplement 1
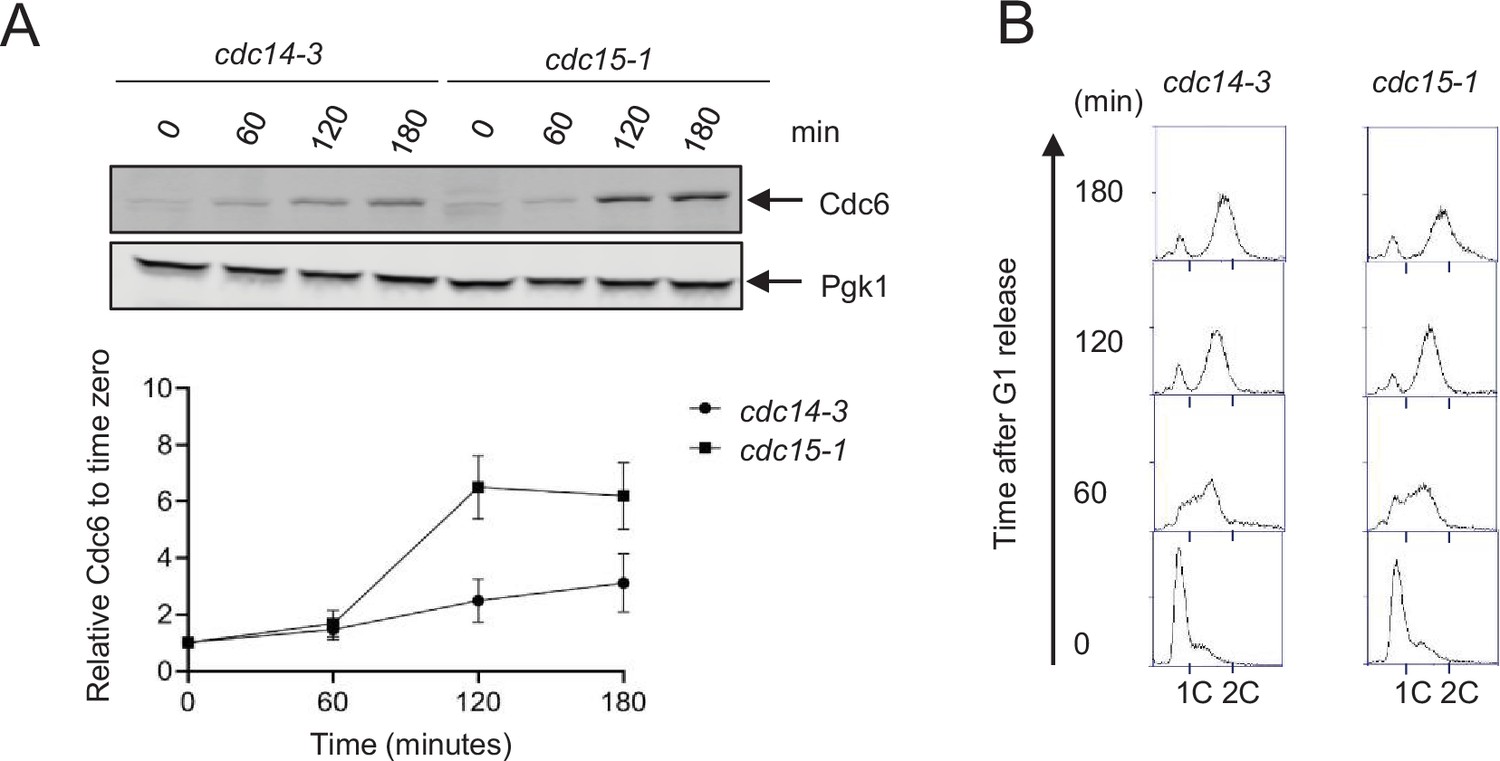
Cdc6 is unstable in cdc14-3 mutant.
(A) CDC6-9MYC cdc14-3 (cdc14-3) or CDC6-9MYC cdc15-1 (cdc15-1) cells were synchronized in G1 phase by α-factor first. The cell cycle was released and samples were collected every 60 min up to 180 min at 37°. Western blot analysis was performed to visualize Cdc6-MYC. Pgk1 was used as a loading control. The relative Cdc6 band intensity to time 0 from is shown. Error bars are standard error of the mean (SEM; n = 3). (B) Samples from A were fixed and stained with propidium iodide (PI) to show cell cycle profiles by flow cytometry.
Figure 4—figure supplement 2
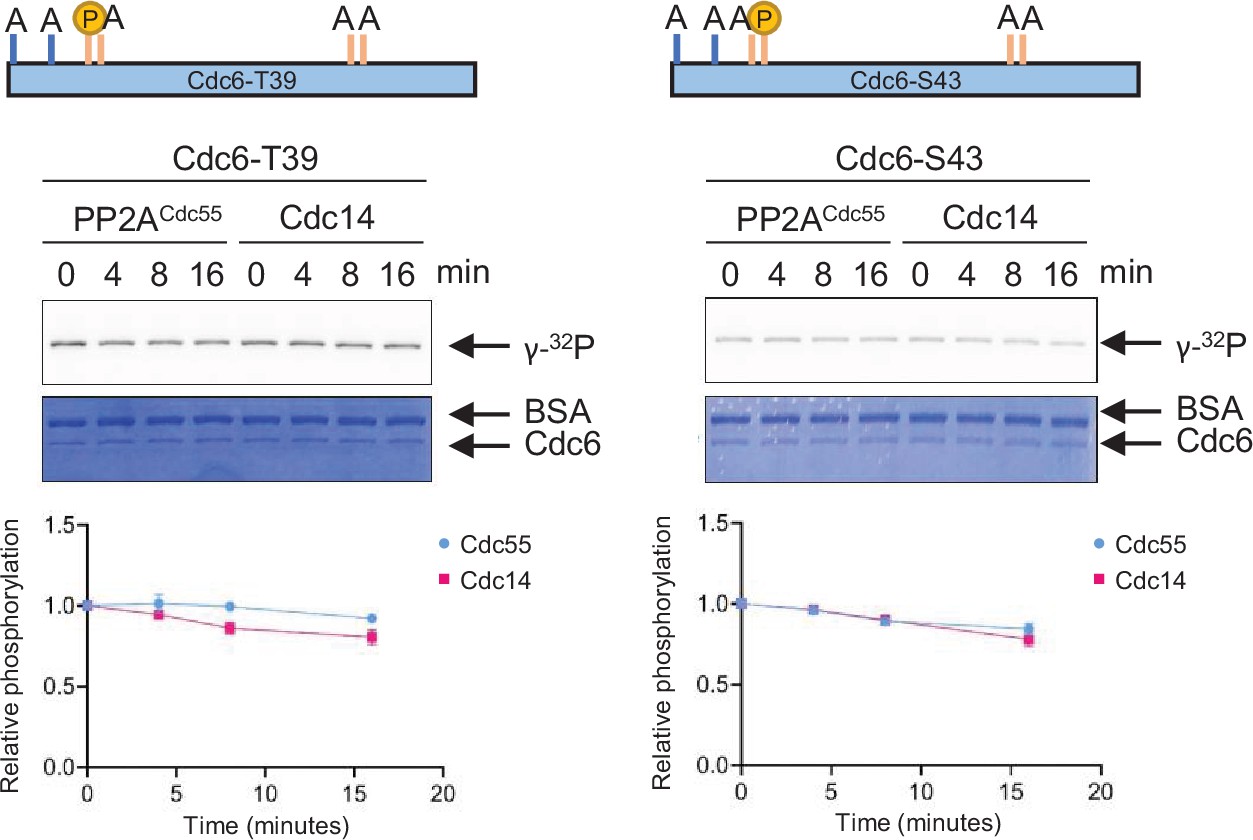
PP2A and Cdc14 do not target Cdc6-T39 and S43.
Cdc6-T7A-T23A-S43A-T368A-S372A (Cdc6-T39) or Cdc6-T7A-T23A-T39A-T368A-S372A (Cdc6-S43) was phosphorylated by purified Clb5–Cdk1 in the presence of [γ-32P]-ATP. Phosphatase activity of Cdc14 or PP2ACdc55 toward these proteins was measured as described in Figure 4.
Figure 5
Sic1 promotes origin licensing by releasing Clb2–CDK from Cdc6.
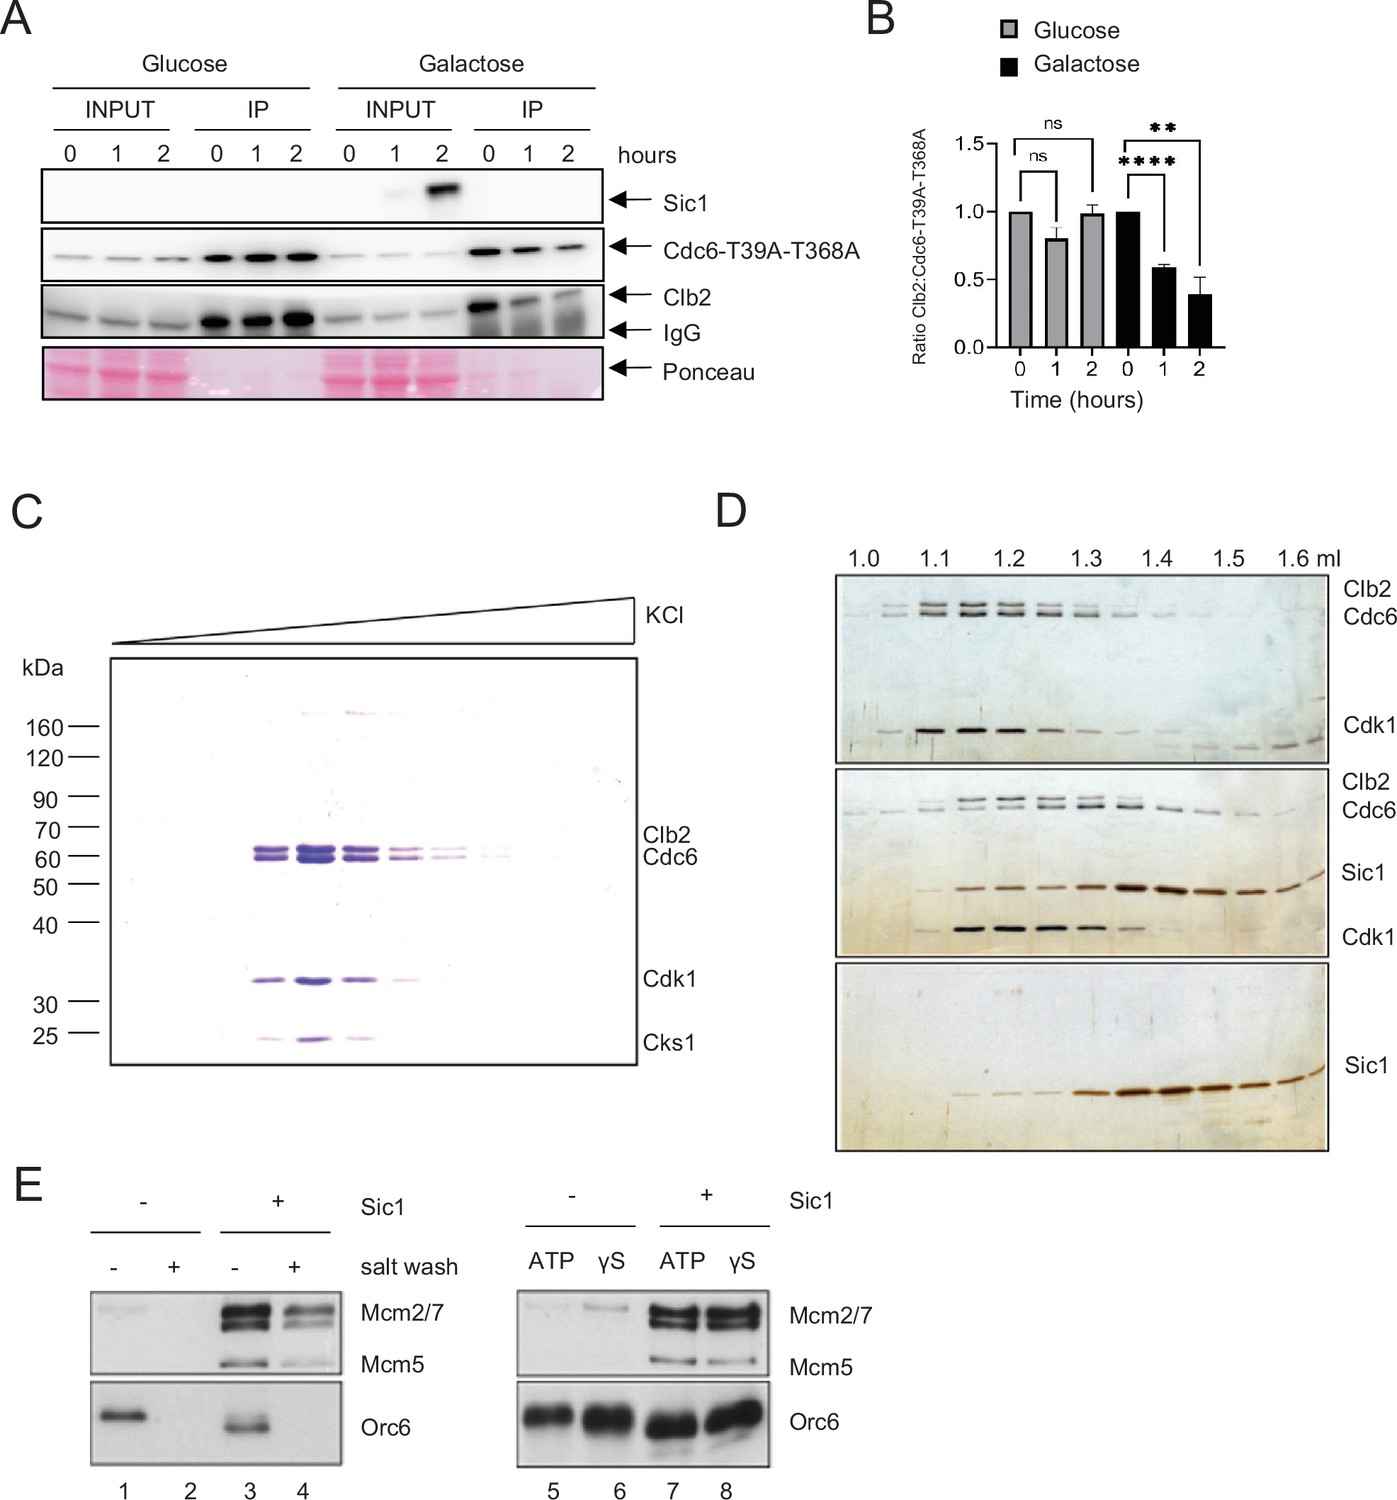
(A) GAL-SIC1-HA CDC6-T39A-T368A-PrA Δcdh1 cells were arrested in mitosis by nocodazole for 2 hr before the addition of glucose or galactose. Samples were collected at the indicated time points and protein extracted (INPUT). Cdc6-T39A-T368A-PrA pulled down by anti-IgG Dynabeads was analyzed by western blot to visualize Sic1, Cdc6-T39A-T368A, and Clb2. (B) Clb2:Cdc6-T39A-T368A IP ratio relative to time 0 from A is shown. Error bars are standard error of the mean (SEM; n = 3; Glucose p = 0.8414, p = 0.0729, ns, not significant; Galactose ****p < 0.0001, **p = 0.0090 was calculated using unpaired Student’s t-test). (C) Cdc6 was expressed and purified from M-phase cell extracts. The elution profile of the Cdc6·Clb2·Cdk1·Cks1 complex after ion-exchange chromatography is shown. (D) Purified Cdc6·Clb2·CDK complex and Sic1 were analyzed by gel filtration. Fractions were analyzed by sodium dodecyl sulfate–polyacrylamide gel electrophoresis (SDS–PAGE) and silver staining. Elution positions are indicated on the top. Gel positions of indicated proteins are located on the right. (E) Mcm2-7 loading assays with purified ORC, Cdc6·Clb2·Cdk1·Cks1, Cdt1·Mcm2–7, and Sic1 on origin DNA immobilized on paramagnetic beads. Loading was performed in the presence or absence of Sic1 and the presence of either a salt wash (left) or ATP and ATP analog, ATPγS (γS) (right).
Figure 6 with 1 supplement

Predicted Cdc6–Clb2 structure by bioinformatics.
(A) Disordered regions were mapped using ANCHOR2 and IUPred2 software. (B) A full-length Cdc6 protein structure composed of 513 amino acids was predicted based on the amino acid sequence and known structure information (cyan and orange on the right). N-terminal highly disordered region spans in 1–59 residues (orange box and highlighted on the left). T7 is in red, T23 is in green, RxL motif is in black, and LxF motif in purple. N-terminal phospho-degron is located at T39-S43 and C-terminal phospho-degron is at T368-S372. (C) Cdc6–Clb2-binding structure with Cdc6 IDR (orange), Cdc6 LQF motif (purple), Cdc6 N-terminal phospho-degron (blue), Cdc6 C-terminal phospho-degron (pink), Clb2 D-box (yellow), Clb2 KEN Box (light blue), and Clb2 hydrophobic patch (green). (D) Cdc6–Clb2 interaction through Cdc6 E45 (purple) and Clb2 K270 (green). Red bar shows salt bridge.
Figure 6—figure supplement 1
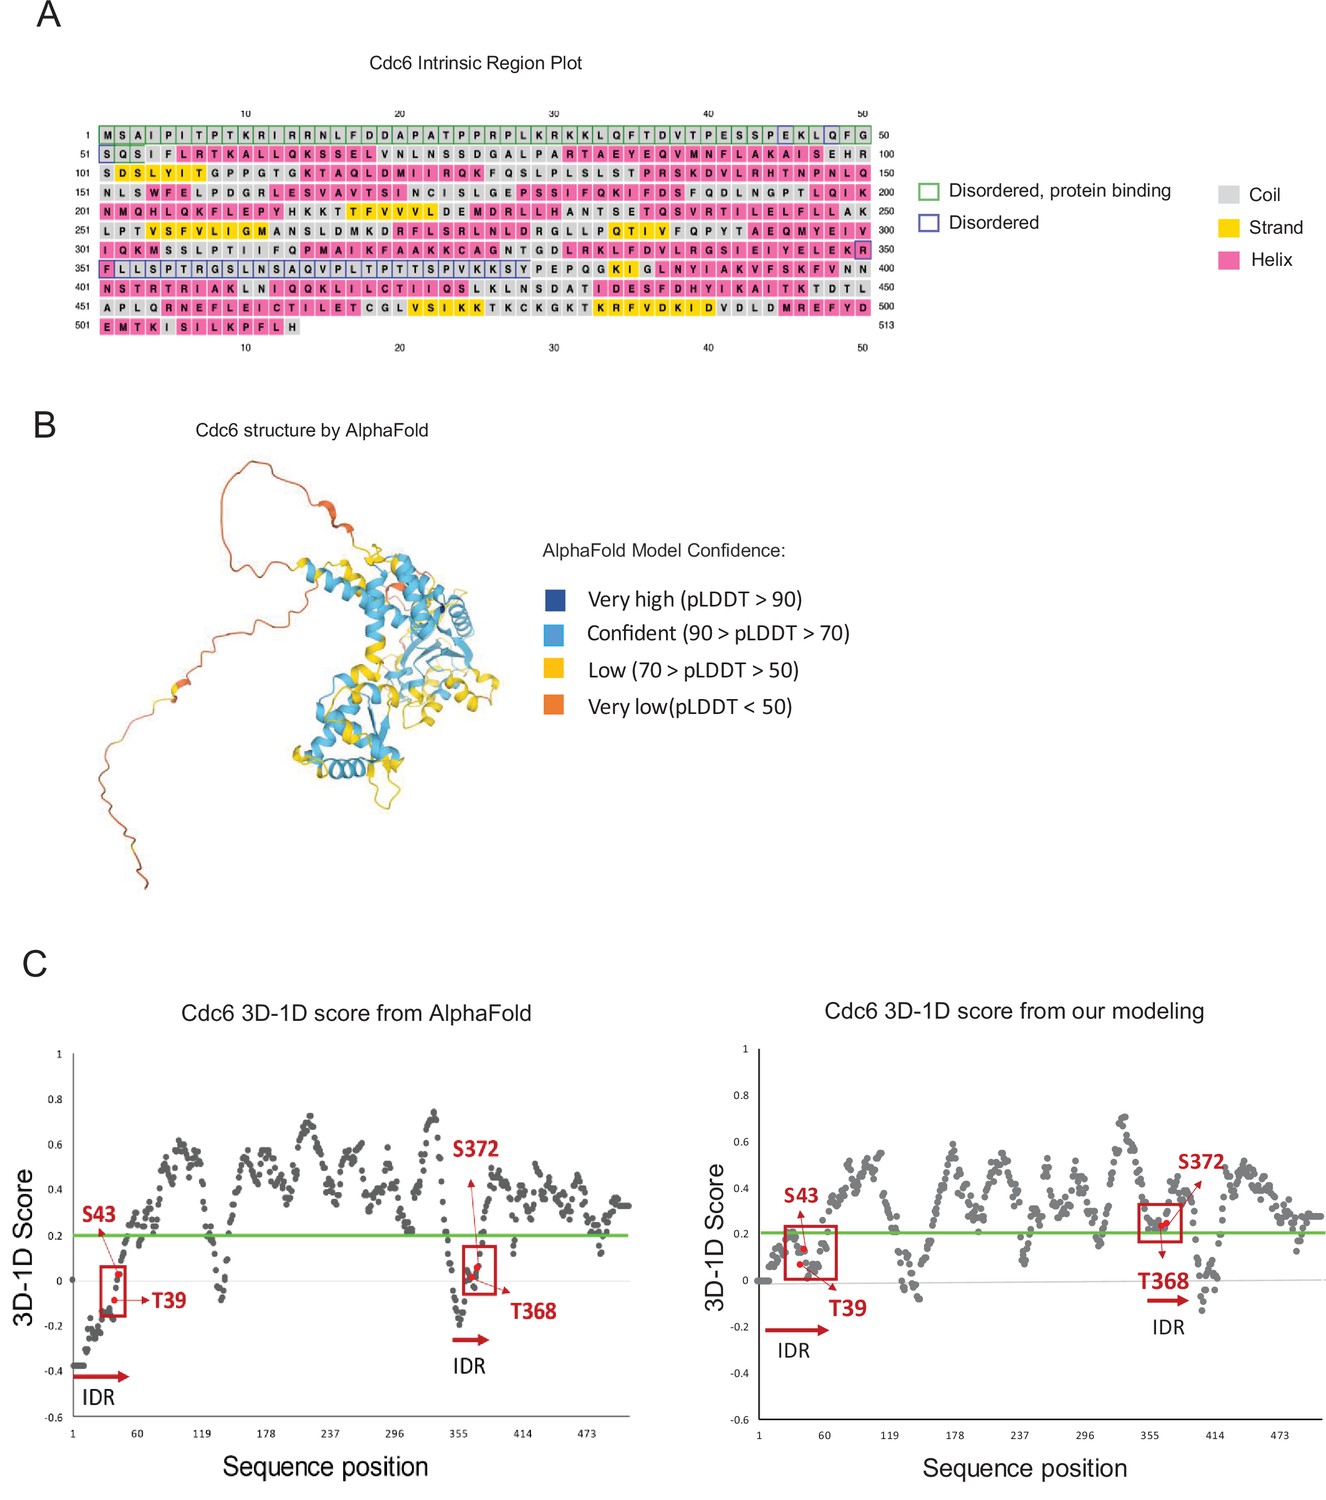
A prediction of intrinsically disordered regions (IDRs) in Cdc6.
(A) Cdc6 IDR predictions by DISOPRED and secondary structure prediction by IUpred2. (B) Cdc6 structure from AlphaFold with internally generated confidence scores. (C) 3D-1D score by Verify3D program are shown for Cdc6 structures by AlphaFold and our modeling program. The green line represents the 3D-1D score = 0.2 that indicates threshold for model quality. The red boxes display the location of phospho-degrons (T39-S43;T368-S372). Each amino acid residue is distinguished by arrows and the red horizontal arrows indicate the position of IDRs.
Figure 7
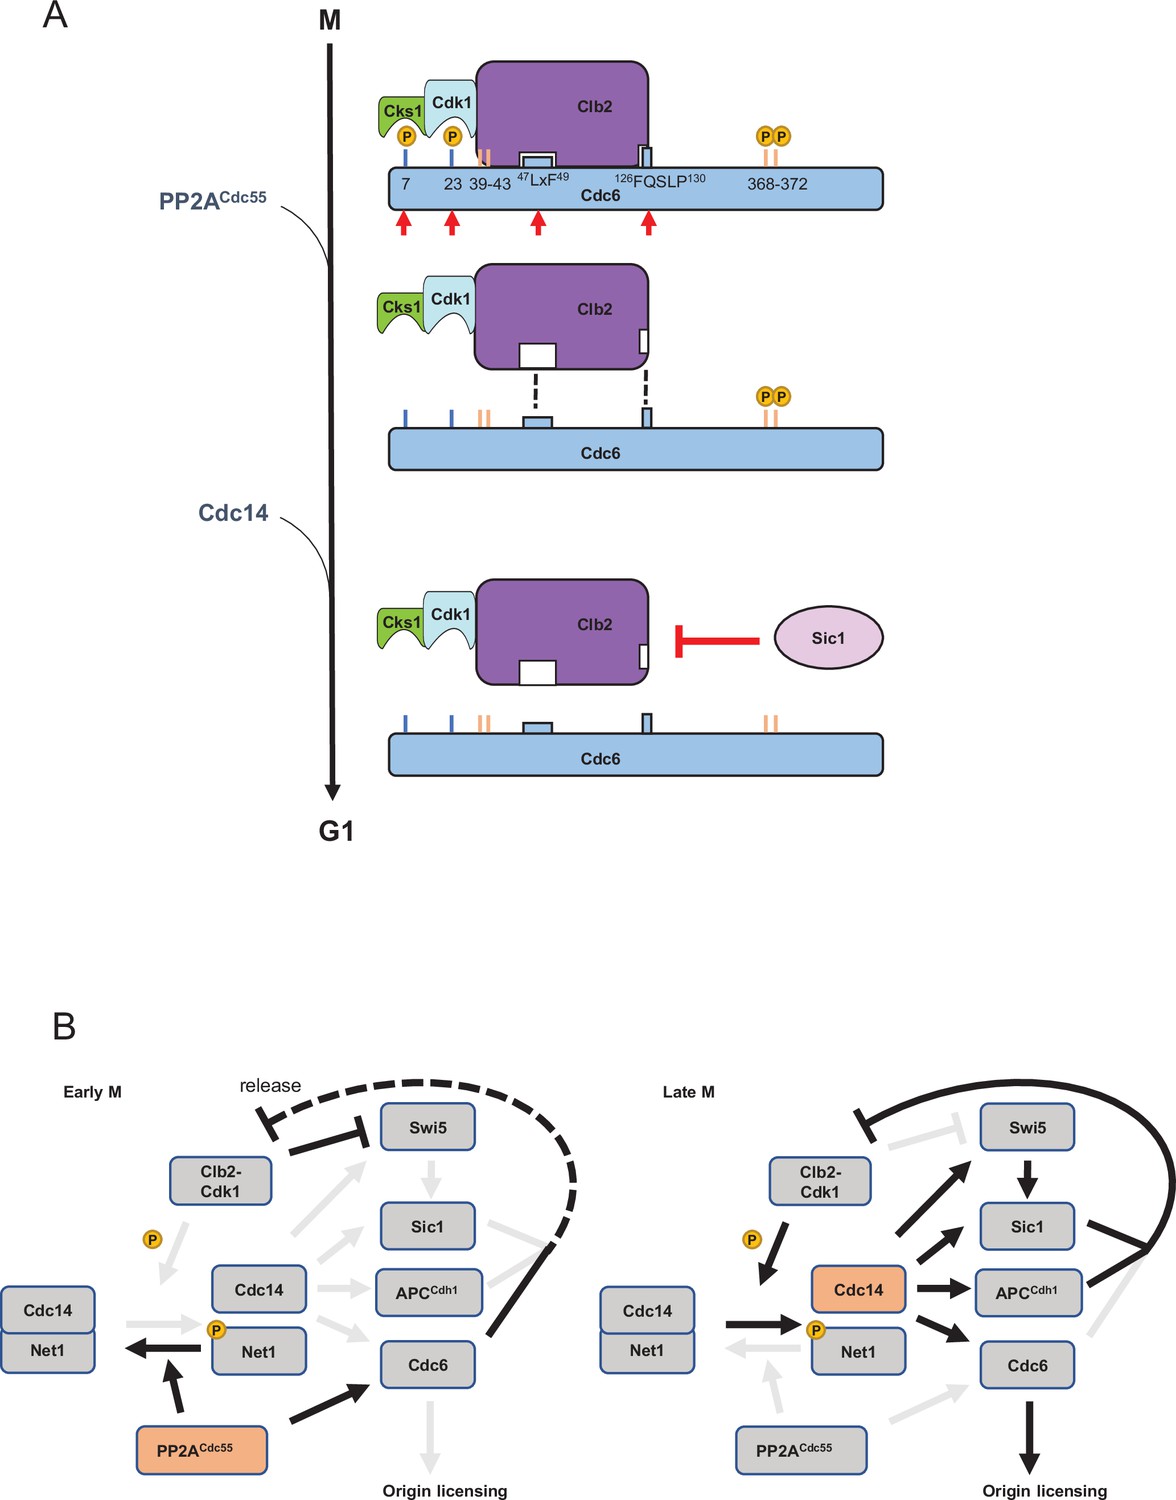
A model of Cdc6 regulation by Clb2, PP2ACdc55, Sic1, and Cdc14.
(A) In mitosis, the Clb2·Cdk1·Cks1 complex binds to phosphorylated Cdc6 N-terminus to mask the phospho-degron and prohibit Cdc6 loading on DNA, which is mediated by the LxF motif and FQSLP enhancer region. PP2ACdc55 dephosphorylates Cdc6-T7 and -T23 sites to disrupt Cdc6·Clb2·Cdk1·Cks1 complex. Sic1 releases Clb2·Cdk1·Cks1 from Cdc6 to promote origin licensing. Cdc14 dephosphorylates Cdc6 C-terminal phospho-degron for stabilization. Cks1 docking sites T7 and T23 are colored blue whereas phospho-degrons are colored orange. Red arrows show sites and motifs where Clb2–Cdk1 inhibits Cdc6 loading. Dashed lines indicate reduced binding. (B) In early mitosis, PP2ACdc55 inhibits Cdc14 release and promotes a rise in Clb2–Cdk1 activity by dephosphorylating Cdc6. During late mitosis, Clb2–Cdk1 initiates Cdc14 release from inhibitory binding by Net1. Cdc14 targets Swi5, Sic1, Cdh1, and Cdc6, contributing to full suppression of Clb2–Cdk1 activity and origin licensing.
Additional files
-
Transparent reporting form
- https://cdn.elifesciences.org/articles/74437/elife-74437-transrepform1-v1.docx
-
Supplementary file 1
Strain list.
- https://cdn.elifesciences.org/articles/74437/elife-74437-supp1-v1.docx
Download links
A two-part list of links to download the article, or parts of the article, in various formats.
Downloads (link to download the article as PDF)
Open citations (links to open the citations from this article in various online reference manager services)
Cite this article (links to download the citations from this article in formats compatible with various reference manager tools)
Cdc6 is sequentially regulated by PP2A-Cdc55, Cdc14, and Sic1 for origin licensing in S. cerevisiae
eLife 11:e74437.
https://doi.org/10.7554/eLife.74437


