Polycomb-mediated repression of paternal chromosomes maintains haploid dosage in diploid embryos of Marchantia
- Gregor Mendel Institute, Austrian Academy of Sciences, Vienna BioCenter, Austria
- Vienna BioCenter PhD Program, Doctoral School of the University of Vienna and Medical University of Vienna, Austria
- Institute of Biology, University of Hohenheim, Germany
Figures
Figure 1 with 1 supplement
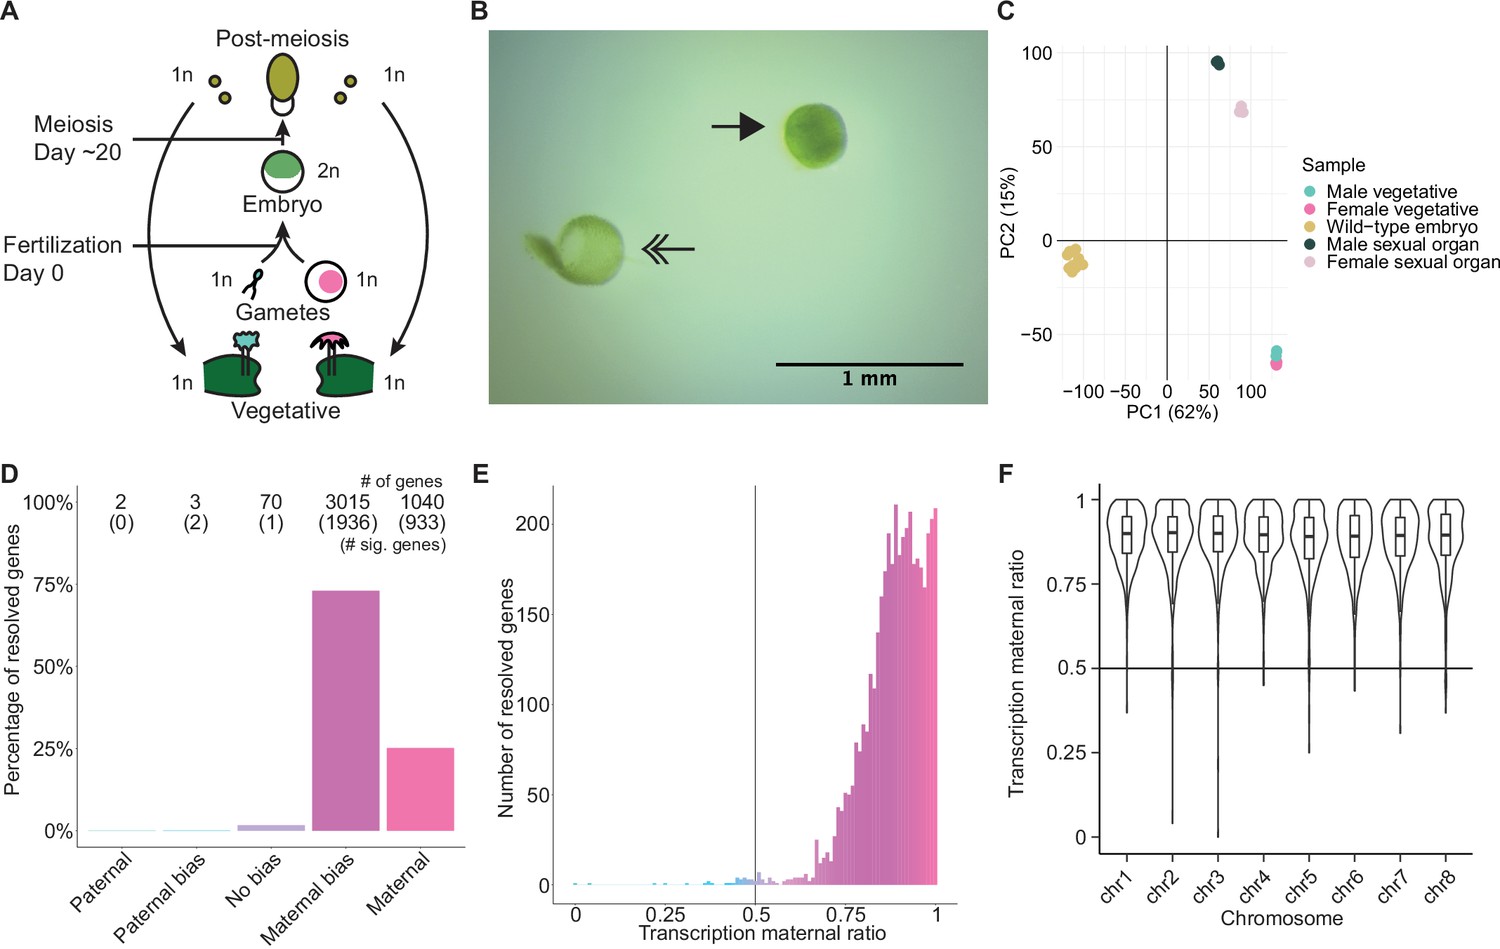
Embryonic transcription is maternally biased.
(A) Life cycle of Marchantia polymorpha. Haploid (1n) vegetative males and females produce male and female reproductive structures, which subsequently produce sperm and egg. The diploid (2n) embryo persists for around 20 days before meiosis and the production of haploid spores. Ploidy of each stage is indicated. (B) Image of a representative hand-dissected embryo after removal of perianth and calyptra of maternal origin. Solid single arrow indicates isolated embryo. Double arrow indicates the removed calyptra. Scale bar as indicated. (C) Principal component analysis of transcriptomes from wild-type embryos (Cam-2 × Tak-1), vegetative tissues from female and male parents, and female and male sexual organs. The first two principal components are plotted, and the percentage of variance explained is indicated. (D) Percentage of measured genes within each category of maternal ratio (pm) of transcription in wild-type embryos. Segments are for paternal (pm ≤ 0.05), paternal bias (0.05<pm ≤ 0.35), no bias (0.35 <pm < 0.65), maternal bias (0.65 ≤pm < 0.95), and maternal (0.95 ≤ pm) expression of genes, with the number of genes indicated above each bar and the number of genes significantly deviating from pm = 0.5 in parentheses. Significance was assessed using an exact binomial test with Bonferroni correction. (E) Histogram of the maternal ratio (pm) of transcription per gene in wild-type (Cam-2 × Tak-1) embryos. Each bin is 0.01 units wide. (F) Violin plots of transcription maternal ratio of genes per chromosome. Sex chromosomes are excluded as alleles could not be resolved.
Figure 1—figure supplement 1
Maternally biased transcription in embryos.
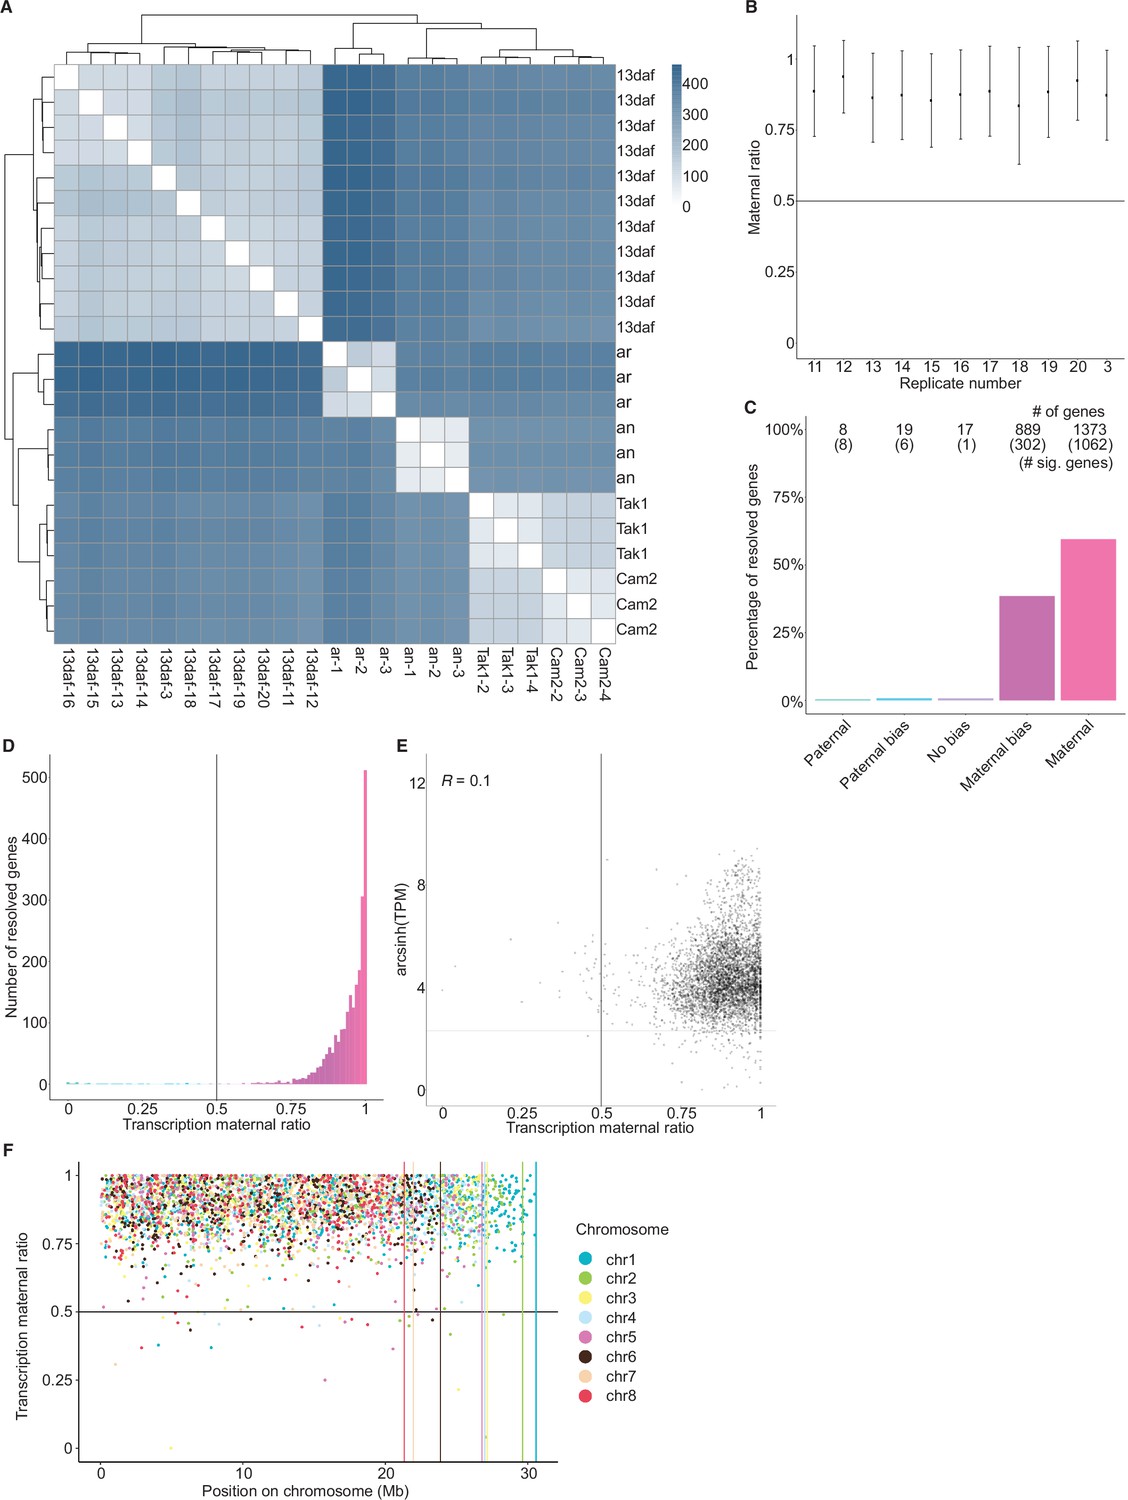
(A) Distance matrix heatmap of RNA-seq replicates. Individual replicates indicated along the bottom axis and the sample stage is indicated along the right axis. daf (days after fertilization), an (antheridiophore, male sexual organ), ar (archegoniophore, female sexual organ). Hierarchical clustering of replicates indicated along top and left axes. Computed distance indicated by scale bar. (B) Maternal ratio of embryo RNA-seq replicates. Black dots indicate the mean maternal ratio of transcription over all resolved genes per replicate. Black vertical lines indicate ± standard deviation. (C) Percentage of measured genes within each category of maternal ratio (pm) of transcription in wild-type (Tak-2 × Tak-1) embryos. Segments are for paternal (pm ≤ 0.05), paternal bias (0.05 <pm ≤ 0.35), no bias (0.35 <pm < 0.65), maternal bias (0.65 ≤pm < 0.95), and maternal (0.95 ≤ pm) expression of genes, with the number of genes indicated above each bar and the number of genes significantly deviating from pm = 0.5 in parentheses. Significance was assessed using an exact binomial test with Bonferroni correction. (D) Histogram of the maternal ratio (pm) of transcription per gene in wild-type (Tak-2 × Tak-1) embryos. Each bin is 0.01 units wide. (E) Scatterplot of gene expression (arcsinh transformed transcripts per million [TPM]) versus transcription maternal ratio per gene in wild-type (Cam-2 × Tak-1) embryos. Spearman correlation is indicated. (F) Transcription maternal ratio per gene along the length of each chromosome. Vertical lines indicate the end of each chromosome.
Figure 2 with 1 supplement
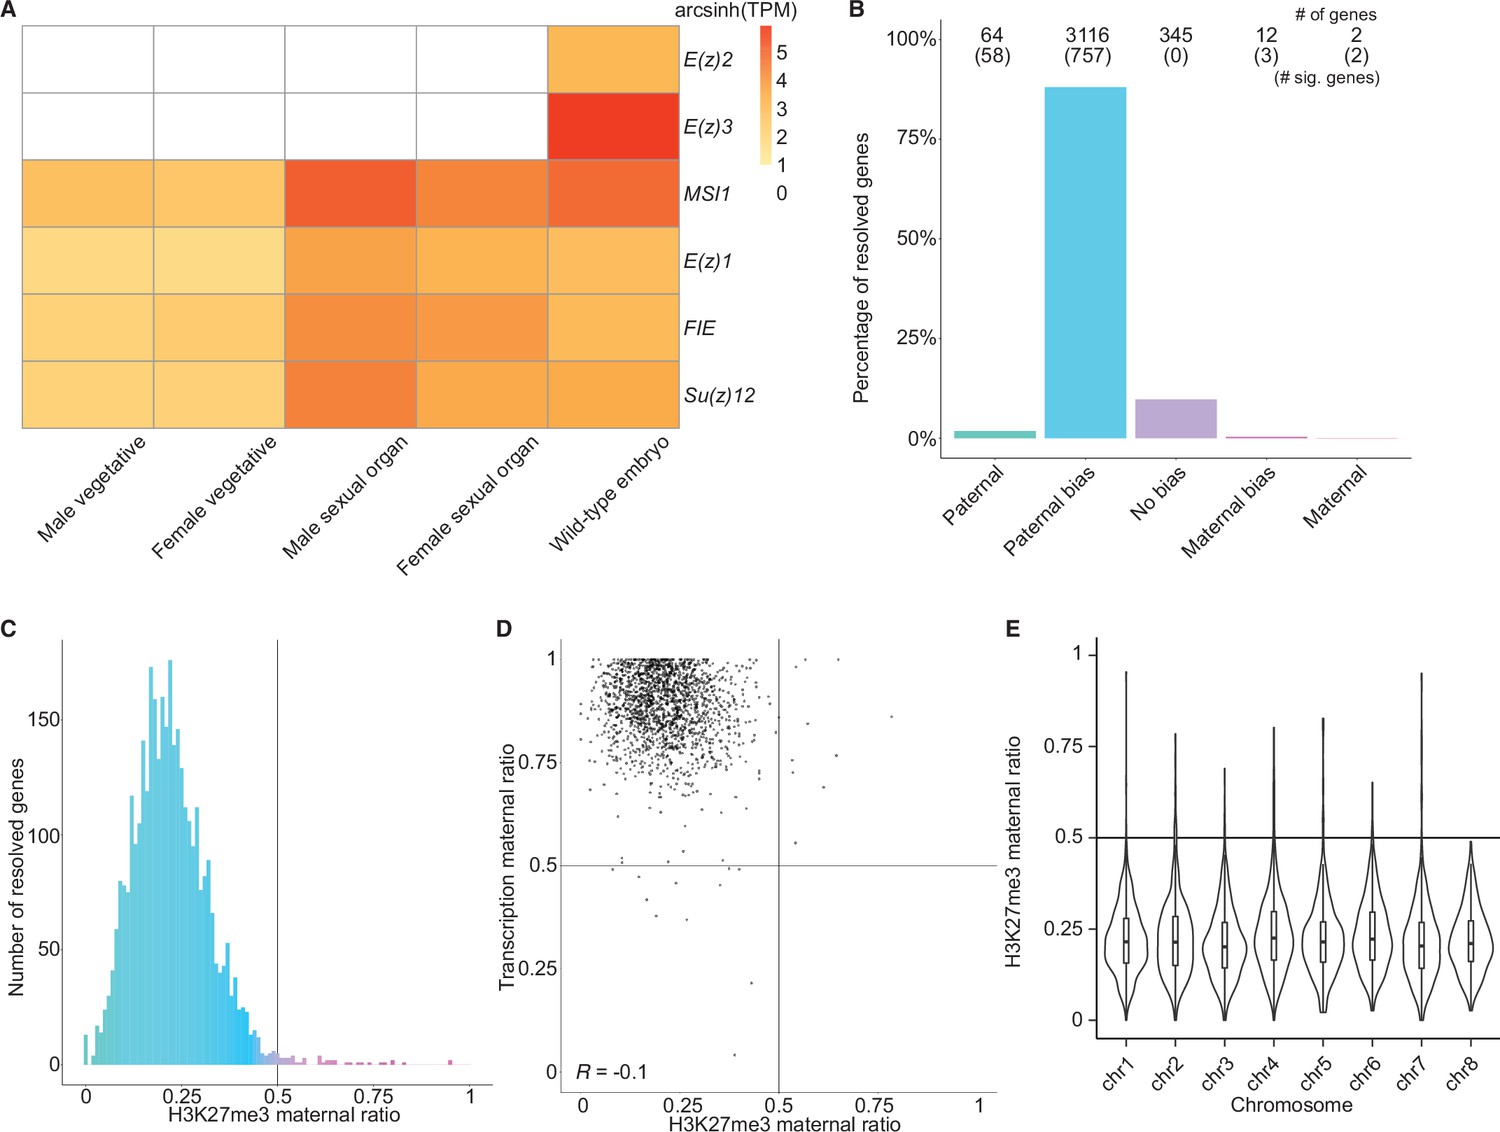
Levels of H3K27me3 enrichment are paternally biased.
(A) Heatmap of gene expression of Polycomb repressive complex 2 subunits across Marchantia development. Vegetative male (Tak-1) and female (Cam-2) tissues give rise to male and female sexual organs (antheridiophores and archegoniophores, respectively; data from Higo et al., 2016). Wild-type embryos are from Cam-2 × Tak-1 crosses. Values shown are arcsinh transformed transcript per million values. (B) Percentage of measured genes within each category of maternal ratio (pm) of H3K27me3 in wild-type embryos. Segments are for paternal (pm ≤ 0.05), paternal bias (0.05 < pm ≤ 0.35), no bias (0.35 <pm < 0.65), maternal bias (0.65 ≤pm < 0.95), and maternal (0.95 ≤ pm) H3K27me3 of genes, with the number of genes indicated above each bar and the number of genes significantly deviating from pm = 0.5 in parentheses. Significance was assessed using an exact binomial test with Bonferroni correction. (C) Histogram of the maternal ratio (pm) of H3K27me3 per gene in wild-type (Cam-2 × Tak-1) embryos. Each bin is 0.01 units wide. (D) Scatterplot of maternal ratios of H3K27me3 and transcription per resolved gene. Spearman correlation is indicated. (E) Violin plots of H3K27me3 maternal ratio of genes per chromosome in wild-type embryos. Sex chromosomes are excluded as alleles could not be resolved.
Figure 2—figure supplement 1
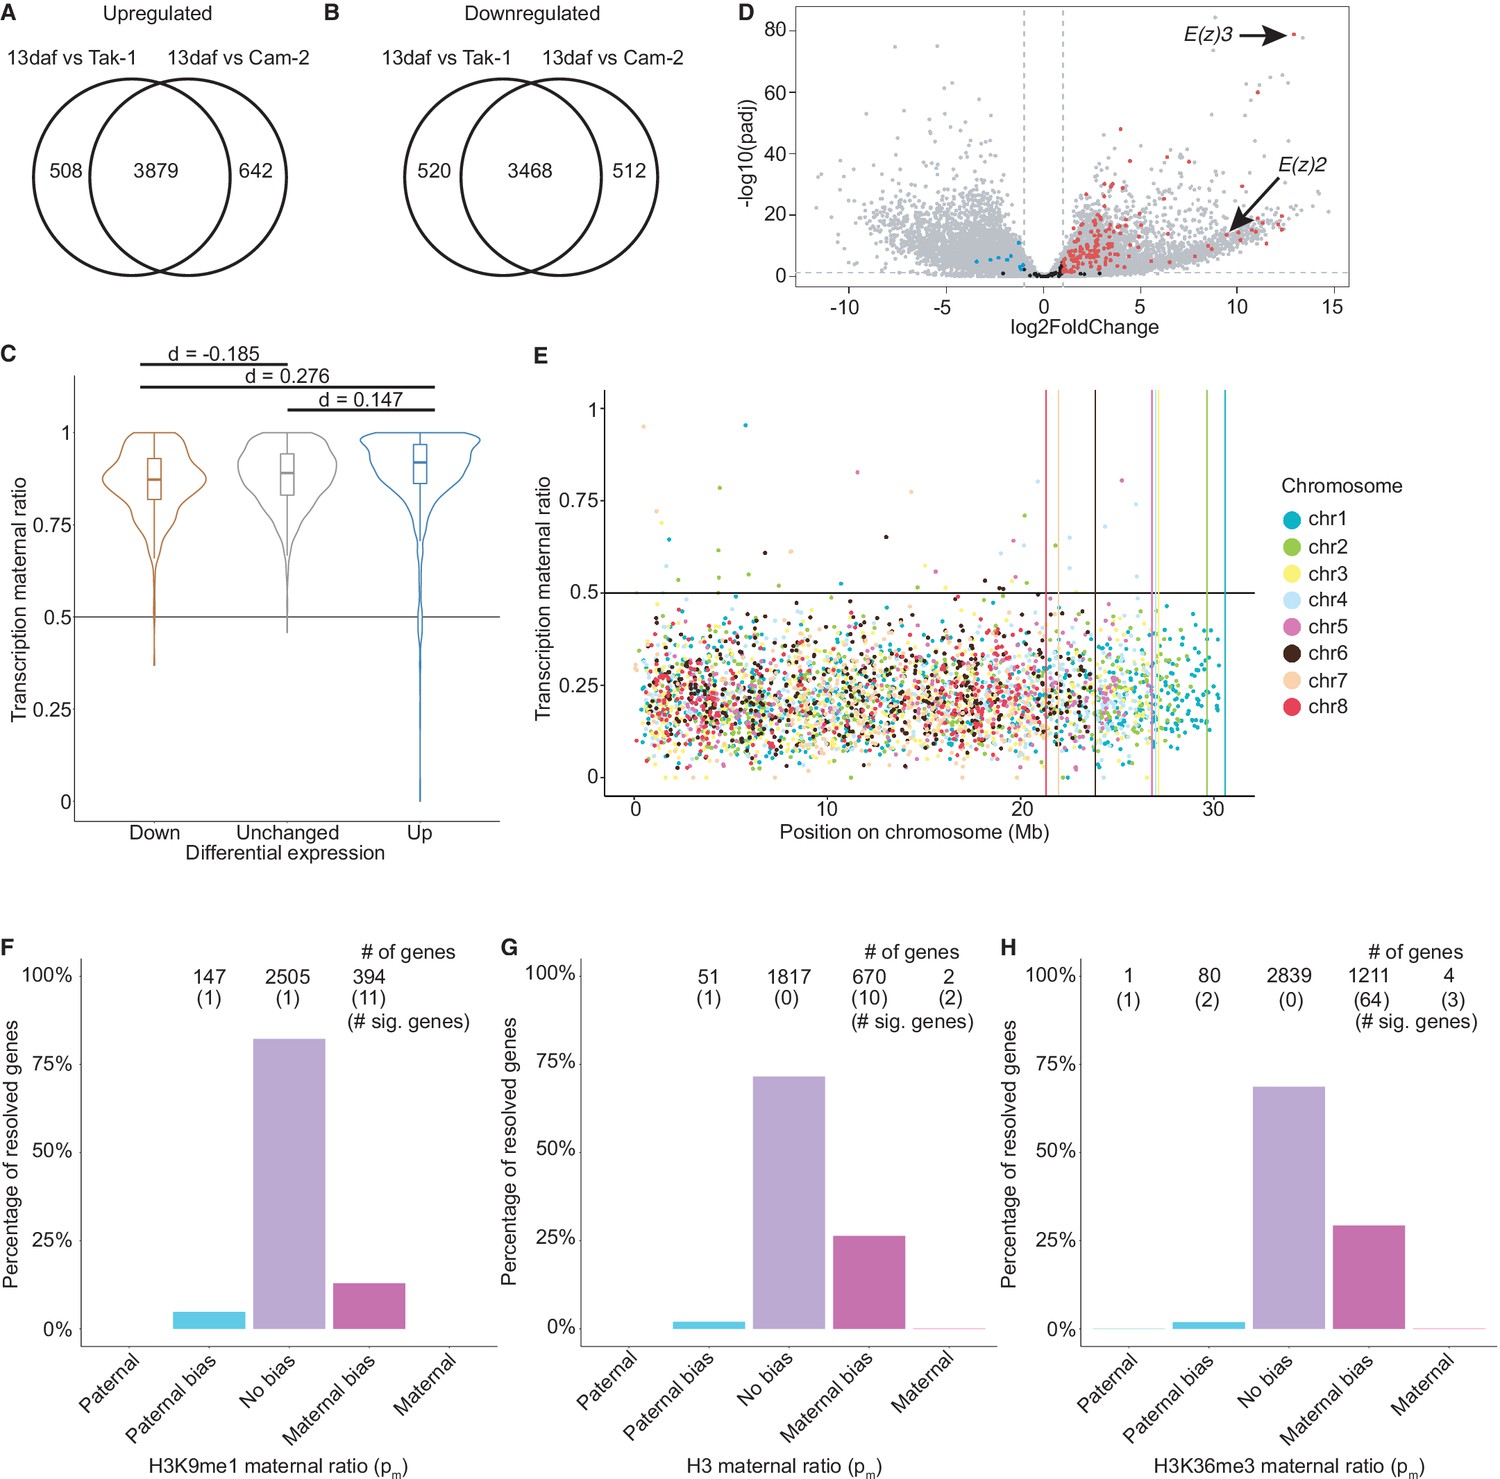
Paternally biased H3K27me3 in embryos.
(A) Venn diagram of upregulated genes in wild-type embryos compared to male (Tak-1) and female (Cam-2) parents. (B) Venn diagram of downregulated genes in wild-type embryos compared to male (Tak-1) and female (Cam-2) parents. (C) Violin plots of maternal ratio of transcription for shared differentially expressed genes in embryos versus wild-type vegetative tissue from parents. Cohen’s d effect size values are indicated for pairwise comparisons of down to none, up to none, and up to down, where |d| < 0.2 is no effect and 0.2 < |d| < 0.5 is a small effect, as previously reported (Cohen, 1992). (D) Volcano plot of a differential gene expression analysis between wild-type embryos and the male parent. The negative log transformed p-value per gene is plotted against the log2 fold-change in expression. Vertical dashed lines indicate a log2 fold-change of –1 and 1. The horizontal dashed line indicates a p-value of 0.05. Dots not in grey indicate chromatin-related genes, blue for significantly downregulated genes, red for significantly upregulated genes, black for genes not significantly downregulated nor upregulated. (E) H3K27me3 maternal ratio per gene along the length of each chromosome. Vertical lines indicate the end of each chromosome. (F–H) Percentage of measured genes within each category of maternal ratio (pm) of (F) H3K9me1 in wild-type embryos. (G) H3 and (H) H3K36me3 in wild-type embryos. Segments are for full paternal (pm ≤ 0.05), paternal bias (0.05 <pm ≤ 0.35), no bias (0.35 <pm < 0.65), maternal bias (0.65 ≤ pm < 0.95), and full maternal (0.95 ≤ pm) chromatin enrichment of genes, with the number of genes indicated above each bar and the number of genes significantly deviating from pm = 0.5 in parentheses. Significance was assessed using an exact binomial test with Bonferroni correction.
Figure 3 with 1 supplement
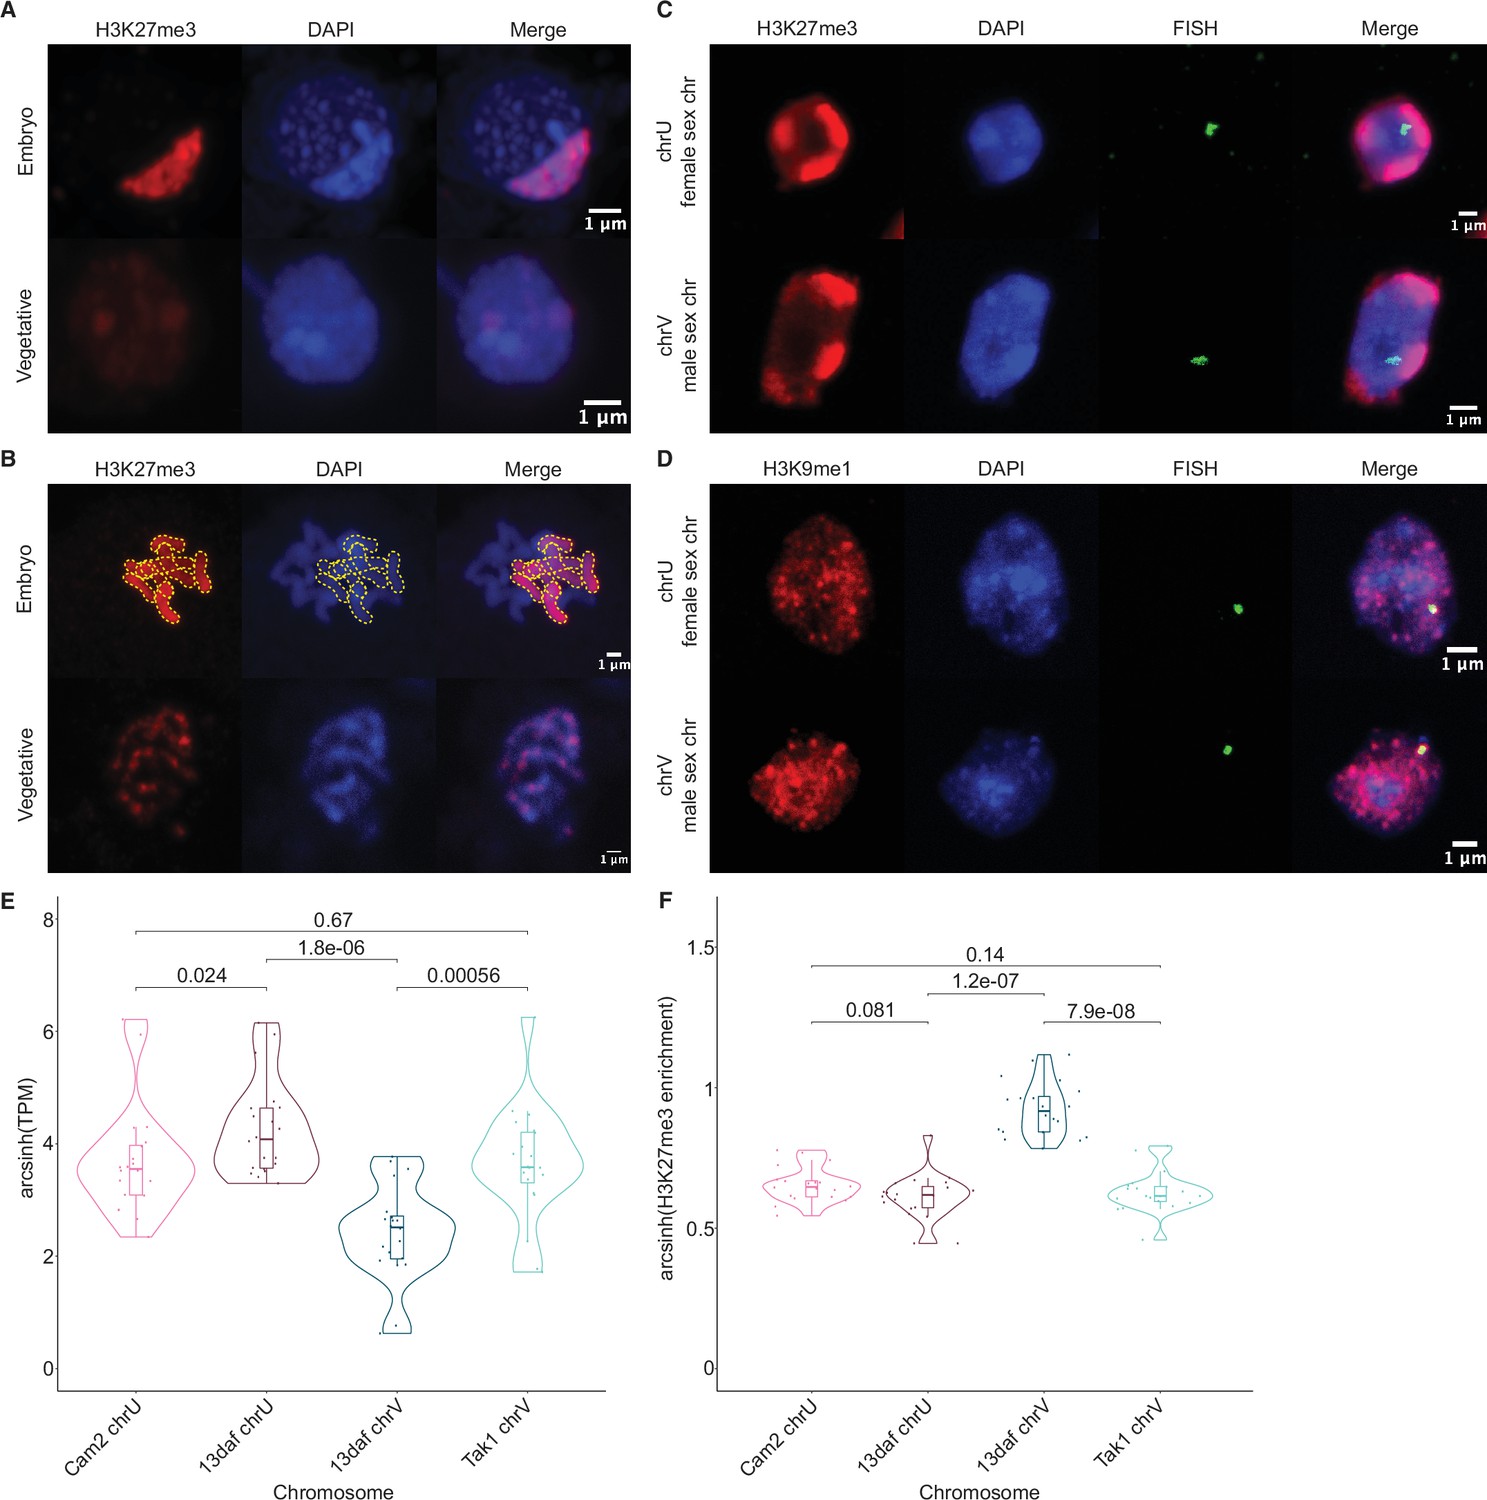
Paternal autosomes are coated in H3K27me3 and partitioned in heterochromatic foci.
(A) Immunofluorescence of H3K27me3 in interphase wild-type embryonic and vegetative nuclei. DNA is stained with DAPI. Scale bar as indicated. (B) Immunofluorescence of H3K27me3 in mitotic wild-type embryonic and vegetative cells. DNA is stained with DAPI. Contrast was enhanced for the DAPI channel of vegetative nuclei for illustration purposes. Outlines of the H3K27me3-coated chromosomes are indicated with dashed yellow lines. Scale bar as indicated. (C) Immuno-FISH for sex chromosomes and H3K27me3 in interphase wild-type embryonic nuclei. The female sex chromosome is chrU and the male sex chromosome is chrV. Scale bar as indicated. (D) Immuno-FISH for sex chromosomes and H3K9me1 in interphase wild-type embryonic nuclei. The female sex chromosome is chrU and the male sex chromosome is chrV. Scale bar as indicated. (E) Violin plot of arcsinh transformed transcript per million (TPM) values for sex chromosome gametologs in vegetative (Cam2 and Tak1) and embryonic (13 days after fertilization [daf]) samples. p-Values are indicated, unpaired two-tailed Wilcoxon test. (F) Violin plot of arcsinh transformed H3K27me3 enrichment for sex chromosome gametologs in vegetative and embryonic samples. p-Values are indicated, unpaired two-tailed Wilcoxon test.
Figure 3—figure supplement 1
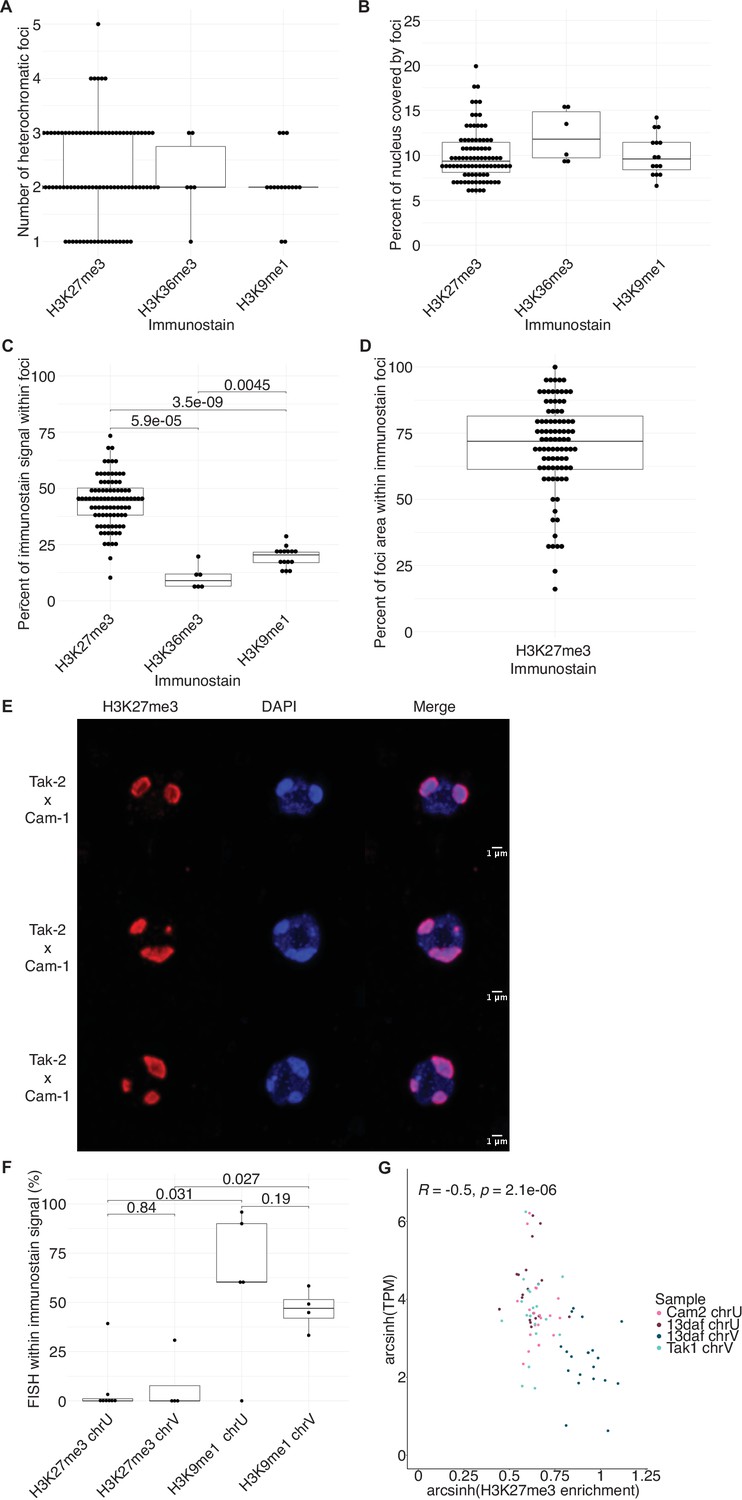
Quantification of immunofluorescence experiments.
(A) Number of heterochromatic foci per nucleus in wild-type embryos. (B) Percentage of nuclear area covered by heterochromatic foci in wild-type embryos. (C) Percentage of immunofluorescence signal located within heterochromatic foci in wild-type embryos. p-Values are indicated, unpaired two-tailed Wilcoxon test. (D) Percentage of heterochromatic foci area overlapping with H3K27me3 foci in wild-type embryos. (E) Representative images of nuclei from wild-type embryos at 13 days after fertilization (daf) from a cross between Tak-2 and Cam-1 accessions immunostained against H3K27me3 (red) and counterstained with DAPI (blue). (F) Quantification of sex chromosome FISH signal located within H3K27me3 or H3K9me1 heterochromatic foci. p-Values are indicated, unpaired two-tailed Wilcoxon test. (G) Scatterplot of arcsinh transformed transcripts per million (TPM) values versus arcsinh transformed H3K27me3 enrichment for sex chromosome gametologs in vegetative and embryonic samples. Spearman correlation and p-value are indicated.
Figure 4 with 1 supplement
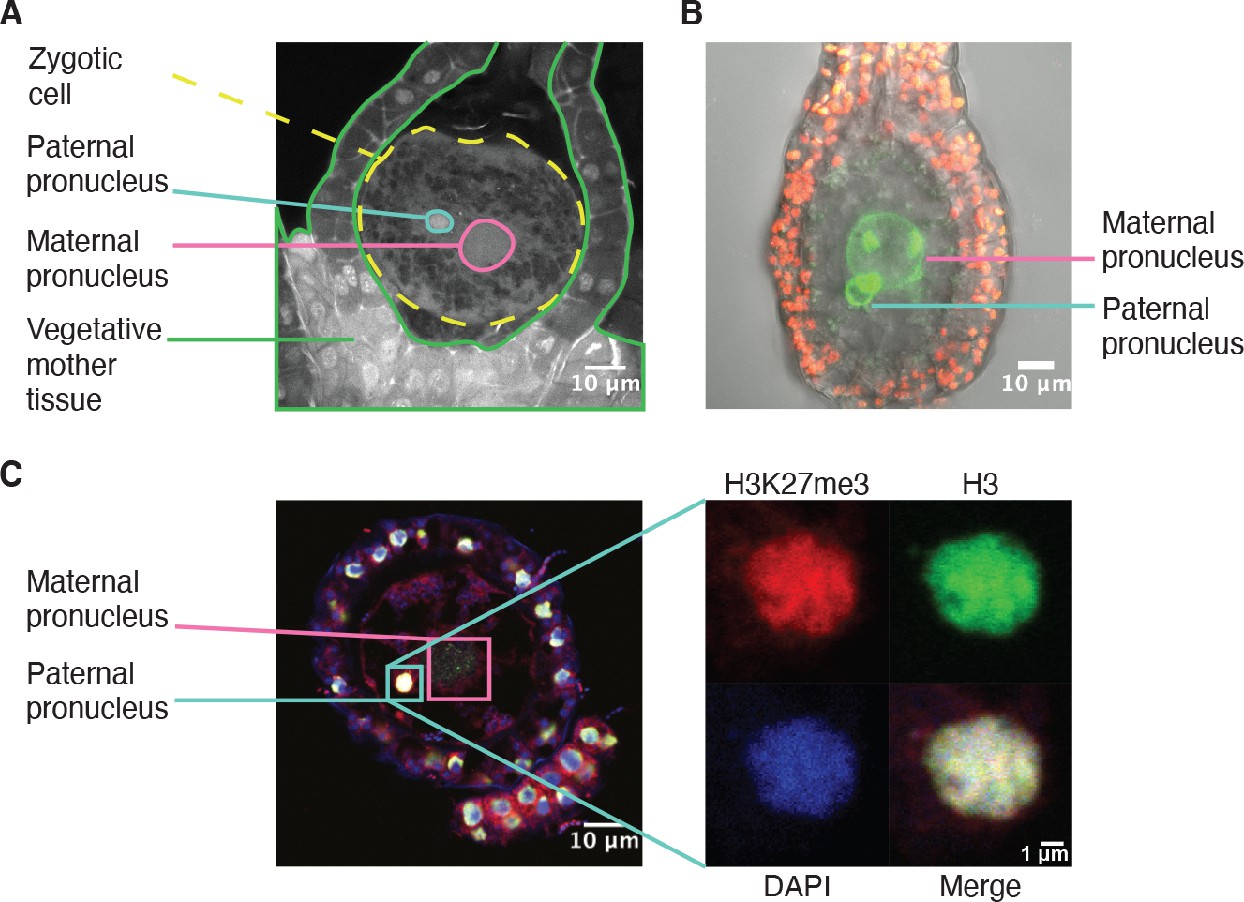
H3K27me3 is deposited in paternal pronuclei.
(A) Annotated confocal image of a Marchantia zygote 3 days after fertilization (daf) with surrounding vegetative mother tissue. The paternal pronucleus is visible in the vicinity of the maternal pronucleus. Nuclei are stained with DAPI. Indicated are the fertilized zygotic cell (dashed yellow circle), maternal pronucleus (pink circle), vegetative mother tissue (green lines) surrounding the zygote, and paternal pronucleus (cyan circle). Scale bar as indicated. (B) Composite maximum intensity projection confocal image of a Marchantia zygote expressing SUN-GFP at 3 daf plus surrounding vegetative mother tissue. Nuclear membranes are marked by localization of SUN-GFP, shown in green. The paternal pronucleus is smaller than and adjacent to the maternal pronucleus. Autofluorescence from chloroplasts in vegetative mother cells is shown in red, and both channels are overlayed on a transmitted light image. Scale bar as indicated. (C) Immunofluorescence image 3 daf of a Marchantia zygote. Both maternal and paternal pronuclei are indicated in pink and cyan, respectively. The inset depicts a zoomed-in view of the paternal pronucleus with separate images for H3K27me3 (red), H3 (green), DAPI (blue), and the merged image. Contrast is enhanced for each image and channel independently for visualization purposes. Scale bars as indicated.
Figure 4—figure supplement 1
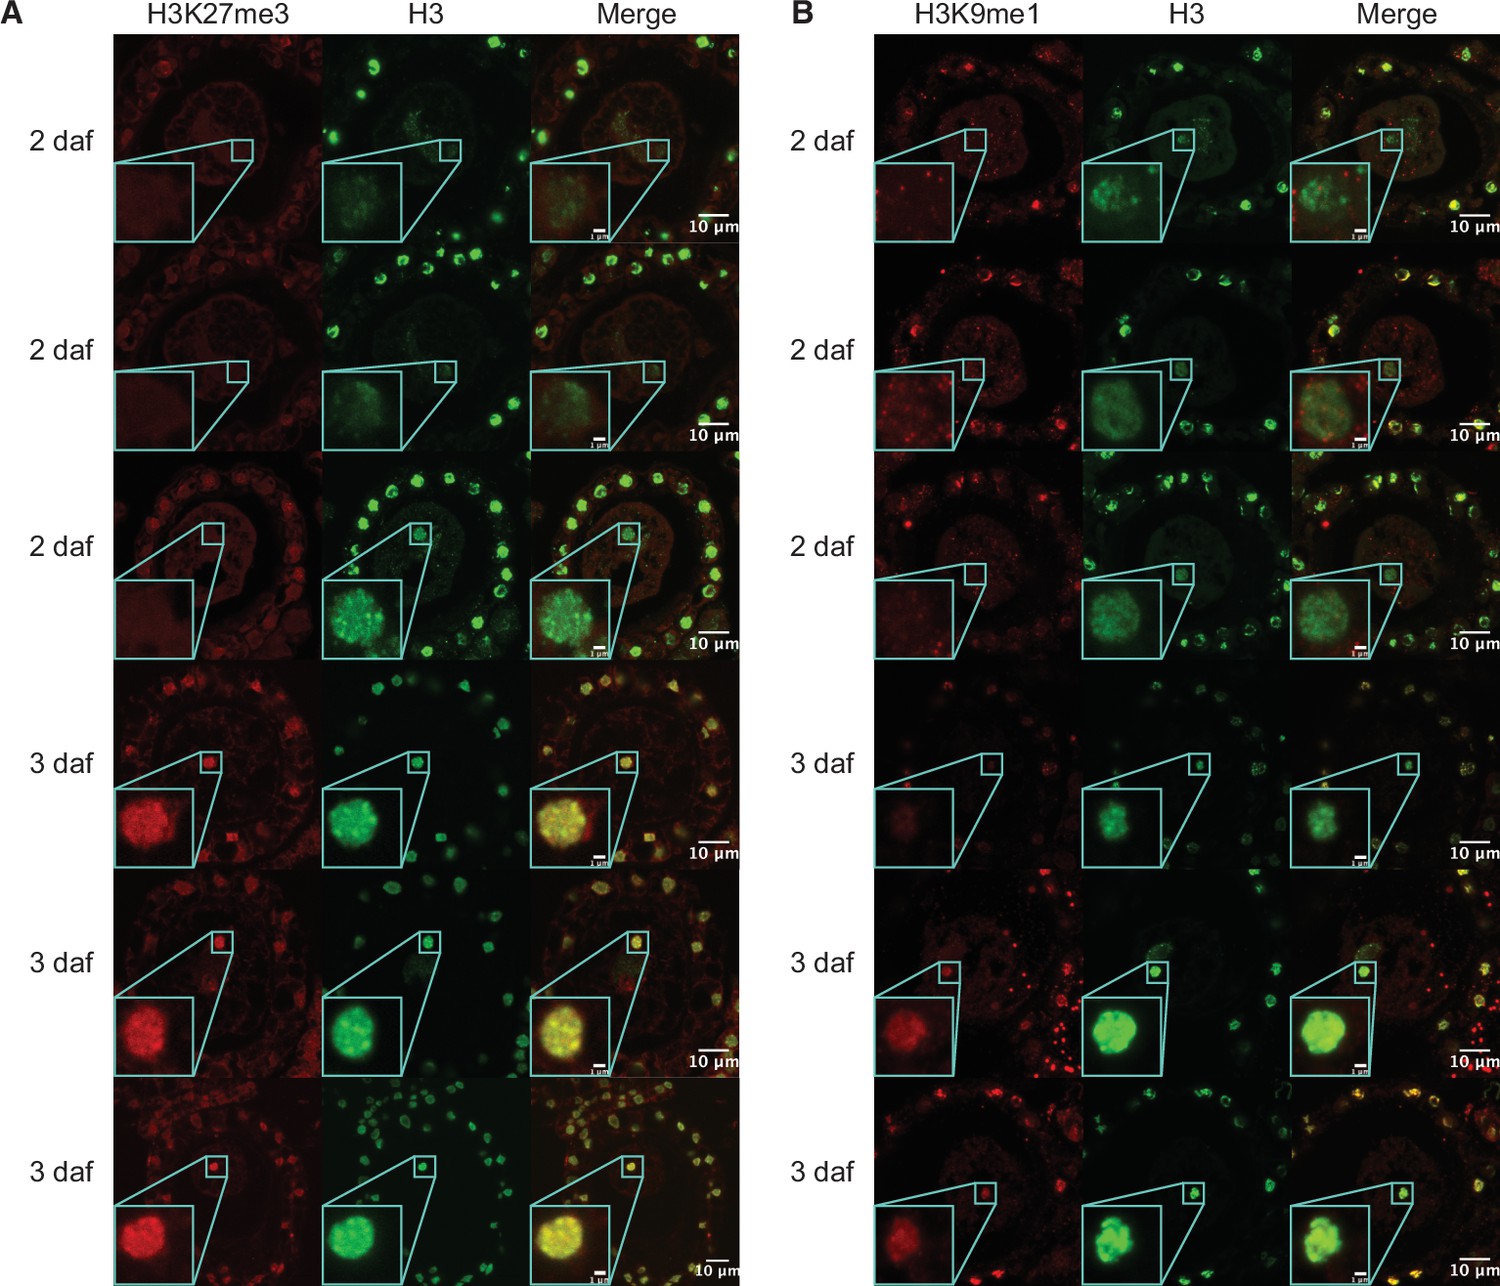
Immunofluorescence of pronuclei.
(A) Representative images of wild-type zygotes at 2 and 3 days after fertilization (daf) immunostained against H3K27me3 (red) and H3 (green). Paternal pronuclei are indicated with a cyan box and in a magnified inset in the lower-left corner of each image. (B) Representative images of wild-type zygotes at 2 and 3 daf immunostained against H3K9me1 (red) and H3 (green). Paternal pronuclei are indicated with a cyan box and in a magnified inset in the lower-left corner of each image. Scale bars as indicated.
Figure 5 with 2 supplements
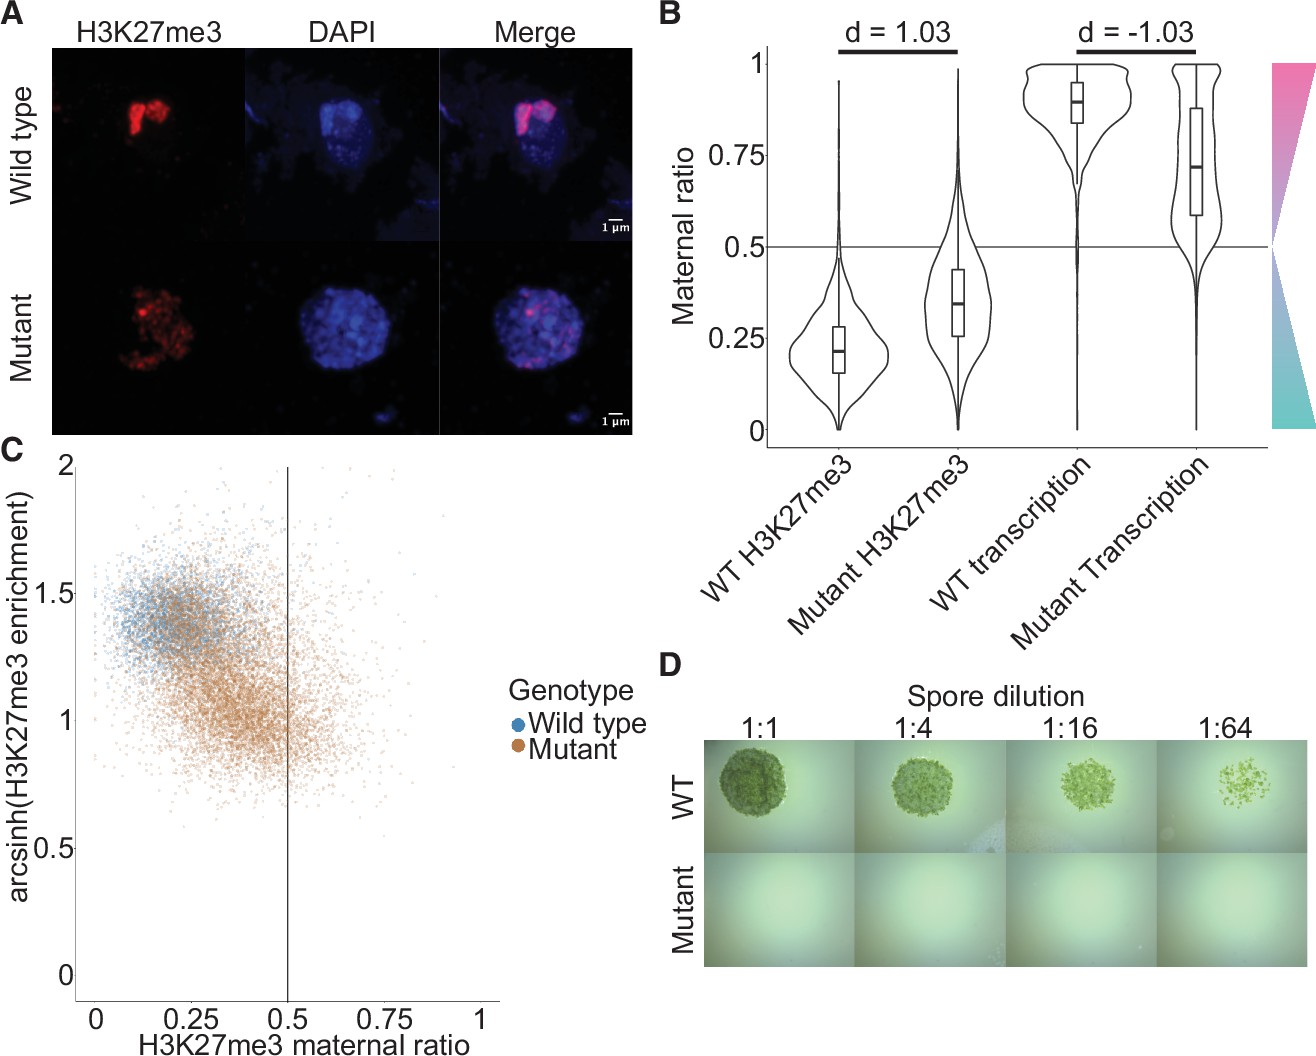
Embryonic Polycomb repressive complex 2 (PRC2) deposits H3K27me3 and represses the paternal genome.
(A) Immunofluorescence of H3K27me3 in interphase wild-type (WT) and mutant embryonic nuclei. DNA is stained with DAPI. (B) Violin plots of maternal ratios for WT and mutant H3K27me3 and transcription. Cohen’s d effect size values are indicated for pairwise comparisons of mutant to WT H3K27me3 maternal ratio and mutant to WT transcription maternal ratio, where |d| > 0.8 is a large effect, as previously reported (Cohen, 1992). (C) Scatterplot of H3K27me3 enrichment versus H3K27me3 maternal ratio per gene in WT and mutant embryos. Genes with an arcsinh-transformed H3K27me3 enrichment greater than 2 are displayed as triangles at the upper boundary of the plot. (D) Spore germination assay for spores resulting from WT and mutant embryos. A serial dilution of a suspension of spores from a single embryo is shown.
Figure 5—figure supplement 1
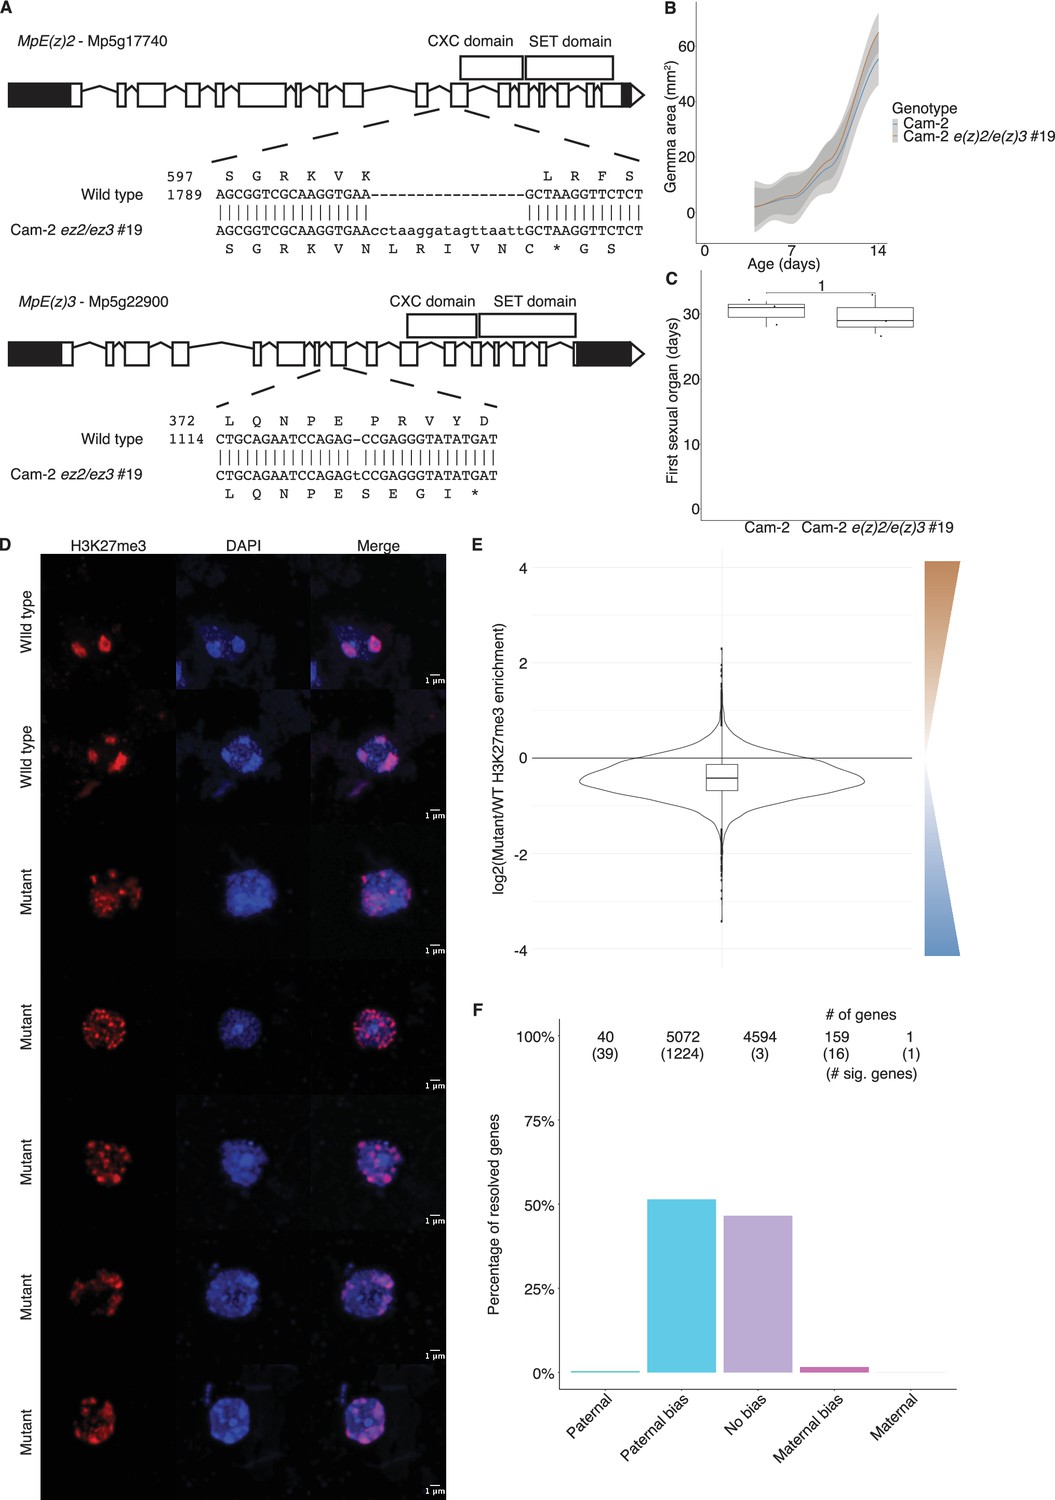
Chromatin phenotypes of e(z)2/e(z)3 mutants.
(A) Structure of E(z)2 and E(z)3 genes and the mutations generated in each. (B) Growth of Cam-2 e(z)2/e(z)3 mutants in the vegetative stage relative to Cam-2 wild type. Area of vegetative haploid plant growth as a function of the number of days after planting gemmae (propagules). (C) Timing of the appearance of sexual organs in Cam-2 e(z)2/e(z)3 mutants relative to Cam-2 wild type as a function of the number of days after planting. p-Value is indicated, unpaired two-tailed Wilcoxon test. (D) Representative set of wild-type and mutant embryo immunofluorescence images. Images are maximum intensity projections. Scale bars are as indicated. (E) Log2 ratio of H3K27me3 enrichment between mutant and wild type. Brown scale indicates greater H3K27me3 enrichment in the mutant, whereas the blue scale indicates greater H3K27me3 enrichment in wild type. (F) Percentage of measured genes within each category of maternal ratio (pm) of H3K27me3 in mutant embryos. Segments are for full paternal (pm ≤ 0.05), paternal bias (0.05 <pm ≤ 0.35), no bias (0.35 <pm < 0.65), maternal bias (0.65 ≤pm < 0.95), and full maternal (0.95 ≤ pm) H3K27me3 of genes, with the number of genes indicated above each bar and the number of genes significantly deviating from pm = 0.5 in parentheses. Significance was assessed using an exact binomial test with Bonferroni correction.
Figure 5—figure supplement 2

Transcription phenotypes in mutant embryos.
(A) Percentage of measured genes within each category of maternal ratio (pm) of transcription in mutant embryos. Segments are for full paternal (pm ≤ 0.05), paternal bias (0.05 <pm ≤ 0.35), no bias (0.35 <pm < 0.65), maternal bias (0.65 ≤ pm < 0.95), and full maternal (0.95 ≤ pm) expression of genes, with the number of genes indicated above each bar and the number of genes significantly deviating from pm = 0.5 in parentheses. Significance was assessed using an exact binomial test with Bonferroni correction. (B) Heatmap of Spearman correlations of gene features in mutant embryos. (C) Scatterplot of transcription maternal ratio versus H3K27me3 maternal ratio per gene in mutant embryos. (D) Scatterplot of arcsinh transformed H3K27me3 enrichment versus transcription maternal ratio per gene in mutant embryos. (E) Scatterplot of arcsinh transformed transcript per million (TPM) values versus transcription maternal ratio per gene in mutant embryos. (F) Scatterplot of arcsinh transformed TPM values versus arcsinh transformed H3K27me3 enrichment per gene in mutant embryos. (G) Scatterplot of arcsinh transformed TPM values versus H3K27me3 maternal ratio per gene in mutant embryos. Spearman correlations are indicated for each scatterplot. (H) Embryo size of wild-type and mutant embryos 13 and 16 days after fertilization (daf) measured by the area of a bounding box. (I) Percentage of wild-type and mutant embryos per female sex organ that survive to maturity at 25 and 32 daf. (J) Percentage of wild-type and mutant embryos per female sex organ that have produced spores at 25 and 32 daf. p-Values are indicated, unpaired two-tailed Wilcoxon test.
Figure 6
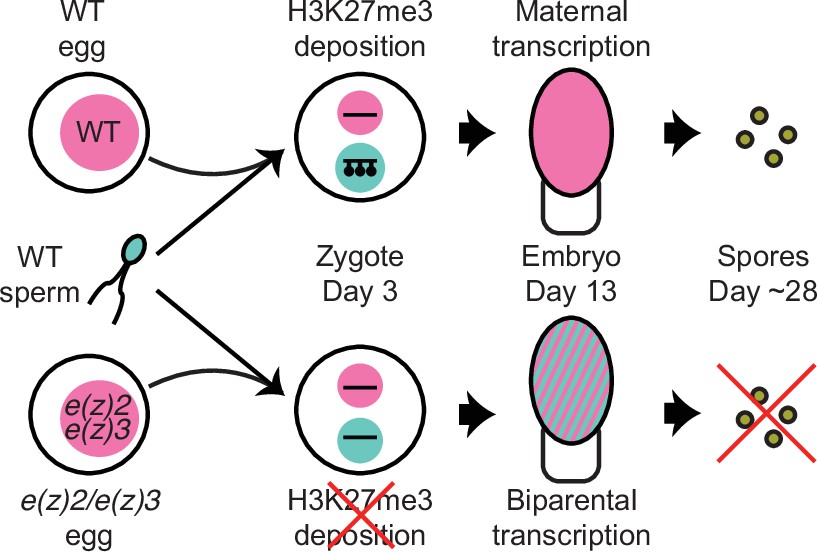
Model of genomic imprinting in Marchantia.
Model of H3K27me3 deposition in wild-type (WT) paternal pronuclei and subsequent propagation throughout embryogenesis. Closed lollipops depict H3K27me3 on genes. Pink and blue circles depict maternal and paternal (pro)nuclei, respectively. Pink and striped ovals depict whole embryos and the parental genome from which transcription is occurring. Yellow discs depict mature spores. The lack of H3K27me3 on paternal pronuclei in mutant zygotes allows for the transcription of paternal alleles in the embryo, ultimately leading to the lack of viable spore production.
Figure 7
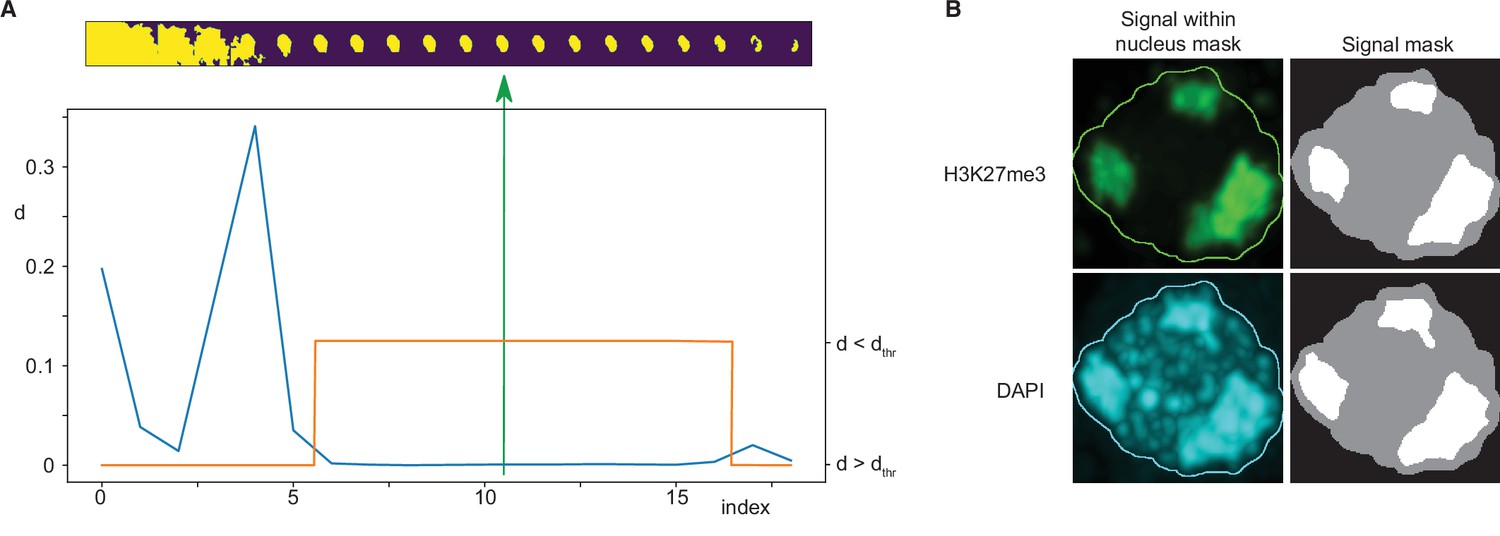
Immunofluorescence image analysis.
(A) Nucleus segmentation. Top panel: A sequence of 20 segmentations created by thresholding. Bottom panel: Differences (d) between nucleus mask sizes (blue curve). Plateau identified by estimating a threshold value dthr (orange curve). The selected segmentation is in the centre of the plateau (green arrow). (B) Foci segmentation. Left: H3K27me3 and DAPI image bands with the overlayed nucleus border detected from the DAPI band. Right: Masks of the nucleus and detected foci.
Videos
Video 1
Movie of the dissection of a representative Marchantia embryo from surrounding calyptra of maternal origin.
Additional files
-
Supplementary file 1
List of Marchantia chromatin-related genes and their expression status in embryos relative to other tissues.
- https://cdn.elifesciences.org/articles/79258/elife-79258-supp1-v1.csv
-
Supplementary file 2
Data for χ2 test.
List of all Marchantia genes and the presence or absence of H3K27me3 peaks in e(z)2/e(z)3 mutant embryos plus whether the genes were upregulated, downregulated, or unchanged in a differential gene expression analysis between wild-type and e(z)2/e(z)3 mutant embryos.
- https://cdn.elifesciences.org/articles/79258/elife-79258-supp2-v1.csv
-
MDAR checklist
- https://cdn.elifesciences.org/articles/79258/elife-79258-mdarchecklist1-v1.pdf
Download links
A two-part list of links to download the article, or parts of the article, in various formats.
Downloads (link to download the article as PDF)
Open citations (links to open the citations from this article in various online reference manager services)
Cite this article (links to download the citations from this article in formats compatible with various reference manager tools)
Polycomb-mediated repression of paternal chromosomes maintains haploid dosage in diploid embryos of Marchantia
eLife 11:e79258.
https://doi.org/10.7554/eLife.79258


