Differences in the immune response elicited by two immunization schedules with an inactivated SARS-CoV-2 vaccine in a randomized phase 3 clinical trial
- Millennium Institute on Immunology and Immunotherapy, Chile
- Departamento de Genética Molecular y Microbiología, Facultad de Ciencias Biológicas, Pontificia Universidad Católica de Chile, Chile
- Departamento de Ciencias Biológicas, Facultad de Ciencias de la Vida, Universidad Andrés Bello, Chile
- Departamento de Enfermedades Infecciosas e Inmunología Pediátrica, División de Pediatría, Escuela de Medicina, Pontificia Universidad Católica de Chile, Chile
- Centro de Investigación Clínica UC, Pontificia Universidad Católica de Chile, Chile
- Departamento de Enfermedades Infecciosas del Adulto, División de Medicina, Escuela de Medicina, Pontificia Universidad Católica de Chile, Chile
- Departamento de Laboratorio Biomédico, Instituto de Salud Pública de Chile, Chile
- Laboratory of Molecular and Cellular Virology, Virology Program, Institute of Biomedical Sciences, Faculty of Medicine, Universidad de Chile, Chile
- Center for Infectious Disease and Vaccine Research, La Jolla Institute for Immunology, United States
- Department of Medicine, Division of Infectious Diseases and Global Public Health, University of California, United States
- Sinovac Biotech, China
- Sinovac Life Sciences Co., Ltd., China
- Departamento de Farmacia, Facultad de Química y de Farmacia, Pontificia Universidad Católica de Chile, Chile
- Department of Infection, Inflammation and Immunity, Great Ormond Street Institute of Child Health, University College London, United Kingdom
- Departamento de Endocrinología, Facultad de Medicina, Escuela de Medicina, Pontificia Universidad Católica de Chile, Chile
Figures
Figure 1 with 3 supplements
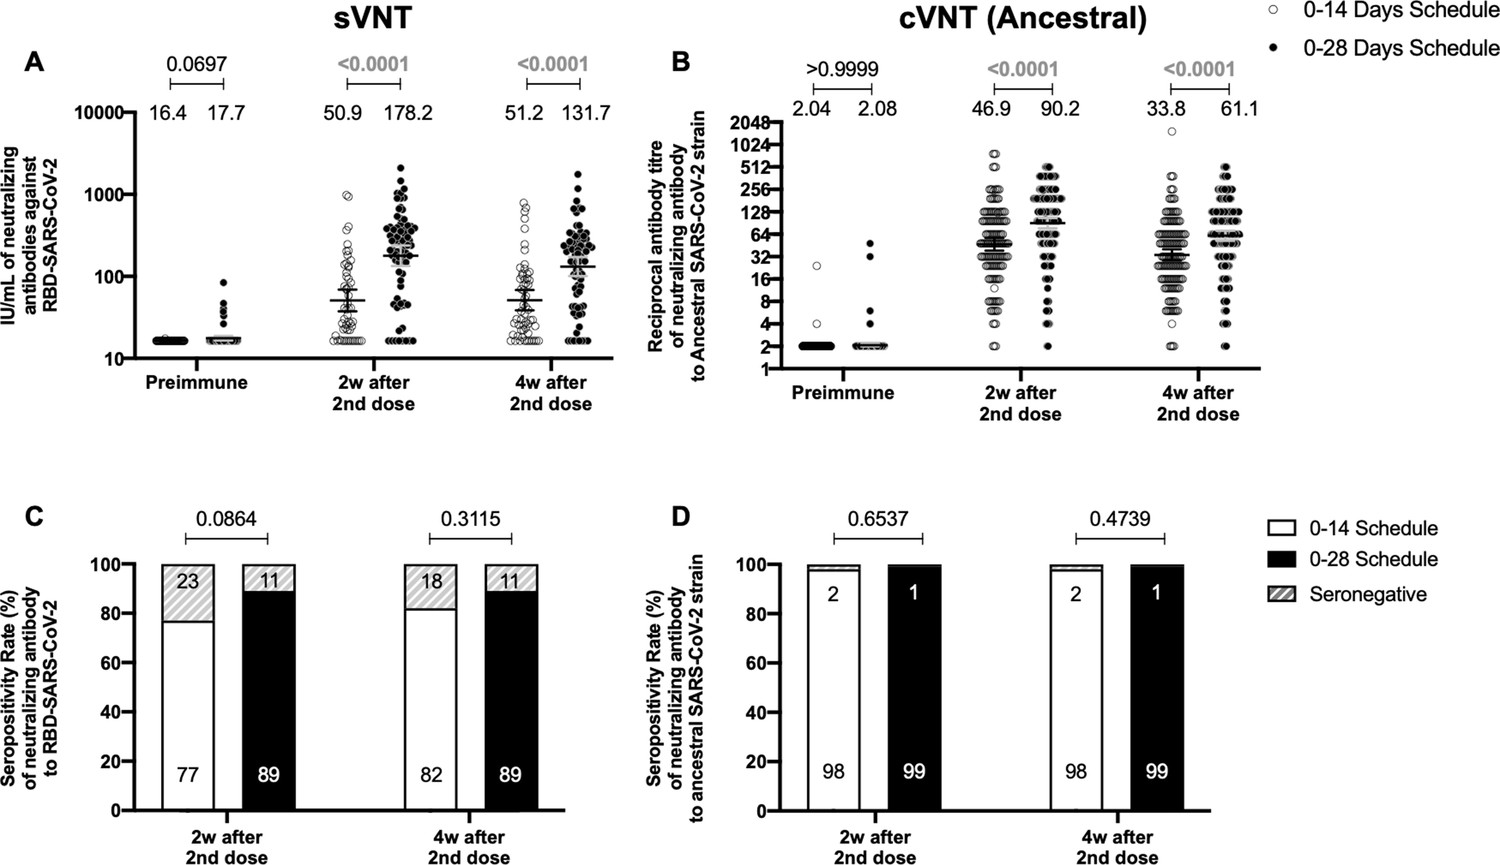
Circulating neutralizing antibodies against severe acute respiratory syndrome coronavirus 2 (SARS-CoV-2) measured by surrogate virus neutralization test (sVNT) and conventional virus neutralization test (cVNT) for the Ancestral strain in immunized volunteers.
Neutralizing antibody titers were evaluated with an sVNT, which quantifies the interaction between S1-RBD and human ACE2 (hACE2) pre-coated on ELISA plates (A,C) and with a cVNT, which quantifies the cytopathic effect (CPE) induced in Vero cells as plaques formation (B, D). n=372 volunteers for cVNT (Ancestral) and n=130 volunteers for sVNT (for both schedules). Data is represented as the reciprocal antibody titer of neutralizing antibody versus the different times evaluated. Numbers above the bars show either the arbitrary international units (IU) (A) or the geometric mean titer (GMT) (B), and the error bars indicate the 95% CI. Seropositivity rates are also displayed (C, D). Data from IU and GMT values were analyzed by a two-tailed unpaired t-test of the base 2 logarithms of data to compare immunization schedules. Data from seropositivity rates were analyzed by a two-tailed Fisher’s exact test. Numbers above each bracket represent calculated p values comparing both immunization schedules. Statistical significance was set at p<0.05 and highlighted numbers indicate statistical significance.
-
Figure 1—source data 1
Data used to generate Figure 1, Figure 1—figure supplement 3, and Figure 5.
- https://cdn.elifesciences.org/articles/81477/elife-81477-fig1-data1-v2.xlsx
Figure 1—figure supplement 1
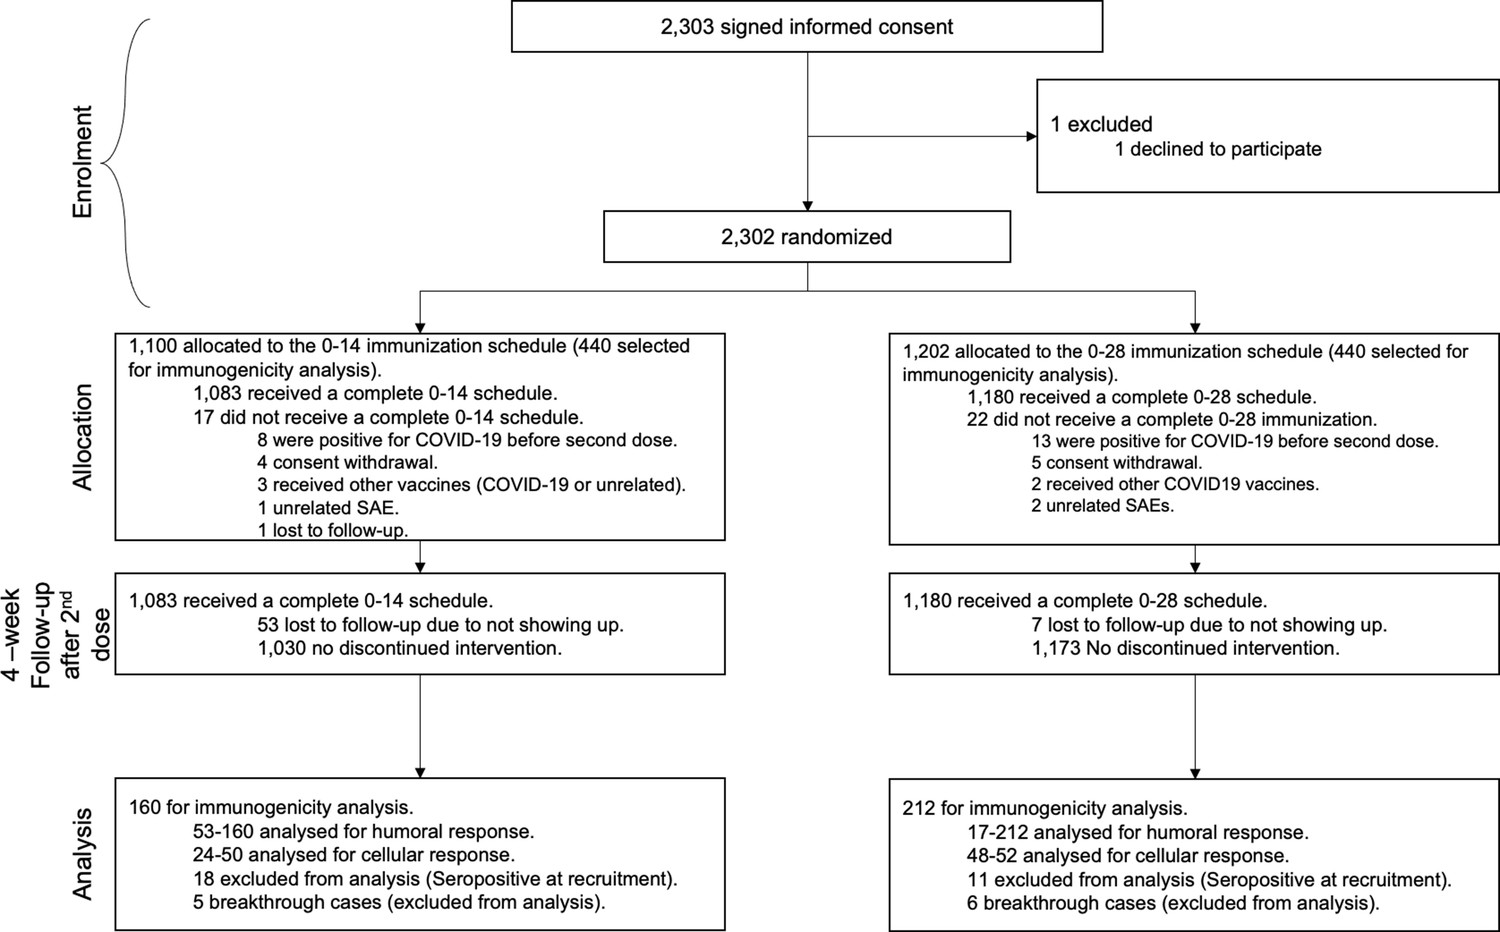
Study design for this phase 3 clinical trial comparing two different immunization schedules as of August 2021.
This study aims to characterize the differential immune response elicited by two immunization schedules with CoronaVac, with each dose separated by either 2 or 4 weeks.
Figure 1—figure supplement 2
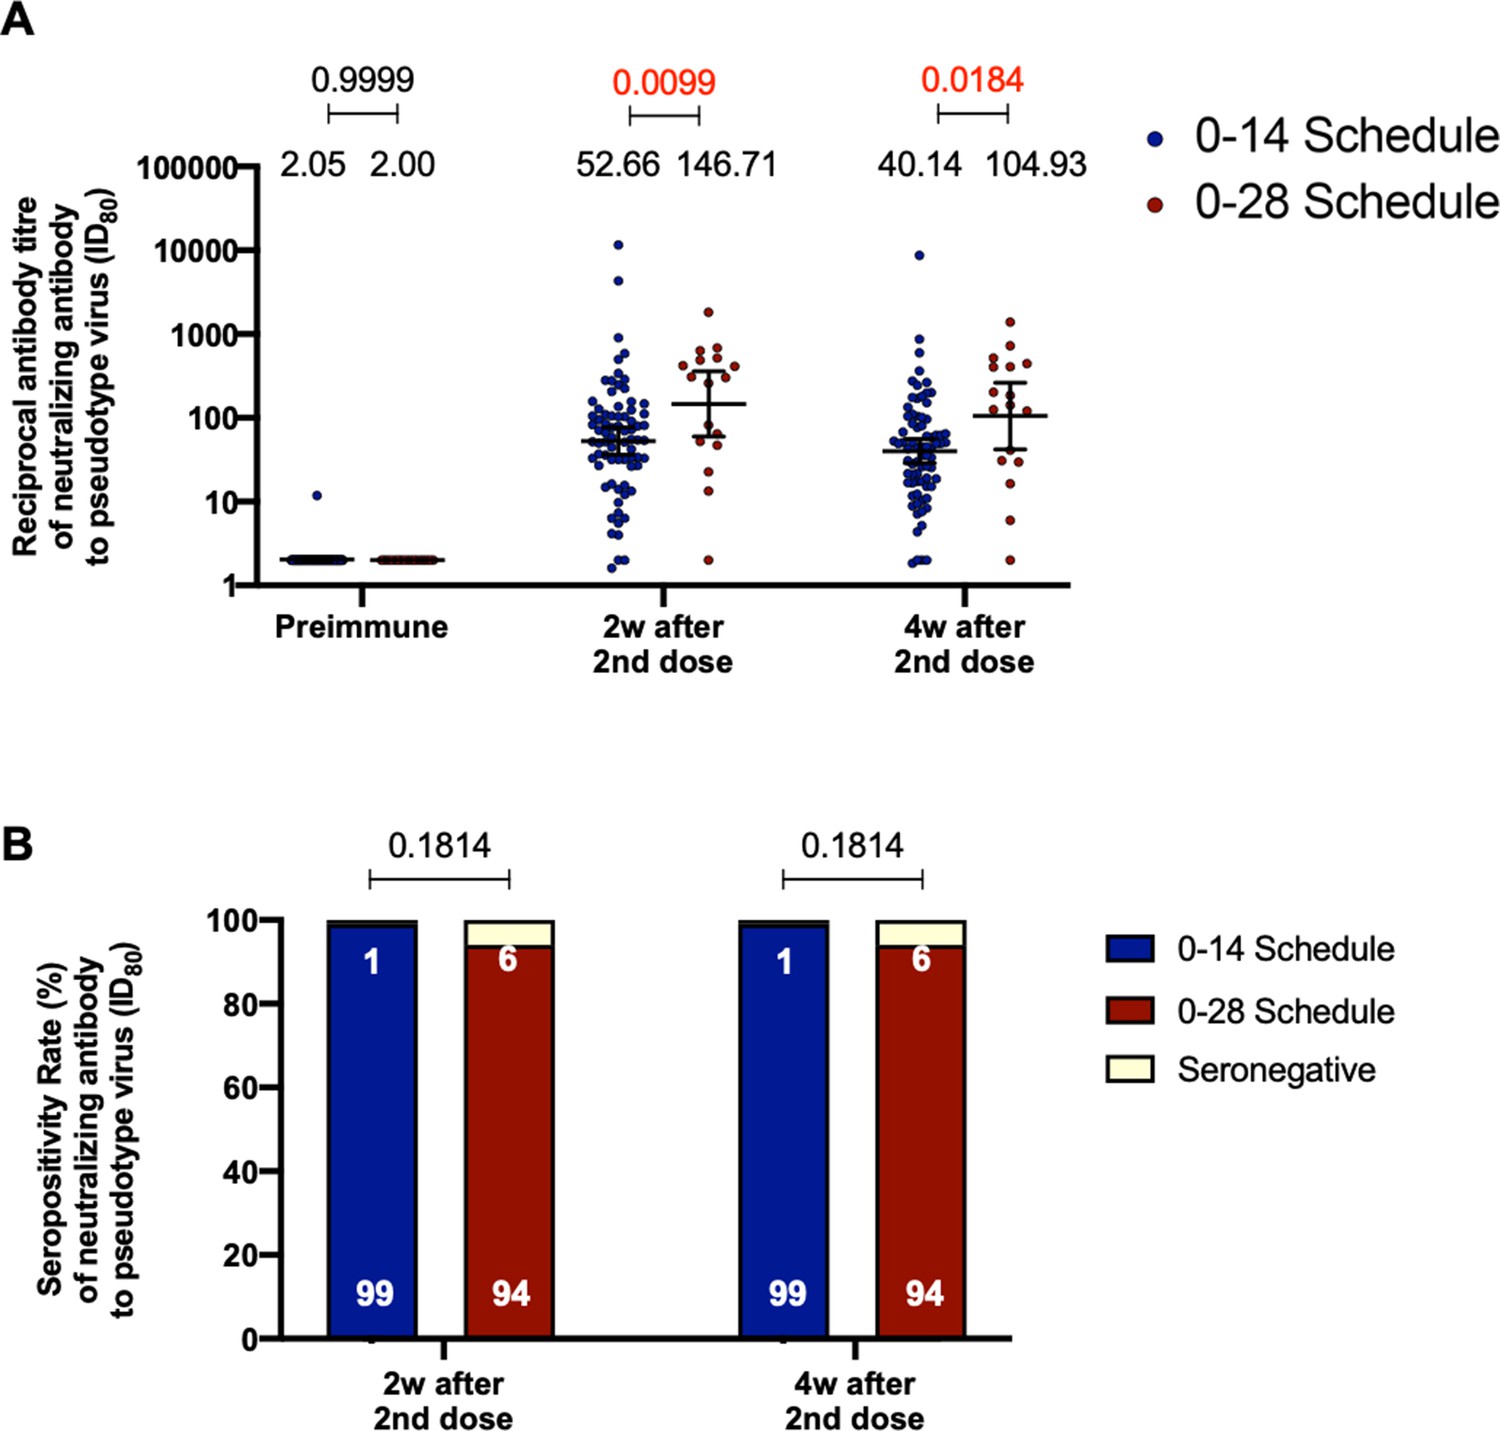
Geometric mean titer (GMT) values and seropositivity rates of circulating neutralizing antibodies against severe acute respiratory syndrome coronavirus 2 (SARS-CoV-2) measured through pseudotyped virus neutralization test (pVNT) (ID80).
Neutralizing antibody titers were evaluated with a pVNT. n=94 volunteers for both schedules. In (A), data is represented as the reciprocal antibody titer of neutralizing antibody versus the different times evaluated. Numbers above the bars show the geometric mean titer (GMT), and the error bars indicate the 95% CI. A two-tailed one-way ANOVA for repeated measures was performed over the Log2 of antibody titers, followed by Bonferroni’s multiple comparisons test to compare geometric mean units (GMUs). (B) Data from seroconversion rates were analyzed by a two-tailed Fisher’s exact test. Values above the lines indicate p values. Significant p values are shown in red. Statistical significance was set at p<0.05.
-
Figure 1—figure supplement 2—source data 1
Data used to generate Figure 1—figure supplement 2.
- https://cdn.elifesciences.org/articles/81477/elife-81477-fig1-figsupp2-data1-v2.xlsx
Figure 1—figure supplement 3

Circulating neutralizing antibodies against severe acute respiratory syndrome coronavirus 2 (SARS-CoV-2) measured through surrogate virus neutralization test (sVNT), conventional virus neutralization test (cVNT), and pseudotyped virus neutralization test (pVNT) (ID80) in volunteers immunized with CoronaVac aged 18–59 and ≥60 years.
Neutralization assays were performed with an sVNT, which quantifies the interaction between S1-RBD and human ACE2 (hACE2) pre-coated on ELISA plates (A); with a cVNT, which quantifies the cytopathic effect induce in Vero cells as plaques formation for the Ancestral and D614G strains (B); and with a pVNT (C). Results were obtained from volunteers aged 18–59 years (blue circles for the 0–14 schedule and blue triangles for the 0–28 schedule) and ≥60 years (red circles for the 0–14 schedule and red triangles for the 0–28 schedule) before immunization (0 days), 2 weeks after second dose, and 4 weeks after the second dose. Data is represented as the reciprocal antibody titer versus time after the second dose. Numbers above the bars show the international units (IU) or geometric mean titer (GMT), and the error bars indicate the 95% CI. A two-tailed one-way ANOVA for repeated measures was performed over the Log2 of antibody titers, followed by Bonferroni’s multiple comparisons test to compare between schedules and age groups in each schedule. Values above the lines indicate p values. Significant p values are shown in red. Statistical significance was set at p<0.05.
Figure 2
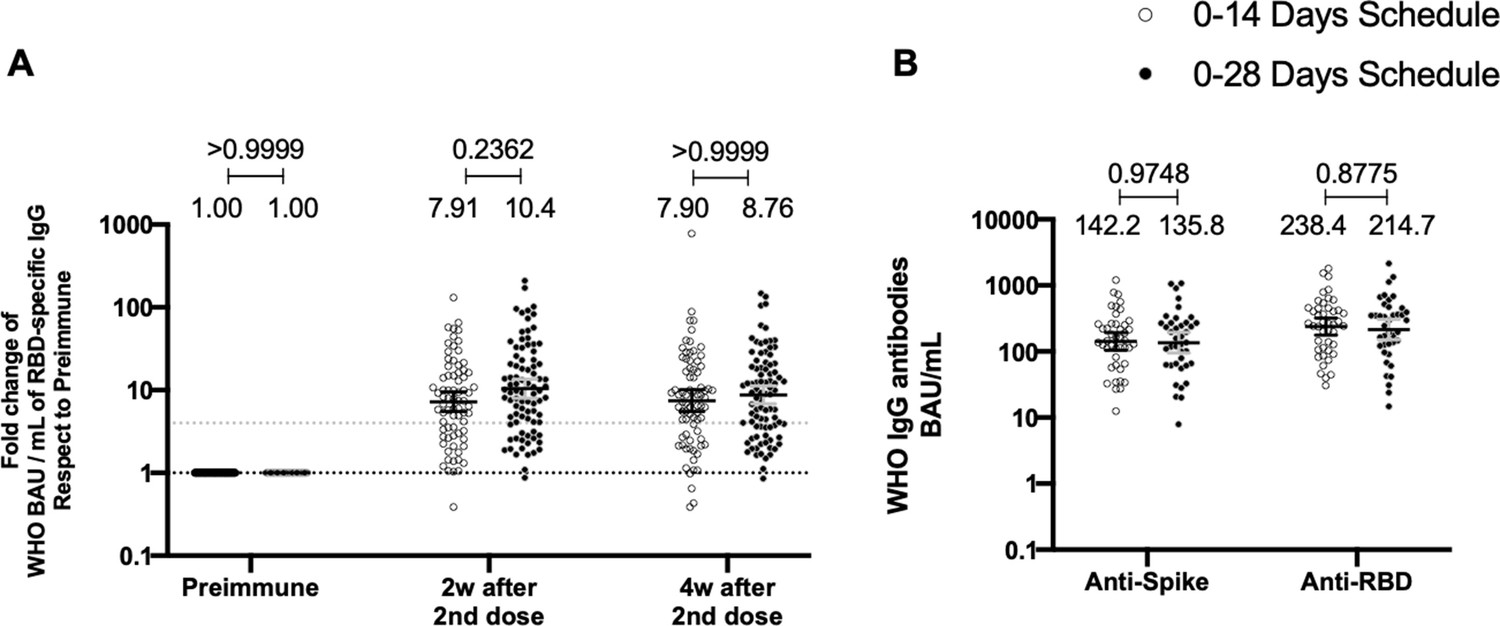
Total anti-S1 and anti-RBD antibodies circulating in immunized volunteers.
Concentrations of IgG antibodies after two doses of CoronaVac were evaluated for immunized volunteers before the first (preimmune) and second dose and 2 and 4 weeks after the second. Specific IgG against the S1-RBD and the spike protein of severe acute respiratory syndrome coronavirus 2 (SARS-CoV-2) were measured. n=162 volunteers for ELISA assays (A) and n=44 volunteers for meso-scale discovery (MSD) assays (B). Data are expressed as the reciprocal antibody titer in arbitrary WHO international unit versus the different times evaluated. Error bars indicate the 95% CI. Spots represent individual values of each volunteer, with the numbers above each set of spots showing the geometric mean unit (GMU) estimates. Data were analyzed using a two-tailed unpaired t-test of the Log2 of data to compare immunization schedules. Numbers above each bracket represent calculated p values comparing both immunization schedules. Statistical significance was set at p<0.05 . Dotted line on A is showing a value of 4, which is the threshold established for the seroconversion rate of each volunteer. Therefore, every spot over the dotted line represents volunteers that were considered positive for seroconversion relative to their preimmune sample.
-
Figure 2—source data 1
Data used to generate Figure 2.
- https://cdn.elifesciences.org/articles/81477/elife-81477-fig2-data1-v2.xlsx
Figure 3 with 3 supplements
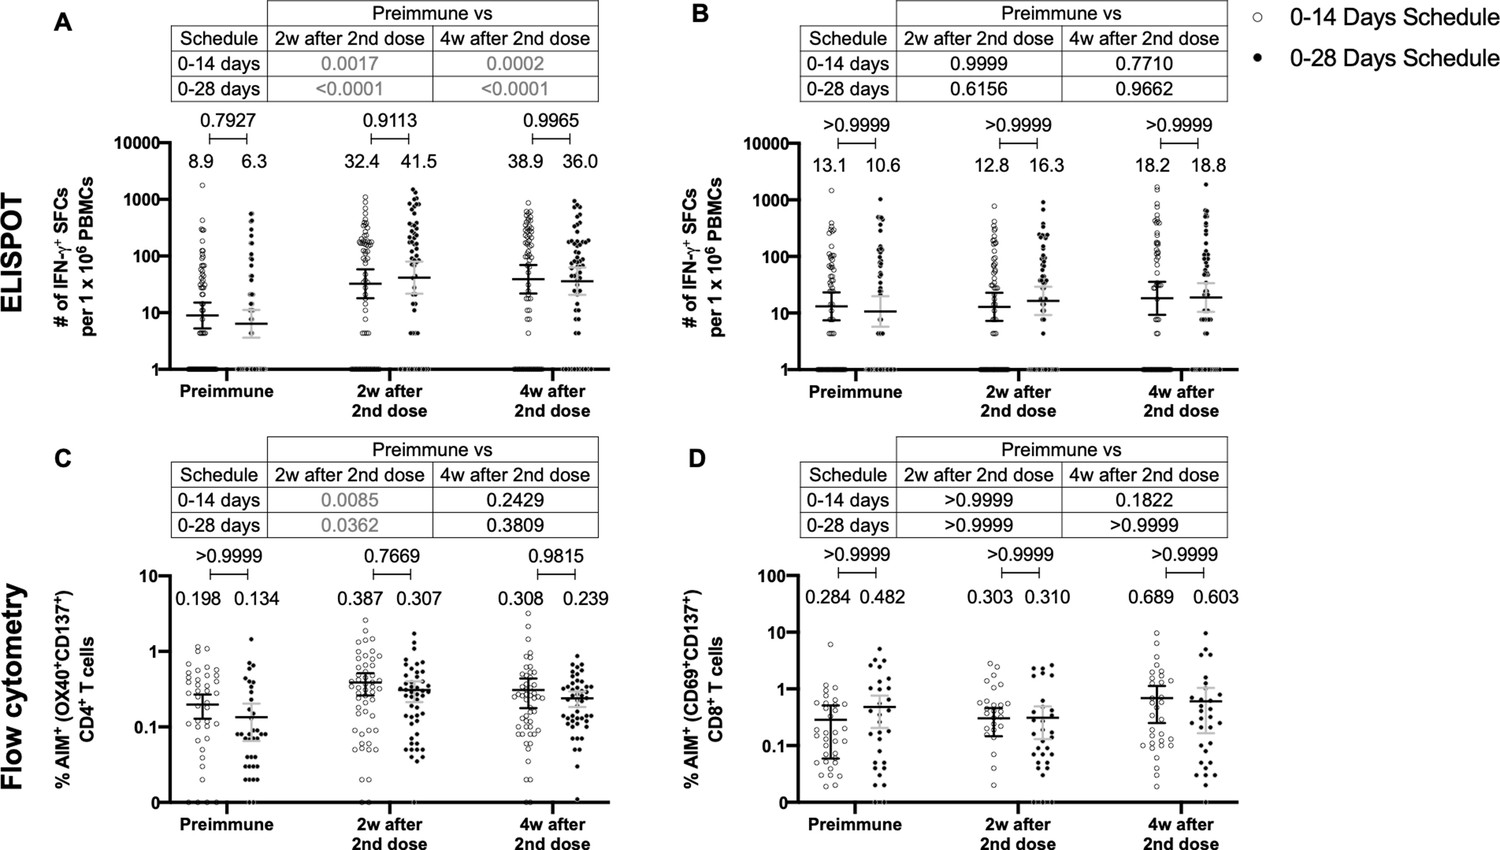
Similar levels of interferon (IFN)-γ-secreting cells and expression of activation-induced markers (AIM) on T cells are found upon stimulation with Mega Pools of peptides derived from severe acute respiratory syndrome coronavirus 2 (SARS-CoV-2) for both immunization schedules with CoronaVac.
Total number of IFN-γ+ spot forming cells (SFCs) were determined by ELISPOT. Data were obtained upon stimulation of peripheral blood mononuclear cells (PBMCs) for 48 hr with MP-S and -R (A) or with MP-CD8A and -B (B). The percentage of activated CD4+ (AIM+ [OX40+, CD137+]) and CD8+ (AIM+ [CD69+, CD137+]) T cells was determined by flow cytometry, upon stimulation for 24 hr with MP-S and -R (C), or with MP-CD8A and -B (D) in samples obtained before the first (preimmune) and second dose, and 2 and 4 weeks after the second dose. n=124 samples stimulated with MP-S and -R for ELISPOT (A). n=117 samples stimulated with MP-CD8A and -B for ELISPOT (B). n=116 stimulated with MP-S and -R for flow cytometry (C). n=110 samples stimulated with MP-CD8A and -B for flow cytometry (D) (for both schedules). Numbers above the bars show the mean and the error bars correspond to the 95% CI. Data were analyzed by a mixed-effect two-way ANOVA, followed by a Bonferroni’s post hoc test to compare immunization schedules. Numbers above each bracket represent calculated p values comparing both immunization schedules. Statistical significance was set at p<0.05 and highlighted numbers indicate statistical significance.
-
Figure 3—source data 1
Data used to generate Figure 3, Figure 3—figure supplements 1–3.
- https://cdn.elifesciences.org/articles/81477/elife-81477-fig3-data1-v2.xlsx
Figure 3—figure supplement 1
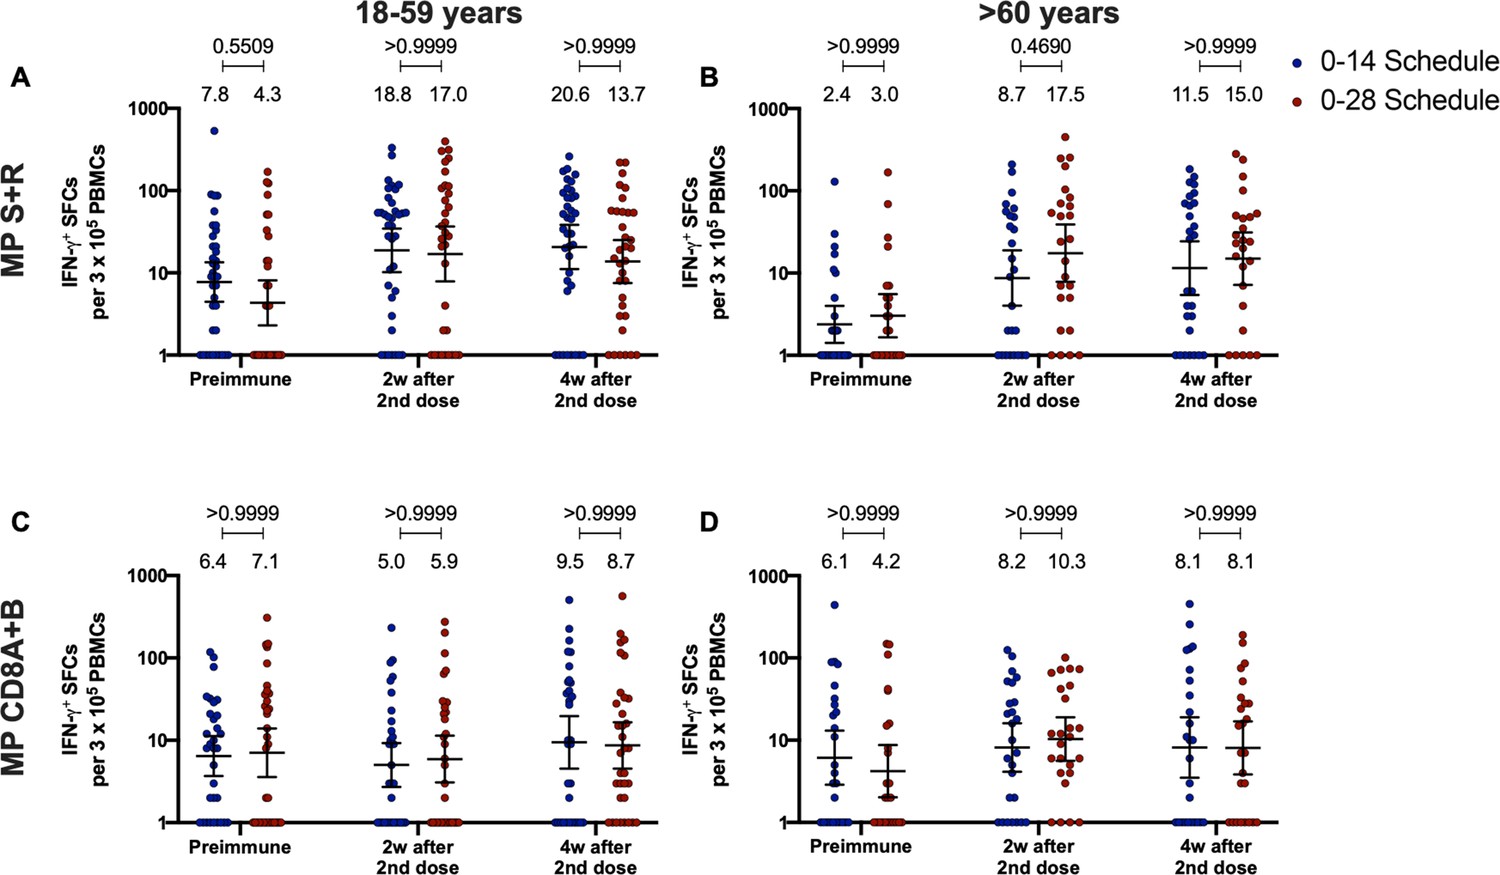
Total number of interferon (IFN)-γ+ spot forming cells (SFCs) induced upon stimulation with Mega Pools (MPs) of peptides derived from severe acute respiratory syndrome coronavirus 2 (SARS-CoV-2) proteome in volunteers immunized with CoronaVac aged 18–59 and ≥60 years.
Changes in the secretion of IFN-γ were measured, determined as the number of SFCs per 3×10⁵ peripheral blood mononuclear cell (PBMC). Data was obtained upon stimulation of PBMC with MP-S+R (A), and upon stimulation of PBMC with MP-CD8A+B (B), for 48 hr in samples obtained before immunization, 2 weeks after the second dose, and 4 weeks after the second dose. All data were normalized for DMSO unspecific stimulation. Data are presented as geometric means and error bars represent the 95% CI. A two-tailed one-way ANOVA for repeated measures was performed over the Log10 of SFCs, followed by Bonferroni’s multiple comparisons test to compare between schedules. Values above the lines indicate p values. Significant p values are shown in red. Statistical significance was set at p<0.05.
Figure 3—figure supplement 2
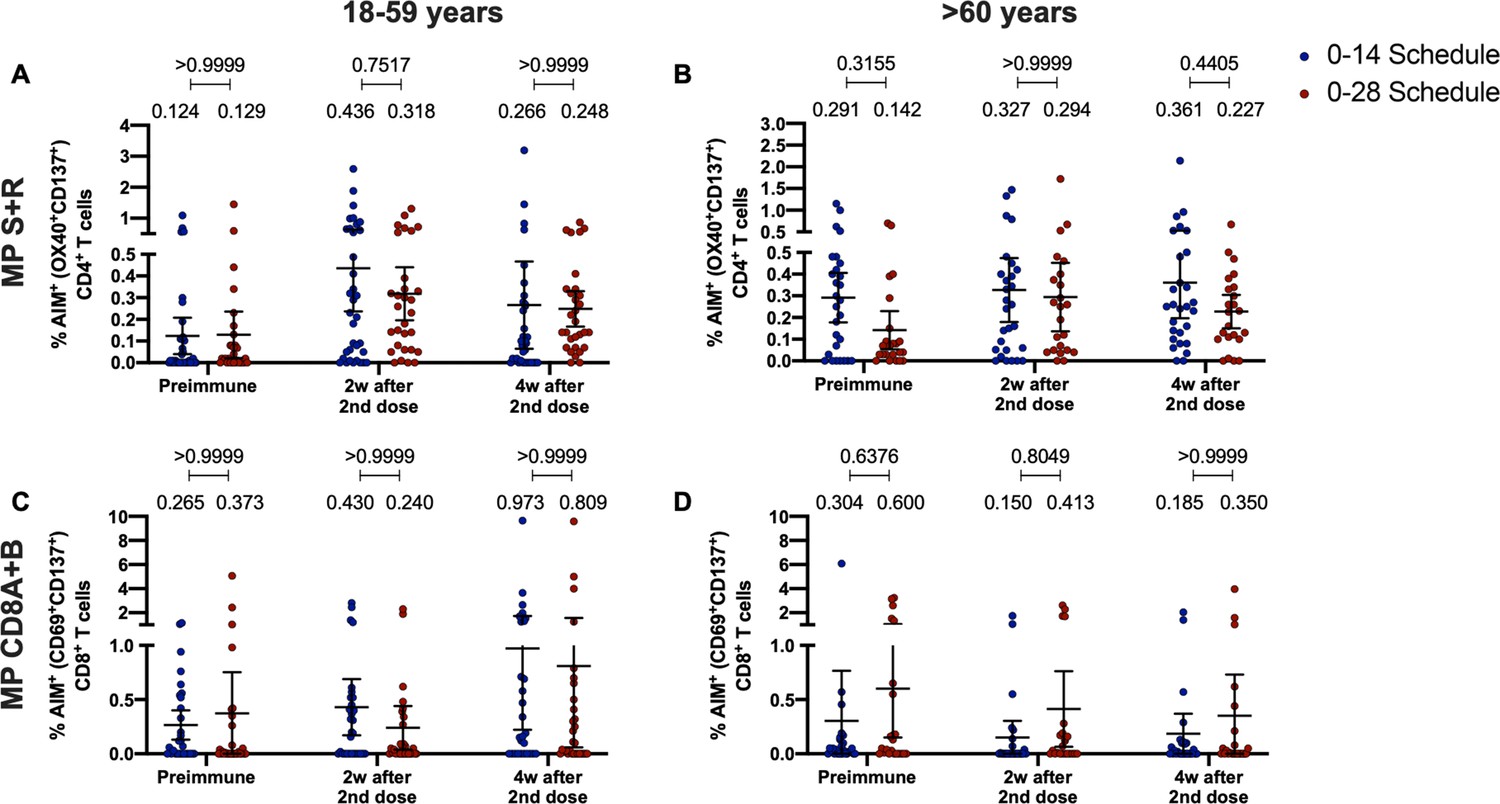
Percentage of activation-induced markers (AIM+) T cells induced upon stimulation with Mega Pools (MPs) of peptides derived from severe acute respiratory syndrome coronavirus 2 (SARS-CoV-2) proteome in volunteers immunized with CoronaVac aged 18–59 and ≥60 years.
The percentage of activated CD4+ (AIM+ [OX40+, CD137+]) and CD8+ (AIM+ [CD69+, CD137+]) T cells was determined by flow cytometry, upon stimulation for 24 hr with MP-S and -R (A–B), and with MP-CD8A and -B (C–D) in samples obtained before the first (preimmune) and second dose, and 2 and 4 weeks after the second dose. Data are presented as means and error bars represent the 95% CI. A two-tailed one-way ANOVA for repeated measures was performed, followed by Bonferroni’s multiple comparisons test to compare between schedules. Values above the lines indicate p values. Significant p values are shown in red. Statistical significance was set at p<0.05.
Figure 3—figure supplement 3
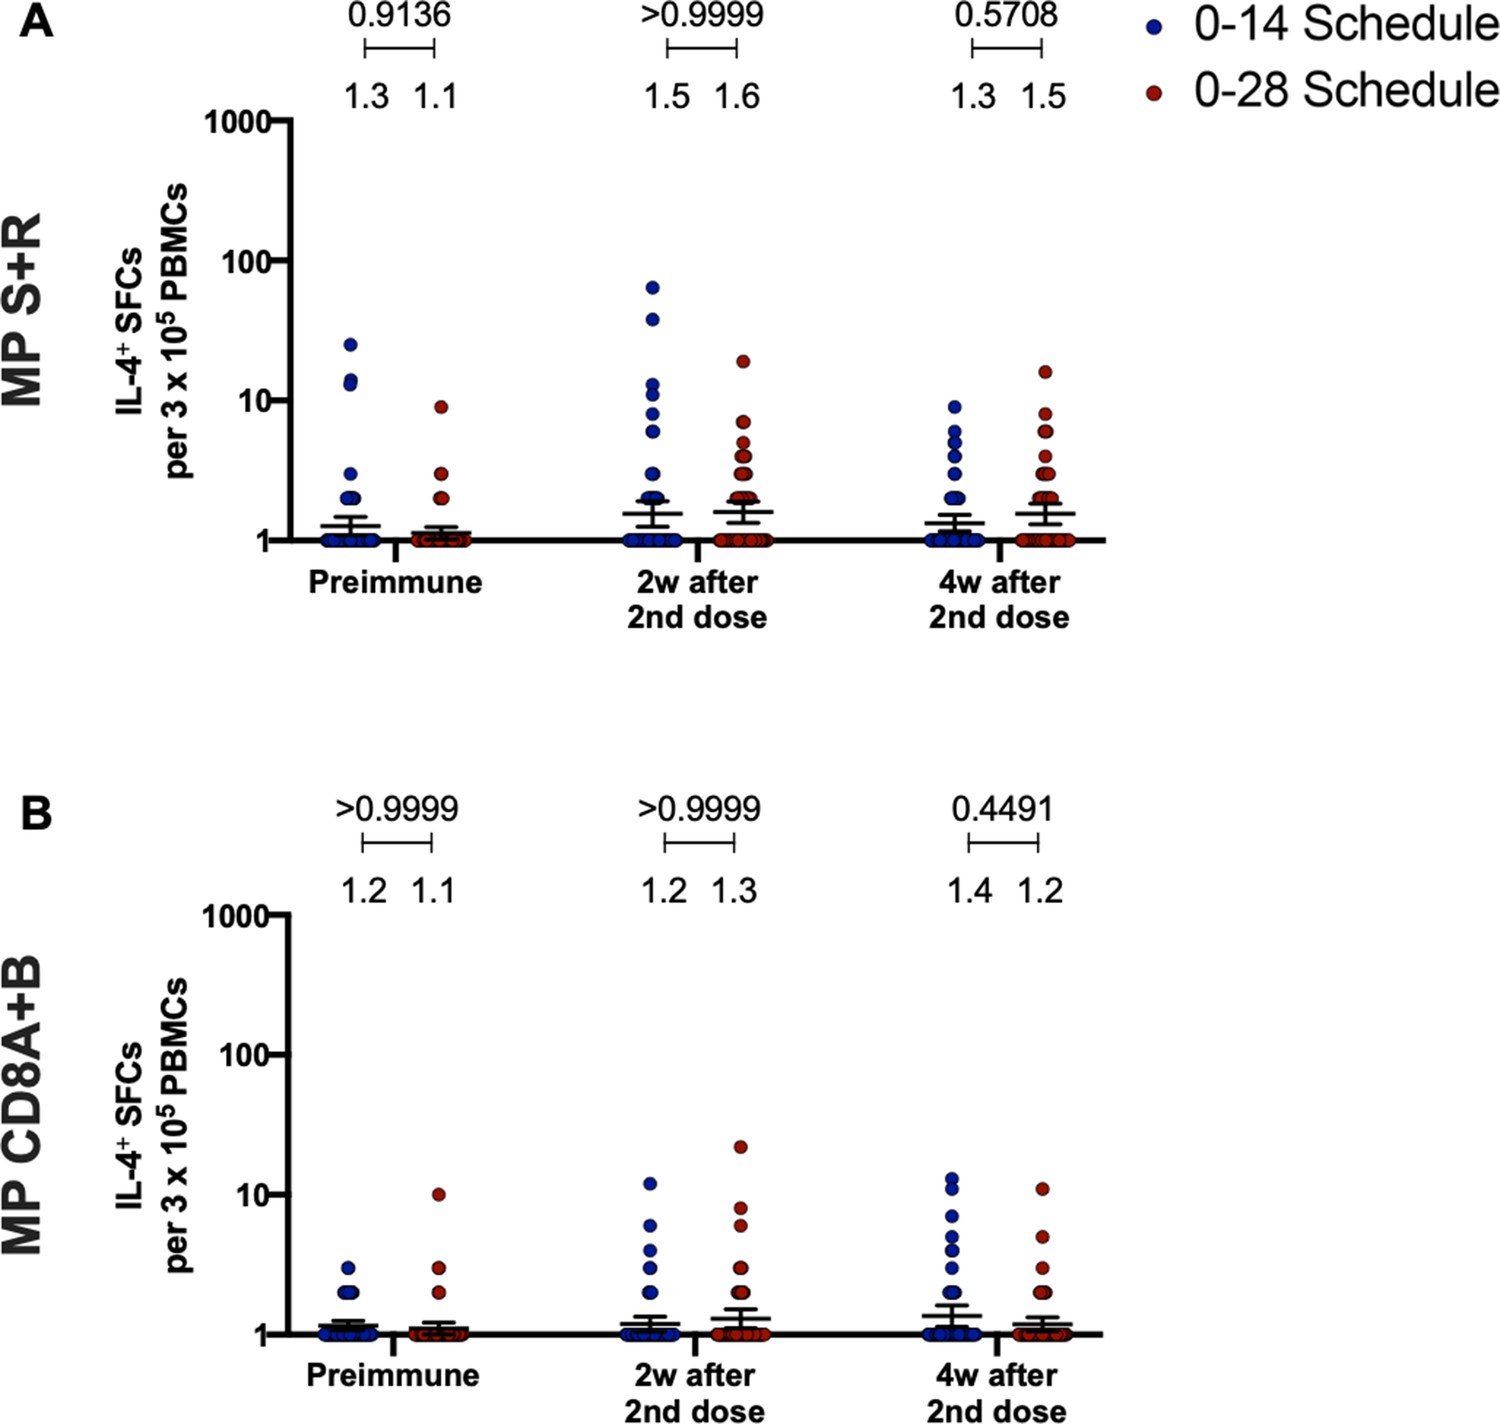
Immunization with CoronaVac in a 0–28 schedule does not induce major IL-4 responses in peripheral blood mononuclear cells (PBMCs).
Changes in the secretion of IL-4 were measured, determined as the number of spot forming cells (SFCs) per 3×10⁵ PBMC. Data was obtained upon stimulation of PBMC with MP-S+R (A), and upon stimulation of PBMC with MP-CD8A+B (B), for 48 hr in samples obtained before immunization, 2 weeks after the second dose, and 4 weeks after the second dose. All data were normalized for DMSO unspecific stimulation. Data are presented as geometric means and error bars represent the 95% CI. A two-tailed one-way ANOVA for repeated measures was performed over the Log10 of SFCs, followed by Bonferroni’s multiple comparisons test to compare between schedules. Values above the lines indicate p values. Significant p values are shown in red. Statistical significance was set at p<0.05.
-
Figure 3—figure supplement 3—source data 1
Data used to generate Figure 3—figure supplement 3 and Figure 5.
- https://cdn.elifesciences.org/articles/81477/elife-81477-fig3-figsupp3-data1-v2.xlsx
Figure 4 with 4 supplements
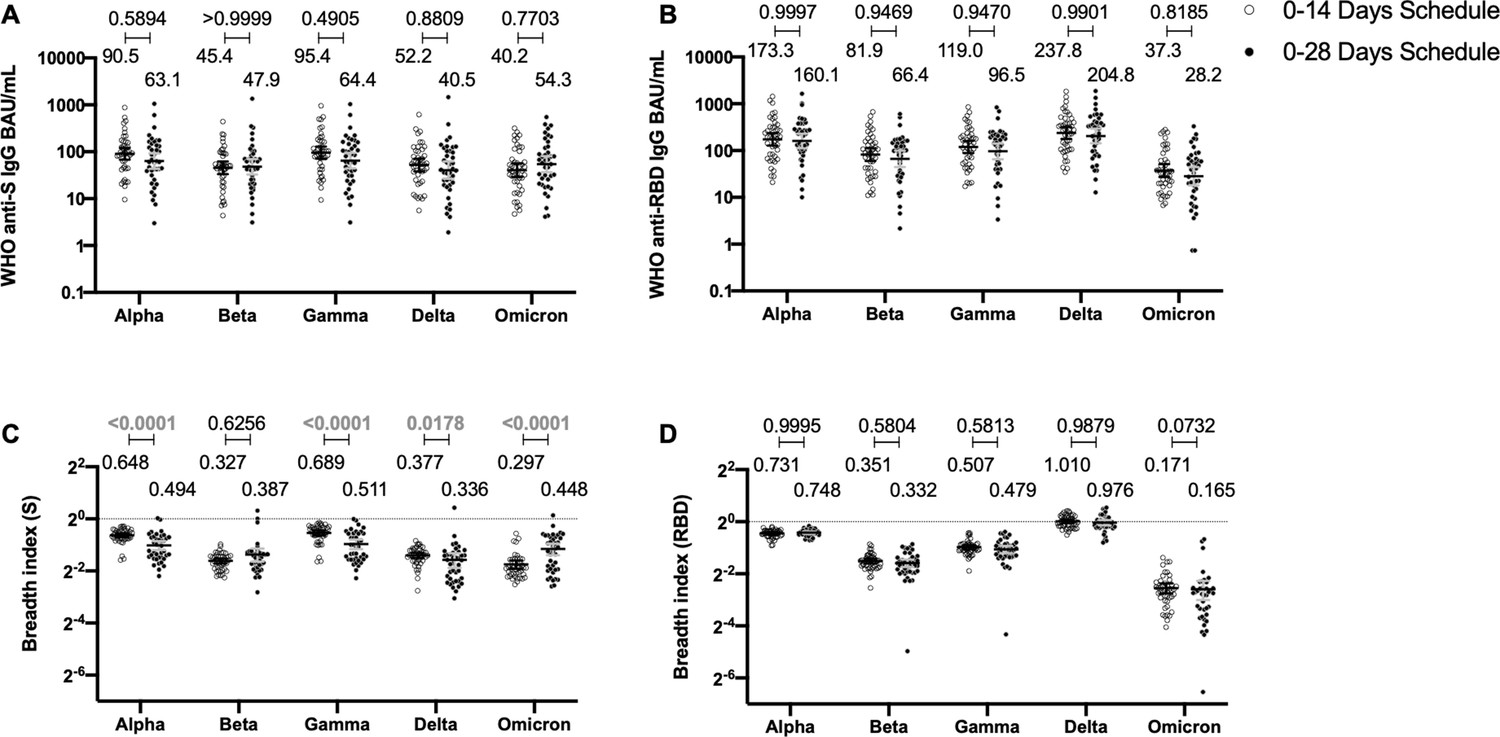
Antibodies against the spike (S) and receptor-binding domain (RBD) from variant of concern (VOC) of severe acute respiratory syndrome coronavirus 2 (SARS-CoV-2) are similar between schedules, while breadth index varies between schedules.
Antibodies concentrations against the S (A) and the RBD (B) of different VOCs of SARS were evaluated through meso-scale discovery (MSD). n=44 volunteers for the 0–14 schedule. n=40 volunteers for the 0–28 schedule. Samples evaluated were obtained at 4 weeks after the second dose. Data is represented as the reciprocal antibody titer of neutralizing antibody versus the different VOCs evaluated. With these values, a breadth index was calculated for each VOC for anti-S (C) and anti-RBD (D) antibodies. Numbers above the bars show either the international units (IU) (A, B) or the breadth index (C, D), and the error bars indicate the 95% CI. Data were analyzed by a mixed-effect two-way ANOVA, followed by a Bonferroni’s post hoc test to compare immunization schedules. Numbers above each bracket represent calculated p values comparing both immunization schedules. Statistical significance was set at p<0.05 and highlighted numbers indicate statistical significance.
-
Figure 4—source data 1
Data used to generate Figure 4 and Figure 4—figure supplements 1–3.
- https://cdn.elifesciences.org/articles/81477/elife-81477-fig4-data1-v2.xlsx
Figure 4—figure supplement 1
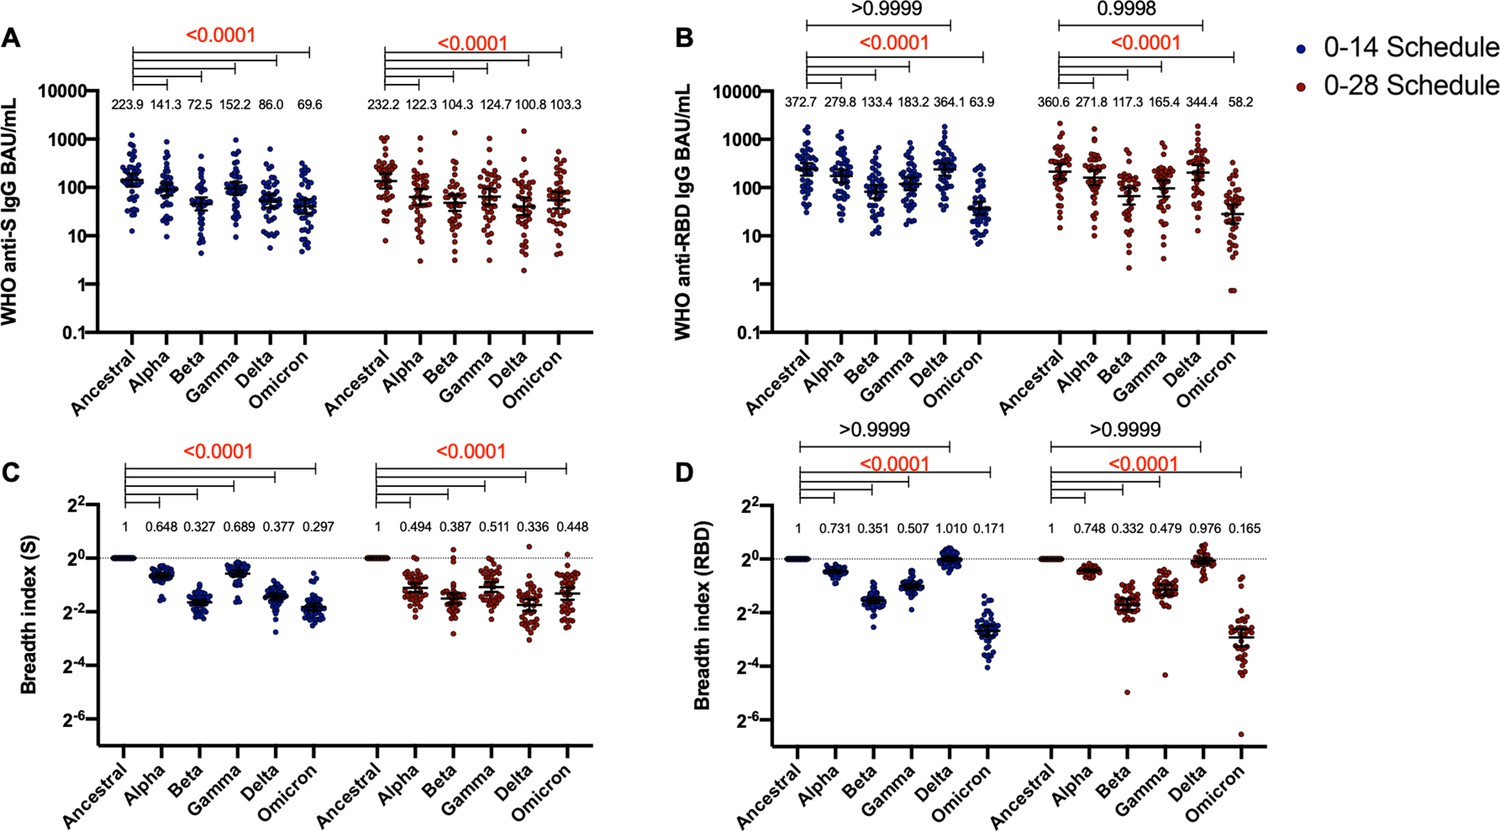
Antibodies against the spike (S) and receptor-binding domain (RBD) from variant of concern (VOC) of severe acute respiratory syndrome coronavirus 2 (SARS-CoV-2) and their breadth indexes are reduced relative to the Ancestral strain, except in the receptor-binding domain (RBD)-related parameters for the Delta strain.
Antibodies concentrations against the S (A) and the RBD (B) of different VOCs of SARS were evaluated through meso-scale discovery (MSD). Results were obtained from 44 volunteers for the 0–14 schedule and 40 volunteers for the 0–28 schedule, from samples obtained at 4 weeks after the second dose. Data is represented as the reciprocal antibody titer of neutralizing antibody versus the different VOCs evaluated. With these values, a breadth index was calculated for each VOC for anti-S (C) and anti-RBD (D) antibodies. Numbers above the bars show either the international units (IU) (A, B) or the breadth index (C, D), and the error bars indicate the 95% CI. Data were analyzed by a repeated measures two-way ANOVA, followed by a Bonferroni’s post hoc test to compare the level of antibodies against each VOC relative to the Ancestral strain. Numbers above each bracket represent calculated p values comparing both immunization schedules. Statistical significance was set at p<0.05 and red numbers indicate statistical significance.
Figure 4—figure supplement 2

Antibodies against the spike (S) and receptor-binding domain (RBD) from variant of concern (VOC) of severe acute respiratory syndrome coronavirus 2 (SARS-CoV-2) are similar between schedules, while breadth index varies between schedules for the 18–59 years age group.
Antibodies concentrations against the S (A) and the RBD (B) of different VOCs of SARS were evaluated through meso-scale discovery (MSD). Results were obtained from 20 volunteers for the 0–14 schedule and 19 volunteers for the 0–28 schedule, from samples obtained at 4 weeks after the second dose. Data is represented as the reciprocal antibody titer of neutralizing antibody versus the different VOCs evaluated. With these values, a breadth index was calculated for each VOC for anti-S (C) and anti-RBD (D) antibodies. Numbers above the bars show either the international units (IU) (A, B) or the breadh index (C, D), and the error bars indicate the 95% CI. Data were analyzed by a mixed-effect two-way ANOVA, followed by a Bonferroni’s post hoc test to compare immunization schedules. Numbers above each bracket represent calculated p values comparing both immunization schedules. Statistical significance was set at p<0.05 and red numbers indicate statistical significance.
Figure 4—figure supplement 3
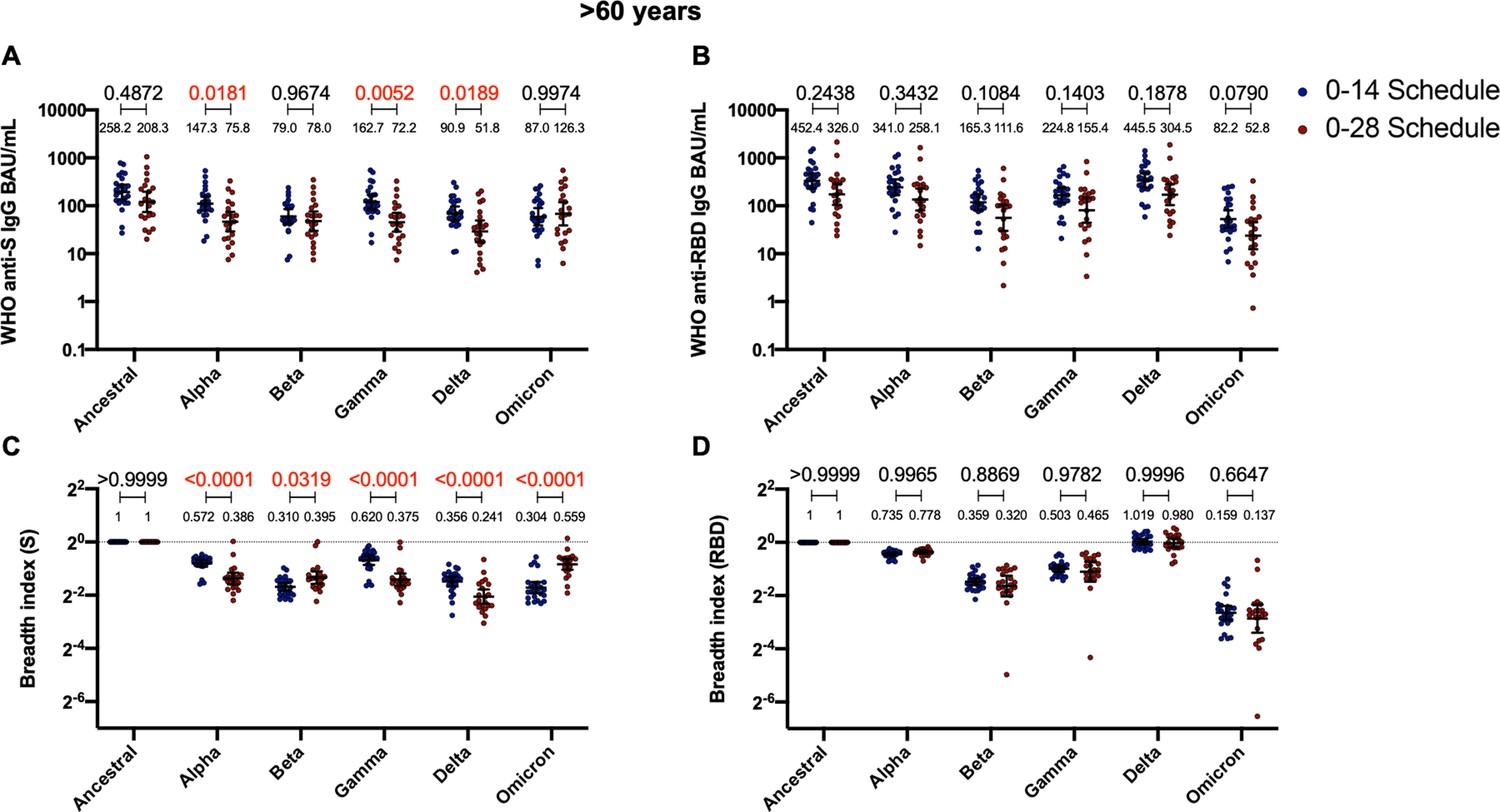
Antibodies against the spike (S) from variant of concern (VOC) of severe acute respiratory syndrome coronavirus 2 (SARS-CoV-2) and breadth indexes vary between schedules for the >60 years age group, while these parameters for anti-receptor-binding domain (RBD) antibodies remain similar.
Antibodies concentrations against the S (A) and the RBD (B) of different VOCs of SARS were evaluated through meso-scale discovery (MSD). Results were obtained from 24 volunteers for the 0–14 schedule and 21 volunteers for the 0–28 schedule, from samples obtained at 4 weeks after the second dose. Data is represented as the reciprocal antibody titer of neutralizing antibody versus the different VOCs evaluated. With these values, a breadth index was calculated for each VOC for anti-S (C) and anti-RBD (D) antibodies. Numbers above the bars show either the international units (IU) (A, B) or the breadh index (C, D), and the error bars indicate the 95% CI. Data were analyzed by a mixed-effect two-way ANOVA, followed by a Bonferroni’s post hoc test to compare immunization schedules. Numbers above each bracket represent calculated p values comparing both immunization schedules. Statistical significance was set at p<0.05 and red numbers indicate statistical significance.
Figure 4—figure supplement 4
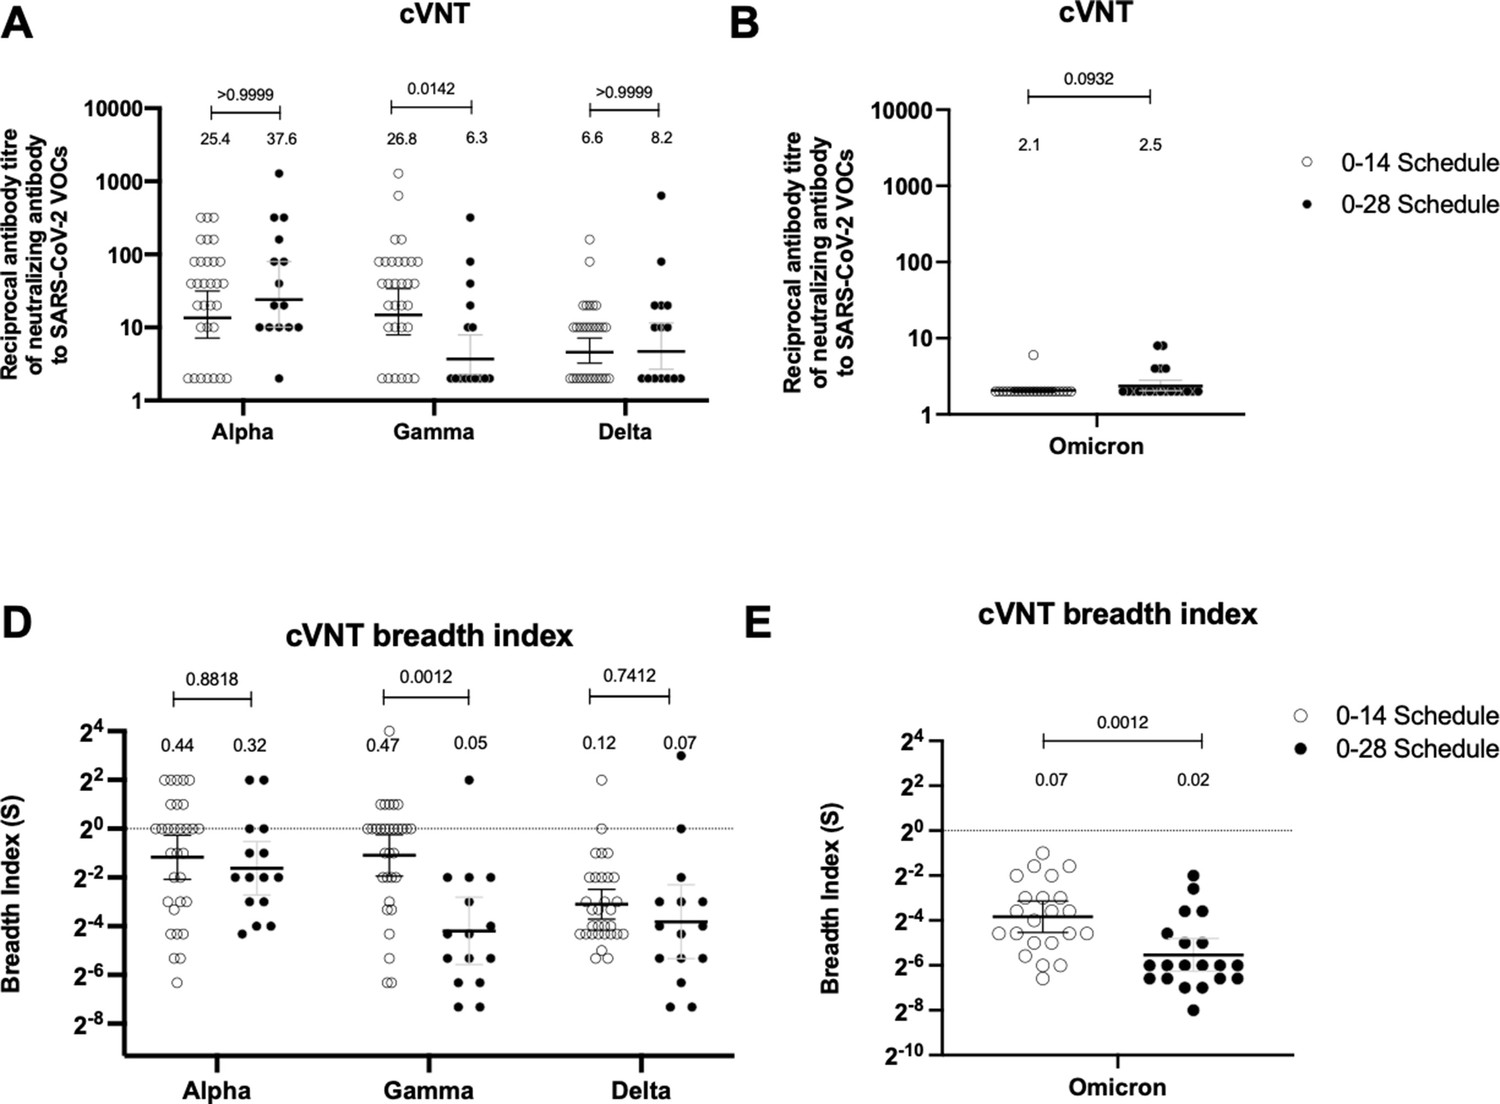
Neutralizing antibodies against the receptor-binding domain (RBD) from variant of concern (VOC) of severe acute respiratory syndrome coronavirus 2 (SARS-CoV-2) are similar between schedules, while breadth index varies between schedules.
Neutralization assays were performed with a conventional virus neutralization test (cVNT), which quantifies the cytopathic effect induce in Vero cells as plaques formation for the strains Alpha, Gamma, and Delta (A) (n=31 volunteers for the 0–14 schedule, n=15 volunteers for the 0–28 schedule); and with cVNT for the Omicron strain (B) (n=22 volunteers for the 0–14 schedule, n=20 volunteers for the 0–28 schedule). Samples evaluated were obtained at 4 weeks after the second dose. Data is represented as the reciprocal antibody titer of neutralizing antibody versus the different VOCs evaluated. With these values, a breadth index was calculated for each VOC for each technique (C, D). Numbers above the bars show either the reciprocal antibody titers (A, B) or the breadth index (C, D), and the error bars indicate the 95% CI. Data were analyzed with a repeated measures two-way ANOVA, followed by a Bonferroni’s post hoc test to compare between VOCs. Numbers above each bracket represent calculated p values comparing both immunization schedules. Statistical significance was set at p<0.05. Data analyses for panels A and C were performed with data previously published (Melo-González et al., 2021).
Figure 5
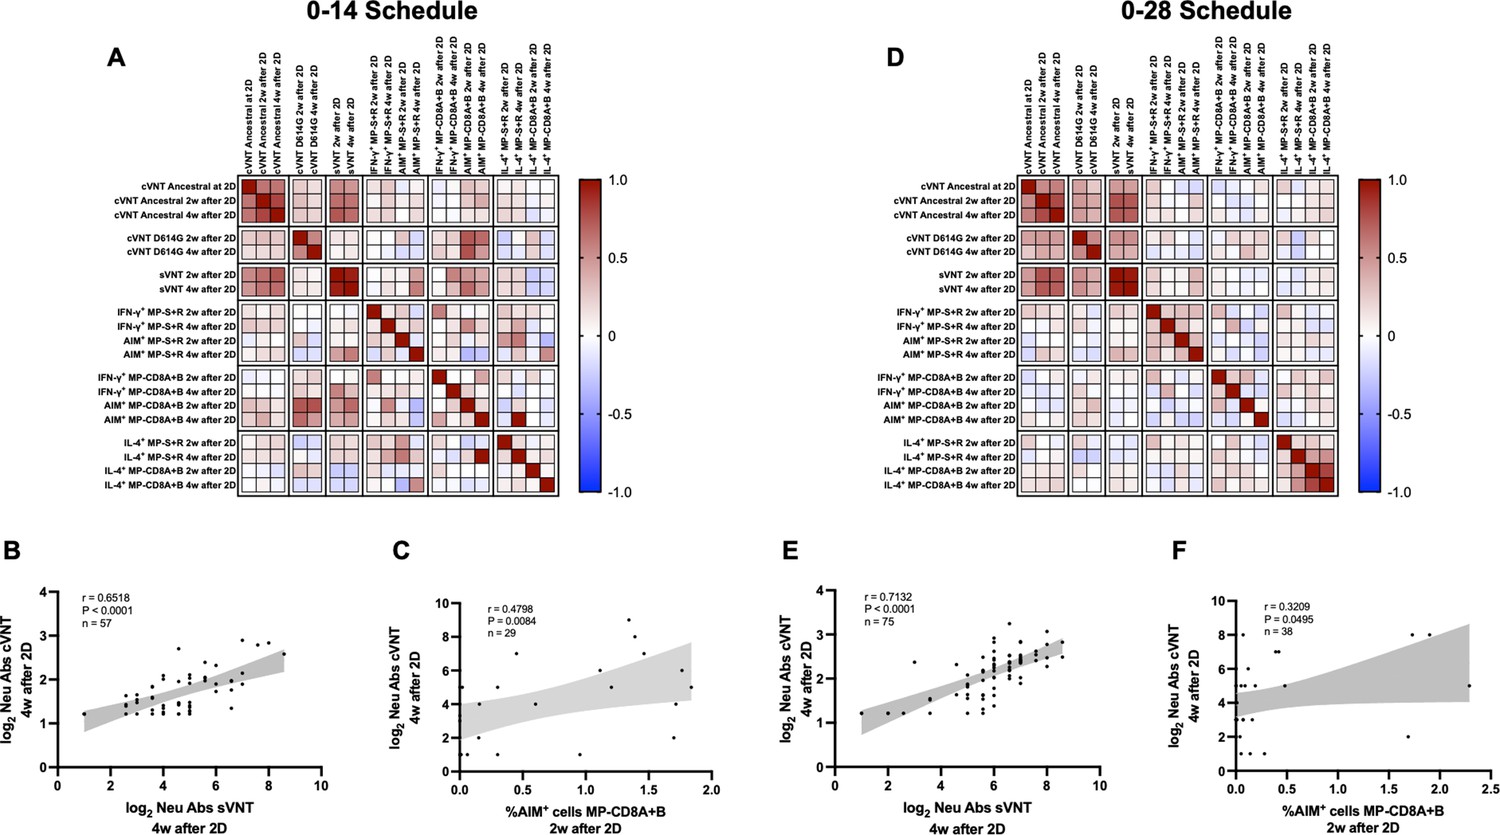
Multivariate analyses show correlated humoral and cellular immune responses.
Pearson correlation matrixes were generated independently for the 0–14 (A) and 0–28 (D) immunization schedules, including humoral and cellular immune response variables. Colors indicate r values, and the scale is shown next to each matrix. Individual selected Pearson correlations for the 0–14 (B–C) and 0–28 (E–F) immunization schedules are shown, indicating n, r, and p values. Statistical significance was set at p<0.05. Shaded gray areas show the 95% CI of the correlations.
Tables
Table 1
Seropositivity rates and geometric mean titer (GMT) values measured for circulating neutralizing antibodies induced by CoronaVac in both immunization schedules and dissected by age group.
| Antibodies evaluated | Schedule | Age group | Indicators | 2 Weeks after second dose | *p Value | 4 Weeks after second dose | †p Value |
|---|---|---|---|---|---|---|---|
| sVNT | 0–14 days | Total vaccine | Seropositivity n/N | 41/53 | 0.018 | 47/57 | 0.1100 |
| % | 77.4 | 82.5 | |||||
| IU/mL | 50.9 | 51.2 | |||||
| 95% CI | 37.4–59.1 | 38.5–68.0 | |||||
| 18–59 years | Seropositivity n/N | 30/32 | 29/32 | ||||
| % | 93.8 | 90.6 | |||||
| IU/mL | 76.0 | 68.8 | |||||
| 95% CI | 50.2–115.1 | 46.0–102.9 | |||||
| ≥60 years | Seropositivity n/N | 11/21 | 18/25 | ||||
| % | 52.3 | 72.0 | |||||
| IU/mL | 27.6 | 35.1 | |||||
| 95% CI | 20.0–38.1 | 24.2–50.8 | |||||
| 0–28 days | Total vaccine | Seropositivity n/N | 66/73 | 0.035 | 66/73 | 0.1100 | |
| % | 90.4 | 90.4 | |||||
| IU/mL | 178.2 | 131.7 | |||||
| 95% CI | 133.5–238.1 | 100.7–172.3 | |||||
| 18–59 years | Seropositivity n/N | 33/33 | 33/33 | ||||
| % | 100 | 100 | |||||
| IU/mL | 255.9 | 178.2 | |||||
| 95% CI | 175.3–373.7 | 123.6–256.9 | |||||
| ≥60 years | Seropositivity n/N | 33/40 | 33/40 | ||||
| % | 82.5 | 82.5 | |||||
| IU/mL | 132.0 | 102.6 | |||||
| 95% CI | 87.0–200.5 | 70.0–150.3 | |||||
| cVNT (Ancestral) | 0–14 days | Total vaccine | Seropositivity n/N | 147/150 | <0.0001 | 156/160 | <0.0001 |
| % | 98.0 | 97.5 | |||||
| GMT | 46.9 | 33.8 | |||||
| 95% CI | 38.6–57.0 | 28.4–40.2 | |||||
| 18–59 years | Seropositivity n/N | 121/121 | 128/128 | ||||
| % | 100 | 100 | |||||
| GMT | 59.2 | 42.6 | |||||
| 95% CI | 48.8–71.8 | 35.7–50.9 | |||||
| ≥60 years | Seropositivity n/N | 26/29 | 28/32 | ||||
| % | 89.7 | 87.5 | |||||
| GMT | 17.3 | 13.1 | |||||
| 95% CI | 10.7–28.0 | 8.9–19.1 | |||||
| 0–28 days | Total vaccine | Seropositivity n/N | 208/210 | <0.0001 | 209/212 | <0.0001 | |
| % | 99.0 | 98.6 | |||||
| GMT | 90.2 | 61.1 | |||||
| 95% CI | 76.8–105.8 | 52.3–71.4 | |||||
| 18–59 years | Seropositivity n/N | 124/125 | 123/124 | ||||
| % | 99.2 | 99.2 | |||||
| GMT | 121.9 | 82.4 | |||||
| 95% CI | 102.5–144.9 | 69.6–97.7 | |||||
| ≥60 years | Seropositivity n/N | 84/85 | 86/88 | ||||
| % | 98.8 | 97.7 | |||||
| GMT | 57.9 | 40.1 | |||||
| 95% CI | 43.7–76.6 | 30.7–52.4 | |||||
| pVNT | 0–14 days | Total vaccine | Seropositivity n/N | 73/77 | <0.0001 | 73/77 | 0.0027 |
| % | 97.3 | 97.3 | |||||
| GMT | 52.7 | 40.1 | |||||
| 95% CI | 36.6–76.4 | 28.9–55.9 | |||||
| 18–59 years | Seropositivity n/N | 48/49 | 48/49 | ||||
| % | 97.9 | 97.9 | |||||
| GMT | 83.3 | 59.0 | |||||
| 95% CI | 53.6–129.5 | 39.3–88.7 | |||||
| ≥60 years | Seropositivity n/N | 25/28 | 25/28 | ||||
| % | 89.2 | 89.2 | |||||
| GMT | 23.1 | 20.0 | |||||
| 95% CI | 13.2–40.7 | 12.3–32.5 | |||||
| 0–28 days | Total vaccine | Seropositivity n/N | 16/17 | 0.0008 | 16/17 | 0.0029 | |
| % | 94.1 | 94.1 | |||||
| GMT | 146.7 | 104.9 | |||||
| 95% CI | 60.0–359.0 | 41.9–262.6 | |||||
| 18–59 years | Seropositivity n/N | 8/8 | 8/8 | ||||
| % | 100 | 100 | |||||
| GMT | 505.9 | 328.7 | |||||
| 95% CI | 306.1–836.0 | 159.6–676.8 | |||||
| ≥60 years | Seropositivity n/N | 8/9 | 8/9 | ||||
| % | 88.8 | 88.8 | |||||
| GMT | 48.8 | 38.0 | |||||
| 95% CI | 13.3–178.6 | 9.56–152.0 |
-
Red values indicate statistically significant results (p<0.05).
-
*
p Values are for comparison of IU/mL or GMT levels between 18 and 59 years and >60 years age groups 2 weeks after the second dose.
-
†
p Values are for comparison of IU/mL or GMT levels between 18 and 59 years and >60 years age groups 4 weeks after the second dose.
Table 2
p Values estimated for neutralization assays evaluated for both immunization schedules.
| Figure | Parameter evaluated | Schedule;preimmune value | Preimmune compared to | ||
|---|---|---|---|---|---|
| 2 Weeks after second dose | 4 Weeks after second dose | ||||
| Figure 1A | sVNT (IU/mL; p value) | 0–14 days; 16.4 | 50.9; <0.0001 | 51.2; <0.0001 | |
| 0–28 days; 17.7 | 178.2; <0.0001 | 131.7; <0.0001 | |||
| Figure 1B | cVNT (Ancestral) (GMT; p value) | 0–14 days; 2.04 | 46.9; <0.0001 | 33.8; <0.0001 | |
| 0–28 days; 2.08 | 90.2; <0.0001 | 61.1; <0.0001 | |||
| Figure 1—figure supplement 2 | pVNT (GMT; p value) | 0–14 days; 2.05 | 52.66; <0.0001 | 40.14; <0.0001 | |
| 0–28 days; 2.0 | 146.71; <0.0001 | 104.93; <0.0001 | |||
-
*p Values were determined by performing one-way ANOVAs for repeated measures over Log10 of data, followed by post hoc Bonferroni's multiple comparisons test. Red values indicate statistically significant results (p<0.05).
Additional files
Download links
A two-part list of links to download the article, or parts of the article, in various formats.
Downloads (link to download the article as PDF)
Open citations (links to open the citations from this article in various online reference manager services)
Cite this article (links to download the citations from this article in formats compatible with various reference manager tools)
Differences in the immune response elicited by two immunization schedules with an inactivated SARS-CoV-2 vaccine in a randomized phase 3 clinical trial
eLife 11:e81477.
https://doi.org/10.7554/eLife.81477


