SARS-CoV-2-specific CD4+ and CD8+ T cell responses can originate from cross-reactive CMV-specific T cells
- Department of Hematology, Leiden University Medical Center, Netherlands
- Department of Medical Microbiology, Leiden University Medical Center, Netherlands
- Department of Pulmonology, Leiden University Medical Center, Netherlands
- Department of Biochemistry and Chemistry, La Trobe Institute for Molecular Science, La Trobe University, Australia
- Department of Biochemistry and Molecular Biology, Monash University, Australia
Figures
Figure 1 with 1 supplement
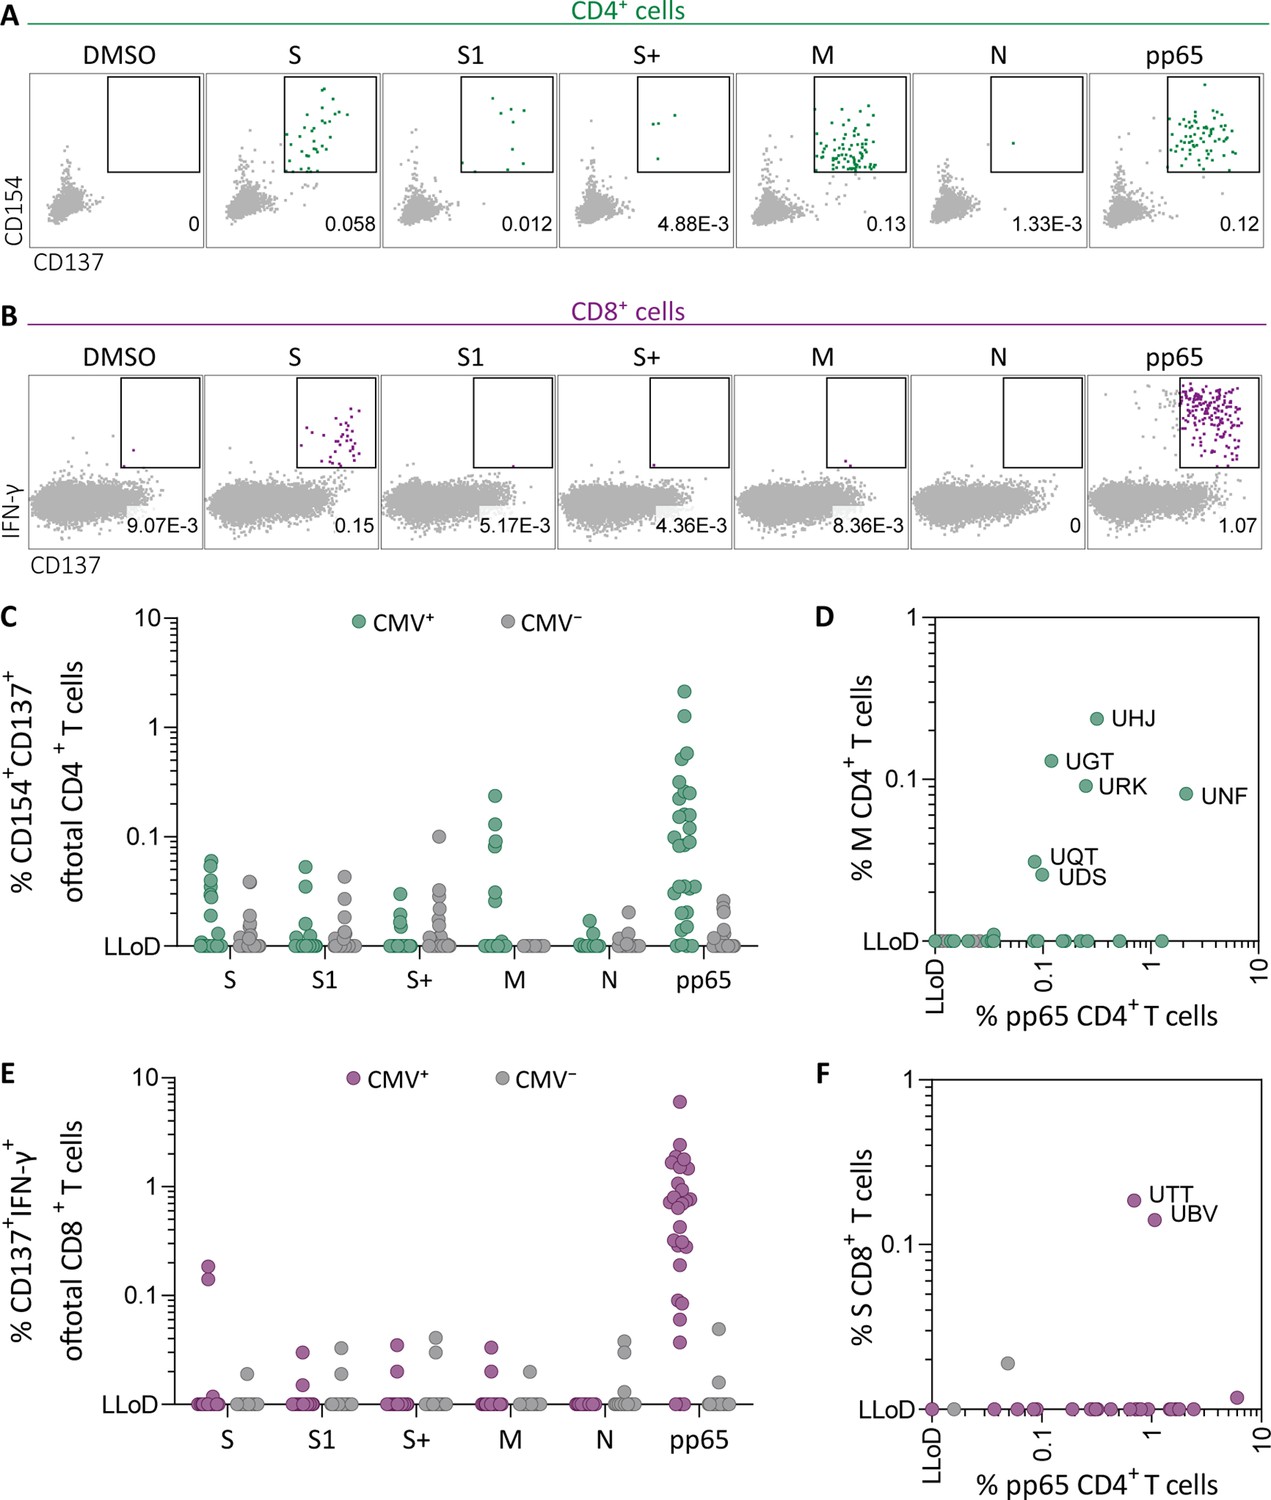
Ex vivo severe acute respiratory syndrome coronavirus 2 (SARS-CoV-2)-specific CD4+ and CD8+ T cell responses in cytomegalovirus (CMV)-positive and -negative unexposed donors.
Pre-pandemic cryo-preserved PBMCs were stimulated using SARS-CoV-2 spike (S, S1, and S+), membrane (M), nucleocapsid (N), and CMV pp65 peptide pools or not stimulated (dimethylsulfoxide; DMSO). (A) A representative flow cytometry example of a CD4+ T cell response in a SARS-CoV-2-unexposed donor. Numbers in plot represent frequencies of CD137+CD154+ cells of total CD4+ T cells. (B) A representative flow cytometry example of a CD8+ T cell response in a SARS-CoV-2-unexposed donor. Numbers in plot represent frequencies of CD137+IFN-γ+ cells of total CD8+ T cells. (C) Scatter plot showing frequencies of CD137+CD154+ cells of total CD4+ T cells of CMV+ (green, N=28) and CMV− (gray, N=39) donors. (D) Frequencies of CD137+CD154+ cells of total CD4+ T cells in the membrane-stimulated condition (membrane response) plotted against pp65-stimulated condition (pp65 response). Three letter codes are anonymized codes of CMV+ (green) and CMV− (gray) donors. (E) Scatter plot showing frequencies of CD137+ IFN-γ+ cells of total CD8+ T cells of CMV+ (green, N=28) and CMV− (gray, N=39) donors. (F) Frequencies of CD137+IFN-γ+ cells of total CD8+ T cells in the spike-stimulated condition (spike response) plotted against pp65-stimulated condition (pp65 response).
-
Figure 1—source data 1
Source data containing the percentages underlying Figure 1C–F.
- https://cdn.elifesciences.org/articles/82050/elife-82050-fig1-data1-v2.xlsx
Figure 1—figure supplement 1
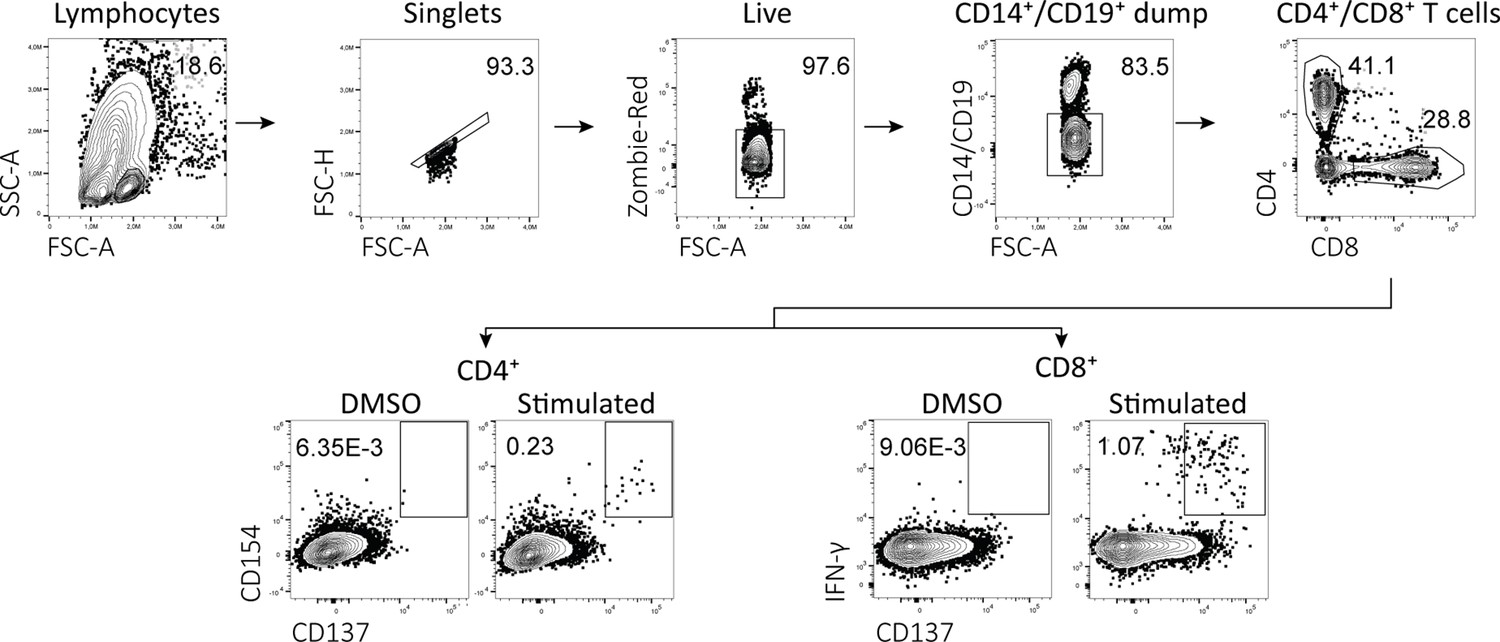
Flow cytometry gating example for peptide stimulation assays.
Representative example of flow cytometry gating strategy for peptide-reactive CD4+ and CD8+ T cells. All events were gated on lymphocytes, single cells, viable cells, CD14 and CD19 negative, and either CD4 or CD8 positive. For CD4+ T cells, activation was measured by upregulation of CD137 and CD154 compared to DMSO. For CD8+ T cells, activation was measured by upregulation of CD137 and IFN-γ production compared to DMSO.
Figure 2 with 3 supplements
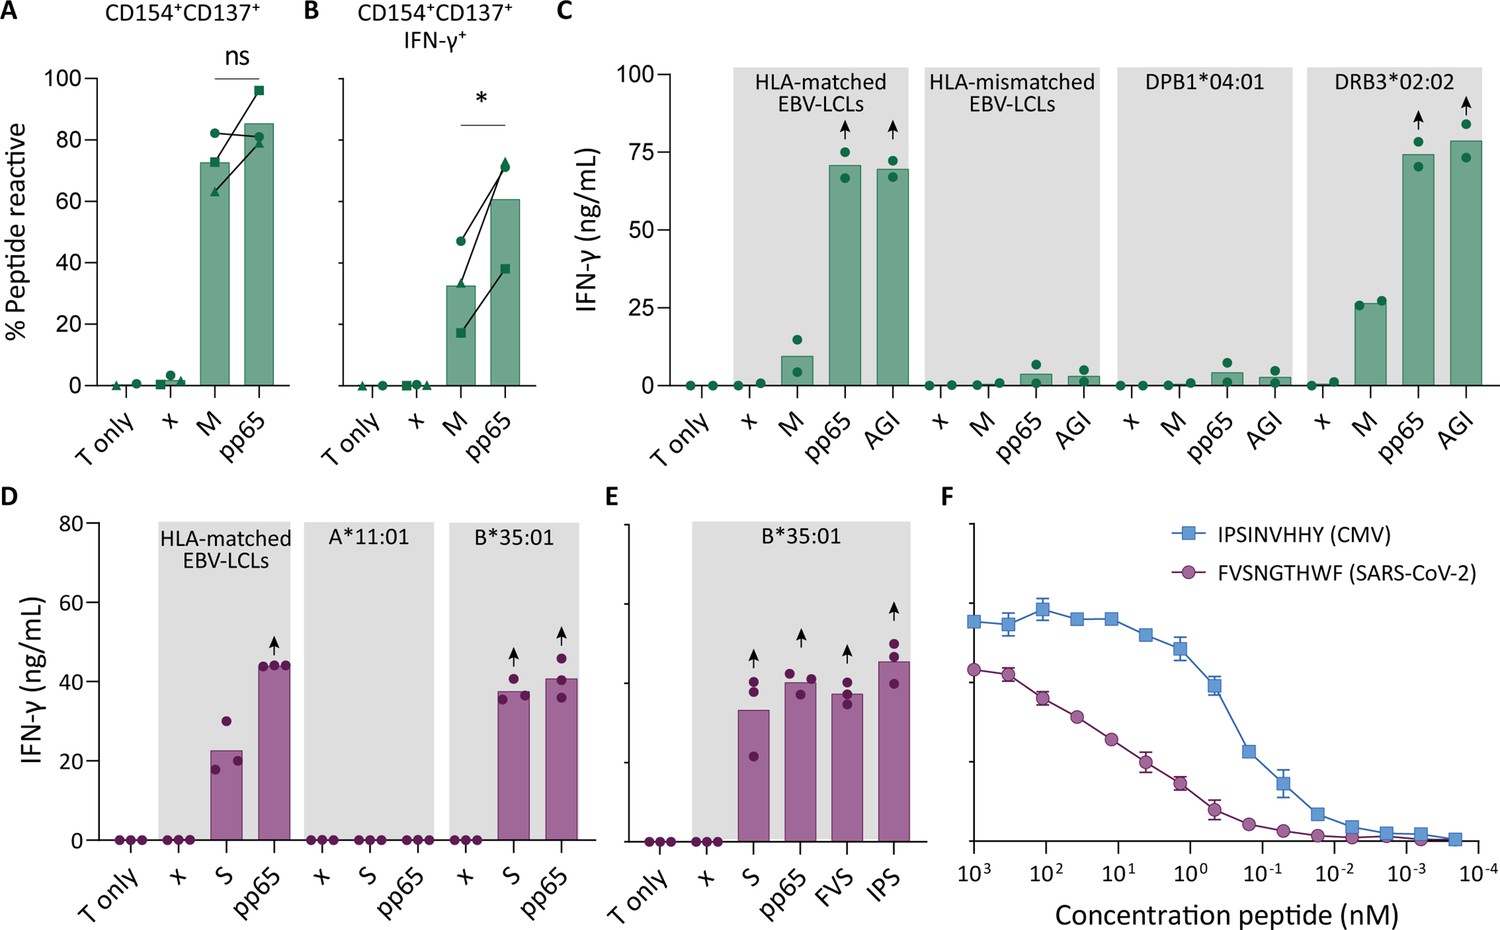
Recognition of severe acute respiratory syndrome coronavirus 2 (SARS-CoV-2) and cytomegalovirus (CMV) by pre-existing CD4+ and CD8+ T cells.
Clonally expanded CD4+ T cells from donor UGT and CD8+ T cells from donor UTT were overnight co-cultured with peptide-pulsed stimulator cells. (A–B) Percentages of CD154+, CD137+, and/or IFN-γ+ cells of cross-reactive CD4+ T cell clones after overnight culture (T only) or after overnight co-culture with HLA-matched EBV-lymphoblastoid cell lines (EBV-LCLs) that were not peptide pulsed (x) or loaded with membrane (M) or pp65 peptide pool, measured by flow cytometry. Dots represent the mean of experimental repeats of 4UGT5 (square, one repeat), 4UGT8 (circles, four repeats), and 4UGT17 (triangle, two repeats). Significance was tested by a paired t-test. (C) Bar graphs showing ELISA measurement of secreted IFN-γ after co-culturing of a representative clone, 4UGT8 clone, with HLA-matched or HLA-mismatched EBV-LCLs. HLA-mismatched EBV-LCLs were retrovirally transduced with HLA class II molecule as depicted in figure. Stimulator cells were peptide-pulsed with membrane (M) peptide pool, pp65 peptide pool, or AGILARNLVPM (AGI) peptide. Data points are experimental duplicates. Black arrows indicate that values were above plateau value of the ELISA calibration curve. (D–E) Bar graphs showing ELISA measurement of secreted IFN-γ after co-culturing of a representative clone, 8UTT6 clone, with HLA-matched EBV-LCLs or K562s transduced with HLA-B*35:01 or HLA-A*11:01. Stimulator cells were peptide-pulsed with spike (S) peptide pool, pp65 peptide pool, IPSINVHHY (IPS) peptide, or FVSNGTHWF (FVS) peptide. Data points are technical triplicates. (F) Peptide titration of IPS peptide (blue) and FVS peptide (purple) in a co-culture assay with 8UTT6 clone.
Figure 2—figure supplement 1

Flow-activated cell sorting gating example for peptide stimulation assays.
Representative example of fluorescent-activated cell sorting for peptide-reactive CD4+ and CD8+ T cells. All events were gated on lymphocytes, single cells, and subsequently selected for CD4 positive or CD8 positive cells. Activated CD4+ or CD8+ T cells were sorted based on increased expression of CD137 compared to DMSO.
Figure 2—figure supplement 2
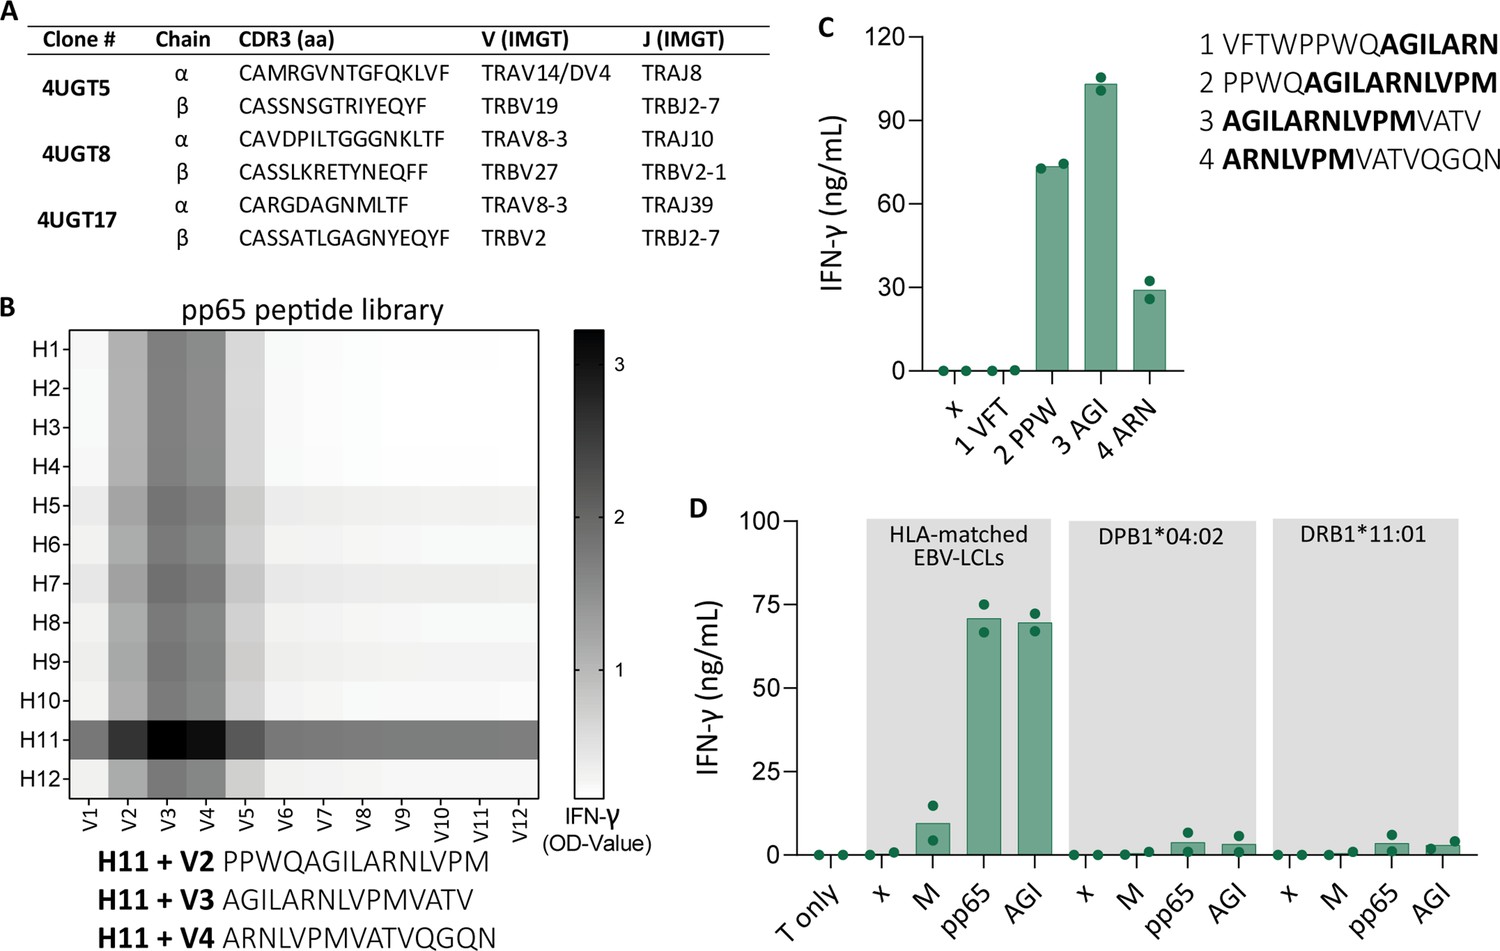
T cell receptor (TCR) sequence and pp65 peptide identification of 4UGT8 clone.
(A) Figure showing TCR sequencing of three cross-reactive CD4+ T cell clones. (B) Heatmap showing reactivity of 4UGT8 clone after co-culturing with HLA-matched EBV-lymphoblastoid cell lines (EBV-LCLs) and cytomegalovirus (CMV) pp65 peptide library which consisted of 12 horizontal (H1–H12) and 12 vertical sub pools (V1–V12). Reactivity was measured by IFN-γ ELISA of the supernatant, depicted as OD-value. Peptides that were present in the sub pools with highest reactivity are shown below the figure. (C) Bar graphs showing IFN-γ secretion after co-culturing 4UGT8 clone with single peptides. Peptide sequences are depicted next to the figure with amino acid overlap between the peptides in bold. Data points are technical duplicates. (D) Bar graphs showing ELISA measurement of secreted IFN-γ after co-culturing of 4UGT8 clone with HLA-matched EBV-LCLs, or HLA-mismatched EBV-LCLs transduced with HLA-DPB1*04:02 or DRB1*11:01. Stimulator cells were peptide-pulsed with membrane (M) peptide pool, pp65 peptide pool, or AGILARNLVPM (AGI) peptide. Data points are experimental duplicates. Black arrows indicate that values were above plateau value of the ELISA calibration curve.
Figure 2—figure supplement 3
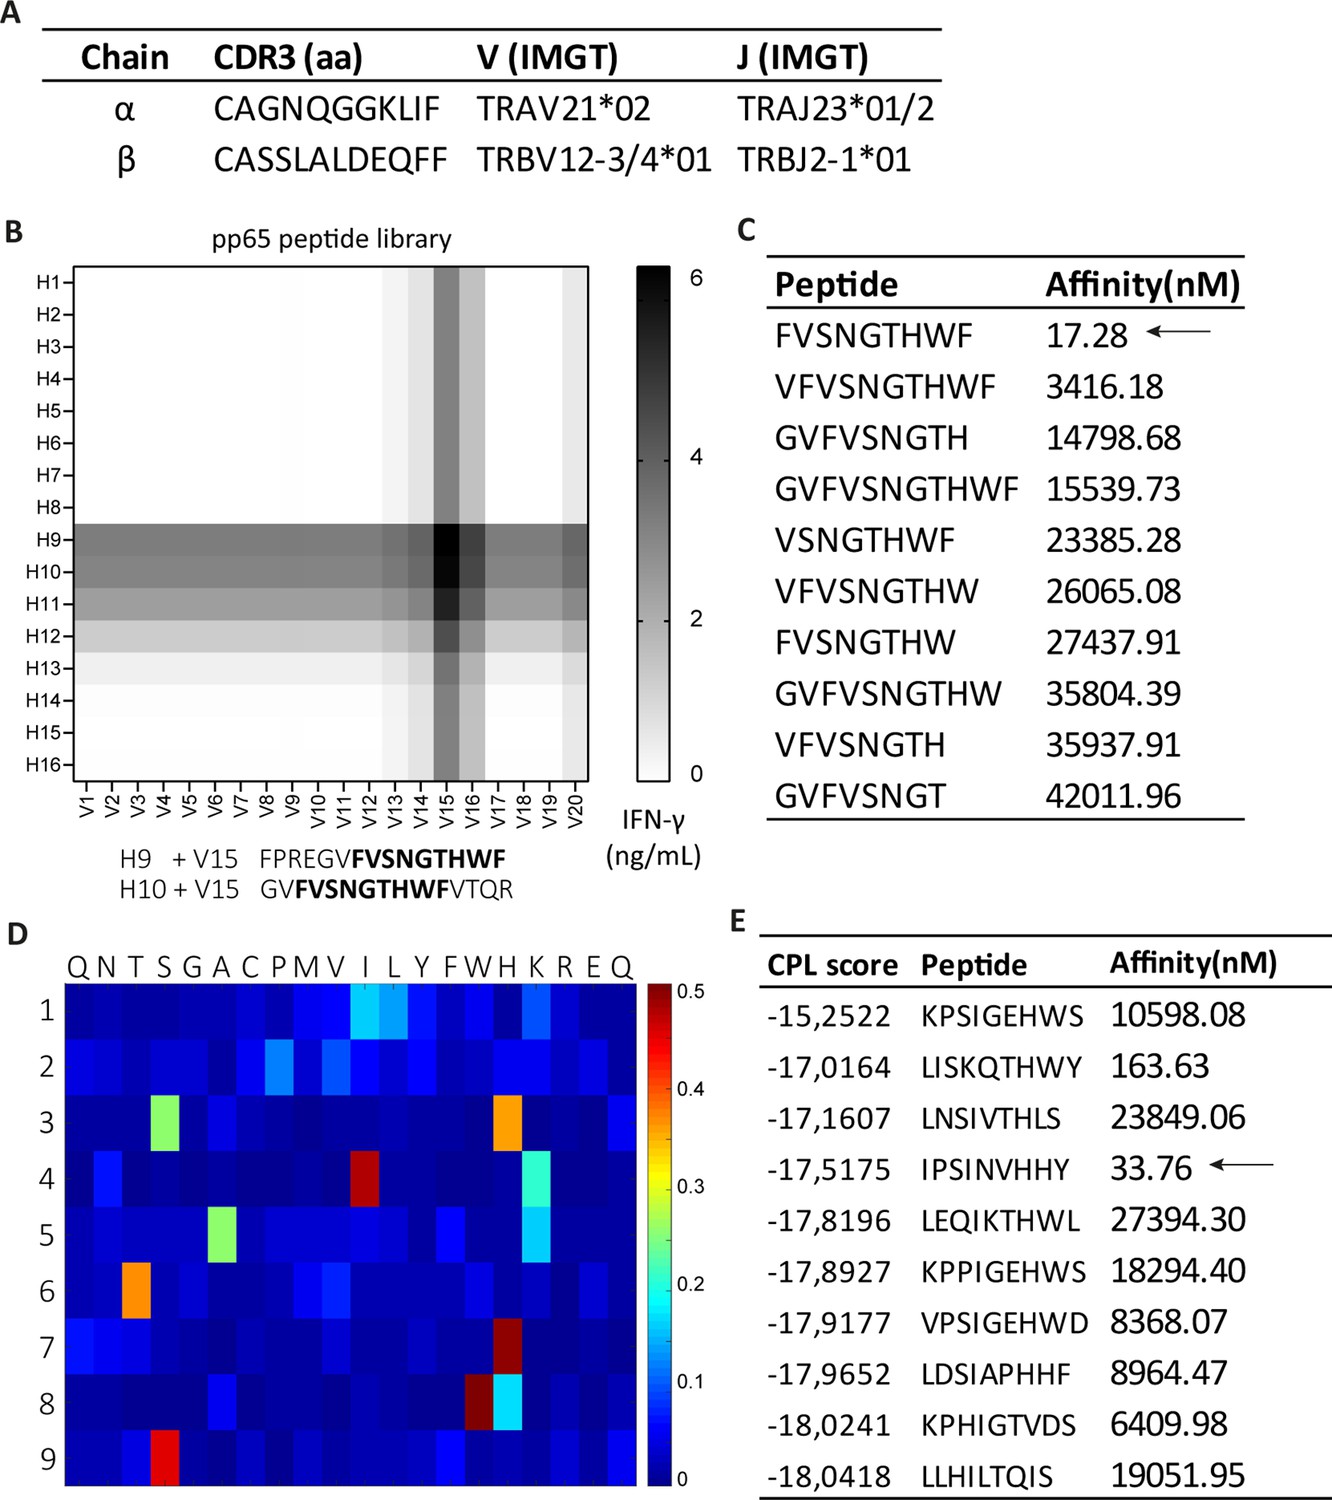
T cell receptor (TCR) sequence and peptide identification of 8UTT6 clone.
(A) Figure showing TCR sequencing result of UTT clones (N=23). (B) Heatmap showing reactivity of a representative clone, 8UTT6 clone, against sub pools of severe acute respiratory syndrome coronavirus 2 (SARS-CoV-2) spike peptide library loaded on K562s transduced with HLA-B*35:01. Reactivity was measured by IFN-γ ELISA. Peptides that induced highest IFN-γ production were depicted under the figure with amino acid overlap between the peptides in black. (C) Figure showing NetMHC 4.0-predicted binding to HLA-B*35:01 of peptides that were recognized in the spike peptide library. The 10 peptides with highest binding to HLA-B*35:01 are shown, and strong binders are indicated by an arrow. (D) Heatmap demonstrating peptide recognition signature of 8UTT6 clone using the combinatorial peptide library (CPL) assay. 8UTT6 clone was co-cultured with peptide-loaded K562 cells transduced HLA-B*35:01. Secreted IFN-γ was measured by ELISA and corrected per row. Y-axis shows peptide position, and x-axis shows the fixed amino acid. (E) Figure showing the 10 peptides with highest CPL score, their binding affinity to HLA-B*35:01 and strong binders are indicated by an arrow, as predicted by netMHC 4.0.
Figure 3 with 1 supplement
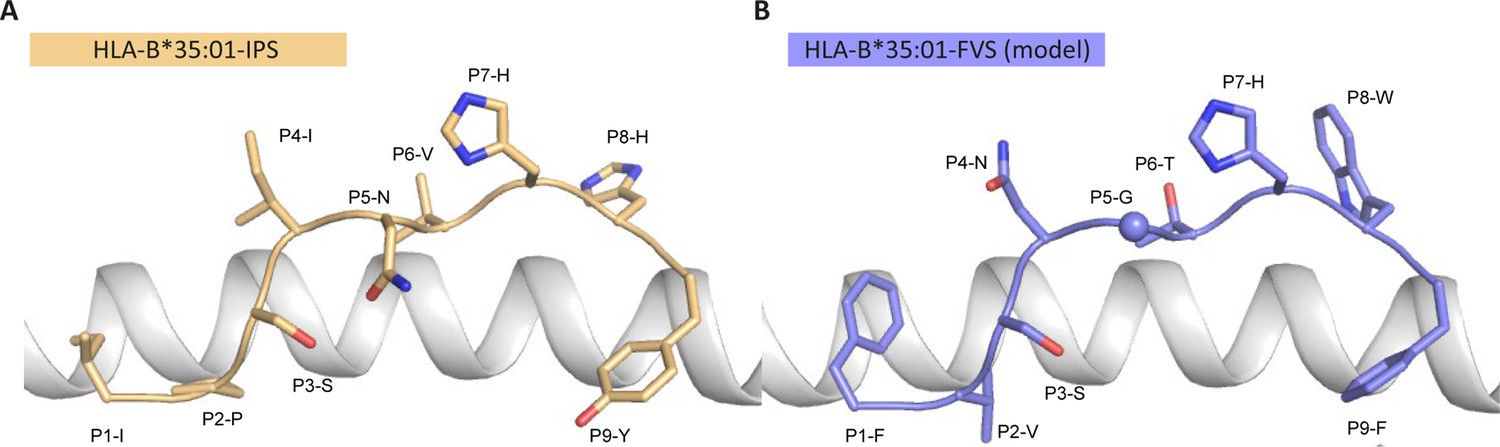
Model of the HLA-B*35:01-FVS structure.
(A) Crystal structure of the HLA-B*35:01-IPS complex with the HLA in white cartoon and the IPS peptide in clear orange cartoon and stick. (B) Model of the HLA-B*35:01-FVS complex with the HLA in white cartoon and the FVS peptide in blue cartoon and stick. The sphere represents the Cα atom of the FVS peptide P5-G residue.
Figure 3—figure supplement 1

Structural overlay of HLA-B*35:01-IPF structure with the model of the HLA-B*35:01-FVS.
(A) Top view of the HLA-B*35:01-IPF (peptide in chartreuse) and HLA-B*35:01-FVS (peptide in blue) aligned on the HLA cleft (white cartoon). (B) Side view of the same structural overlay as panel A, with the same color scheme. The sphere represents the Cα atom of the FVS peptide P5-G residue.
Figure 4 with 1 supplement
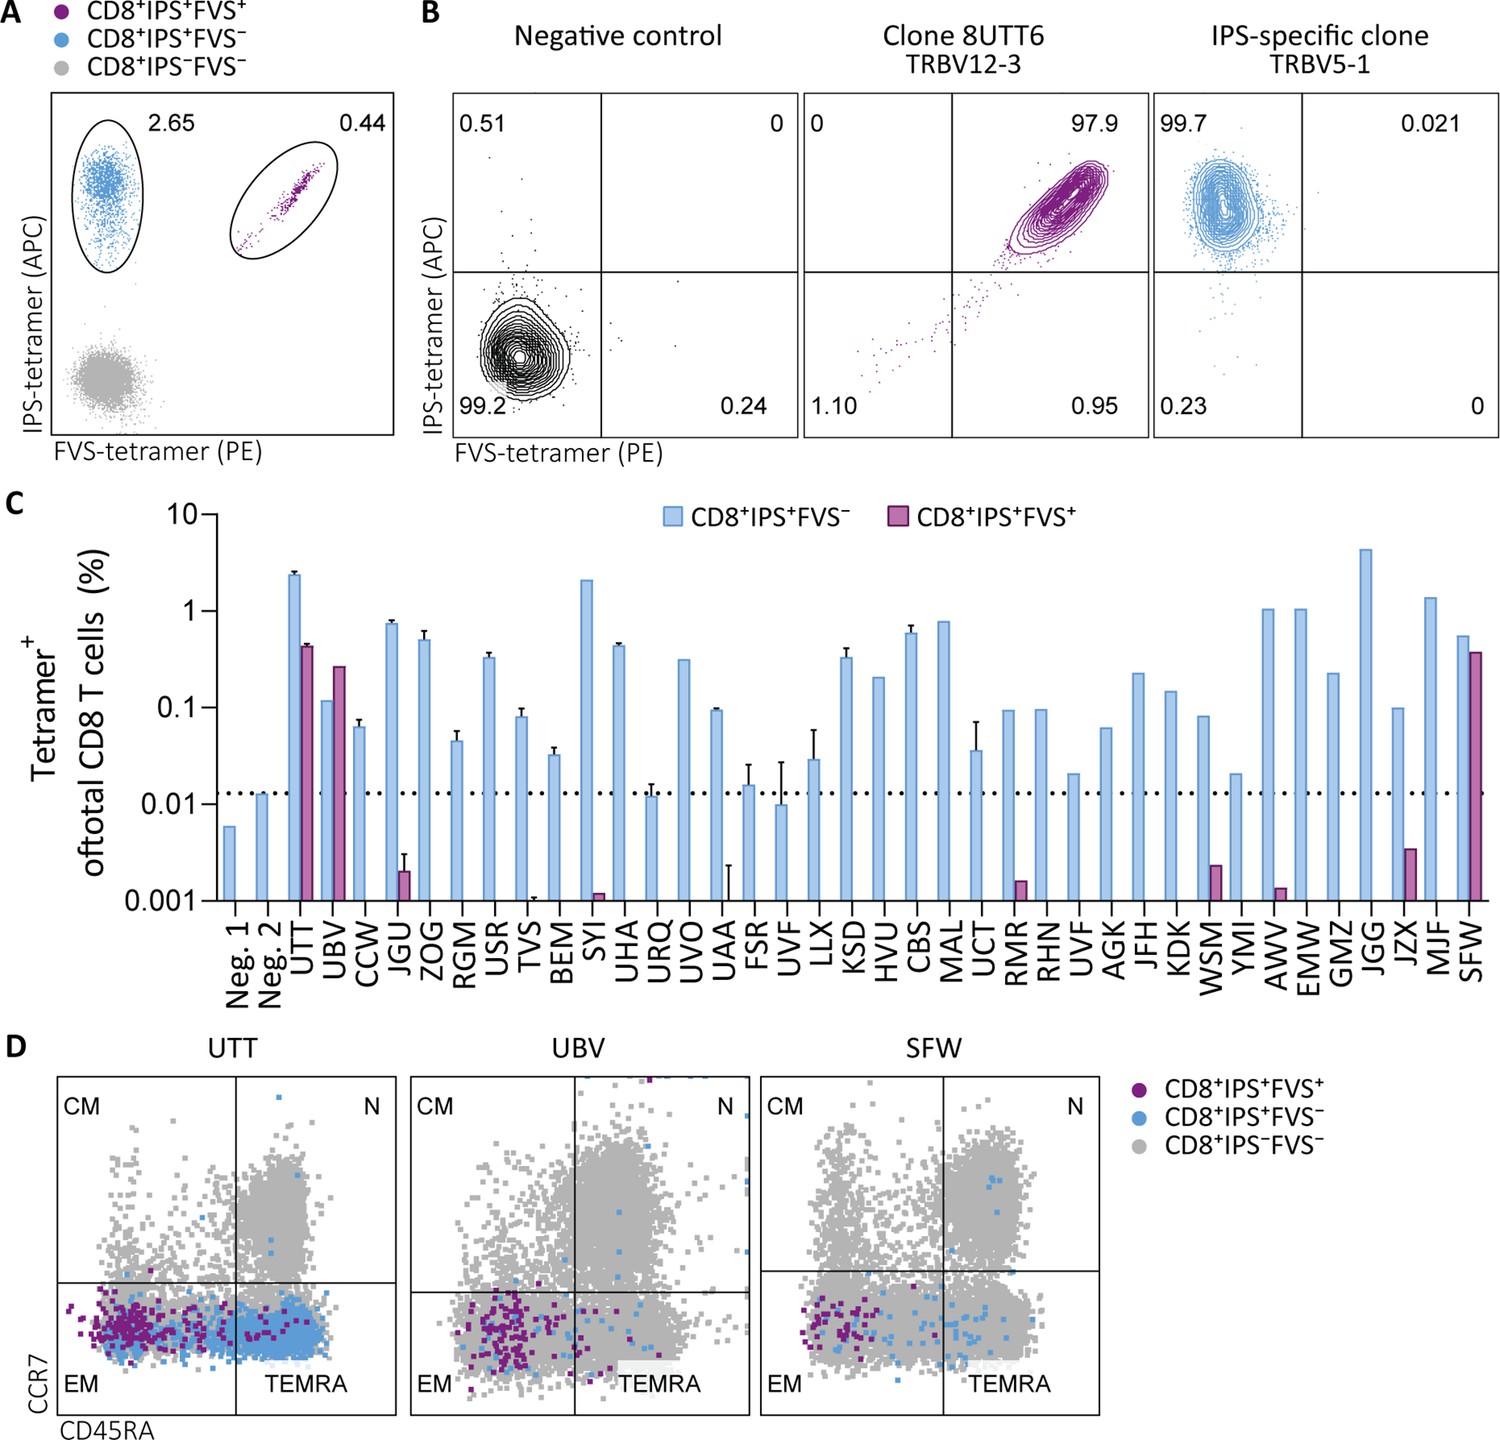
Tetramer detection of IPS/FVS-specific CD8+ T cells in CMV+ and HLA-B*35:01+ donors.
Flow cytometry measurement of PBMCs or T cell clones that are binding to B*35/IPS-tetramer (blue), B*35/FVS-tetramer (purple), or to neither (gray). (A) Flow cytometry dot plot showing percentages of tetramer-binding cells of total CD8+ T cells in PBMCs from donor UTT. (B) Dot plot showing percentages of tetramer-binding of 8UTT6 clone and an IPS-specific clone with their international immunogenetics information system (IMGT) variable region of T cell receptor β-chain (TRBV) depicted. As a negative control (neg. ctrl.), a T cell clone recognizing a non-relevant peptide in HLA-B*35:01 was included. (C) Bar graph showing frequencies of tetramer-binding of total CD8+ from PBMCs of healthy CMV+ and HLA-B*35(:01)+ donors. Error bars represent SD of experimental duplicates. Dotted line represents background level which was based on HLA-B*35:01− donors (neg.). (D) Dot plot showing expression of CCR7 and CD45RA by total CD8+ T cells and tetramer-binding T cells in PBMCs from UTT, UBV, and SFW. Quadrants separate differentiation subsets into naïve (N), central memory (CM), effector memory (EM), and terminally differentiated effector memory (TEMRA).
Figure 4—figure supplement 1
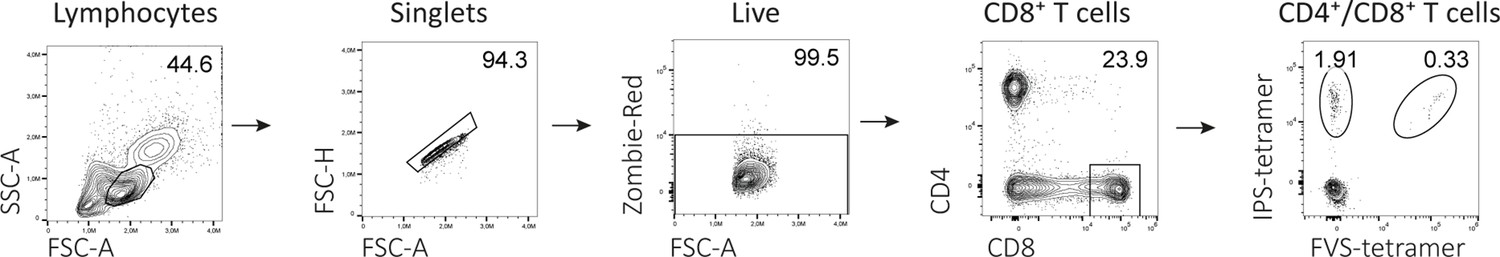
Flow cytometry gating example for tetramer staining assays.
Representative example of flow cytometry gating strategy for tetramer positive CD8+ T cells. All events were gated on lymphocytes, single cells, viable cells, CD8 positive, and subsequently separated for binding to tetramer consisting of HLA-B*35:01 with IPS peptide or FVS peptide.
Figure 5 with 2 supplements
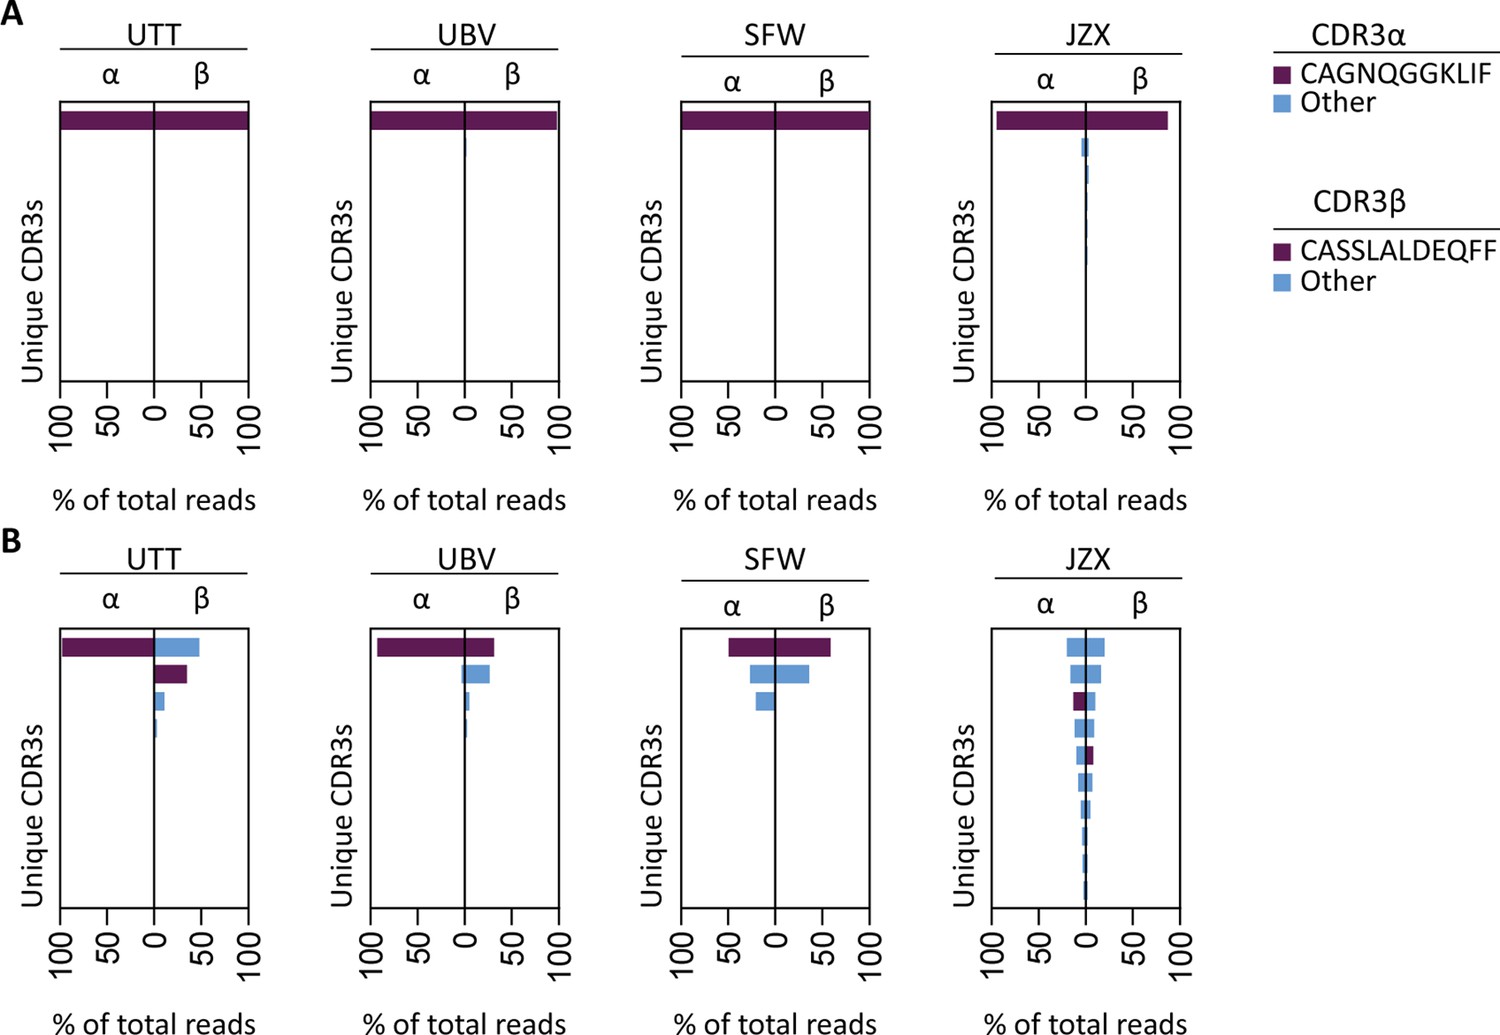
T cell receptor (TCR) sequencing of IPS/FVS-specific T cells.
PBMCs from healthy CMV+ and HLA-B*35:01+ donors were sorted on B*35/IPS- or B*35/FVS-tetramer binding and directly sequenced for their TCR alpha and beta chain. Unique CDR3 sequences are depicted in two-sided bar graphs in which the left side shows abundance of CDR3 sequences from the TCR α-chain (CDR3α), and the right side shows abundance of CDR3 sequences from the TCR β-chain (CDR3β). Bar graphs are purple if the CDR3α has the CAGNQGGKLIF sequence, or the CDR3β has the CASSLALDEQFF sequence; all other found sequences are depicted in blue. CDR3s with less than 1% abundance were excluded from the analysis. (A) Two-sided bar graphs showing abundances of unique CDR3 sequences of samples sorted on binding to B*35/FVS-tetramer. (B) Two-sided bar graphs showing abundances of unique CDR3 sequences of samples sorted on binding to B*35/IPS-tetramer.
-
Figure 5—source data 1
T cell receptor sequences of IPS/B*35 and FVS/B*35-specific CD8+ T cells.
- https://cdn.elifesciences.org/articles/82050/elife-82050-fig5-data1-v2.xlsx
Figure 5—figure supplement 1
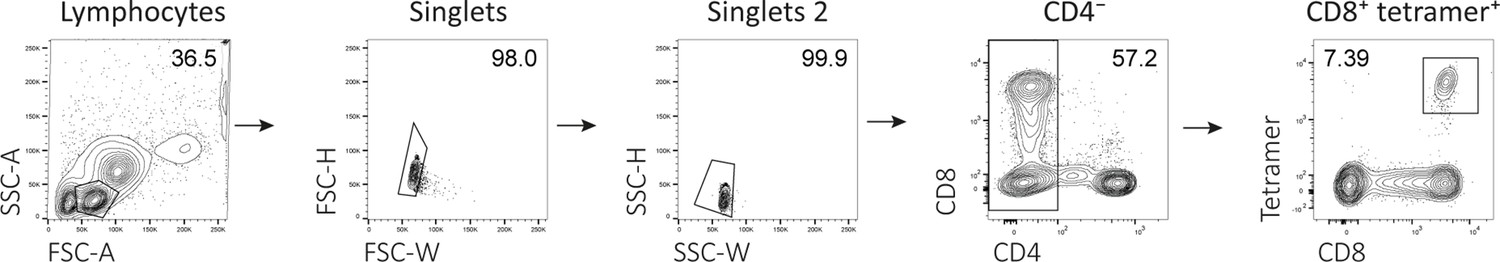
Flow activated cell sorting gating example.
Representative example of fluorescent-activated cell sorting for tetramer positive CD8+ T cells. All events were gated on lymphocytes, single cells, CD4−, and subsequently on CD8+tetramer+.
Figure 5—figure supplement 2
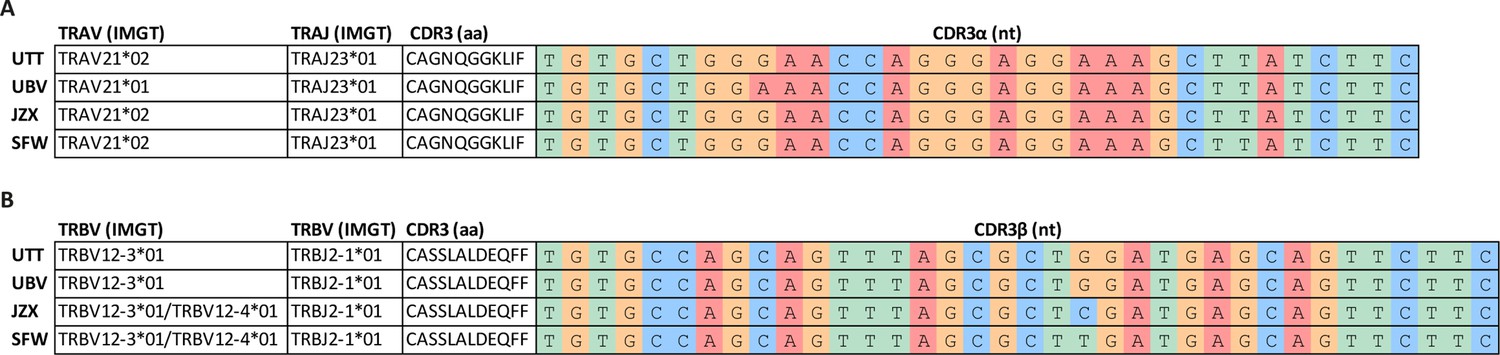
T cell receptor (TCR) sequencing of B*35/FVS-sorted samples.
Nucleotide alignment of the CDR3 α and β sequence of PBMCs sorted on B*35/FVS-tetramer binding. Segment numbering is depicted according to the international immunogenetics information system (IMGT) nomenclature. (A) Nucleotide alignment of the CDR3α sequences. (B) Nucleotide alignment of the CDR3β sequences.
Figure 6
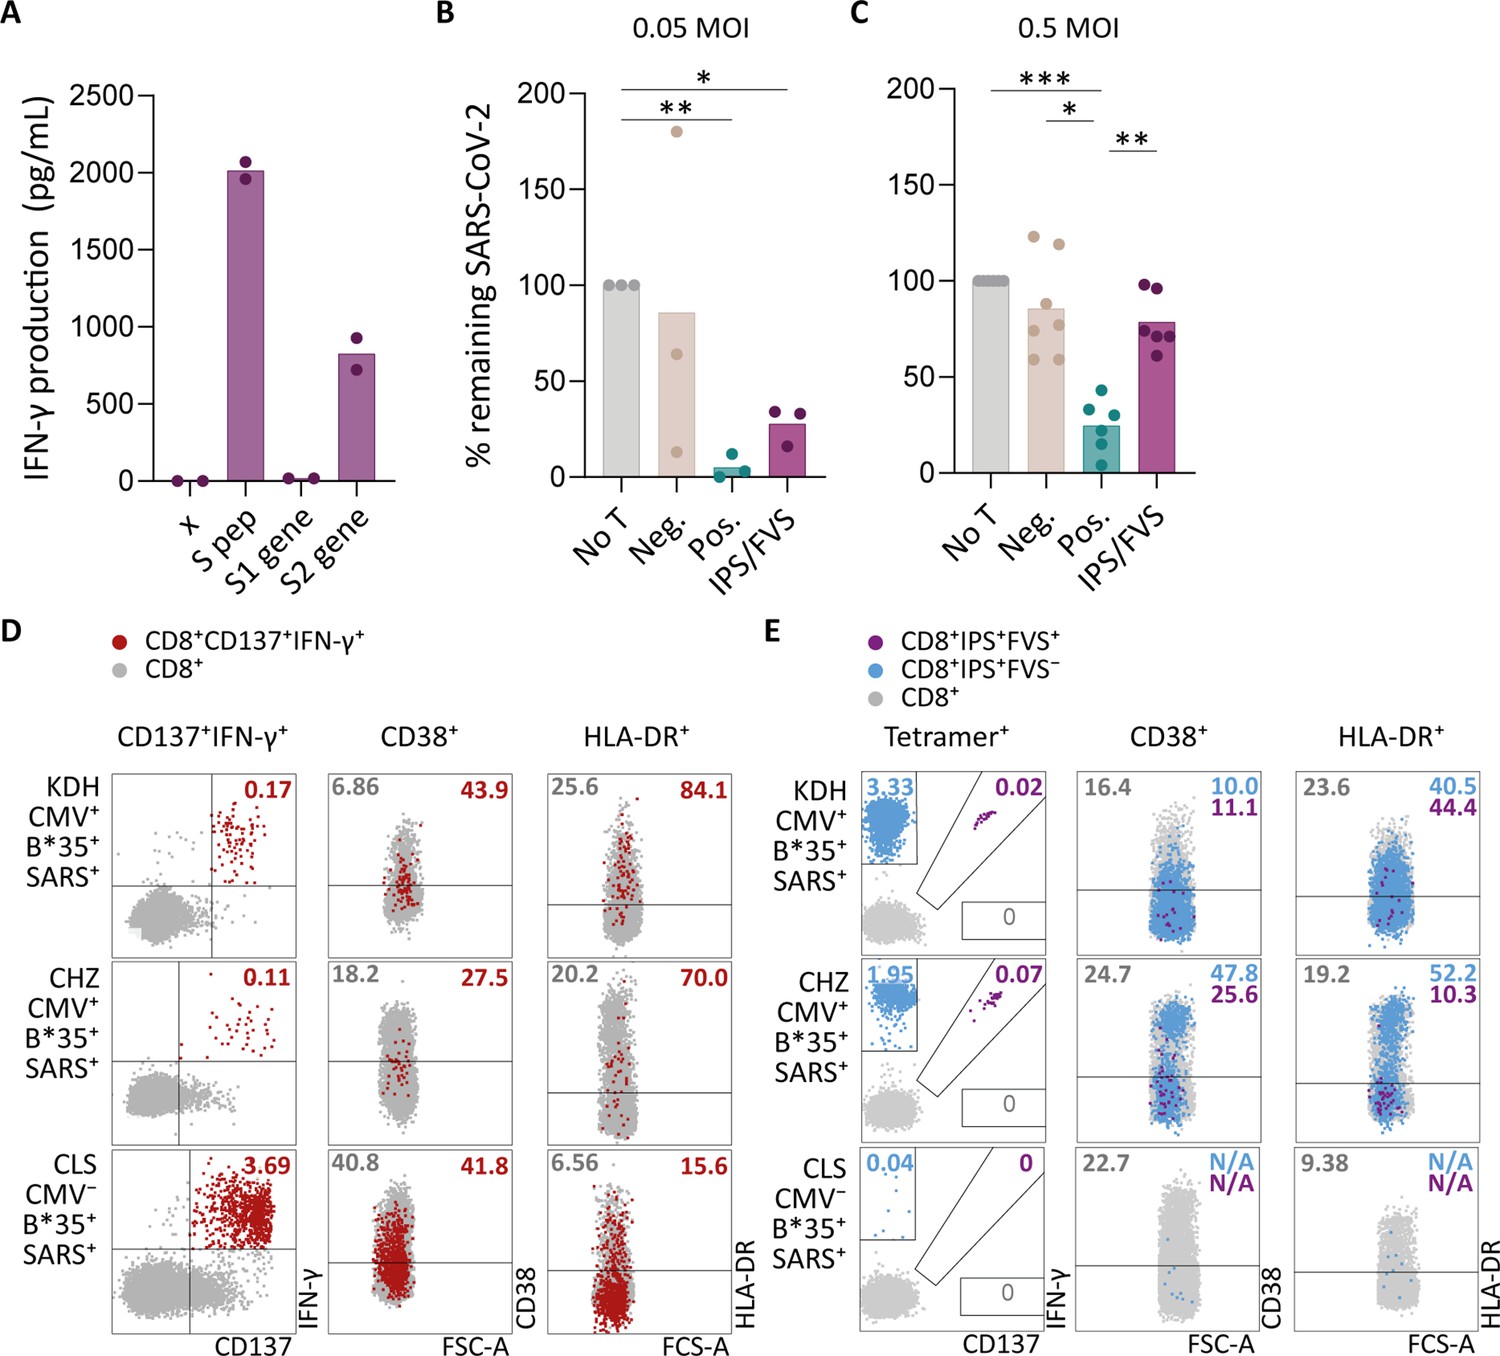
Ex vivo and in vitro evaluation of IPS/FVS-specific T cells.
(A) IFN-γ release of IPS/FVS-specific CD8+ T cells after co-incubation with K562 that were untransduced (x), loaded with spike peptide pool (S pep), or transduced with nucleotide 1–2082 (S1 gene) or nucleotide 2052–3,822 (S2 gene) of the spike gene. (B–C) Calu-3 cells were transduced to express HLA-B*35:01 and infected with the wildtype severe acute respiratory syndrome coronavirus 2 (SARS-CoV-2) virus. 6 hr post infection (hpi), IPS/FVS-specific CD8+ T cells were added in a 10:1 effector to target ratio. SARS-CoV-2 spike-specific T cells, isolated from coronavirus disease 2019 (COVID-19) vaccinated individuals, that recognize VASQSIIAY presented in HLA-B*35:01 or YLQPRTFLL presented in HLA-A*02:01 functioned as a positive control (pos.) or negative control (neg.), respectively. Cells were harvested 24 hpi to measure intracellular viral RNA. Bar graphs show the means of percentage reduction in SARS-CoV-2 intracellular RNA copies compared to the no T cell condition (no T) as measured by reverse transcription quantitative PCR (RT-qPCR), at 24 hpi using a multiplicity of infection (MOI) of 0.05 or 0.5. One-way ANOVA was applied to test statistical differences between conditions and only comparisons with p<0.05 are shown. (D–E) Flow cytometry analysis of CD38 and HLA-DR expression on CD8+ T cells in PBMCs from severe COVID-19 patients who were CD137+IFN-γ+ after SARS-CoV-2 nucleocapsid peptide stimulation (red), only bound to B*35/IPS-tetramer (blue) or bound to both B*35/IPS- and B*35/FVS-tetramer (purple). All other CD8+ T cells are gray. Two patients were HLA-B*35:01+CMV+ (KDH and CHZ), and as a control, one patient was HLA-B*35:01+CMV− (CLS). Detection of B*35/IPS- and B*35/FVS-specific T cells and expression of the activation markers were measured and compared within the same sample.
Tables
Key resources table
| Reagent type (species) or resource | Designation | Source or reference | Identifiers | Additional information |
|---|---|---|---|---|
| Peptide, recombinant protein | Severe acute respiratory syndrome coronavirus 2 (SARS-CoV-2) Spike (S), 15-mers, 11aa overlapping peptide pool | Miltenyi | 130-126-701 | 1 μg/mL |
| Peptide, recombinant protein | SARS-CoV-2 Spike (S1), 15-mers, 11aa overlapping peptide pool | Miltenyi | 130-127-041 | 1 μg/mL |
| Peptide, recombinant protein | SARS-CoV-2 Spike (S+), 15-mers, 11aa overlapping peptide pool | Miltenyi | 130-127-312 | 1 μg/mL |
| Peptide, recombinant protein | SARS-CoV-2 Membrane (M), 15-mers, 11aa overlapping peptide pool | Miltenyi | 130-126-703 | 1 μg/mL |
| Peptide, recombinant protein | SARS-CoV-2 Nucleocapsid (N), 15-mers, 11aa overlapping peptide pool | Miltenyi | 130-126-699 | 1 μg/mL |
| Peptide, recombinant protein | Cytomegalovirus (CMV) pp65, 15-mers, 11aa overlapping peptide pool | JPT | Custom-made | 1 μg/mL |
| Peptide, recombinant protein | CMV pp65 peptide library, 15-mers, 11aa overlapping | JPT | Custom-made | 1 μg/mL |
| Peptide, recombinant protein | SARS-CoV-2 Spike peptide library, 15-mers, 11aa overlapping | SB Peptides | SB043 | 1 μg/mL |
| Peptide, recombinant protein | CMV, VFTWPPWQAGILARN | LUMC | Custom-made | 1 μg/mL |
| Peptide, recombinant protein | CMV, PPWQAGILARNLVPM | LUMC | Custom-made | 1 μg/mL |
| Peptide, recombinant protein | CMV, AGILARNLVPMVATV | LUMC | Custom-made | 1 μg/mL |
| Peptide, recombinant protein | CMV, ARNLVPMVATVQGQN | LUMC | Custom-made | 1 μg/mL |
| Peptide, recombinant protein | CMV, VPMVATVQGQNLKYQ | LUMC | Custom-made | 1 μg/mL |
| Peptide, recombinant protein | CMV, AQGDDDVWTSGSDSD | LUMC | Custom-made | 1 μg/mL |
| Peptide, recombinant protein | CMV, SSATACTSGVMTRGR | LUMC | Custom-made | 1 μg/mL |
| Peptide, recombinant protein | CMV, PKRRRHRQDALPGPC | LUMC | Custom-made | 1 μg/mL |
| Peptide, recombinant protein | SARS-CoV-2, FVSNGTHWF | LUMC | Custom-made | 1 μg/mL |
| Peptide, recombinant protein | CMV, IPSINVHHY | LUMC | Custom-made | 1 μg/mL |
| Antibody | Rat monoclonal anti-human CCR7 (BV711) | BD Biosciences | Cat.#563712 RRID:AB_2738386 | FC (1:100) |
| Antibody | Mouse monoclonal anti-human CD137 (APC) | BD Biosciences | Cat.#550890 RRID:AB_398477 | FC (1:75) |
| Antibody | Mouse monoclonal anti-human CD14 (FITC) | BD Biosciences | Cat.#555397 RRID:AB_395798 | FC (1:100) |
| Antibody | Mouse monoclonal anti-human CD154 (Pacific Blue) | Biolegend | Cat.#310820 RRID:AB_830699 | FC (1:300) |
| Antibody | Mouse monoclonal anti-human CD19 (FITC) | BD Biosciences | Cat.#555412 RRID:AB_395812 | FC (1:100) |
| Antibody | Mouse monoclonal anti-human CD4 (PE-Cy7) | Beckham Coulter | Cat.#737660 RRID:AB_2922769 | FC (1:300) |
| Antibody | Mouse monoclonal anti-human CD4 (FITC) | BD Biosciences | Cat.#555346 RRID:AB_395751 | FC (1:30) |
| Antibody | Mouse monoclonal anti-human CD4 (BV510) | BD Biosciences | Cat.#562970 RRID:AB_2744424 | FC (1:300) |
| Antibody | Mouse monoclonal anti-human CD45RA (PE-Texas-Red) | Invitrogen | Cat.#MHCD45RA17 RRID:AB_10372222 | FC (1:200) |
| Antibody | Mouse monoclonal anti-human CD8 (APC-H7) | BD Biosciences | Cat.#560179 RRID:AB_1645481 | FC (1:100) |
| Antibody | Mouse monoclonal anti-human CD8 (PE-Cy7) | BD Biosciences | Cat.#557746 RRID:AB_396852 | FC (1:320) |
| Antibody | Mouse monoclonal anti-human CD8 (Pacific Blue) | BD Biosciences | Cat.#558207 RRID:AB_397058 | FC (1:500) |
| Antibody | Mouse monoclonal anti-human IFN-γ (Alexa-Fluor 700) | Sony | Cat.#3112600 RRID:AB_2922770 | FC (1:120) |
| Antibody | Mouse monoclonal anti-human IFN-γ (BV711) | BD Biosciences | Cat.#564039 RRID:AB_2738557 | FC (1:300) |
| Antibody | Mouse monoclonal anti-human HLA-DR (Alexa-Fluor 700) | BD Biosciences | Cat.#560743 RRID:AB_1727526 | FC (1:150) |
| Antibody | Mouse monoclonal anti-human CD38 (BV605) | BD Biosciences | Cat.#740401 RRID:AB_2740131 | FC (1:120) |
| Antibody | Rat monoclonal anti-mouse CD19 (Mouse) | Biolegend | Cat.#557399 RRID:AB_396682 | FC (1:250) |
| Other | Zombie-Red | Biolegend | Cat.#423109 | FC (1:1000) |
| Other | Zombie-Aqua | BD Biosciences | Cat.#423101 | FC (1:1000) |
| Other | Brilliant Violet Staining Buffer Plus | Beckham Coulter | Cat.#566385 | FC (1:10) |
| Cell line (Homo sapiens) | K-562 | ATCC | CCL-342 | |
| Cell line (Homo sapiens) | Calu-3 | ATCC | HTB-55 | |
| Biological sample (Homo sapiens) | PBMCs from 67 healthy donors | LUMC Biobank | Cryo-preserved before May 2019 | |
| Biological sample (Homo sapiens) | PBMCs from critical COVID-19 patient (KDH) | LUMC BEAT-COVID consortium | Clinical trial #: NL8589 | Male, 61 years, 31 days ICU |
| Biological sample (Homo sapiens) | PBMCs from critical COVID-19 patient (CHZ) | LUMC BEAT-COVID consortium | Clinical trial #: NL8589 | Male, 76 years, 40 days ICU |
| Biological sample (Homo sapiens) | PBMCs from critical COVID-19 patient (CLS) | LUMC BEAT-COVID consortium | Clinical trial #: NL8589 | Male, 71 years, 107 days ICU |
Additional files
-
MDAR checklist
- https://cdn.elifesciences.org/articles/82050/elife-82050-mdarchecklist1-v2.docx
-
Supplementary file 1
COVID-19 patient characteristics.
- https://cdn.elifesciences.org/articles/82050/elife-82050-supp1-v2.xlsx
-
Supplementary file 2
Cohort characteristics of pre-pandemic samples.
- https://cdn.elifesciences.org/articles/82050/elife-82050-supp2-v2.xlsx
-
Supplementary file 3
List of peptides.
- https://cdn.elifesciences.org/articles/82050/elife-82050-supp3-v2.xlsx
-
Supplementary file 4
List of antibodies and reagents used for flow cytometry.
- https://cdn.elifesciences.org/articles/82050/elife-82050-supp4-v2.xlsx
-
Supplementary file 5
List of primer sequences used for TCR sequencing.
- https://cdn.elifesciences.org/articles/82050/elife-82050-supp5-v2.xlsx
Download links
A two-part list of links to download the article, or parts of the article, in various formats.
Downloads (link to download the article as PDF)
Open citations (links to open the citations from this article in various online reference manager services)
Cite this article (links to download the citations from this article in formats compatible with various reference manager tools)
SARS-CoV-2-specific CD4+ and CD8+ T cell responses can originate from cross-reactive CMV-specific T cells
eLife 11:e82050.
https://doi.org/10.7554/eLife.82050


