linc-mipep and linc-wrb encode micropeptides that regulate chromatin accessibility in vertebrate-specific neural cells
- Department of Genetics, Yale University, United States
- Yale Center for Genome Analysis, Yale University, United States
- Department of Cell and Developmental Biology, University College London, United Kingdom
- Department of Computer Science, Yale University, United States
- Stowers Institute for Medical Research, United States
- Department of Molecular & Integrative Physiology, University of Kansas School of Medicine, United States
- Yale Stem Cell Center, Yale University School of Medicine, United States
- Yale Cancer Center, Yale University School of Medicine, United States
Figures
Figure 1 with 7 supplements
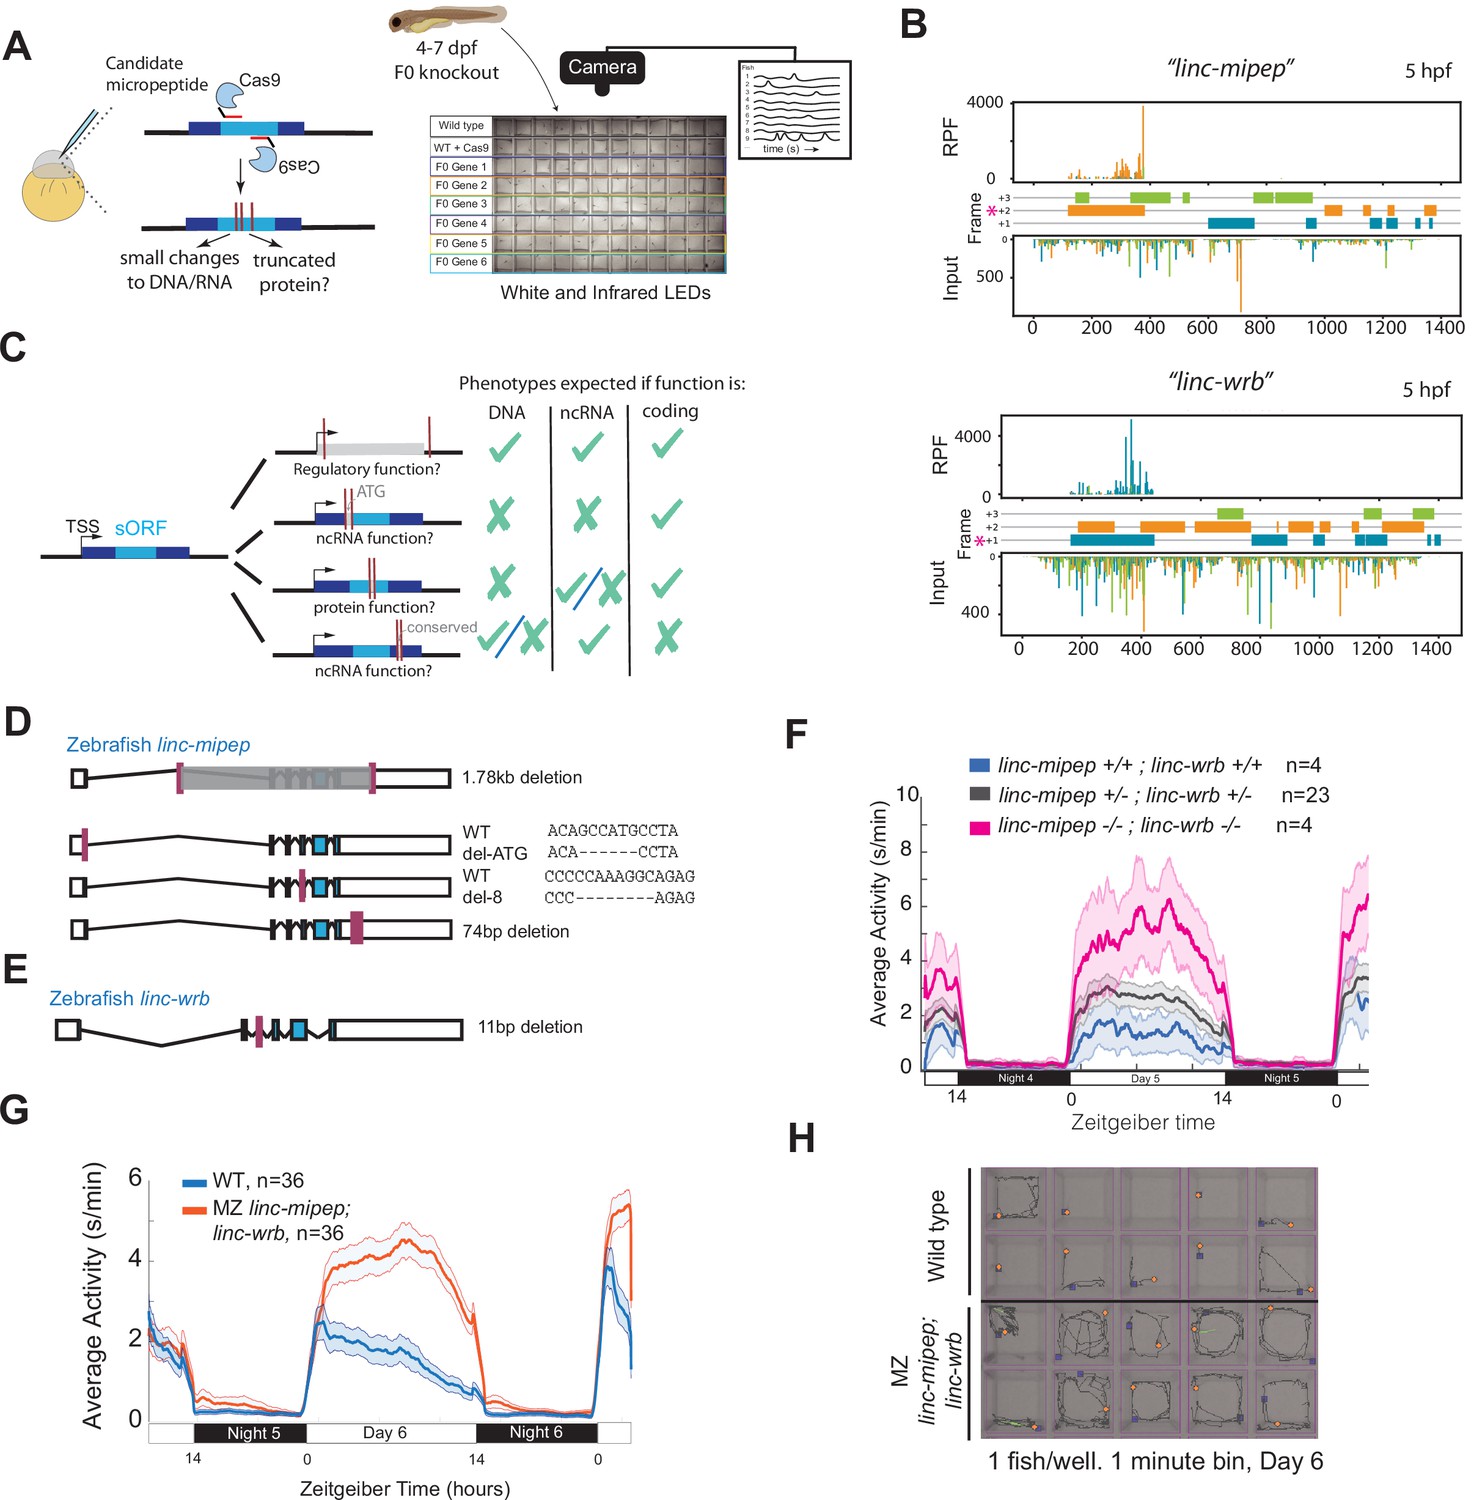
linc-mipep and linc-wrb loss-of-protein-function mutant larvae are behaviorally hyperactive.
(A) Left, schematic of F0 CRISPR knockout behavioral screen. Zebrafish embryos were injected early at the one-cell embryo stage with multiple sgRNAs and Cas9 targeting the ORF of candidate micropeptides encoded within putative lincRNAs. Right, schematic of behavior screening platform. Each well of a 96-well flat bottom plate contains one zebrafish larva (4–7days post-fertilization, dpf) from the same wild type (WT) clutch. Individual locomotor activity was tracked at 25 frames per second on a 14hr:10hr light:dark cycle. (B) Ribosome footprint of linc-mipep (also known as lnc-rps25) (top) or linc-wrb (bottom) at 5hours post fertilization (hpf) across annotated transcript length, with putative coding frames in green (+3), orange (+2), or blue (+1); input (control) on bottom tracks. Magenta asterisk marks predicted short open reading frame. RPF, ribosome-protected fragment. (C) Summary of mutagenesis strategy to decode transcript functions. Magenta bars denote CRISPR-targeted area. Mutated/removed sequence is in gray. TSS, transcription start site. sORF, short open reading frame. ATG, start codon. ncRNA, non-coding RNA. Right, phenotypes predicted (check mark) or not predicted (x mark) for each mutant if the gene functions as a regulatory region, noncoding RNA, or protein-coding gene. (D) Stable mutants for linc-mipep: full region deletion (1.78kb deletion, from intron 1 – proximal 3’UTR, top); translation start site deletion that removes the ATG sequence (middle); frameshift deletion (8bp deletion at exon 4, second from bottom); 74bp deletion that removes highly conserved 3’UTR sequence (bottom). (E) Stable frameshift mutant for linc-wrb (11bp deletion, exon 3). (F) Locomotor activity of linc-mipepdel-1.8kb/del-1.8kb;linc-wrbdel-11/del-11 (linc-mipep -/-; linc-wrb -/-, magenta); linc-mipepdel-1.8kb/+;linc-wrbdel-11/+ (linc-mipep +/-; linc-wrb +/-, black); and wild-type (linc-mipep +/+; linc-wrb +/+, blue) sibling-matched larvae over 2 nights. (G) Locomotor activity of wild type (WT, blue) or maternal-zygotic linc-mipepdel1.8kb/del1.8kb;linc-wrbdel11bp/del11bp (linc-mipep;linc-wrb, orange) larvae across two nights. The ribbon represents± SEM. Zeitgeber time is defined from lights ON = 0. (H) Representative daytime locomotor activity tracking of wild type (top 2 rows) and maternal-zygotic linc-mipepdel1.8kb/del1.8kb;linc-wrbdel11bp/del11bp (linc-mipep;linc-wrb, bottom 2 rows) larvae during 1min at 6 dpf. Blue and orange dots represent start and stop locations, respectively.
Figure 1—figure supplement 1
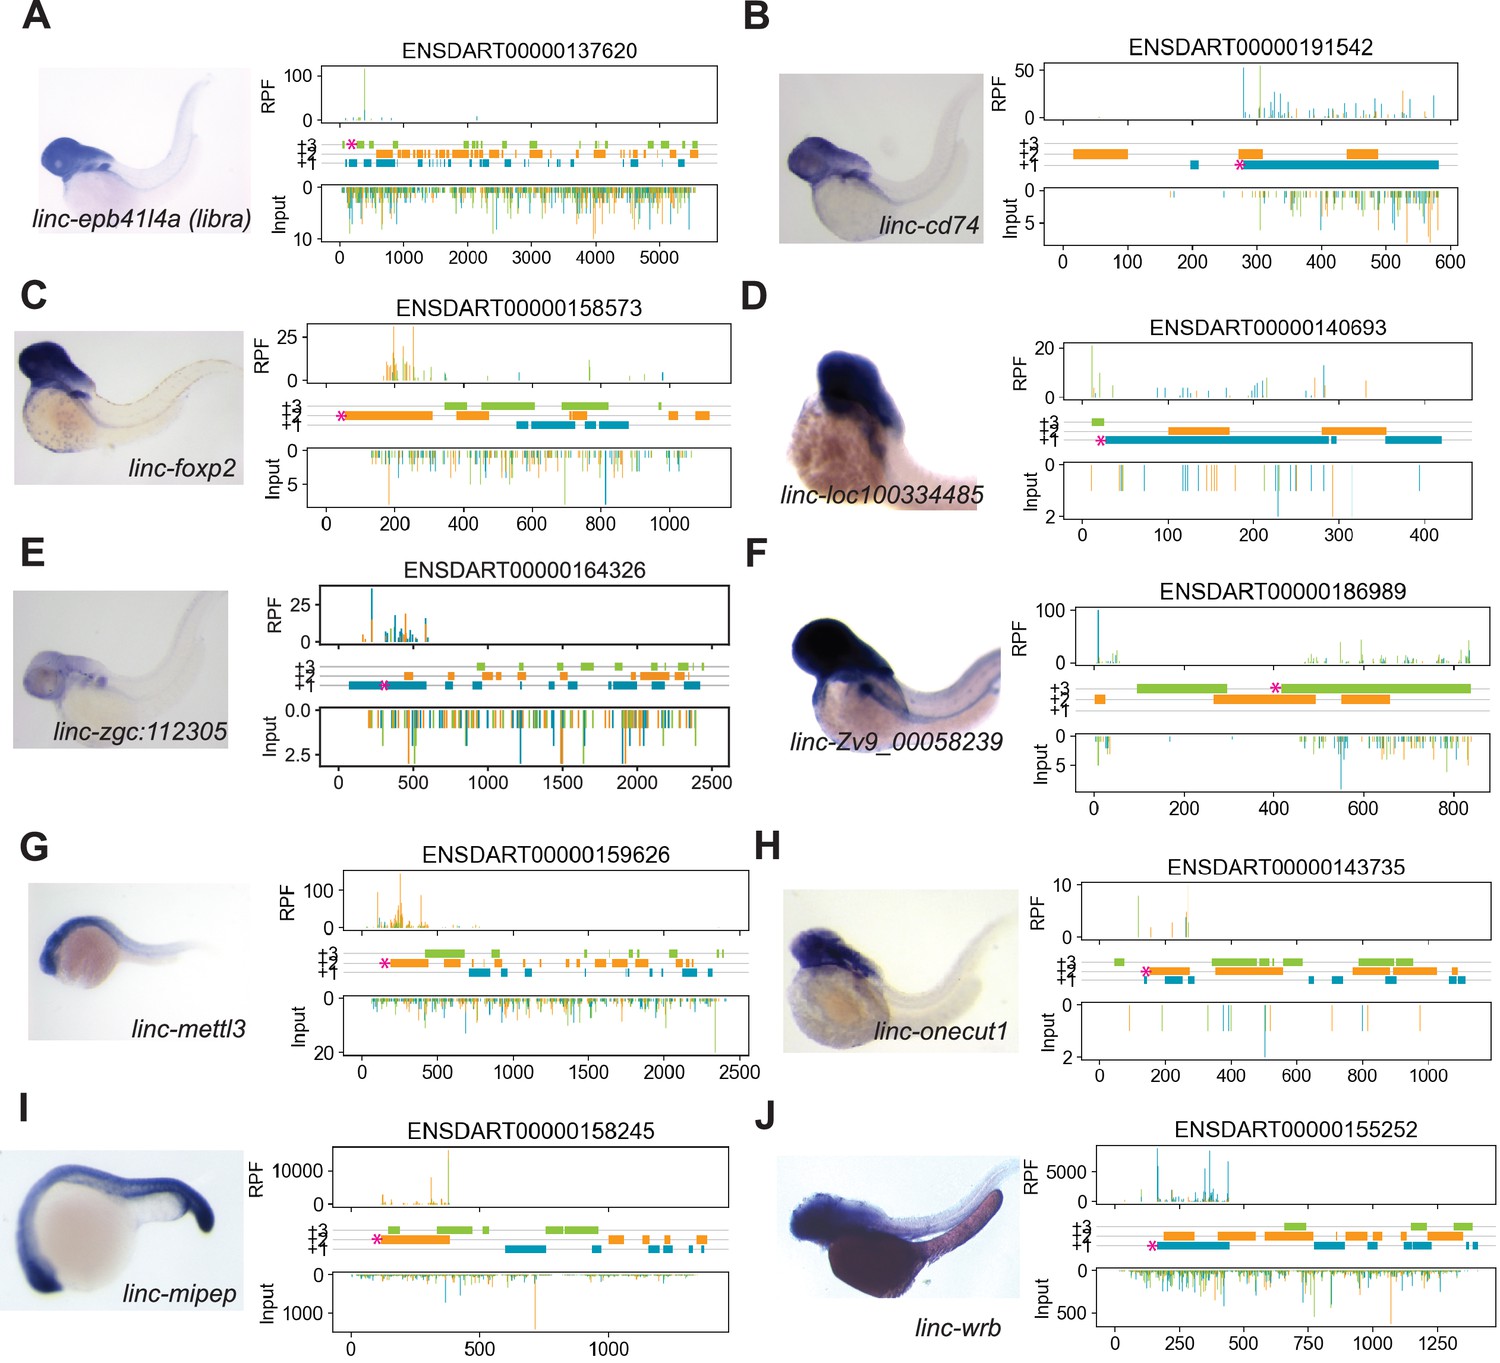
Expression of micropeptide candidates.
(A) Left, in situ hybridization expression of linc-epb41l4a (libra, ENDSART00000137620) at 2days post-fertilization (dpf). Right, ribosome protected fragments (RPF) at 12hours post-fertilization (hpf) across annotated transcript length, with putative coding frames in green (+3), orange (+2), or blue (+1); input (control reads from poly-(A) +selectedRNA, followed by random fragmentation) on bottom tracks. ‘Coding’ open-reading frame is indicated at the start of the frame with a magenta asterisk. (B) Same as (A) for linc-cd74. (C) Same as (A) for linc-foxp2. (D) Same as (A) for linc-loc100334485. (E) Same as (A) for linc-zgc:112305, with ribosome protected fragments tracks at 48 hpf. (F) Same as (A) for linc-Zv9_00058239.(G) Same as (A) for linc-mettl3, at 1 dpf. (H) Same as (A) for linc-onecut1. (I) Same as (A) for linc-mipep, at 20hpf. (J) Same as (A) for linc-wrb, at 2 dpf.
Figure 1—figure supplement 2

Validation of CRISPR targeting in F0 screen.
(A) DNA Sequencing of each target region from a sample pool of 8 individual embryos at 24hpf. Discordance of wild type Sanger sequencing reads (orange traces, Wild type sequence) compared to F0 injected embryos Sanger sequencing reads (green, Targeted F0s sequence), at the sgRNA target sites (indicated by dashed lines at each respective cut site), using the Synthego Inference of CRISPR Edits (ICE) analysis tool. Shown for linc-epb41l4a (libra), linc-cd74, linc-foxp2, linc-loc100334485, linc-zgc:112305, linc-Zv9_00058239, linc-onecut1, linc-mipep, and linc-wrb. Legend as described. (B) Top, PCR product of targeted linc-mettl3 sequence in wild type (left) or linc-mettl3 F0 (right) embryos. Bottom, chromatograms from Sanger sequencing of wild type (top) or linc-mettl3 F0 embryos (bottom) at one target site (denoted above WT sequence with a blue arrow, PAM sequence indicated in orange). (C) Example of the calculated relative contribution (by percent contribution) of each linc-wrb F0 indel from Sanger sequencing. (D) Example of the calculated relative contribution (by percent contribution) of each libra F0 large deletion from Sanger sequencing.
Figure 1—figure supplement 3
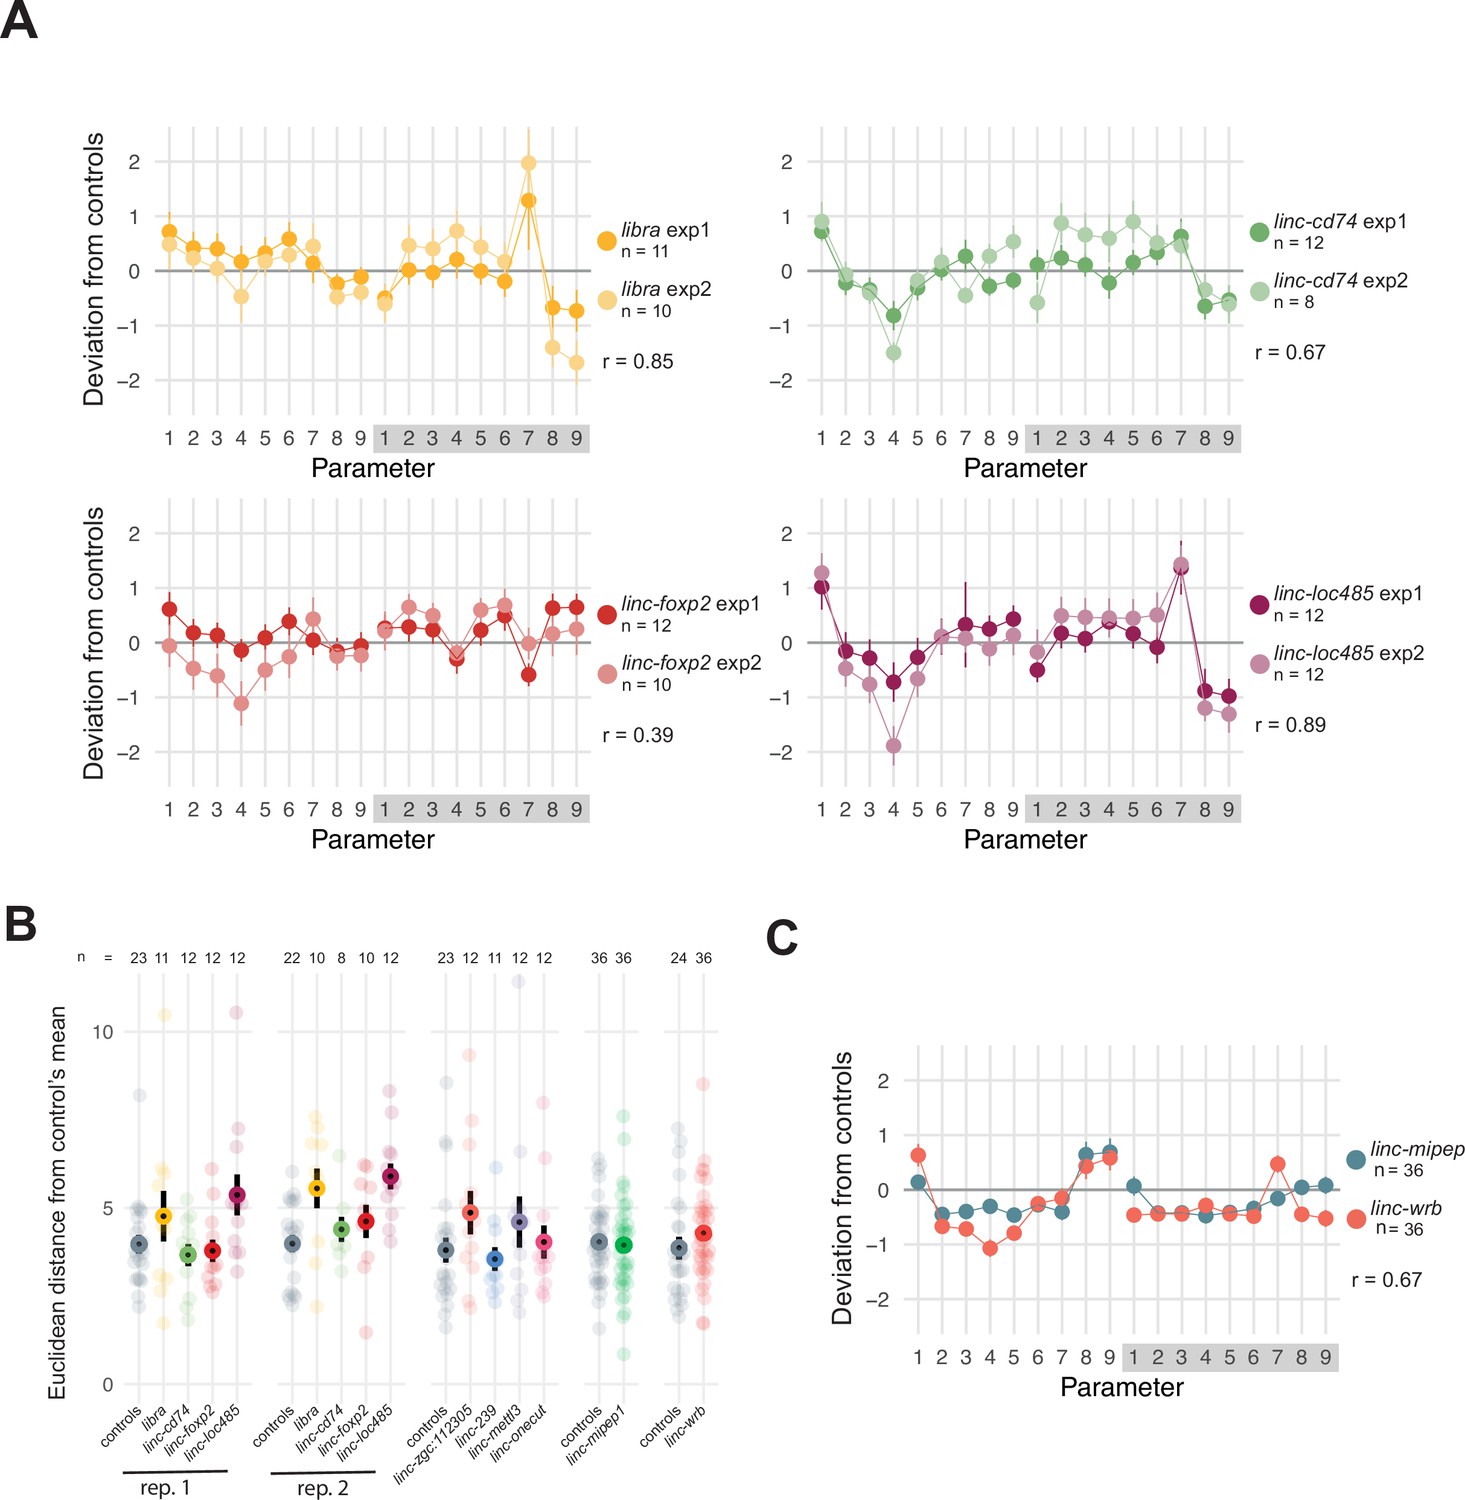
Screening for micropeptide loss-of-function effects on zebrafish baseline behavior.
(A) Behavioral fingerprints for independent experimental replicates for libra, linc-cd74, linc-foxp2, and linc-loc100334485 (labeled linc-loc485). Deviation (Z-score, mean ± SEM) of each mutant (F0)larva from the mean of their wild-type siblings across all parameters in day and night. Parameters are as follows: (1) active bout length (duration of each active bout in seconds); (2) active bout mean (mean of the Δ pixels composing each active bout); (3) active bout standard deviation (mean of the Δ pixels composing each active bout); (4) active bout total (sum of the Δ pixels composing each active bout); (5) active bout minimum (smallest Δ pixels of each bout); (6) active bout maximum (largest Δ pixels of each bout); (7) number of active bouts during the entire day or night; (8) total time active (% of the day or night); (9) inactive bout length (duration of each pause between active bouts in seconds). Exp1, experiment 1. Exp2, experiment 2. r=Pearson’s correlation coefficient between replicate experiments. (B) Euclidean distance from controls’ mean across 18 behavioral parameters (described in A) for independent F0 experiments targeting putative coding sequence of previously identified lincRNAs. Number of larvae per experiment labeled (n).Rep, replicate. (C) Behavioral fingerprints for linc-mipep (green) and linc-wrb (orange) F0 experiments. Deviation (Z-score, mean ± SEM) of each mutant (F0)larva from the mean of their wild-type siblings across all parameters, labeled as in A. r=Pearson’s correlation coefficient between linc-mipep and linc-wrb behavioral fingerprints.
Figure 1—figure supplement 4
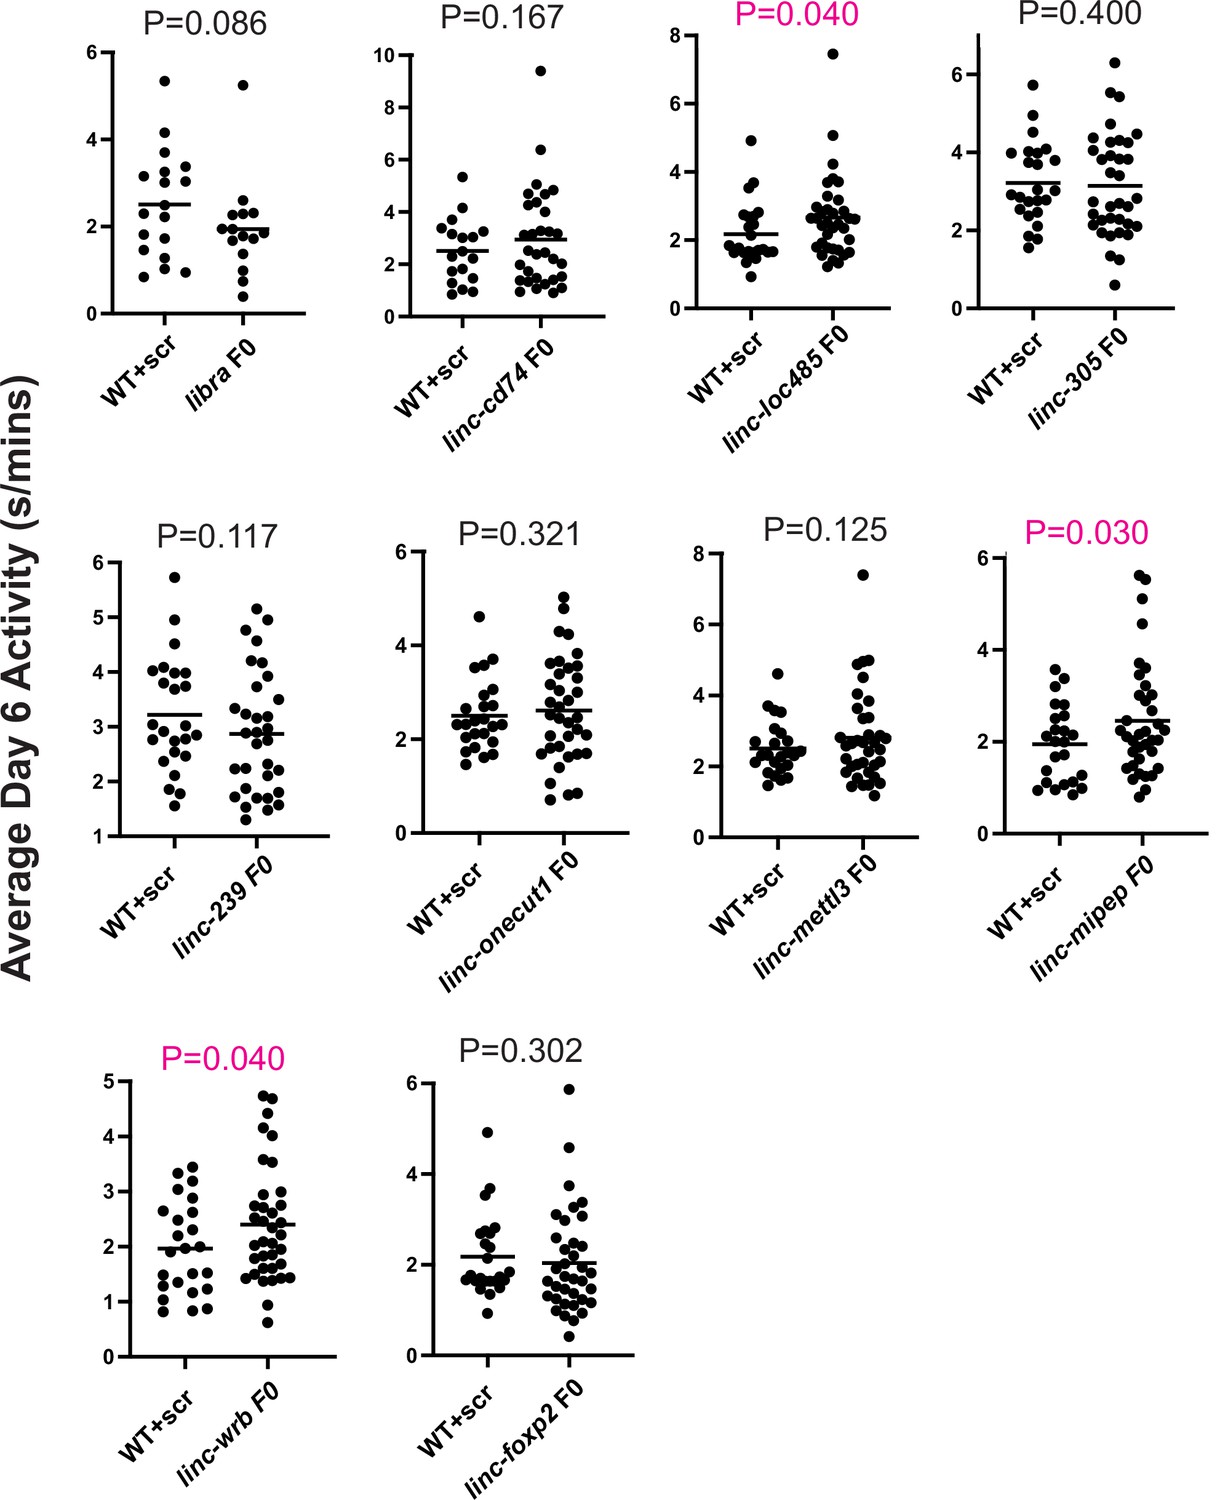
Average daytime activity differences between WT and F0 knockouts of candidate micropeptides.
Dot plots of the average daytime activity at 6 dpf between sibling wild-type larvae injected with scrambled guides (WT+scr) and F0 knockouts of candidate micropeptides. Left axis, average activity at day 6 (in s/mins). Each dot represents one larva. p Values (unpaired one-tailed t-test with Welch’s correction) above each targeted gene, with significant values indicated in magenta. Shown for linc-epb41l4a (libra), linc-cd74, linc-loc100334485 (written as ‘linc-loc485’), linc-zgc:112305 (written as ‘linc-305’), linc-Zv9_00058239 (written as ‘linc-239’), linc-onecut1, linc-mettl3, linc-mipep, linc-wrb, and linc-foxp2.
Figure 1—figure supplement 5
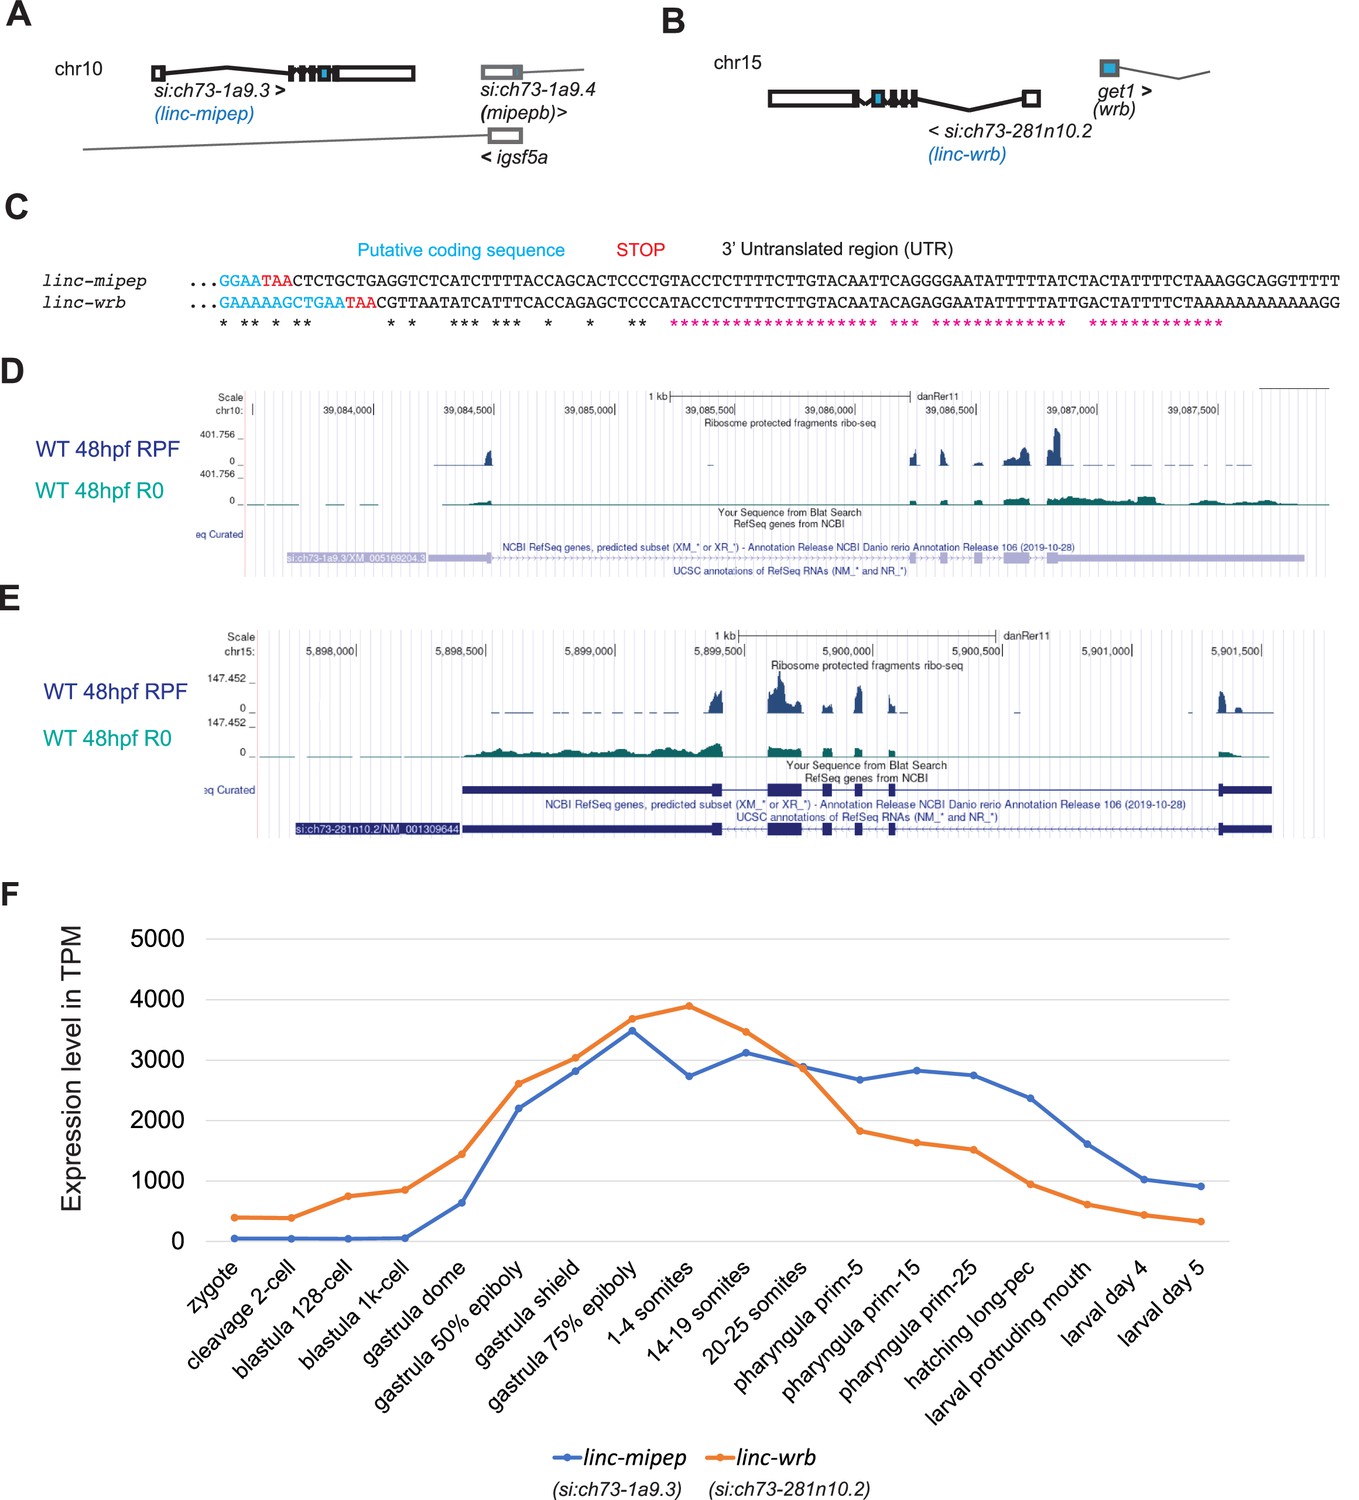
linc-mipep and linc-wrb gene expression in early zebrafish development.
(A) Gene location of linc-mipep, currently annotated as si:ch73-1a9.3, on chromosome 10 (Danio rerio, danRer11). linc-mipep contains 6 exons, a 5’UTR and a 3’UTR on the forward strand and is located approximately 3.5kb upstream of si:ch73-1a9.4 (mipepb). linc-mipep lies within intron 1 of igsf5a on the reverse (opposite) strand. (B) Gene location of linc-wrb, currently annotated as si:ch73-281n10.2, on chromosome 15 (Danio rerio, danRer11). linc-wrb contains 6 exons, a 5’UTR and a 3’UTR on the reverse strand, and its start site is located approximately 450bp upstream of the get1 (also known as wrb) start site on the forward (opposite) strand. (C) A conserved proximal 3’UTR sequence between linc-mipep and linc-wrb is denoted with magenta asterisks. Black asterisks, conserved nucleotides. Cyan nucleotides, putative coding sequence. Stop codon is denoted in red. 3’ untranslated region (UTR) is in black text. (D) Tracks at the annotated si:ch73-1a9.3 (linc-mipep) gene, showing ribosome protected fragments (RPF, dark blue) or ribosome-depleted RNA-seq (R0, green) from wild type zebrafish embryos at 48hours post-fertilization (hpf). (E) Tracks at the annotated si:ch73-281n10.2 (linc-wrb) gene, showing ribosome protected fragments (RPF, dark blue) or ribosome-depleted RNA-seq (R0, green) from wild type zebrafish embryos at 48hpf. (F) Baseline expression of linc-mipep (blue) or linc-wrb (orange) from transcriptional profiling of zebrafish developmental stages, scaled by transcripts per million (TPM). Data from White et al., 2017.
Figure 1—figure supplement 6
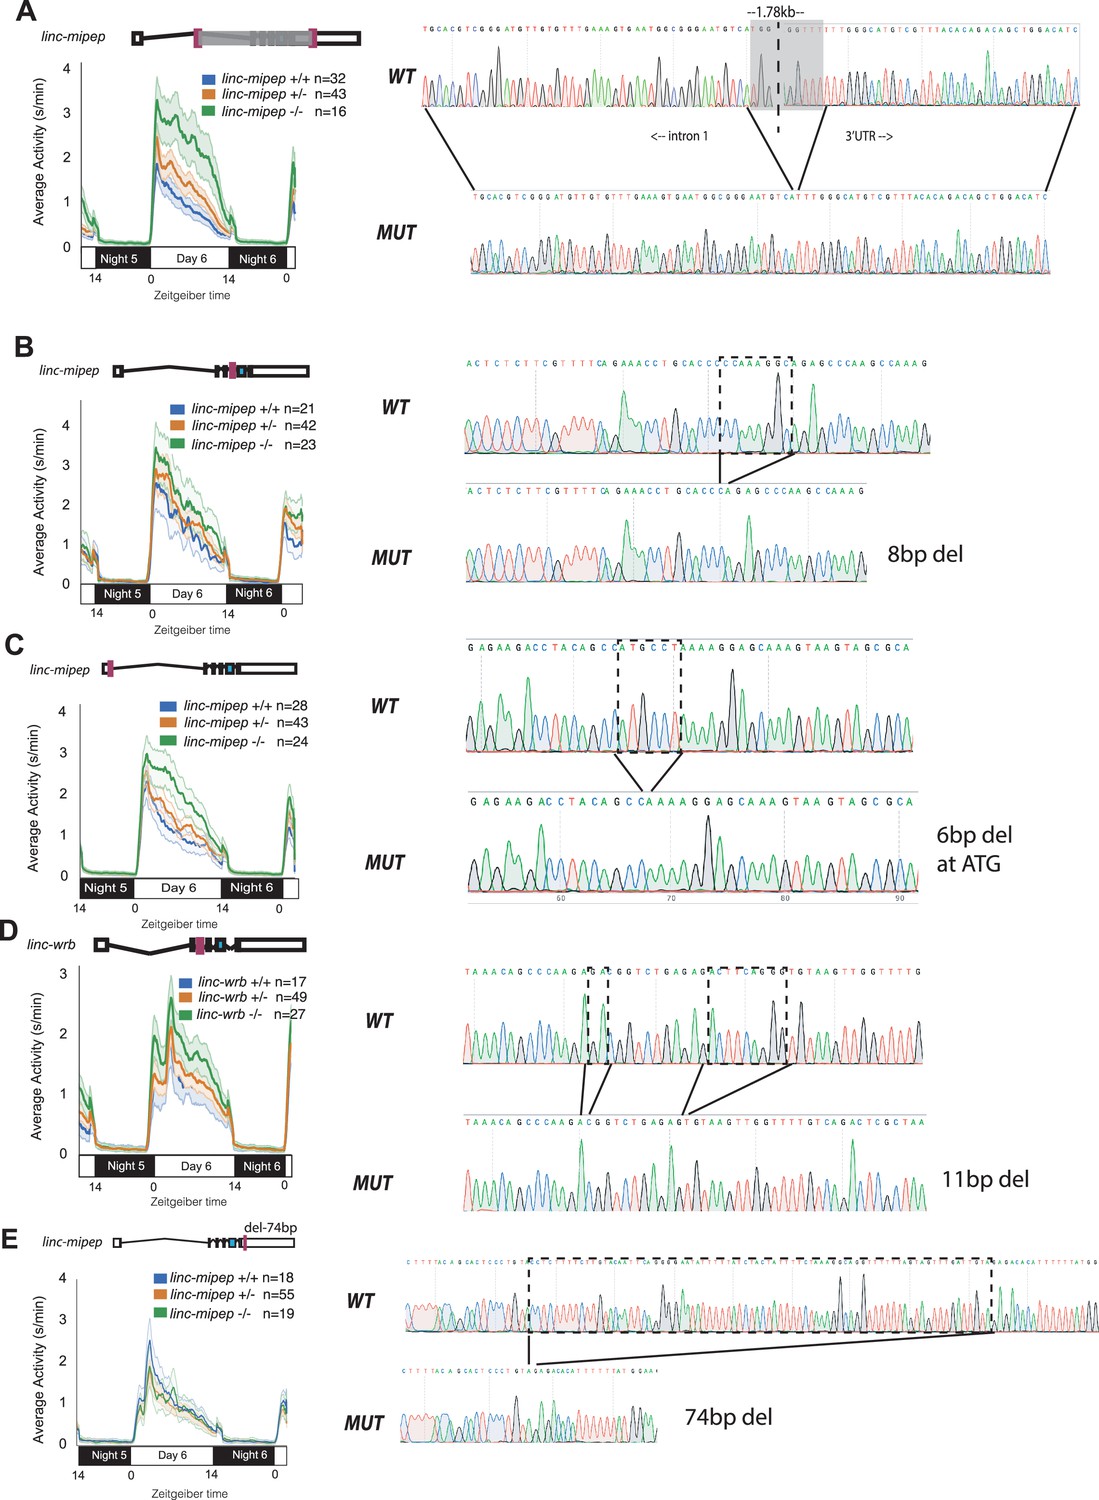
Stable linc-mipep and linc-wrb mutant behavioral profiles and sequence verification.
(A) Left, locomotor activity of linc-mipepdel-1.8kb/del-1.8kb (linc-mipep -/-, green); linc-mipepdel-1.8kb/+ (linc-mipep +/-, orange); and wild-type (linc-mipep +/+, blue) sibling larvae over 2 nights. The ribbon represents± SEM. Zeitgeber time is defined from lights ON = 0. Schematic of mutation is above plot, with gray shade indicating the deletion. Right, Sanger sequencing validation of mutated sequence (bottom) compared to wild type sequence, verifying a 1.78kb deletion from intron 1 through to the 3’UTR of linc-mipep. (B) Left, locomotor activity of linc-mipepdel8bp/del8bp (linc-mipep -/-, green); linc-mipepdel8bp /+ (linc-mipep +/-, orange); and wild-type (linc-mipep +/+, blue) sibling-matched larvae over 2 nights. Schematic of mutation is above plot, with mutation location indicated in purple. Right, Sanger sequencing validation of mutated sequence (bottom) compared to wild type sequence, verifying an 8bp deletion in exon 4 of linc-mipep coding sequence. (C) Left, locomotor activity of linc-mipepdelATG/delATG (linc-mipep -/-, green); linc-mipepdelATG /+ (linc-mipep +/-, orange); and wild-type (linc-mipep +/+, blue) sibling-matched larvae over 2 nights. Schematic of mutation is above plot, with mutation location indicated in purple. Right, Sanger sequencing validation of mutated sequence (bottom) compared to wild-type sequence, verifying a 6bp deletion which includes the start codon (ATG) of linc-mipep coding sequence. (D) Locomotor activity of linc-wrbdel-11/del-11 (linc-wrb -/-, green); linc-wrbdel-11/+ (linc-wrb +/-, orange); and wild-type (linc-wrb +/+, blue) sibling-matched larvae over two nights. Schematic of mutation is above plot. Right, Sanger sequencing validation of mutated sequence (bottom) compared to wild-type sequence, verifying an 11bp deletion (−2/–9bp) at exon 3 of linc-wrb coding sequence. (E) Locomotor activity of linc-mipep3’UTR-74bpdel /3’UTR-74bpdel (linc-mipep -/-, green); linc-mipep3’UTR-74bpdel /+ (linc-mipep +/-, orange); and wild-type (linc-mipep +/+, blue) sibling-matched larvae over two nights. Schematic of mutation is above plot, with mutation location indicated in purple. Right, Sanger sequencing validation of mutated sequence (bottom) compared to wild-type sequence, verifying a 74bp deletion of the conserved element in the linc-mipep 3’UTR.
Figure 1—figure supplement 7
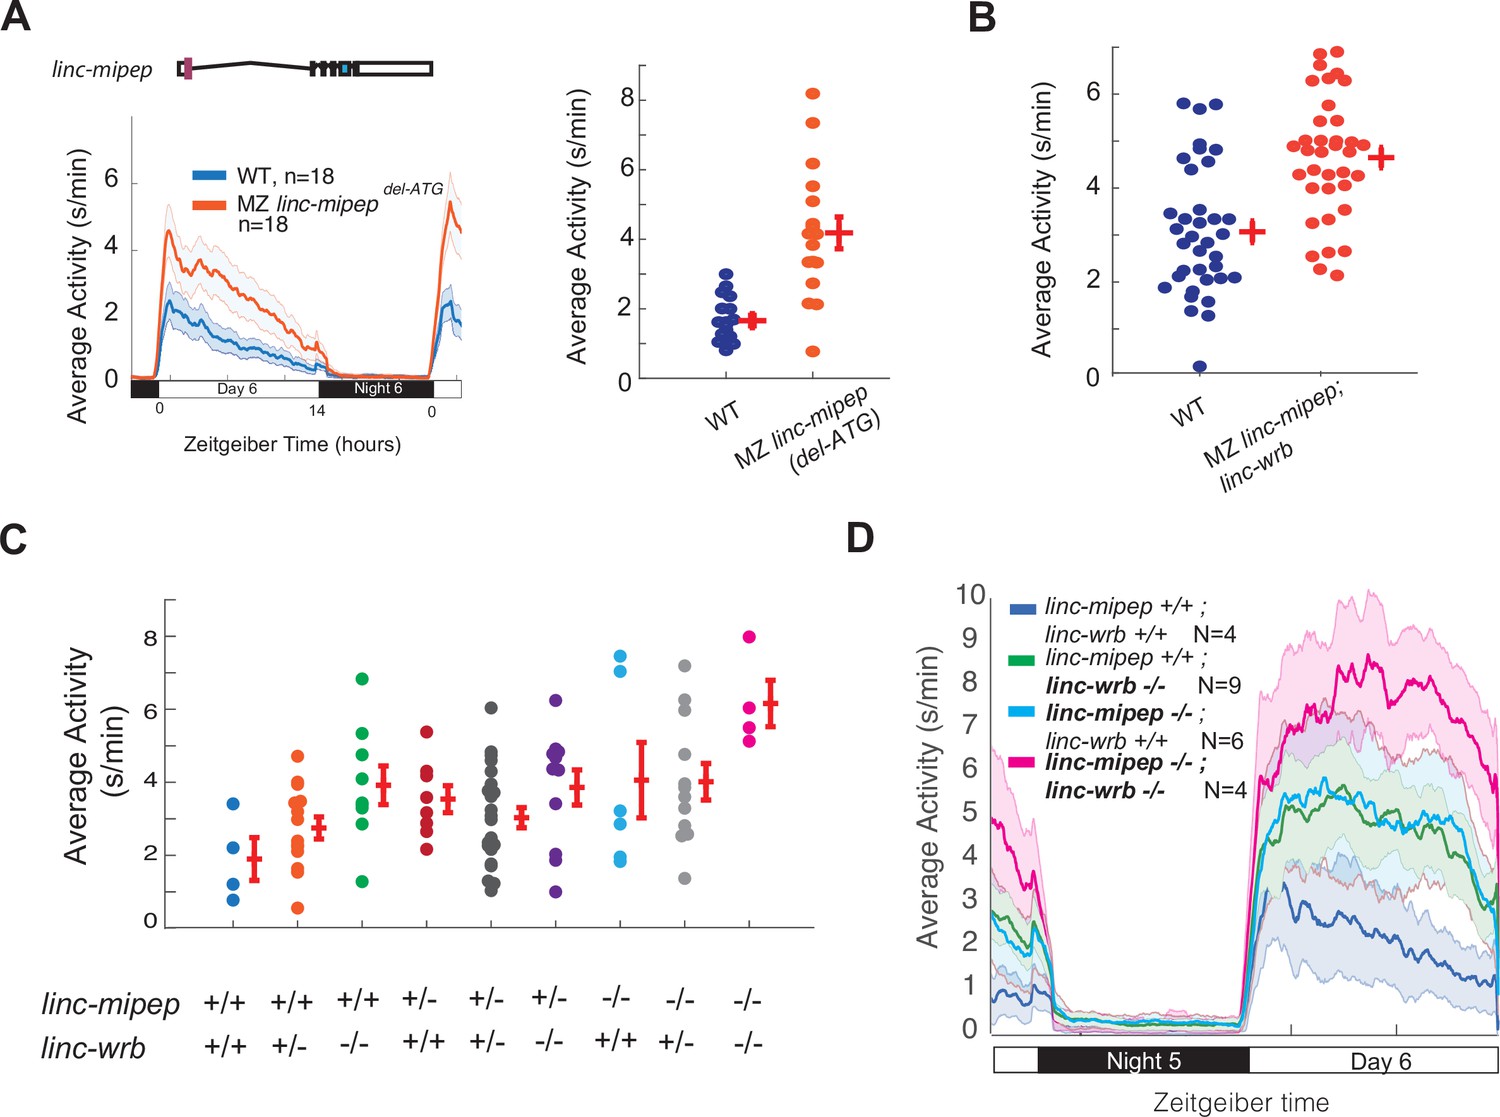
linc-mipep and linc-wrb loss-of-protein-function mutant larvae are behaviorally hyperactive in a dose-dependent manner.
(A) Left, locomotor activity of wild type (WT, blue) or maternal-zygotic linc-mipep delATG/delATG (MZ linc-mipep delATG, orange) larvae over 24hr. Right, average activity at 6 dpf plotted for individual larvae from wild type (WT, blue) or maternal-zygotic (MZ) linc-mipep delATG/delATG mutant fish. Each dot represents a single larva, and crossbars plot the mean ± SEM. Average day activity, p=2.2211e-06, one-way ANOVA. (B) Average activity at 6 dpf plotted for individual fish from wild type (WT, blue) or maternal-zygotic linc-mipepdel1.8kb/del1.8bk; linc-wrbdel11bp/del11bp (linc-mipep;linc-wrb, orange) mutant fish, corresponding to fish from Figure 1h. Each dot represents a single fish, and crossbars plot the mean ± SEM. p=8.3762e-05, one-way ANOVA. (C) Average activity of 6 dpf progeny from a linc-mipepdel-1.8kb/+; linc-wrbdel-11/+ double-heterozygous incross. Genotypes are indicated by +/+ (wild type), +/- (heterozygous), or -/- (homozygous) for linc-mipep and linc-wrb. Each dot represents a single fish, and crossbars plot the mean ± SEM. p=0.0474, one-way ANOVA. (D) Locomotor activity of linc-mipepdel-1.8kb/del-1.8kb;linc-wrbdel-11/del-11 (linc-mipep -/-; linc-wrb -/-, magenta); linc-mipepdel-1.8kb/del-1.8kb;linc-wrb+/+ (linc-mipep -/-; linc-wrb +/+, cyan); linc-mipep+/+; linc-wrbdel-11/del-11 (linc-mipep +/+; linc-wrb -/-, green); and wild-type (linc-mipep +/+; linc-wrb +/+, blue) sibling-matched larvae over 24hr, corresponding to fish from (C).
Figure 2 with 6 supplements
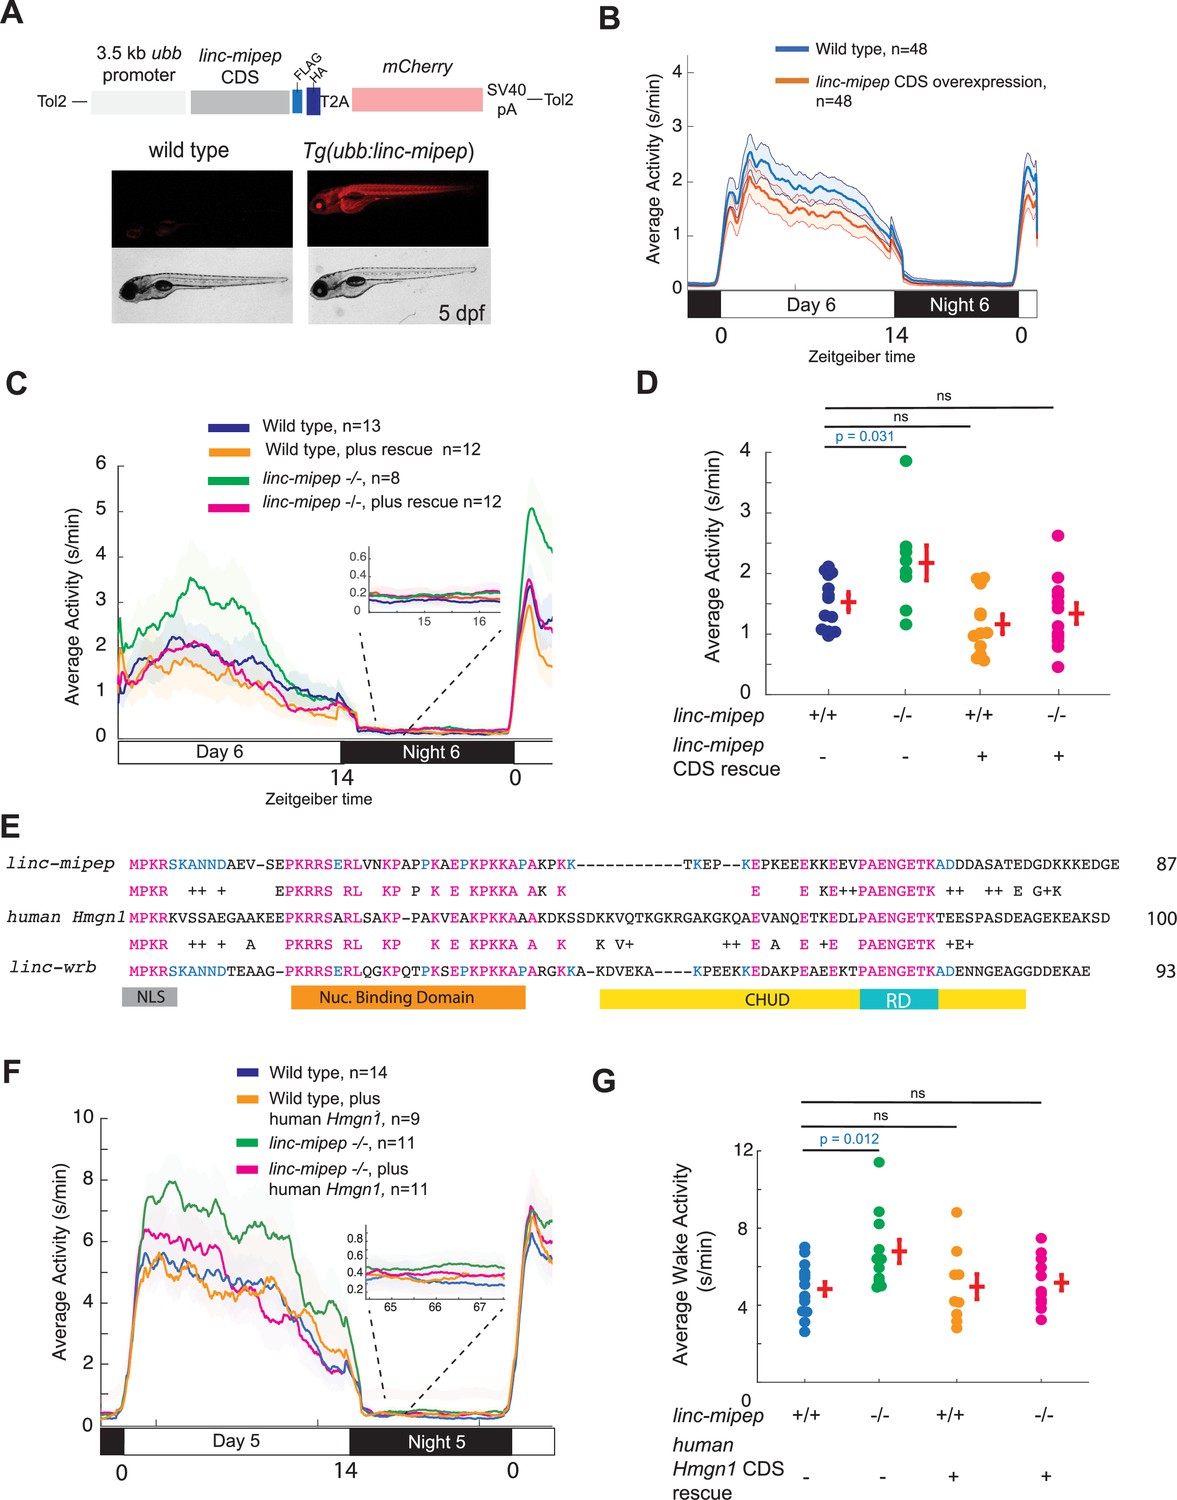
linc-mipep and linc-wrb encode proteins with homology to human HMGN1.
(A) Top, diagram of transgenic linc-mipep overexpression construct. Transgenic lines were established via Tol2-mediated integration of 3.5kb ubiquitin B (ubb) promotor driving the linc-mipep coding sequence with a FLAG and HA tag at the C-terminus, followed by a T2A self-cleaving peptide, mCherry reporter, and SV40 polyA tail. Bottom, fluorescent and brightfield images of 5 dpf zebrafish siblings either without overexpression (wild type, mCherry-negative, left) or with linc-mipep overexpression (mCherry-positive, right). (B) Activity plot of wild type (mCherry-negative, blue) or linc-mipep overexpression (Tg(ubb:linc-mipep) mCherry-positive, orange) siblings at 6 dpf. n=48 per genotype. Average day activity p=0.028, one-way ANOVA. (C) Locomotor activity of linc-mipep mutants, with or without transgenic linc-mipep overexpression (Tg(ubb:linc-mipep CDS-T2A-mCherry), ‘rescue’), sibling-matched larvae over 24hr. Inset, no effect on nighttime activity. (D) Average waking activity of 6 dpf linc-mipep mutant, heterozygous, or wild type larvae, with (denoted by +) or without (denoted by -) linc-mipep transgenic rescue. Each dot represents a single fish, and crossbars plot the mean ± SEM. p Values from a Dunnett’s test, using wild type (linc-mipep +/+) as the baseline condition. (E) Amino acid sequences of linc-mipep (top), linc-wrb (bottom), and human Hmgn1 (middle). Conserved amino acids are denoted in blue (if conserved between two sequences) or magenta (if conserved across the three sequences). Conserved functional domains for Hmgn1 are denoted (NLS, nuclear localization signal; Nuclear Binding Domain; RD, Regulatory Domain; and CHUD, Chromatin Unwinding Domain). (F) Locomotor activity of linc-mipep mutants, with or without transgenic human Hmgn1 overexpression (Tg(ubb:hHmgn1CDS-T2A-mCherry), ‘rescue’), sibling-matched larvae over 24hr. Inset, no effect on nighttime activity. (G) Average waking activity of 6 dpf linc-mipep mutant (-/-) or wild type (+/+) larvae, with (denoted by +) or without (denoted by -) human Hmgn1 transgenic rescue. Each dot represents a single larva, and crossbars plot the mean ± SEM. p Values from a Dunnett’s test, using wild type (linc-mipep +/+) as the baseline condition.
Figure 2—figure supplement 1
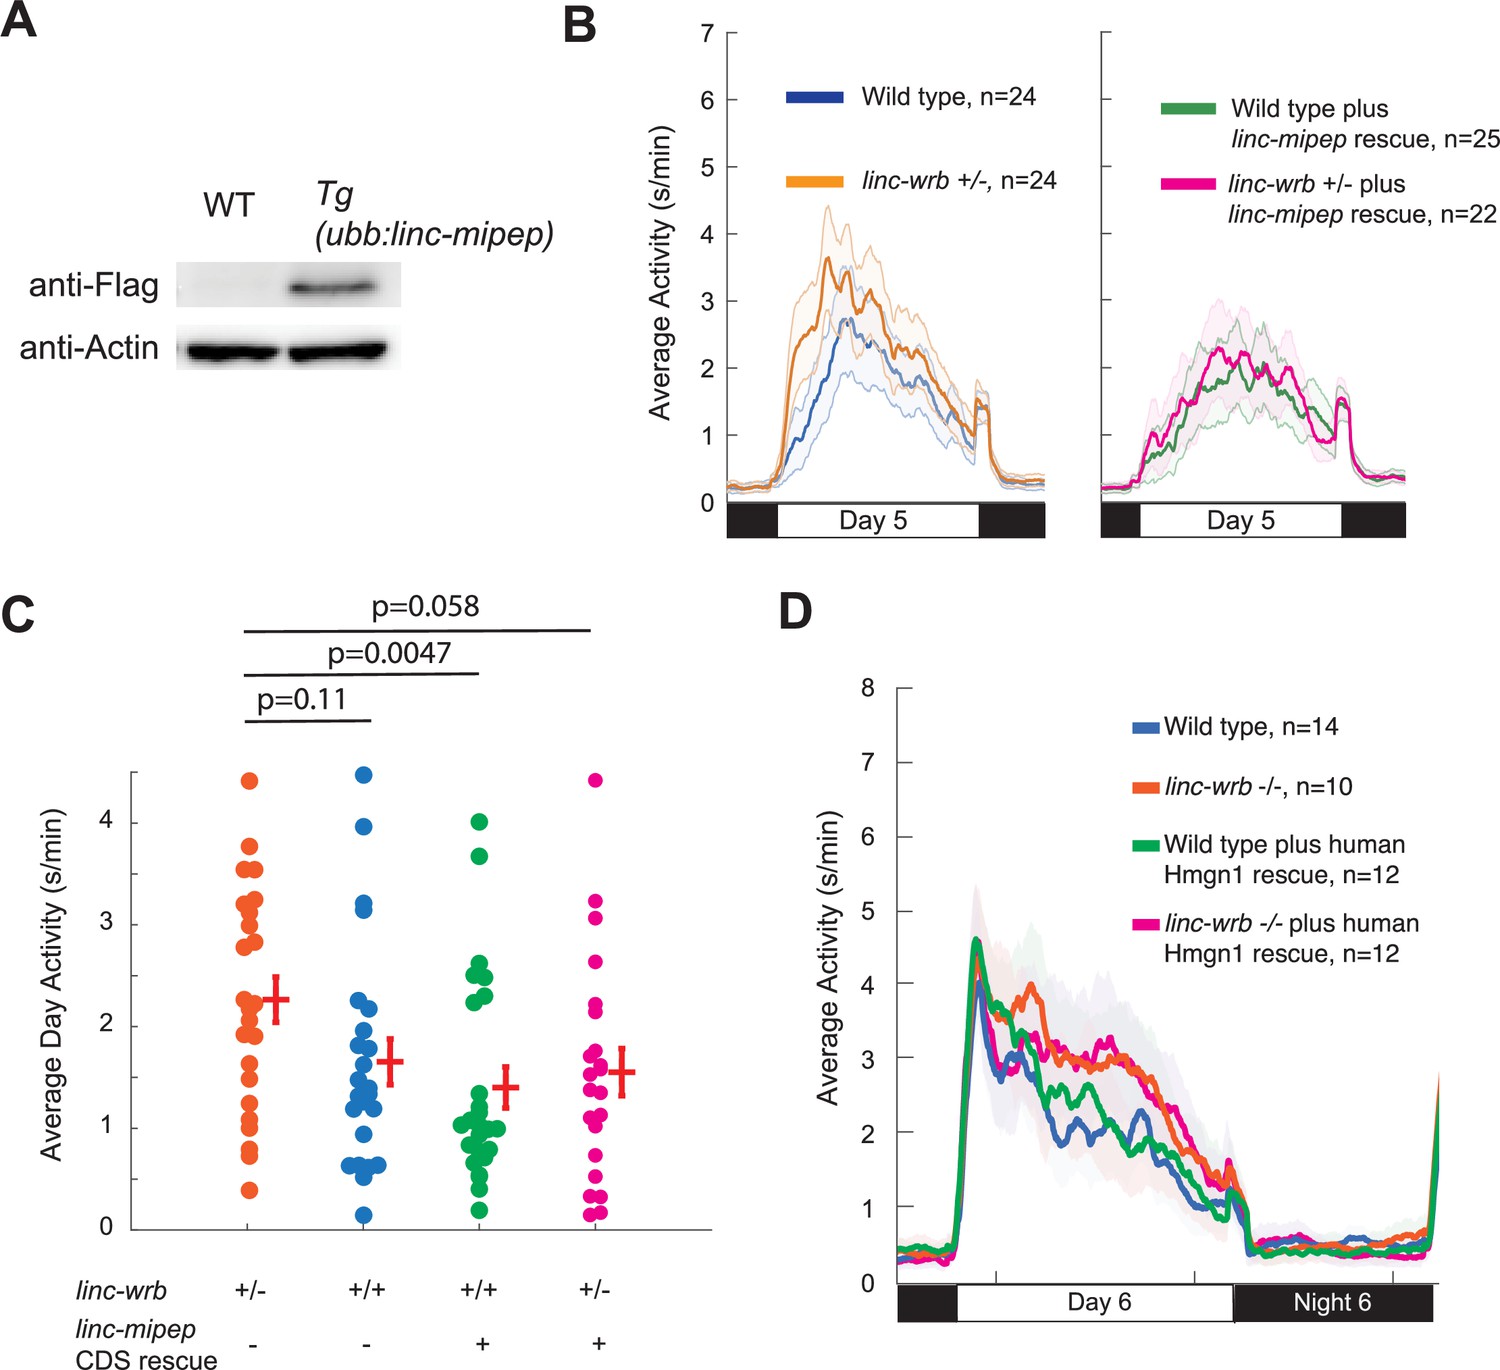
linc-wrb mutant behavioral phenotype can be rescued by transgenic linc-mipep CDS, though not by human Hmgn1 CDS.
(A) Western blot against FLAG or Actin of WT or (Tg(ubb:linc-mipep CDS-FLAG-HA-T2A-mCherry) transgenic incross) embryos at 6 hpf. (B) Locomotor activity of linc-wrb heterozygous mutants (+/-) or sibling wild type (+/+) fish, with or without transgenic linc-mipep overexpression (Tg(ubb:linc-mipep CDS-T2A-mCherry), ‘rescue’), over 24hr. Both plots show the same experiment separated by without rescue (left) and with rescue (right). (C) Average activity of 5 dpf linc-wrb heterozygous (+/-) or wild type (+/+) larvae, with (denoted by +) or without (denoted by -) linc-mipep transgenic rescue. Each dot represents a single fish, and crossbars plot the mean ± SEM. p Values from a Dunnett’s test, using linc-wrb+/- asthe baseline condition. (D) Locomotor activity of linc-wrb homozygous mutants or sibling wild type fish, with or without transgenic human Hmgn1 overexpression (Tg(ubb:hHmgn1CDS-T2A-mCherry), ‘rescue’), over 24hr at 6 dpf.
Figure 2—figure supplement 2

Antibody staining confirmation of proteins encoded by linc-mipep and linc-wrb.
(A) The amino acid sequence for the protein encoded by linc-mipep, with the custom antibody designed to detect the underlined sequence in magenta. Arrows indicate the location of mutations in the protein-coding sequence: orange arrow (linc-mipepdelATG); black arrow (linc-mipep del-1.8kb); cyan arrow (linc-mipepdel8bp). Asterisk denotes the location of the mutation used throughout this figure. (B) The amino acid sequence for the protein encoded by linc-wrb, with the custom antibody designed to detect the underlined sequence in magenta. Arrow indicates the location of the mutation in the protein-coding sequence for linc-wrbdel11. Asterisk denotes that this mutant is used throughout this figure. (C) Confocal images of Linc-mipep protein (green) and DAPI (nuclei, white), in 4 hpf zebrafish embryos. (D) Confocal images of Linc-wrb protein (green) and DAPI (nuclei, white), in 4 hpf zebrafish embryos. White arrows indicate non-mitotic nuclei; orange arrows indicate mitotic nuclei, which show no linc-wrb antibody staining. (E) Confocal maximum projection Z-stack of a 1 dpf wild type embryo, stained with Linc-mipep antibody (yellow) and DAPI (blue). Images were stitched together to show the full embryo. (F) Confocal maximum projection Z-stack of a 4 dpf wild type larva, stained with Linc-mipep antibody (yellow) and DAPI (blue). Images were stitched together to show the full larva. (G) Confocal maximum projection Z-stack of a 1 dpf wild type embryo, stained with Linc-wrb antibody (yellow) and DAPI (blue). Images were stitched together to show the full embryo.(H) Confocal maximum projection Z-stack of a 4 dpf wild type larva, stained with Linc-wrb antibody (yellow) and DAPI (blue). Images were stitched together to show the full larva. (I) Magnified confocal maximum projection Z-stack of the trunk of a 4 dpf wild type larva, stained with Linc-mipep antibody (yellow) and DAPI (blue). (J) Magnified confocal maximum projection Z-stack of the trunk of 4 dpf wild type larva (left) or linc-wrb mutant larve (right), stained with Linc-wrb antibody (yellow) and DAPI (blue), Orange arrows indicate non-specific antibody staining. (K) Maximum projection confocal images of linc-mipep (orange, intensity by depth) and DAPI (nuclei, blue) in 6 dpf zebrafish forebrains (dorsal view), in wild type (WT, top) or linc-mipep; linc-wrb double mutants (bottom). (L) Confocal images of Linc-wrb (orange, intensity by depth) and DAPI (nuclei, blue) in 6 dpf zebrafish forebrains (dorsal view), in wild type (WT, top) or linc-mipep; linc-wrb double mutants (bottom).
Figure 2—figure supplement 3

linc-mipep and linc-wrb encode proteins with homology to human HMGN1.
(A) Multiple sequence alignment of cDNA sequences of human Hmgn1 (hHmgn1), linc-mipep, and linc-wrb. Asterisks, nucleotide conservation across all three CDS. (B) Transcripts for linc-mipep (top), linc-wrb (bottom), and human Hmgn1 (middle), normalized for scale. Transcript length denoted on top right of each. A conserved proximal 3’UTR sequence across species is denoted with boxes and dashed lines. (C) Multiple sequence alignment of 3’UTR sequences of linc-mipep, linc-wrb, and Hmgn1 across select species. Gray, coding sequence. Red, stop codon. Pink or magenta asterisks, partial or full nucleotide conservation across species, respectively. linc-wrb and linc-mipep, zebrafish genes with homology to HMGN1. xhmgn1, Xenopus tropicalis. finchhmgn1, zebra finch. mHmgn1, mouse. hHmgn1, human. panHmgn1, chimpanzee (Pan troglodytes). (D) Identification of a gene syntenic to human HMGN1 (chromosome 21) in the invertebrate lancelet (Amphioxus, Branchiostoma floridae) genome. The APEX1-like gene N terminus BLASTs to HMGN genes, shown here for select species. (E) Multiple sequence alignment of ancestral sea lamprey putative HMGN1 ORF and human HMGN1 (top) and HMGN2 (bottom). NBD, nucleosome binding domain (with core indicated). RD, regulatory domain. Amino acids functionally required (magenta) or conserved in HMGN1 or HMGN2 lineages (orange) as indicated.
Figure 2—figure supplement 4
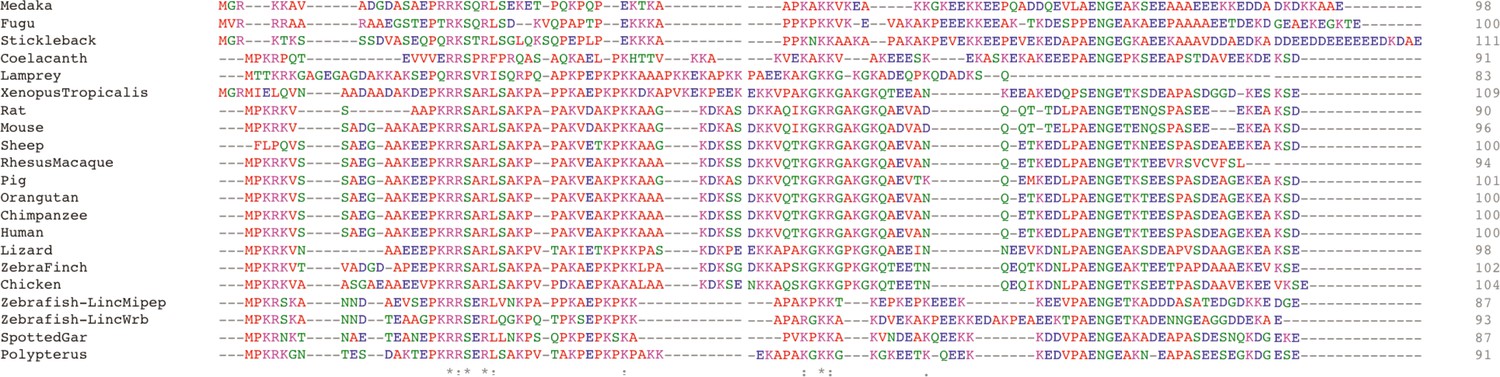
Amino acid sequence alignment for identified HMGN1 sequences across species.
Clustal Omega multiple sequence alignment of the identified or proposed HMGN (ancestral) or HMGN1 sequences across species as indicated. Full sequences of an extended species list are presented in Supplementary file 2.
Figure 2—figure supplement 5
Syntenic analysis of linc-mipep and linc-wrb.
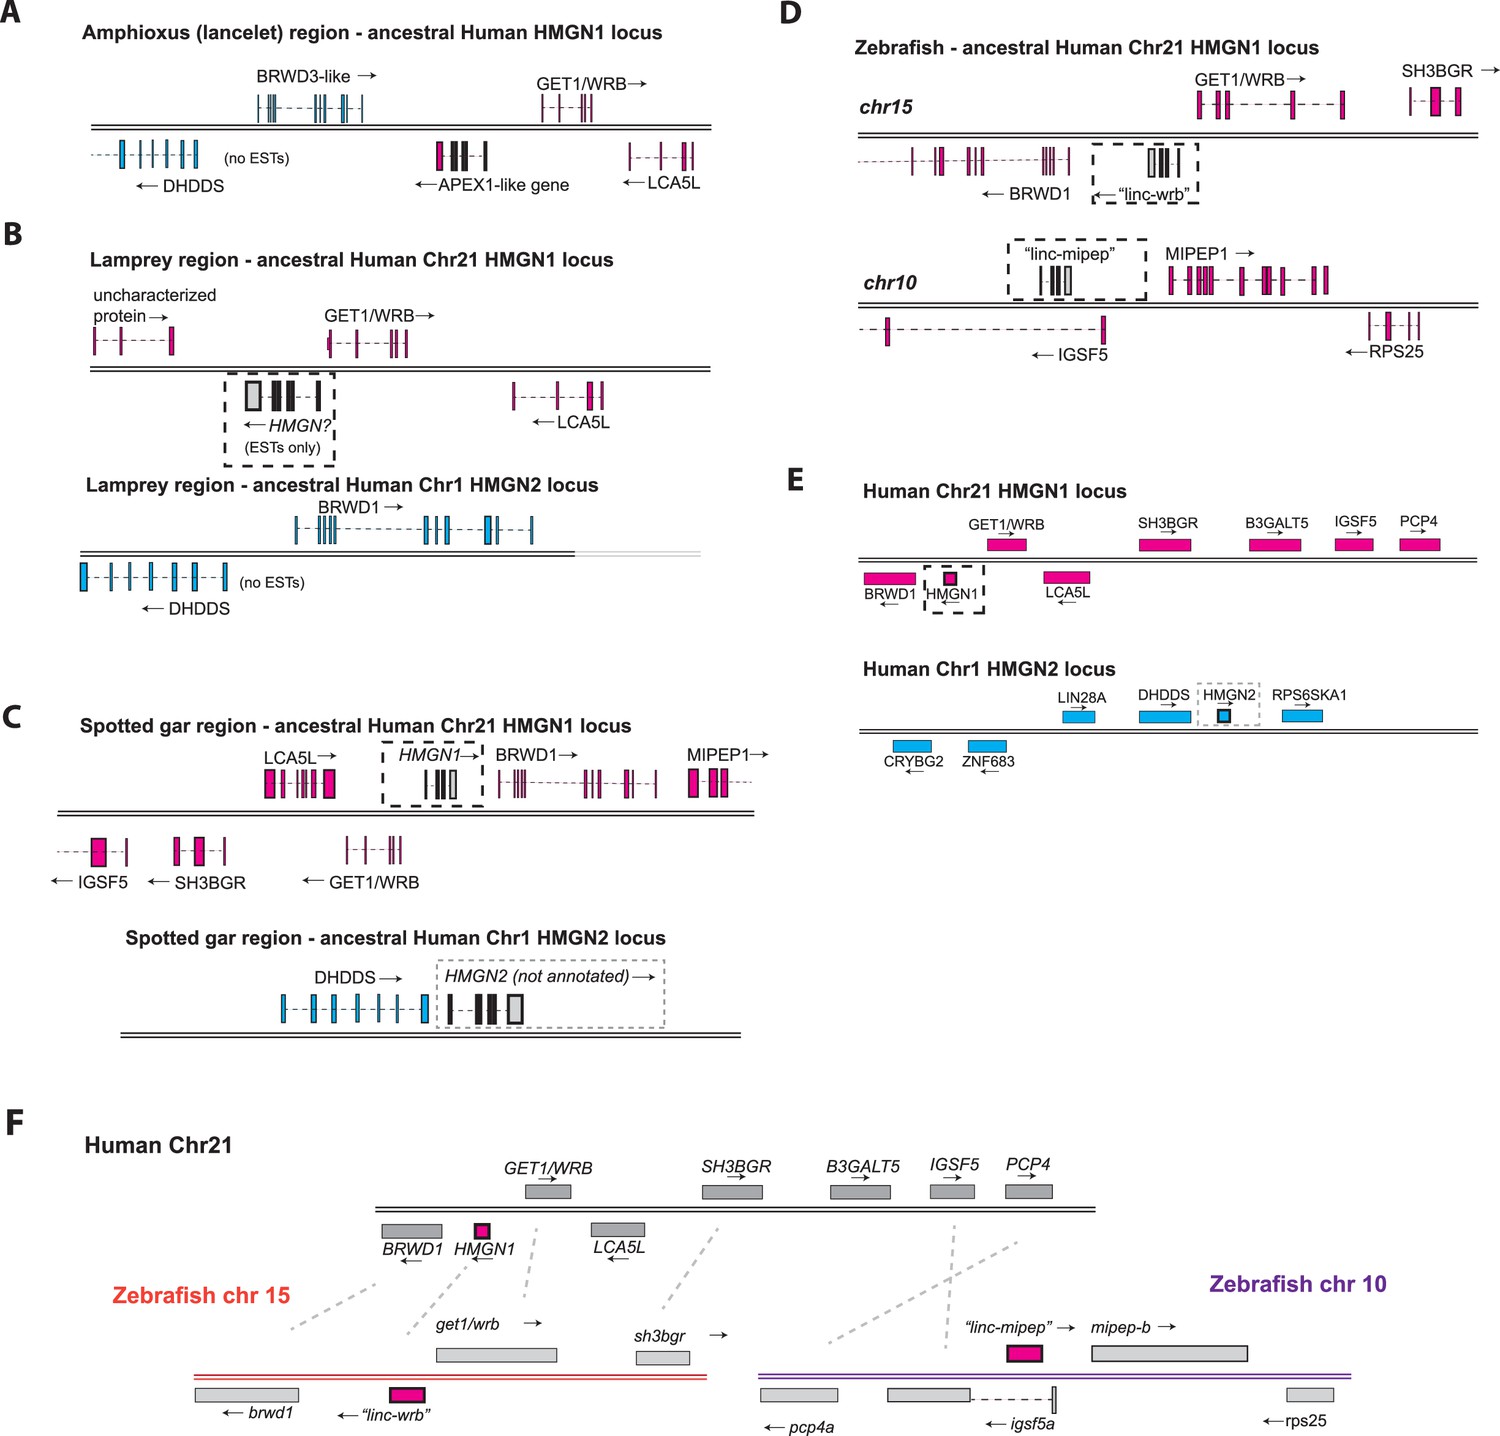
(A) Amphioxus (lancelet) region at the putative syntenic region to human HMGN1 locus, indicated by WRB and BRWD3-like flanking an APEX1-like gene (putative evolutionary location of vertebrate HMGN). Cyan denotes the regions syntenic to human chromosome 1 at the HMGN2 gene; magenta denotes the regions syntenic to human chromosome 21 at the HMGN1 gene. EST, expressed sequence tag. (B) Top, sea lamprey region at the putative syntenic region to human HMGN1. The putative ancestral HMGN gene, identified by expressed sequence tags (ESTs) but otherwise unannotated, is denoted by a dotted line box. Bottom, sea lamprey region at the putative syntenic region to human Hmgn2. EST, expressed sequence tag. (C) Top, spotted gar region at the putative syntenic region to human HMGN1. The putative HMGN1 gene, denoted by a dotted line box, is unannotated. MIPEP1 appears downstream BRWD1. Bottom, spotted gar region at the putative syntenic region to human Hmgn2, where HMGN2 coding sequence (boxed region) is present but not annotated. (D) Top, zebrafish region at the putative syntenic region to human HMGN1. The gene encoded by linc-wrb is indicated by a dotted line box. Bottom, zebrafish region of the gene encoded by linc-mipep (dotted line box), which lies within the first intron of IGSF5. (E) Top, human chromosome 21 (at q22.2, Ensembl GRCh38.p13), showing annotations for BRWD1, HMGN1, GET1/WRB, SH3BGR, B3GALT5, IGSF5, and PCP4, in magenta. Bottom, human chromosome 1 showing annotations for CRYBG2, ZNF683, LIN28A, DHDDS, HMGN2, and RPS6KA1, in cyan. (F) Proposed syntenic relationships (dotted lines) between human chromosome 21 (at q22.2, Ensembl GRCh38.p13) and zebrafish chromosomes 15 (left, orange) and 10 (right, purple). Human HMGN1, zebrafish ‘linc-wrb’, and zebrafish ‘linc-mipep’ are highlighted in magenta.
Figure 2—figure supplement 6
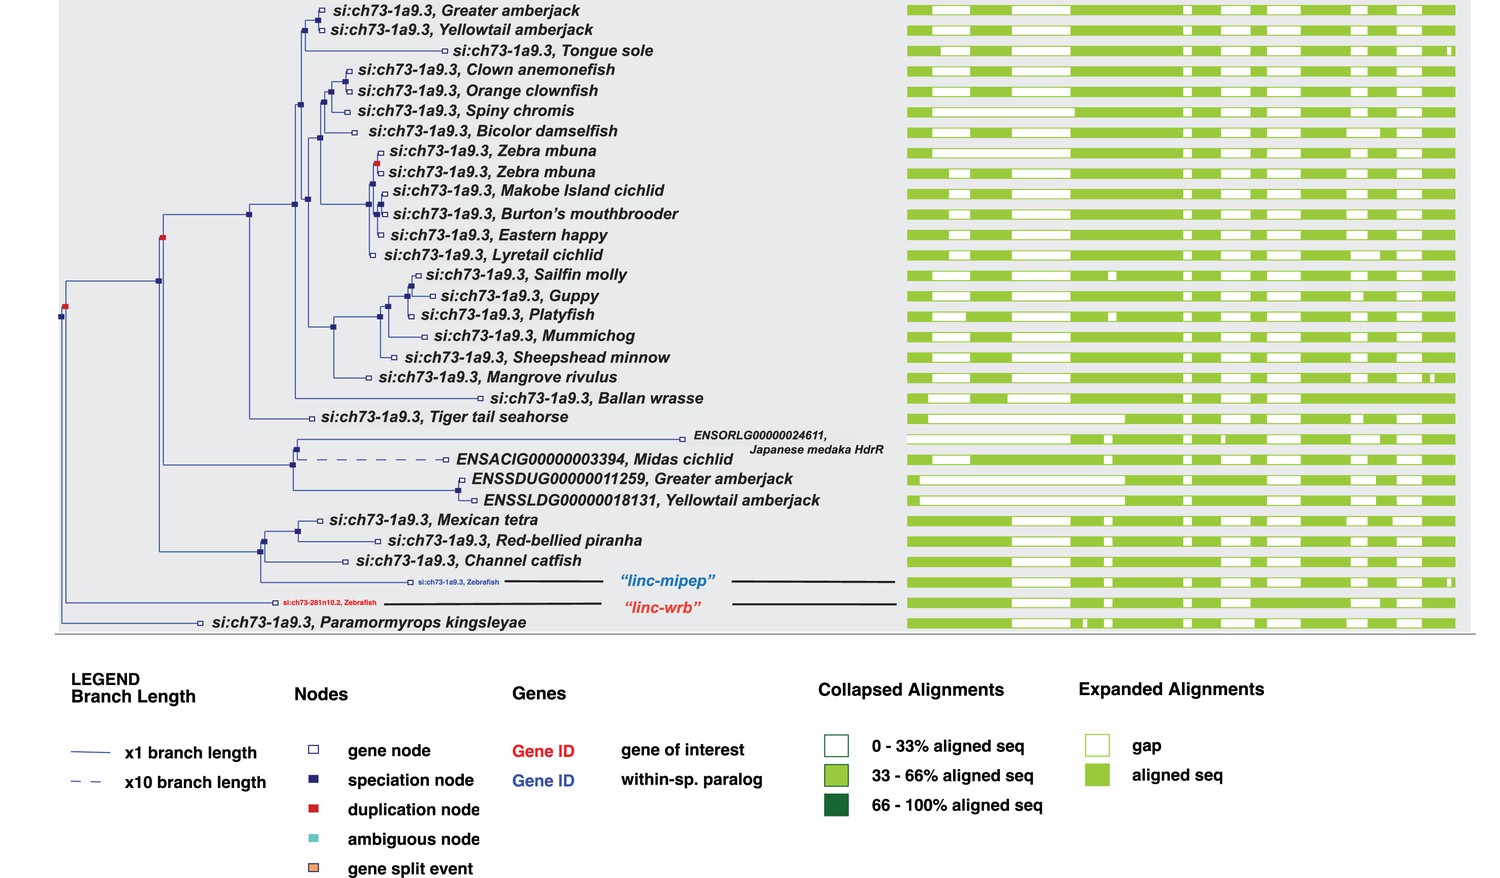
Relationships between genes encoded by linc-mipep and linc-wrb across fish species.
Expanded gene tree of si:ch73-281n10.2 from Ensembl (GRCz11), showing fully expanded tree of identified related genes across fish species. ‘linc-wrb’ is denoted in orange, and ‘linc-mipep’ is denoted in blue. Legends as described in figure.
Figure 3 with 3 supplements
linc-mipep mutants have dysregulation of NMDA receptor-mediated signaling and immediate early gene induction.
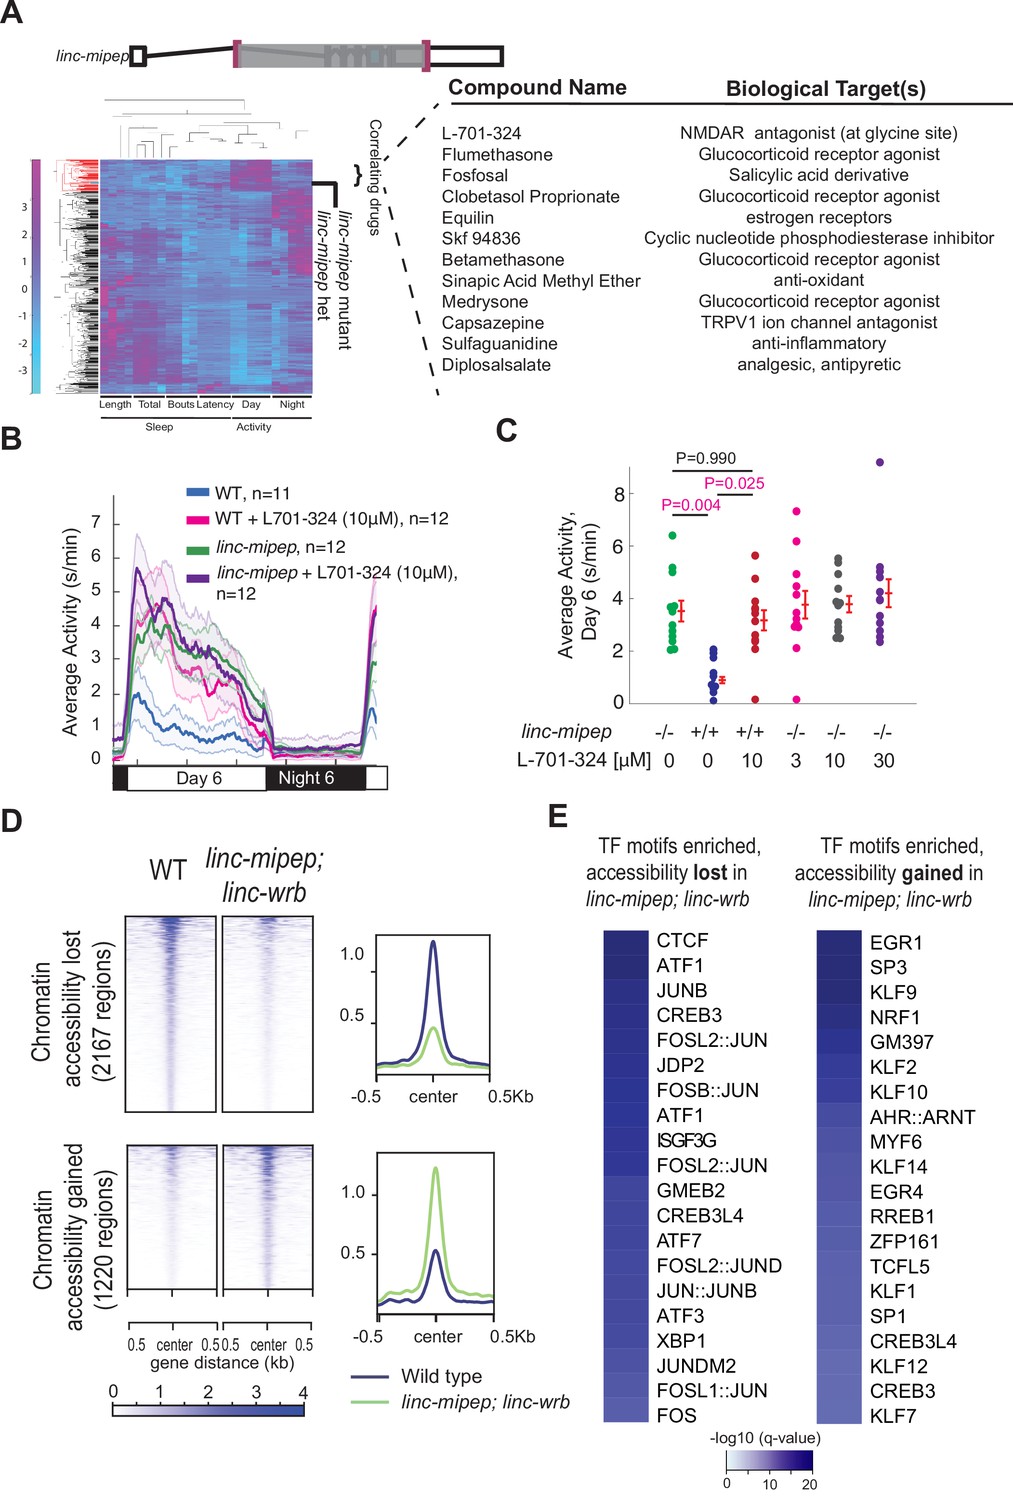
(A) Left, hierarchical clustering of the linc-mipep del-1.8kb (schematic of mutation at top) behavioral fingerprints (right), compared with the fingerprints of wild-type zebrafish larvae exposed to 550 psychoactive agents from 4 to 6 dpf (Rihel et al., 2010). The Z score, defined as the average value (in standard deviations) relative to the behavioral profiles of WT exposed to DMSO, is represented by each rectangle in the clustergram (magenta, higher than DMSO; cyan, lower than DMSO). The linc-mipep del-1.8kb fingerprint correlates with agents that induce daytime activity (‘‘Correlating Drugs’’). Right, compounds ranked according to correlation with the linc-mipep del-1.8kb fingerprint, with biological target(s) noted in last column. (B) Locomotor average activity of wild-type larvae treated with DMSO (WT, blue) or with 10μM NMDA receptor antagonist L-701,324 (magenta), and linc-mipep del-1.8kb/del-1.8kb larvae treated with DMSO (linc-mipep, green) or with 10μM L-701,324 (purple); sibling-matched larvae tracked over 24hr. (C) Average activity (day 6) of WT larvae treated with DMSO or 10μM L-701-324, compared to linc-mipepdel-1.8kb/del-1.8kb larvae treated with DMSO or 3μM, 10μM, or 30μM L-701-324. Each dot represents one fish. L-701–324 has a strong effect in the wild type animals but not in the mutants (P=0.05, DrugXGenotype interaction, two-way ANOVA). Key p-values are shown based on Tukey’s post-hoc testing. (D) Heatmaps (left) and density plots (right) showing chromatin accessibility (omni-ATAC-seq, average of three replicates) profiles of 2167 regions globally with lower accessibility in linc-mipep; linc-wrb mutant brains at 5 dpf compared to wild type (WT) brains (top), or 1220 regions globally with higher accessibility in linc-mipep; linc-wrb mutant brains at 5 dpf compared to wild type (WT) brains. Heatmaps are centered at the summit of the Omni-ATAC peak with 500bp on both sides and ranked according to global accessibility levels in WT. (E) Transcription factor (TF) motifs enriched in up-regulated and down-regulated regions (in D), relative to unaffected regions (in Figure 3—figure supplement 3).
Figure 3—figure supplement 1
Correlating small molecules from hierarchical clustering of linc-mipep or linc-wrb mutant fingerprints with those of wild-type zebrafish larvae exposed to 550 psychoactive agents.
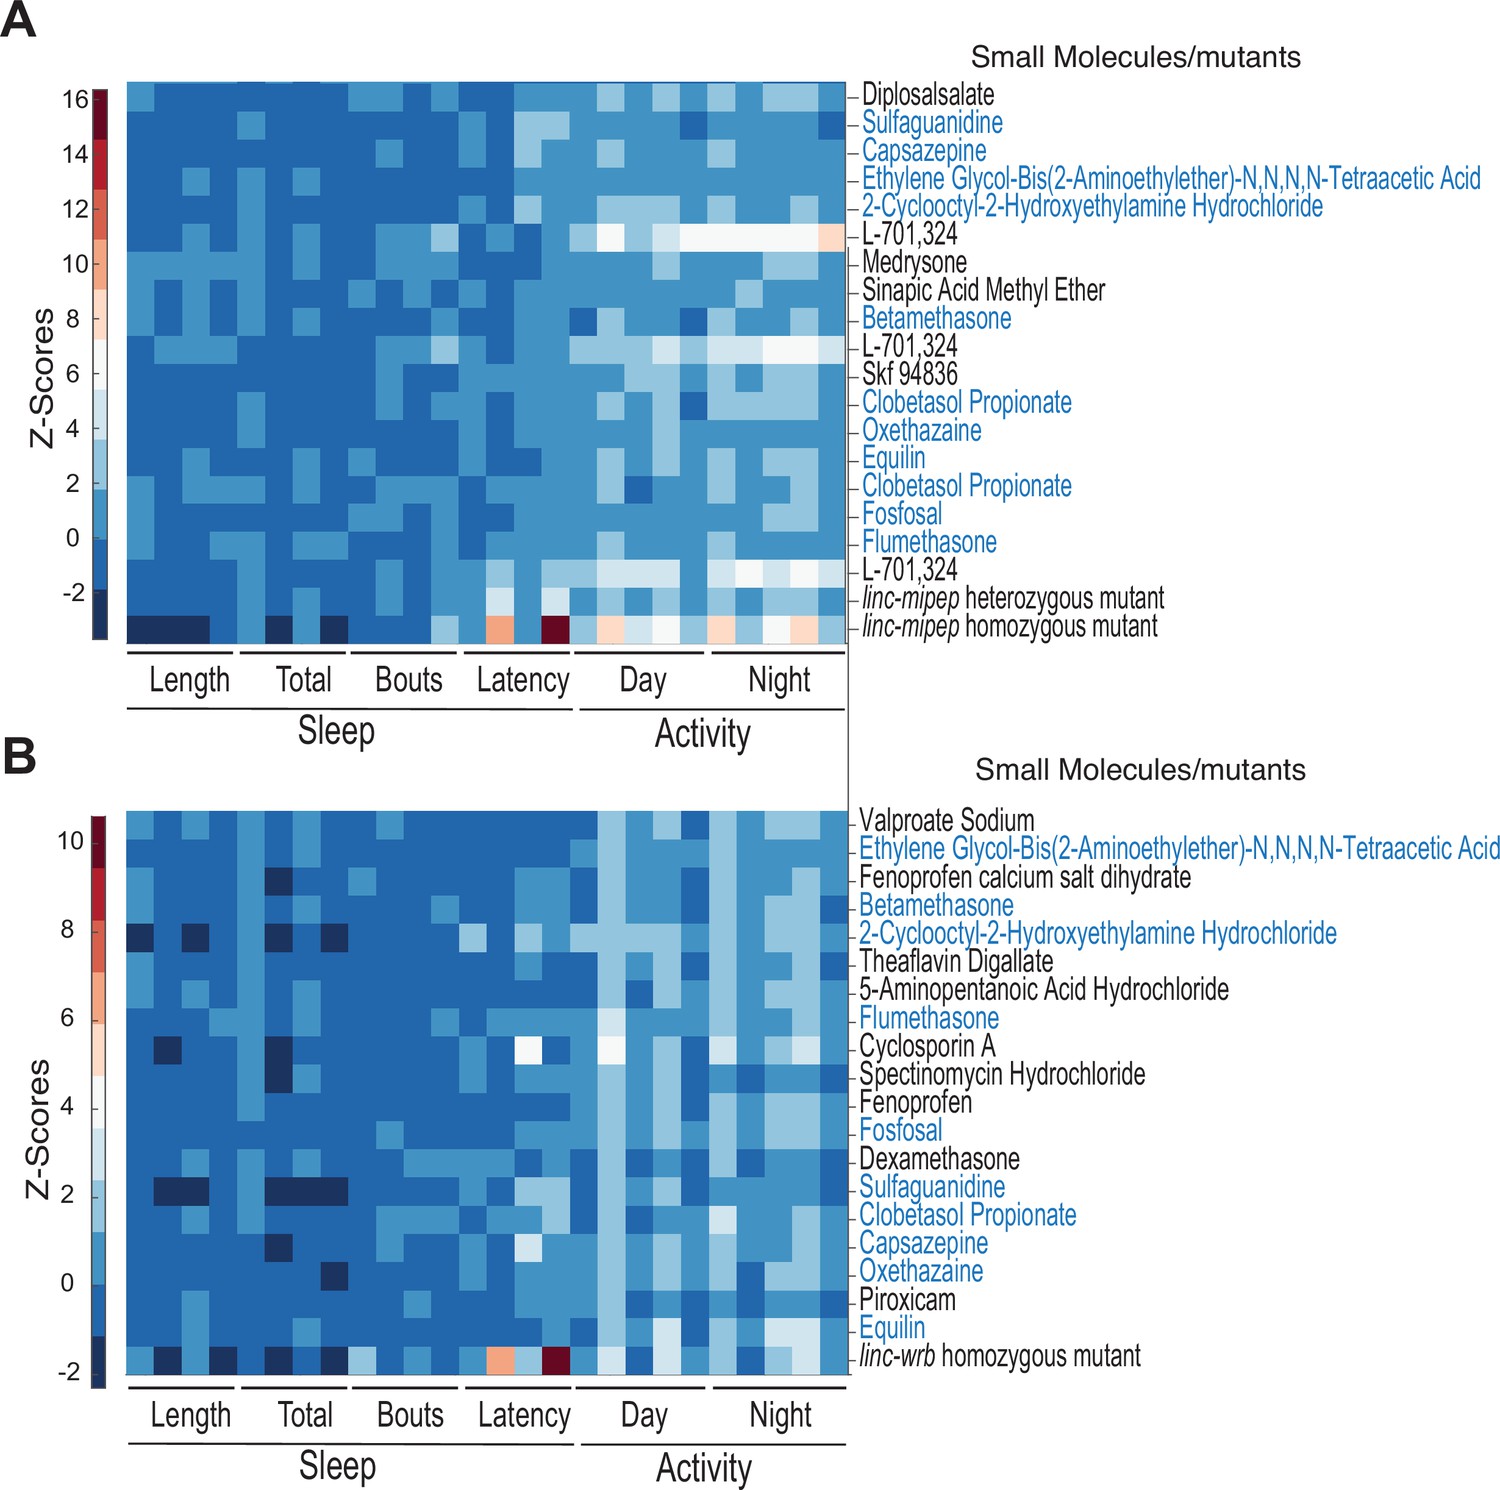
(A) Hierarchical clustering of the linc-mipep del-1.8kb behavioral fingerprints compared with the fingerprints of wild-type zebrafish larvae exposed to 550 psychoactive agents from 4 to 6 dpf (Rihel et al., 2010). Top 18 compounds ranked according to correlation with the linc-mipep del-1.8kb fingerprint are shown. The Z score, defined as the average value (in standard deviations) relative to the behavioral profiles of WT exposed to DMSO, is represented by each rectangle in the clustergram. Small molecules shared with (B) are highlighted in blue. (B) Hierarchical clustering of the top correlating linc-wrbdel11 behavioral fingerprints, same as (A).
Figure 3—figure supplement 2

linc-mipep and linc-wrb mutants are sensitized to glucocorticoid receptor agonists.
(A) Locomotor average activity of wild-type larvae treated with DMSO (WT, blue) or with 10μM glucocorticoid receptor agonist Flumethasone (magenta), and linc-mipep del-1.8kb/del-1.8kb larvae treated with DMSO (linc-mipep, green) or with 10μM Flumethasone (purple); sibling larvae over 24hr. The ribbon represents± SEM. (B) Average waking activity (Night 5) of progeny of incrosses of linc-mipep del-1.8kb/+ larvae treated with DMSO or 10μM Flumethasone. Each dot represents one larva. Data shown from same experiment as in (A). Flumethasone has a stronger effect on the linc-mipep mutant larvae than WT, p=0.036 (DrugXGenotype interaction, two-way ANOVA). (C) Locomotor average activity of wild-type larvae treated with DMSO (WT, blue) or with 30μM glucocorticoid receptor agonist flumethasone (magenta), and linc-wrbdel11/del11 larvae treated with DMSO (linc-mipep, green) or with 30μM flumethasone (purple), over 24hr. (D) Average nighttime activity (night 6) of WT larvae treated with DMSO or 30μM flumethasone, compared to linc-wrbdel11/del11 larvae treated with DMSO or 30μM flumethasone. Each dot represents one larva. Data shown from same experiment as in (C). Flumethasone has a slightly stronger effect on the linc-wrb mutant larvae than WT, though not significantly (WT vs. linc-wrb+ 30μM flumethasone, p=0.078, Dunnett’s test, using wild type as the baseline condition). (E) Locomotor average activity of wild-type larvae treated with DMSO (WT, blue) or with 1μM NMDA receptor antagonist L-701,324 (magenta), and linc-wrbdel11/del11 larvae treated with DMSO (linc-mipep, green) or with 1μM L-701,324 (purple), over 24hr. (F) Average activity (day 6) of WT larvae treated with DMSO or 1μM L-701-324, compared to linc-wrbdel11/del11 larvae treated with DMSO or 1μM L-701-324. Each dot represents one larva. Data shown from same experiment as in (E).L-701–324 has a strong effect in the wild type animals but not in the mutants (p=0.0021, DrugXGenotype interaction, two-way ANOVA).
Figure 3—figure supplement 3

Chromatin accessibility of wild type and linc-mipep; linc-wrb mutant brains.
(A) Biplots showing correlations between the wild type brain Omni-ATAC replicates (n=9 brains each, N=3), collected at Zeitgeber Time (ZT) 4. The zebrafish genome was divided into 5Kb windows, and the average signal within each window was calculated using the effective fragments (see methods). Pearson correlation was then calculated between replicates on all genomic windows. Scatter plots of linc-mipep; linc-wrb mutant brain replicates, with correlation score for each respective comparison. (B) Biplots showing correlations between the three brain Omni-ATAC replicates of linc-mipep; linc-wrb double mutants (n=9 brains each, N=3), collected at Zeitgeber Time (ZT) 4. The zebrafish genome was divided into 5Kb windows, and the average signal within each window was calculated using the effective fragments (see methods). Pearson correlation was then calculated between replicates on all genomic windows. (C) Heatmaps and density plots showing chromatin accessibility (omni-ATAC-seq, average of 3 replicates) profiles of the 2,928 regions globally with unchanged accessibility in linc-mipep; linc-wrb mutant brains at 5 dpf compared to wild type (WT) brains (see methods for details). Heatmaps are centered at the summit of the Omni-ATAC peak with 500bp on both sides and ranked according to global accessibility levels in WT. (D) Top, in situ hybridization of c-fos expression in 5 dpf wild type (top) and linc-mipep; linc-wrb (bottom) larval brains at ZT4, lateral views. A, anterior; P, posterior; D, dorsal; V, ventral. Bottom, log(2) fold-change (by qPCR) for normalized cfos levels of 5 dpf linc-mipep; linc-wrb brains relative to 5 dpf wild type at ZT0 and ZT4. Dashed line represented log(2) fold change = 1 (no difference), N=3.
Figure 4 with 9 supplements
Evolutionarily newer vertebrate cell types are more susceptible to loss of linc-mipep and linc-wrb proteins.
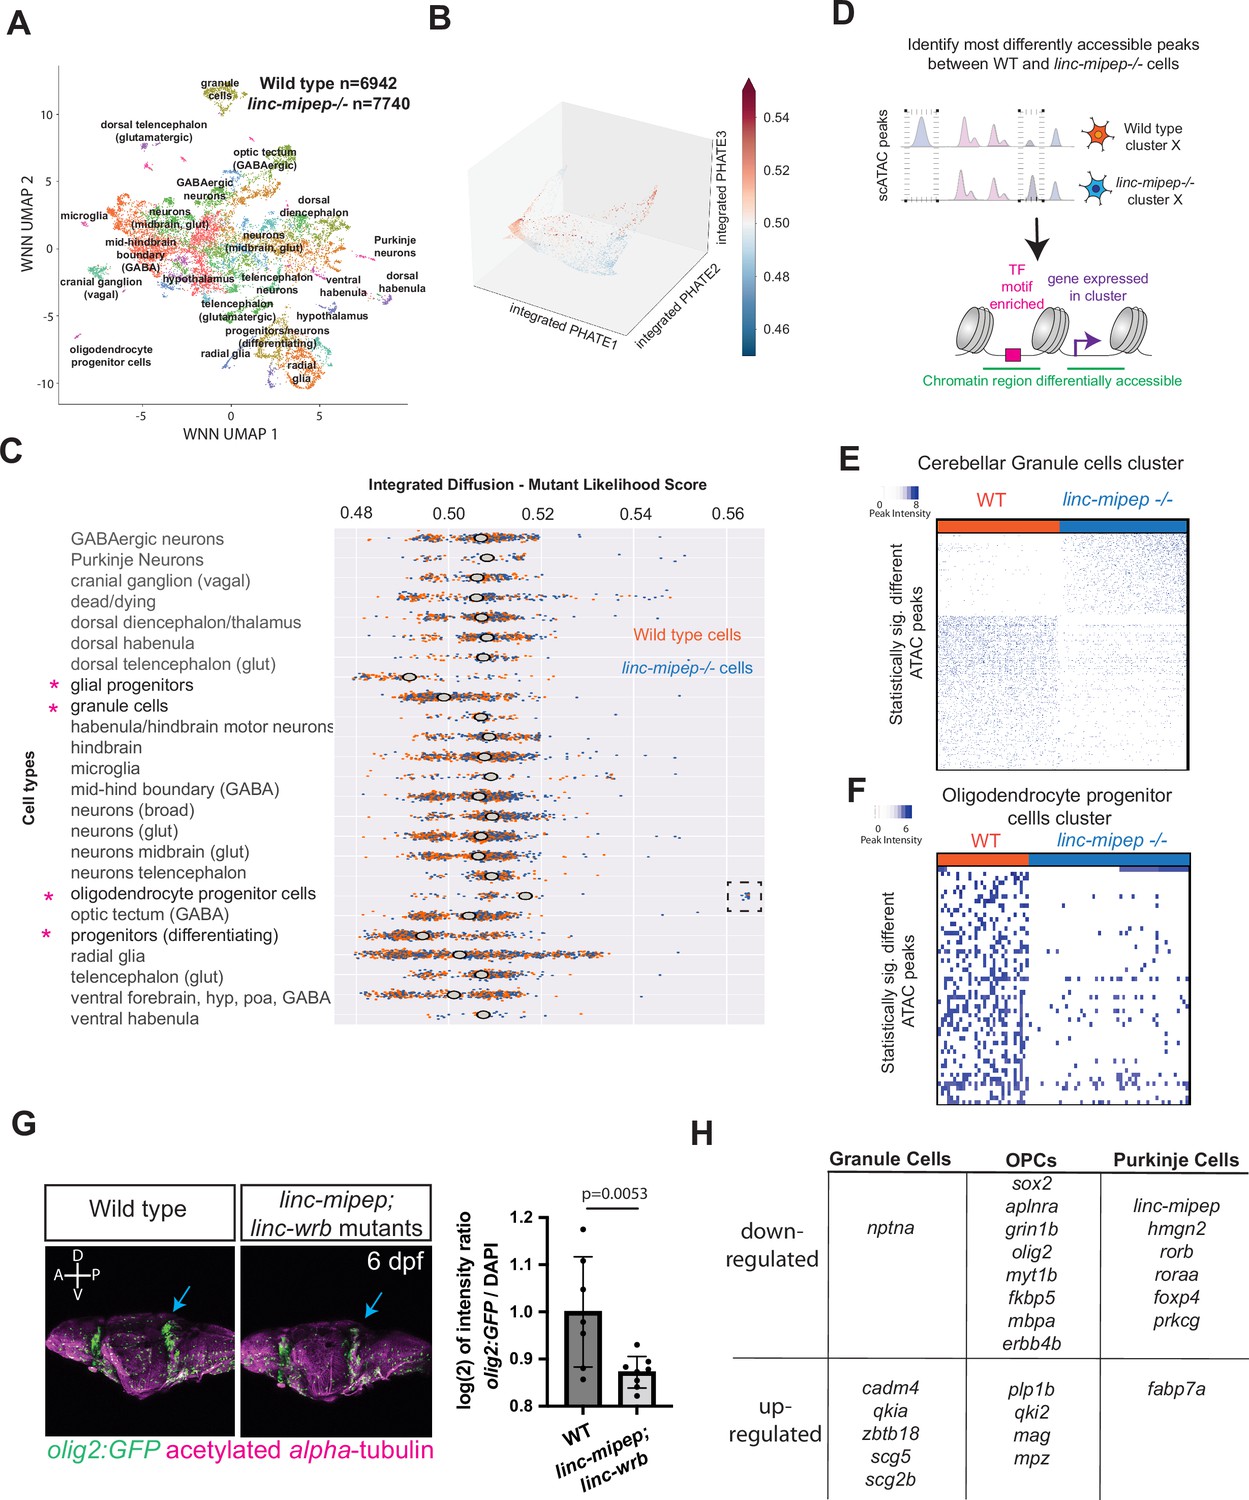
(A) UMAP representation of WNN analyses of wild type (n=6,942 nuclei) and linc-mipep del-1.8kb/del-1.8kb (n=7740 nuclei) mutant brains at 6 dpf. Identified cell types as labeled. (B) PHATE plot of integrated diffusion analysis of 6 dpf linc-mipep del-1.8kb/del-1.8kb mutant or WT sibling brain nuclei, color-coded by mutant likelihood score as computed by MELD using Integrated Diffusion operator. (C) Integrated diffusion analysis on identified cell types from 6 dpf wild type (orange) and linc-mipep del-1.8kb/del-1.8kb (blue) brains. Each dot represents a single cell, with mutant likelihood score across X-axis. Most wild type- or mutant-like groups noted with an asterisk. Cell types are clustered by known marker genes as defined in Supplementary file 6. (D) Schematic of analysis to identify most differentially accessible peaks between WT and linc-mipep del-1.8kb/del-1.8kb mutant brain nuclei from merged Weighted Nearest Neighbors (WNN) clusters. The most statistically significant changes in chromatin accessibility peaks were identified by the Wilcoxon rank sum and the Kolmogorov-Smirnov (KS) one-tailed tests methods on intensity distributions of each peak in WT and mutant samples, for either wild type or mutant differentially expressed genes per cluster, and for transcription factor (TF) motif overrepresentation by genotype in each cluster.(E) Statistically significantly different chromatin accessibility peaks between 6 dpf wild type (WT, blue) and linc-mipep del-1.8kb/del-1.8kb mutant (red) nuclei in the cerebellar granule cells cluster. Each column is one nucleus. Color scale, peak intensity (blue, more accessible). (F) Statistically significantly different chromatin accessibility peaks between 6 dpf wild type (WT, blue) and linc-mipep del-1.8kb/del-1.8kb mutant (red) nuclei in the oligodendrocyte progenitor cells (OPCs) cluster. Color scale, peak intensity (blue, more accessible). (G) Left, lateral view confocal images (Z-stack) from Tg(olig2:GFP) brains in wild type (left) or linc-mipep; linc-wrb double mutant (right) backgrounds at 6 dpf, stained with GFP (olig2+, green) and acetylated alpha-tubulin (magenta). A, anterior; P, posterior; D, dorsal; V, ventral. Right, quantification of intensity ratio of GFP+/DAPI signal of whole brain normalized to WT. One-tailed t-test, P=0.0053. (H) Select differentially regulated genes, down- or up-regulated per each cerebellar granule cells, OPCs, or Purkinje cells cluster. Full list of genes is presented in Supplementary file 5.
Figure 4—figure supplement 1
Single cell Multiome analyses in wild type and linc-mipep mutant brain nuclei.
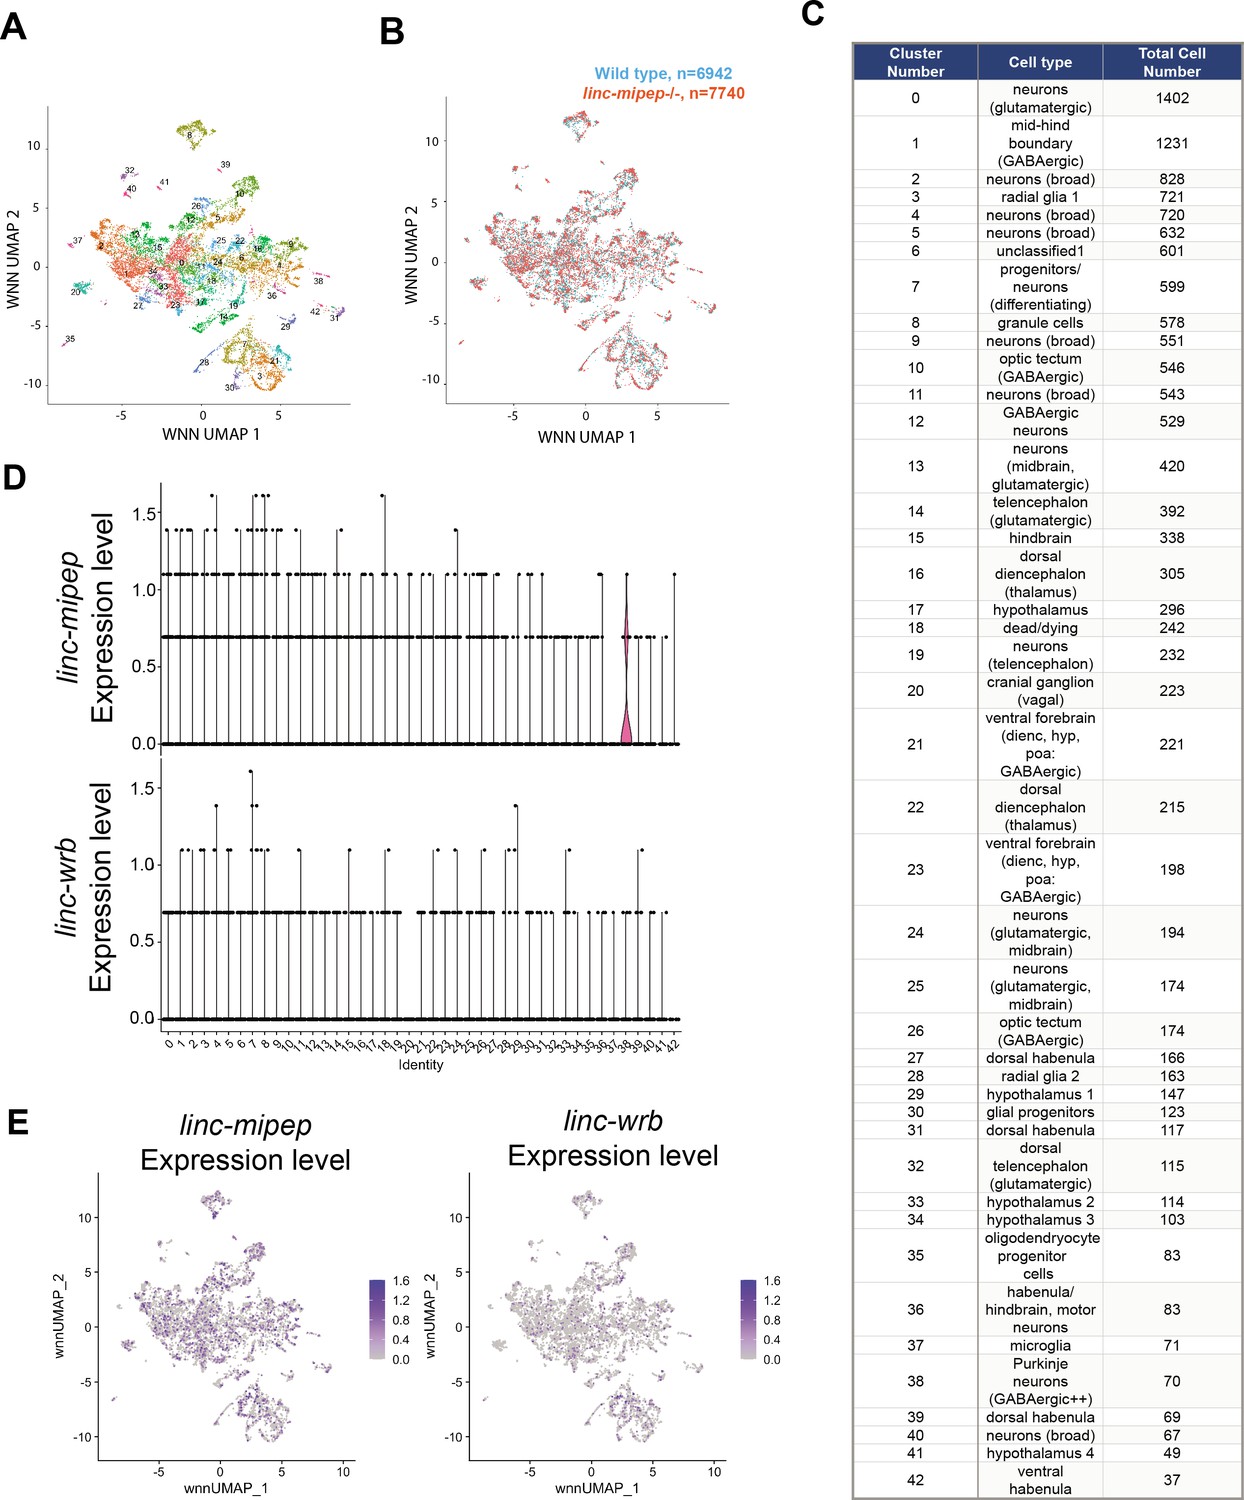
(A) UMAP representation of WNN analyses (transcriptomic and chromatin accessibility) of merged wild type (n=6,942 nuclei) and linc-mipep del-1.8kb/del-1.8kb (n=7740 nuclei) mutant brains at 6 dpf, as in Figure 4A, labeled with cell cluster numbers. (B) UMAP representation of WNN analyses of merged wild type (n=6942 nuclei, cyan) and linc-mipep del-1.8kb/del-1.8kb (n=7740 nuclei, orange) mutant brains at 6 dpf. (C) Table of WNN cluster numbers, classified cell type, and total cell number per cluster. (D) Violin plots of linc-mipep (top) and linc-wrb (bottom) expression levels from WNN analysis clusters of wild type brain nuclei (n=6942) at 6 dpf. (E) UMAP representation of WNN analyses of wild type brain nuclei (n=6942) at 6 dpf, color-coded by relative expression levels (purple scale) of linc-mipep (left) and linc-wrb (right).
Figure 4—figure supplement 2

linc-mipep and linc-wrb expression by cluster in wild type or linc-mipep mutant brain cells.
Expression levels of linc-mipep (si:ch73-1a9.3, left column) or linc-wrb (si:ch73-281n10.2, right column) in either wild type or linc-mipep brain cells. Wild type, WT, blue. linc-mipep, MUT, red. Circle sizes represent percent of cells per cluster expressing each given gene. Cluster numbers match cell type annotations in Figure 4—figure supplement 1C.
Figure 4—figure supplement 3
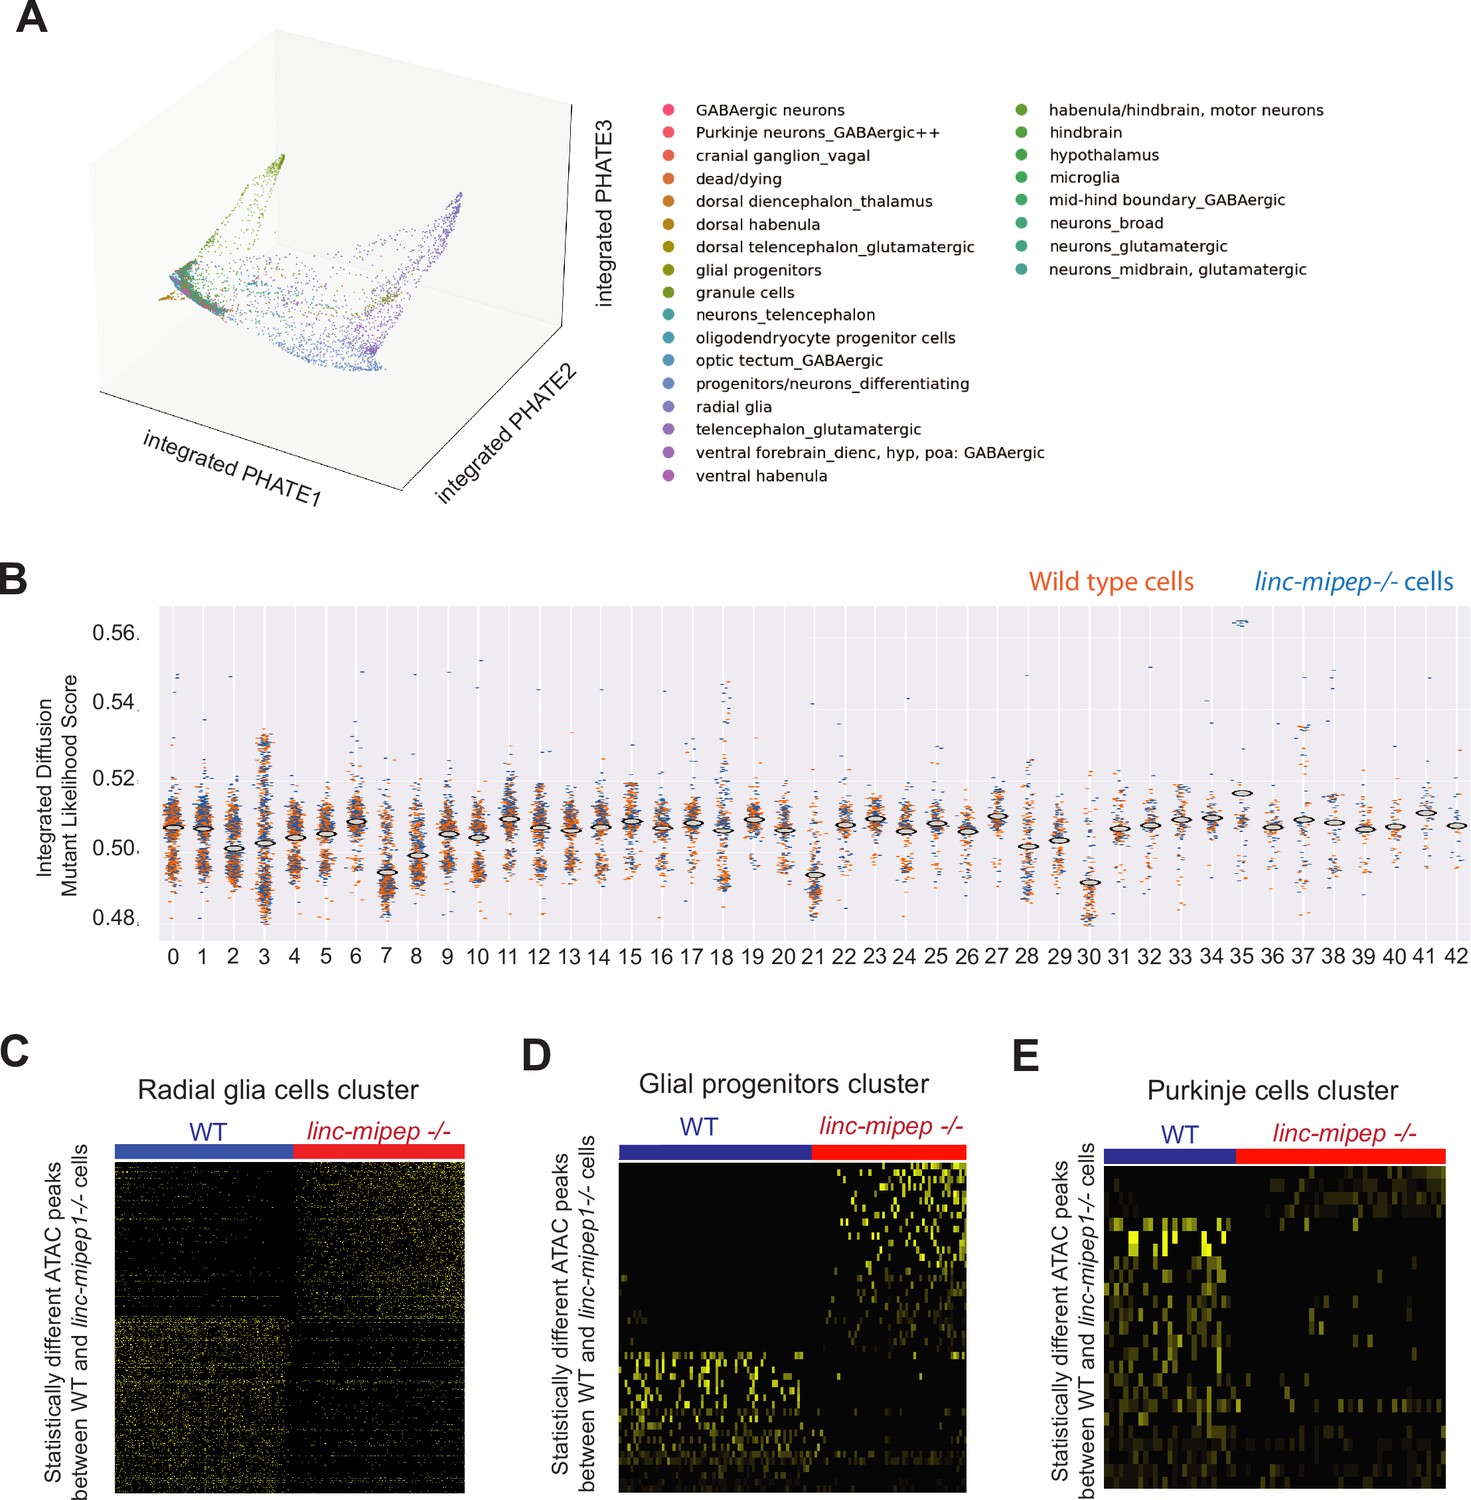
Single-cell Multiome analyses reveal cell states altered in linc-mipep brain cells.
(A) PHATE plot of integrated diffusion analysis of 6 dpf wild type and linc-mipep del-1.8kb/del-1.8kb mutant brain nuclei, color-coded by broad identified cell type (from Supplementary file 6).(B) Integrated diffusion analysis on identified cell type clusters from 6 dpf wild type (orange) and linc-mipep del-1.8kb/del-1.8kb (blue) brain nuclei by WNN-identified clusters, as shown in Figure 4—figure supplement 1C. Each dot represents a single cell, with mutant likelihood score across Y-axis. (C) Statistically significantly different chromatin accessibility peaks between 6 dpf wild type (WT, blue) and linc-mipep del-1.8kb/del-1.8kb mutant (red) nuclei in the radial glial cells cluster (#3). Yellow intensity indicates more accessible regions. (D) Statistically significantly different chromatin accessibility peaks between 6 dpf wild type (WT, blue) and linc-mipep del-1.8kb/del-1.8kb b mutant (red) nuclei in the glial progenitor cells cluster (#30). Yellow intensity indicates more accessible regions. (E) Statistically significantly different chromatin accessibility peaks between 6 dpf wild type (WT, blue) and linc-mipep del-1.8kb/del-1.8kb mutant (red) nuclei in the Purkinje cells cluster (#38). Yellow intensity indicates more accessible regions.
Figure 4—figure supplement 4
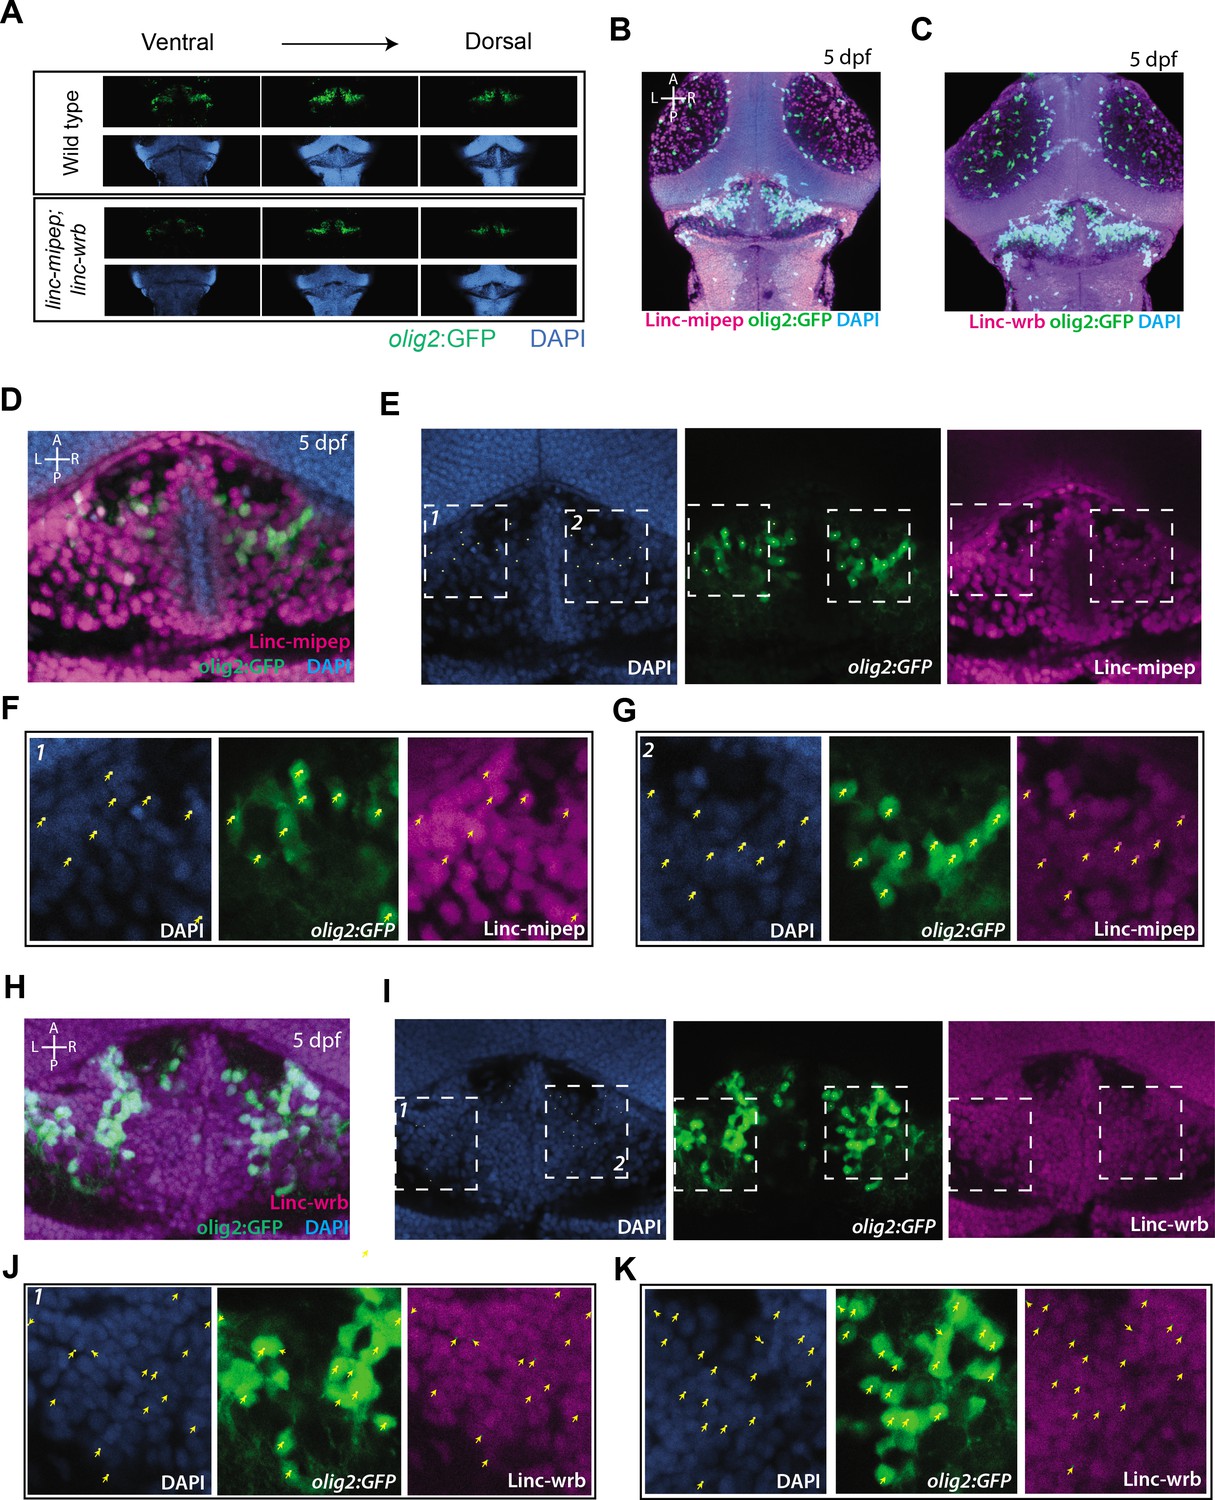
Linc-mipep and Linc-wrb protein expression in cerebellar region of olig2:GFP brains.
(A) Dorsal view confocal images (comparable single Z planes) from Tg(olig2:GFP) brains at 5 dpf, zoomed in on the cerebellum in wild type (top) or linc-mipep;linc-wrb double heterozygous mutant (bottom) backgrounds, stained with GFP antibody (olig2+, green) and DAPI (nuclei, blue), from ventral to dorsal. Anterior to the top. (B) Dorsal view confocal Z-stack (maximum projection) from a Tg(olig2:GFP) brain at 5 dpf, showing the midbrain, cerebellum, and hindbrain, stained with GFP antibody (olig2+, green), Linc-mipep antibody (magenta), and DAPI (nuclei, blue). A, anterior; P, posterior; L, left; R, right. (C) Dorsal view confocal Z-stack (maximum projection) from a Tg(olig2:GFP) brain at 5 dpf, showing the midbrain, cerebellum, and hindbrain, stained with GFP antibody (olig2+, green), Linc-wrb antibody (magenta), and DAPI (nuclei, blue). A, anterior; P, posterior; L, left; R, right. (D) Dorsal view of a single Z plane from a Tg(olig2:GFP) brain at 5 dpf, zoomed in on the cerebellar region, stained with GFP antibody (olig2+, green), Linc-mipep antibody (magenta), and DAPI (nuclei, blue). A, anterior; P, posterior; L, left; R, right. (E) Dorsal view of a single Z plane from a Tg(olig2:GFP) brain at 5 dpf, slightly zoomed out from image in (D), stained with DAPI (nuclei, blue, left), GFP antibody (olig2+, green, middle), and Linc-mipep antibody (magenta, right). Boxes 1 and 2 are shown in (F) and (G). Dots in images represent olig2:GFP + cellsthat are pointed to in (F) and (G). A, anterior; P, posterior; L, left; R, right. (F) Magnification of Box 1 in (E). Dorsal view of a single Z plane from a Tg(olig2:GFP) brain at 5 dpf, stained with DAPI (nuclei, blue, left), GFP antibody (olig2+, green, middle), Linc-mipep antibody (magenta, right). Yellow arrows, olig2:GFP+ cells. (G) Magnification of Box 2 in (E).Dorsal view of a single Z plane from a Tg(olig2:GFP) brain at 5 dpf, stained with DAPI (nuclei, blue, left), GFP antibody (olig2+, green, middle), Linc-mipep antibody (magenta, right). Yellow arrows, olig2:GFP+ cells. (H) Dorsal view of a single Z plane from a Tg(olig2:GFP) brain at 5 dpf, zoomed in on the cerebellar region, stained with GFP antibody (olig2+, green), Linc-wrb antibody (magenta), and DAPI (nuclei, blue). A, anterior; P, posterior; L, left; R, right. (I) Dorsal view of a single Z plane from a Tg(olig2:GFP) brain at 5 dpf, slightly zoomed out from image in (H), stained with DAPI (nuclei, blue, left), GFP antibody (olig2+, green, middle), and Linc-wrb antibody (magenta, right). Boxes 1 and 2 are shown in (J) and (K). Dots in images represent olig2:GFP + cellsthat are pointed to in (J) and (K). A, anterior; P, posterior; L, left; R, right. (J) Magnification of Box 1 in (I). Dorsal view of a single Z plane from a Tg(olig2:GFP) brain at 5 dpf, stained with DAPI (nuclei, blue, left), GFP antibody (olig2+, green, middle), Linc-wrb antibody (magenta, right). Yellow arrows, olig2:GFP+ cells. (K) Magnification of Box 2 in (I). Dorsal view of a single Z plane from a Tg(olig2:GFP) brain at 5 dpf, stained with DAPI (nuclei, blue, left), GFP antibody (olig2+, green, middle), Linc-wrb antibody (magenta, right). Yellow arrows, olig2:GFP+ cells.
Figure 4—figure supplement 5
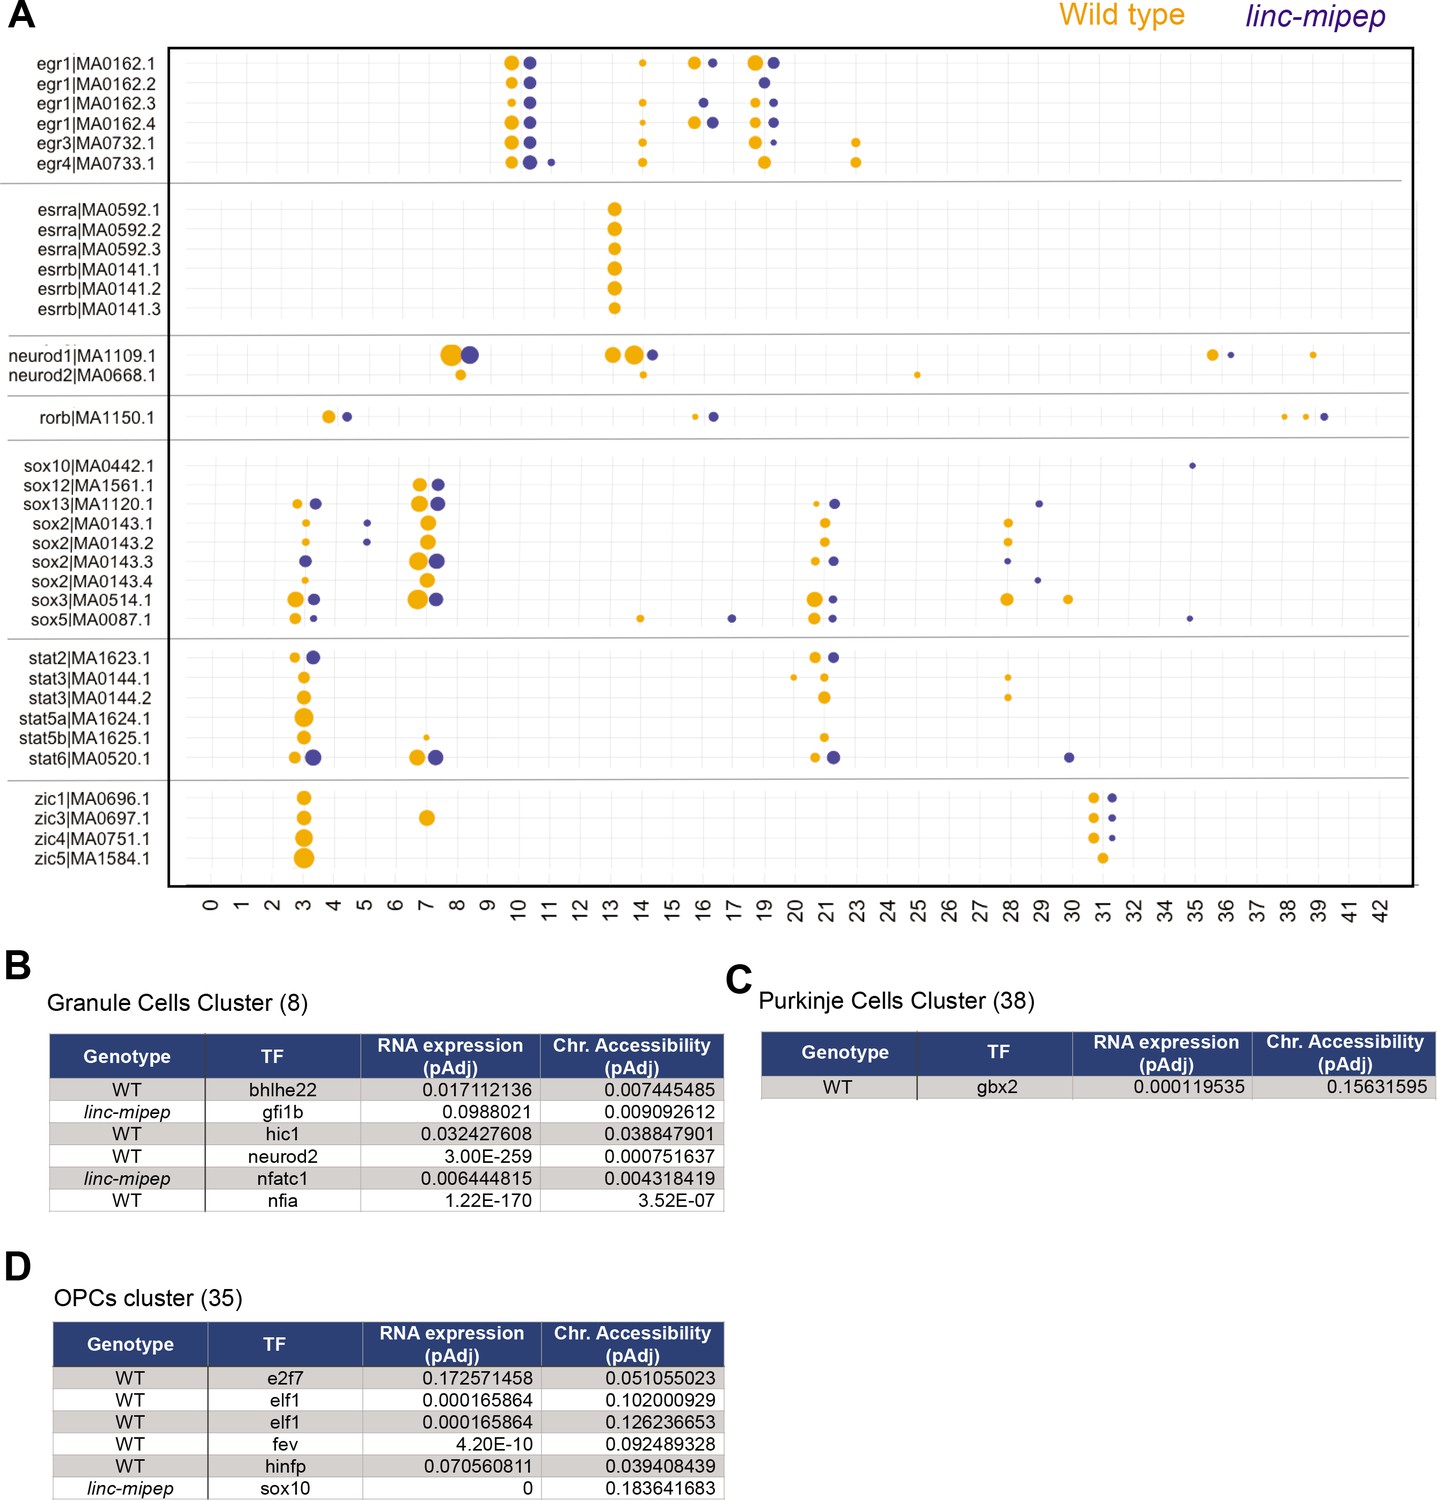
Accessibility for transcription factor motifs most affected in linc-mipep brain cells.
(A) Accessibility for select transcription factor motifs, ordered by related family members, that are significantly more accessible per WNN cluster (as described in Figure 4d) in either wild type or linc-mipep mutant brain cells. Wild type, orange. linc-mipep mutant, blue. Circle sizes represent adjusted p-values (2.87e-121–0.198) in log scale. (B) Accessibility for transcription factor motifs significantly different between wild type or linc-mipep mutant granule cells cluster (#8). Difference in RNA expression (adjusted p value) and chromatin accessibility (adjusted p value) for each TF (gene or motif) as shown, with expression/accessibility higher in the cells indicated by the Genotype column. (C) Accessibility for transcription factor motifs significantly different between wild type or linc-mipep mutant Purkinje cells cluster (38). Difference in RNA expression (adjusted p value) and chromatin accessibility (adjusted p value) for each TF (gene or motif) as shown, with expression/accessibility higher in the cells indicated by the Genotype column. (D) Accessibility for transcription factor motifs significantly different between wild type or linc-mipep mutant OPCs cluster (35). Difference in RNA expression (adjusted p value) and chromatin accessibility (adjusted p value) for each TF (gene or motif) as shown, with expression/accessibility higher in the cells indicated by the Genotype column.
Figure 4—figure supplement 6
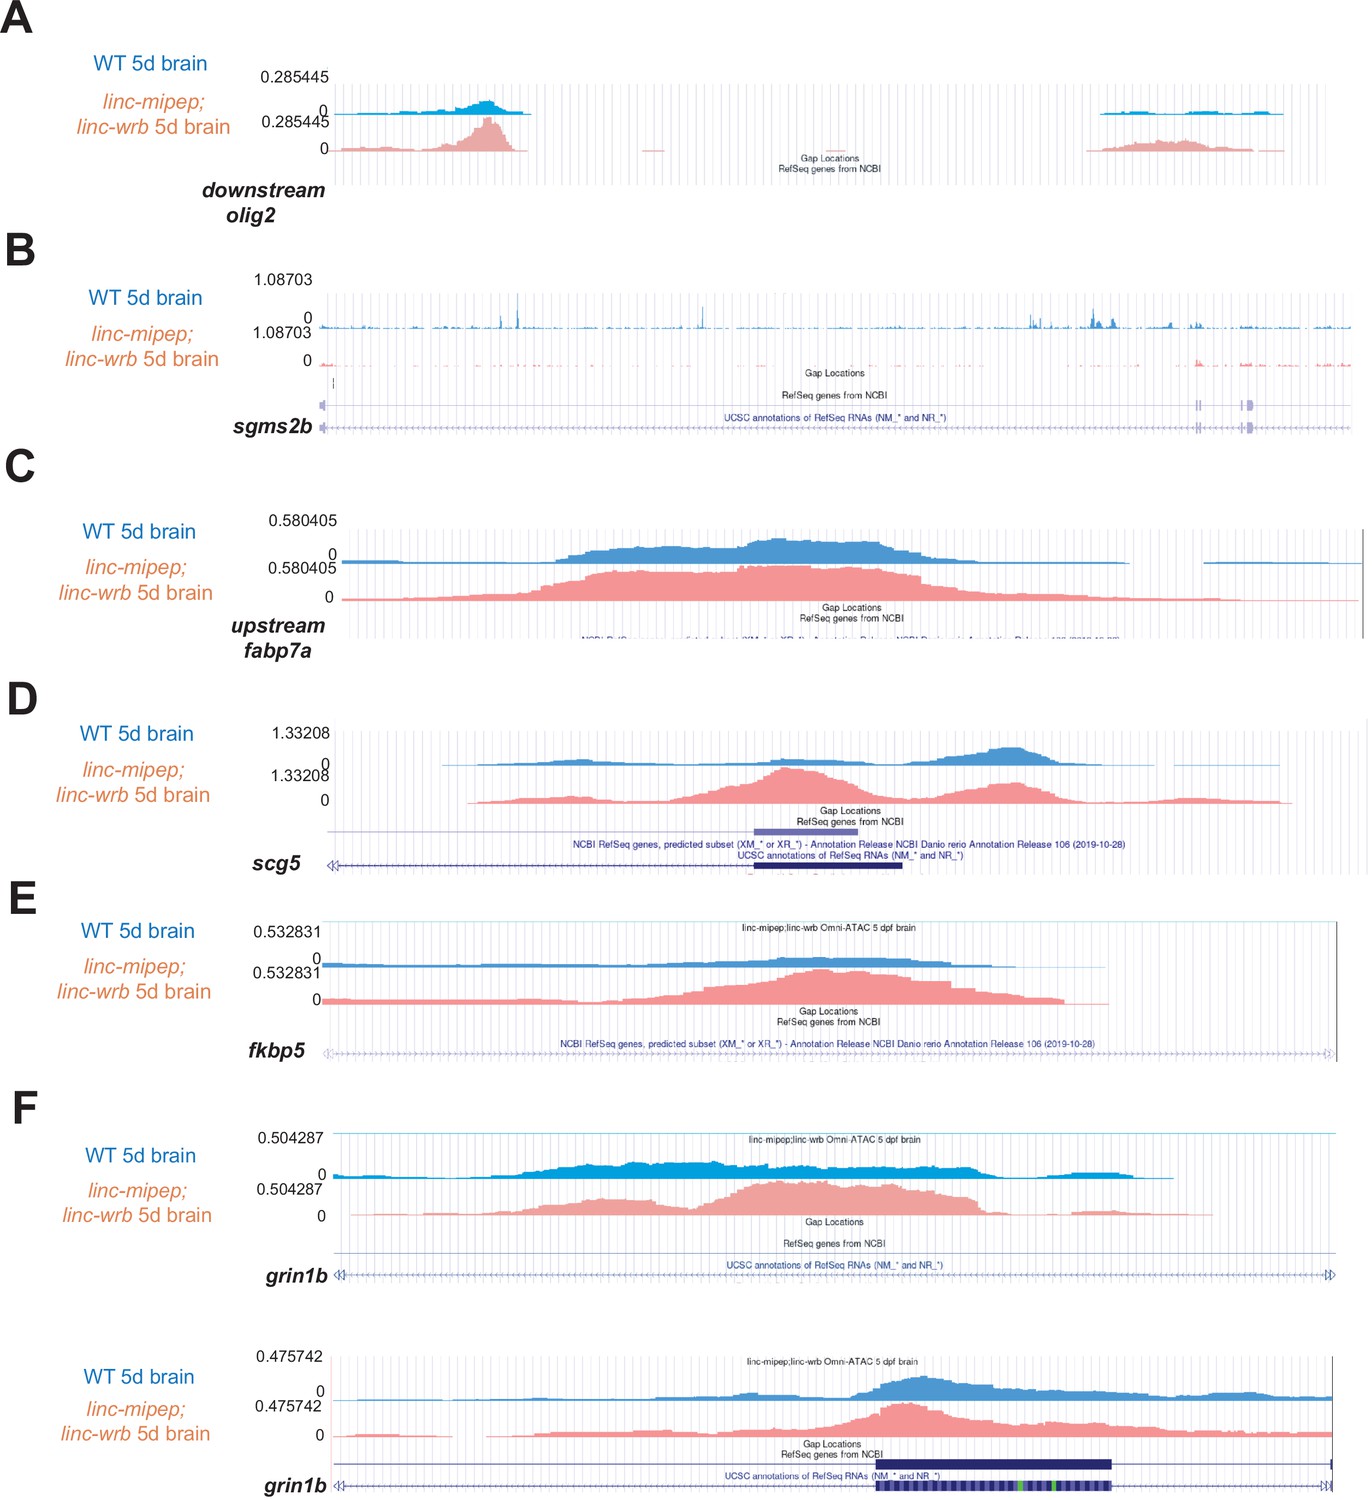
Sample omni-ATAC peaks.
(A) Wild type 5 dpf brains (blue) or linc-mipep; linc-wrb mutant 5 dpf brains (pink) chromatin accessibility tracks, at chr9:32,748,367–32,750,069 (DanRer11) downstream olig2. (B) Wild type 5 dpf brains (blue) or linc-mipep; linc-wrb mutant 5 dpf brains (pink) chromatin accessibility tracks, at chr23:45,304,828–45,398,622 (DanRer11), within sgms2b.(C) Wild type 5 dpf brains (blue) or linc-mipep; linc-wrb mutant 5 dpf brains (pink) chromatin accessibility tracks, at chr17:15,431,373–15,431,788 (DanRer11), upstream of fabp7a. (D) Wild type 5 dpf brains (blue) or linc-mipep; linc-wrb mutant 5 dpf brains (pink) chromatin accessibility tracks, at chr19:47,526,853–47,527,436 (DanRer11), within scg5. (E) Wild type 5 dpf brains (blue) or linc-mipep; linc-wrb mutant 5 dpf brains (pink) chromatin accessibility tracks, at chr6:41,093,105–41,093,354, within fkbp5. (F) Wild type 5 dpf brains (blue) or linc-mipep; linc-wrb mutant 5 dpf brains (pink) chromatin accessibility tracks, at chr5:29,607,690–29,608,390 (DanRer11), within grin1b (top) and at chr5:29,618,479–29,619,561 (DanRer11), within grin1b (bottom).
Figure 4—figure supplement 7
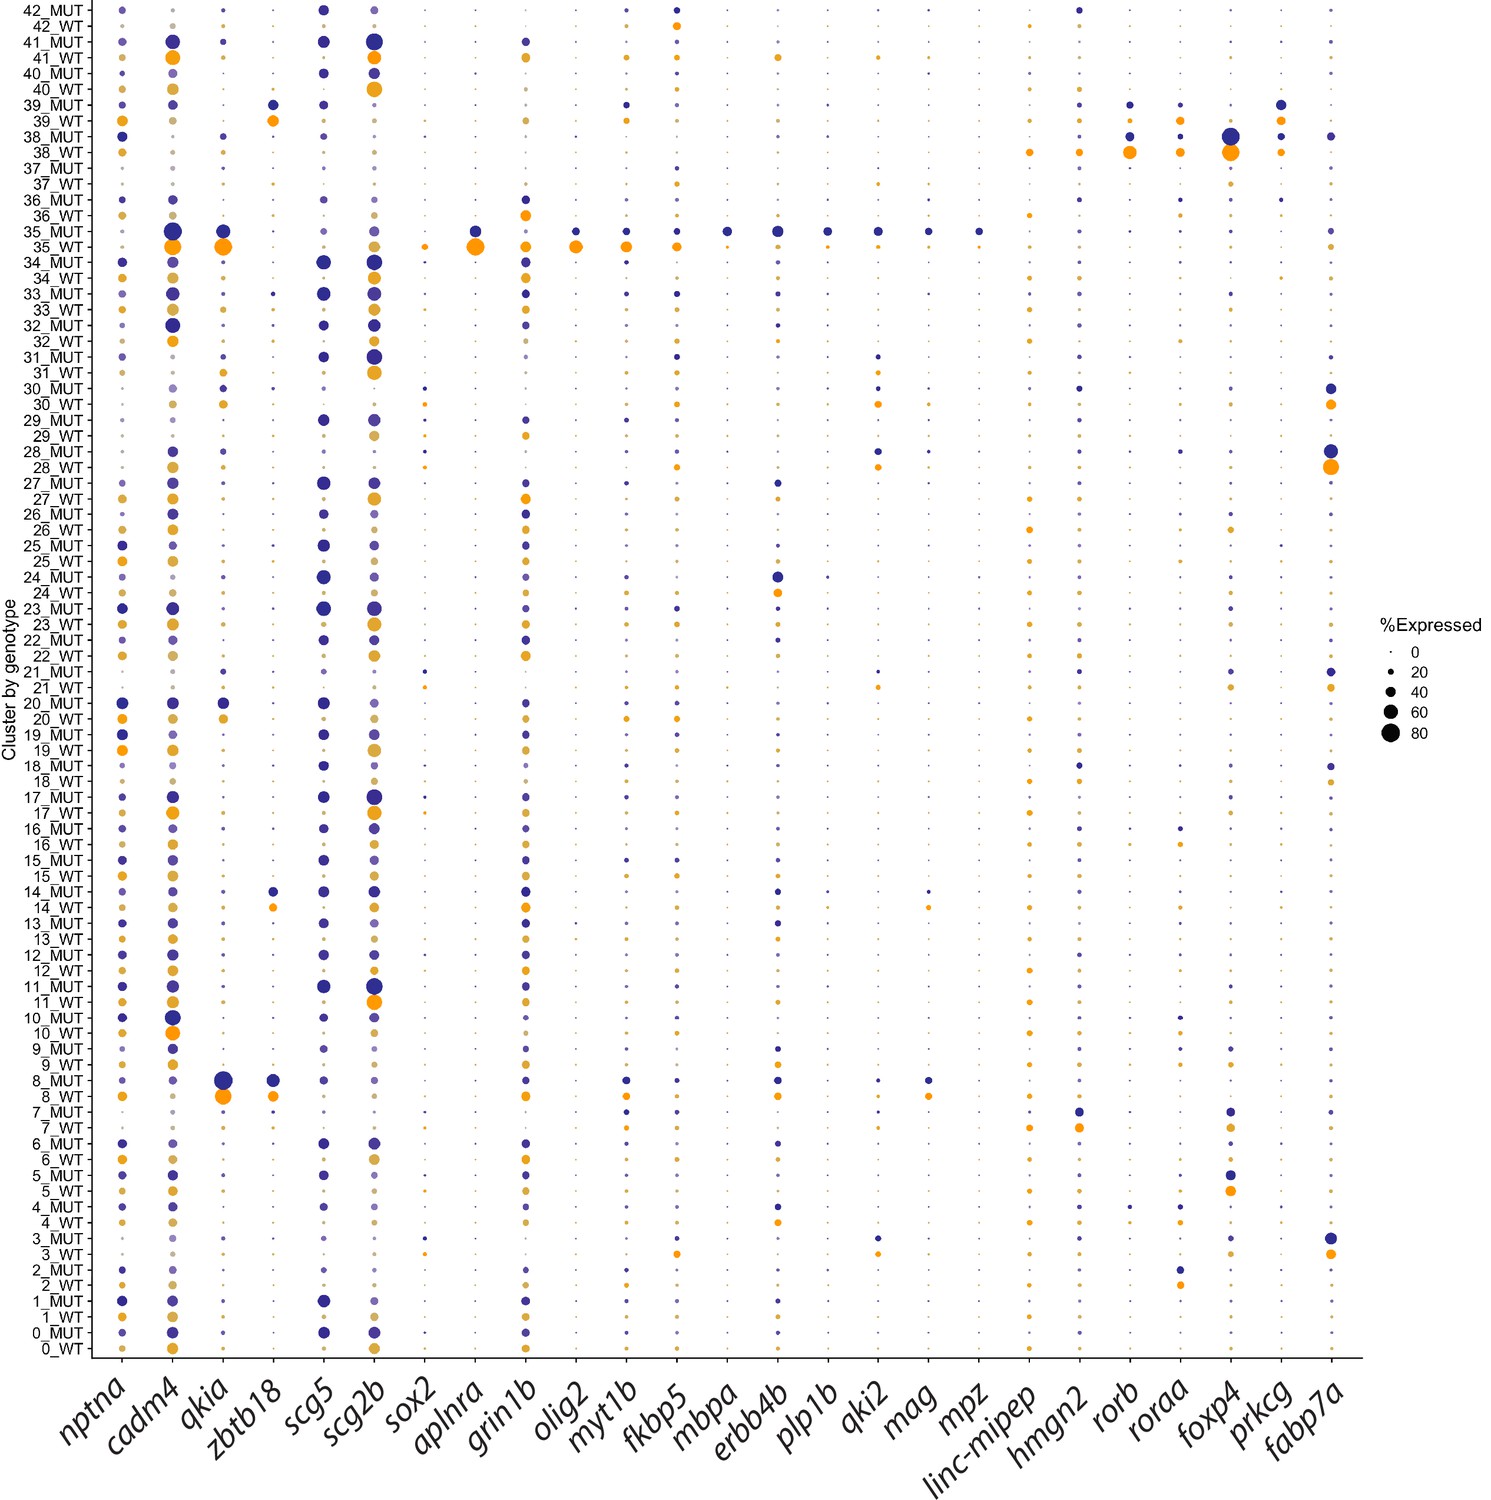
dot plot for relevant genes differentially expressed in clusters of interest.
Expression levels of genes of interest that significantly change expression in wild type or linc-mipep mutant granule cell (8), OPC (35), or Purkinje cell (38) clusters, shown for all clusters. Wild type, WT, yellow. linc-mipep, MUT, blue. Circle sizes represent percent of cells per cluster expressing each given gene. Data shown for genes shown in Figure 4H: nptna, cadm4, qkia, zbtb18, scg5, scg2b, sox2, aplnra, grin1b, olig2, myt1b, fkbp5, mbpa, erbb4b, plp1b, qki2, mag, mpz, linc-mipep (si:ch73-1a9.3) hmgn2, rorb, roraa, foxp3, prkcg, and fabp7a. Identities of clusters as in Figure 4—figure supplement 1C.
Figure 4—figure supplement 8
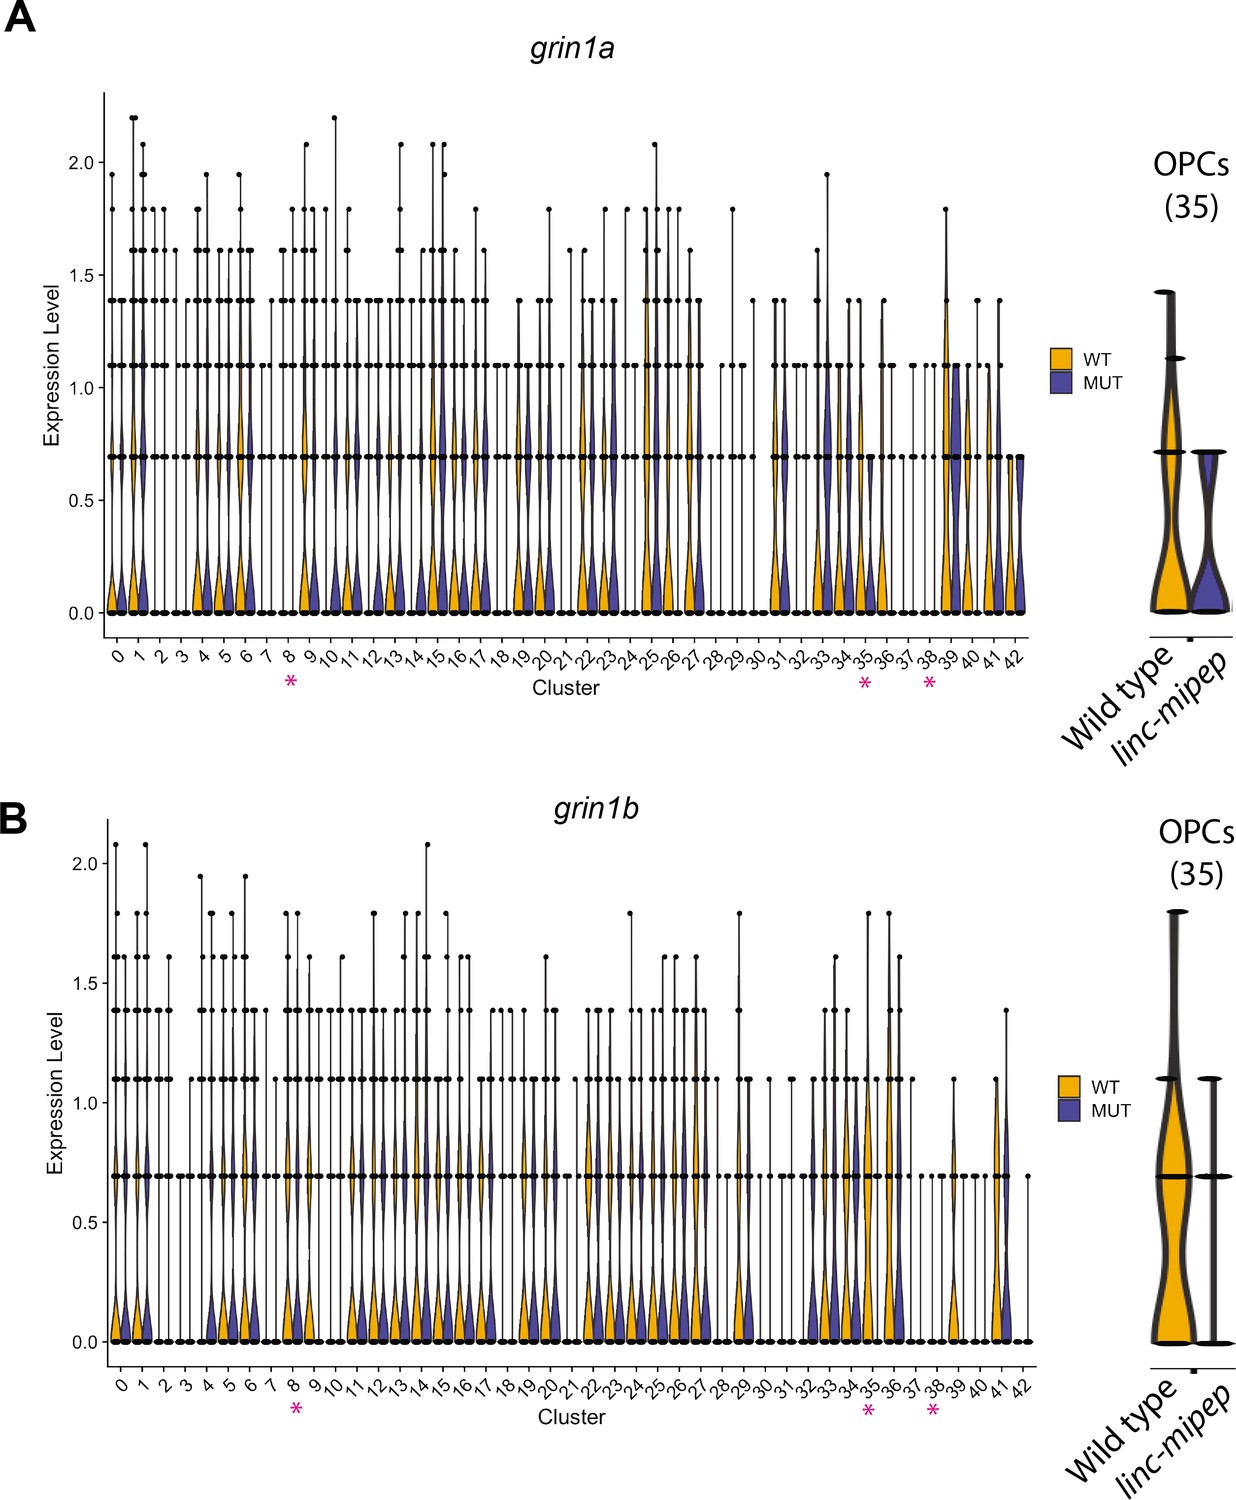
Violin plots for NMDA receptor subunits differentially expressed in OPCs.
(A) Violin plots of grin1a expression levels from WNN analysis clusters (identities in Figure 4—figure supplement 1C) of wild type brain nuclei at 6 dpf, in wild type (WT, yellow) or linc-mipep mutant (MUT, blue) nuclei. Identities of clusters as in Figure 4—figure supplement 1C. Violin plot for OPC cluster (35) is enlarged on the right. (B) Violin plots of grin1b expression levels from WNN analysis clusters (identities in Figure 4—figure supplement 1C) of wild type brain nuclei at 6 dpf, in wild type (WT, yellow) or linc-mipep mutant (MUT, blue) nuclei. Identities of clusters as in Figure 4—figure supplement 1C. Violin plot for OPC cluster (35) is enlarged on the right.
Figure 4—figure supplement 9

Violin plots for genes differentially expressed in OPCs that are also enriched in granule cells.
(A) Violin plots of erbb4b expression levels from WNN analysis clusters (identities in Figure 4—figure supplement 1C) of wild type brain nuclei at 6 dpf, in wild type (WT, yellow) or linc-mipep mutant (MUT, blue) nuclei. Identities of clusters as in Figure 4—figure supplement 1C. (B) Violin plots of mag expression levels from WNN analysis clusters (identities in Figure 4—figure supplement 1C) of wild type brain nuclei at 6 dpf, in wild type (WT, yellow) or linc-mipep mutant (MUT, blue) nuclei. Identities of clusters as in Figure 4—figure supplement 1C. (C) Violin plots of qkia expression levels from WNN analysis clusters (identities in Figure 4—figure supplement 1C) of wild type brain nuclei at 6 dpf, in wild type (WT, yellow) or linc-mipep mutant (MUT, blue) nuclei. Identities of clusters as in Figure 4—figure supplement 1C. (D) Violin plots of myt1b expression levels from WNN analysis clusters (identities in Figure 4—figure supplement 1C) of wild type brain nuclei at 6 dpf, in wild type (WT, yellow) or linc-mipep mutant (MUT, blue) nuclei. Identities of clusters as in Figure 4—figure supplement 1C.
Author response image 1
Tables
Appendix 1—key resources table
| Reagent type (species) or resource | Designation | Source or reference | Identifiers | Additional information |
|---|---|---|---|---|
| Gene (Danio rerio) | si:ch73-1a9.3, linc-mipep (also called lnc-rps25) - now hmgn1b | Ensembl | ENSDARG00000103919 | |
| Gene (Danio rerio) | si:ch73-281n10.2, linc-wrb - now hmgn1a | Ensembl | ENSDARG00000097102 | |
| Gene (Homo sapiens) | Hmgn1 | Ensembl | ENSG00000205581 | |
| Genetic reagent (Danio rerio) | linc-mipepdel1.78kb | This paper | Mutant line | ya126, available from Giraldez Lab; submitted through ZIRC |
| Genetic reagent (Danio rerio) | linc-mipepATG-del6 | This paper | Mutant line | ya127, available from Giraldez Lab; submitted through ZIRC |
| Genetic reagent (Danio rerio) | linc-mipepdel8 | This paper | Mutant line | ya128, available from Giraldez Lab; submitted through ZIRC |
| Genetic reagent (Danio rerio) | linc-mipep3’UTR-del74 | This paper | Mutant line | ya129, available from Giraldez Lab; submitted through ZIRC |
| Genetic reagent (Danio rerio) | linc-wrbdel11 | This paper | Mutant line | ya130, available from Giraldez Lab; submitted through ZIRC |
| Genetic reagent(Danio rerio) | Tg(olig2:egfp)vu12 | Shin et al., 2003 | transgenic line | Previously published line |
| Genetic reagent(Danio rerio) | Tg(ubb:linc-mipep-FLAG-HA-T2A-mCherry) | This paper | Transgenic line | ya145, available from Giraldez lab; submitted through ZIRC |
| Genetic reagent(Danio rerio) | Tg(ubb:human-Hmgn1-FLAG-HA-T2A-mCherry) | This paper | Transgenic line | ya151, available from Giraldez Lab; submitted through ZIRC |
| Antibody | rabbit polyclonal anti-Linc-wrb | This paper | Custom antibody | custom antibody, (1:100–200) for antibody staining; works with ProK or acetone permeabilization. |
| Antibody | Rabbit polyclonal anti-Linc-mipep | This paper | Custom antibody | custom antibody, (1:100–200)for antibody staining; works with ProK or acetone permeabilization. |
| Antibody | mouse monoclonal anti-FLAG | Sigma | Cat #:F3165 | Western blot (1:2000) |
| Antibody | rabbit polyclonal Actin | Sigma | Cat #: A5060 | Western blot (1:2000) |
| Antibody | rabbit polyclonal anti-RNA Polymerase II antibody | Abcam | Cat #: ab817 | ChIP-seq (4µg) |
| Recombinant DNA reagent | ubb:linc-mipep-FLAG-HA-T2A-mCherry | This paper | Plasmid | Available from Giraldez Lab |
| Recombinant DNA reagent | ubb:humanHmgn1-FLAG-HA-T2A-mCherry | This paper | Plasmid | Available from Giraldez Lab |
| Peptide, recombinant protein | EnGen Spy Cas9 NLS (Cas9 protein) | New England Biolabs | Cat #: M0646T | |
| Sequence-based reagent | gBlocks | Integrated DNA Technologies (IDT) | Gene blocks | Sequences in materials section |
| Sequence-based reagent | All synthetic guide RNAs | Synthego | See Supplementary file 1 | |
| Sequence-based reagent | primers for genotyping and qPCR probes | Sigma | see Supplementary file 1, and materials section | |
| Sequence-based reagent | primers for RNA in situ hybridization probes | Sigma | see Supplementary file 1 | |
| Commercial assay or kit | Neurobasal Medium | Thermo Fisher Scientific | Cat #: 21103049 | |
| Commercial assay or kit | B-27 Supplement (50X), serum free | Thermo Fisher Scientific | Cat #: 17504044 | |
| Commercial assay or kit | Monarch RNA Cleanup Kit | New England Biolabs | Cat #: T2040L | |
| Commercial assay or kit | DIG RNA Labeling Mix | Roche | Cat #: 11277073910 | |
| Commercial assay or kit | NBT/BCIP Stock Solution | Roche | Cat #: 11681451001 | |
| Commercial assay or kit | EZ-Tn5 Transposase | Lucigen | Cat #: TNP92110 | |
| Commercial assay or kit | Anti-Digoxigenin-AP, Fab fragments | Roche | Cat #: 11093274910 | |
| Commercial assay or kit | NEBNext High-Fidelity 2X PCR Master Mix | New England Biolabs | Cat #: M0541 | |
| Commercial assay or kit | Agencourt AMPureXP beads | Beckman Coulter Genomics | Cat #: A63881 | |
| Commercial assay or kit | Flowmi Cell Strainers, porosity 70μm | Bel-Art SP Scienceware | Cat #: H13680-0070 | |
| Commercial assay or kit | Flowmi Cell Strainers, porosity 40μm | Bel-Art SP Scienceware | Cat #: H13680-0040 | |
| Commercial assay or kit | Trizol Reagent | Trizol Reagent | Cat #: 15596–018 | |
| Commercial assay or kit | Nuclei Buffer* (20X) | 10x Genomics | Cat #: 2000153/2000207 | |
| Commercial assay or kit | Nonidet P40 (NP40) Substitute | Sigma-Aldrich | Cat #: 74385 | |
| Commercial assay or kit | NuPAGE 4 to 12%, Bis-Tris, 1.0–1.5mm, Mini Protein Gels | Thermo Fisher Scientific | Cat #: NP0322BOX | |
| Commercial assay or kit | NuPAGE MOPS SDS Running Buffer | Thermo Fisher Scientific | Cat #: NP0001 | |
| Commercial assay or kit | 10X Phosphate-Buffered Saline (PBS), pH 7.4 | American Bio | Cat #: AB11072-01000 | |
| Commercial assay or kit | Amplitaq DNA Polymerase | Applied Biosystems | Cat #: N8080153 | |
| Commercial assay or kit | SuperScript III Reverse Transcriptase | Invitrogen | Cat #: 18080044 | |
| Commercial assay or kit | SuperScript III Reverse Transcriptase | Invitrogen | Cat #: 18080044 | |
| Commercial assay or kit | MinElute Kit | Qiagen | Cat #: 28004 | |
| Commercial assay or kit | Chromium Single Cell Multiome ATAC + Gene Expression | 10x Genomics | 10x Genomics | |
| Chemical compound, drug | Trizma Hydrochloride Solution, pH 7.4 | Sigma-Aldrich | Cat #: T2194 | |
| Chemical compound, drug | Sodium Chloride Solution, 5M | Sigma-Aldrich | Cat #: 59,222C | |
| Chemical compound, drug | Magnesium Chloride Solution, 1M | Sigma-Aldrich | Cat #: M1028 | |
| Chemical compound, drug | L-701,324 | Tocris Bioscience | Cat #: 0907 | dissolved in DMSO |
| Chemical compound, drug | Flumethasone | Selleck Chem | Cat #: S4088 | dissolved in DMSO |
| Chemical compound, drug | Tricaine-S Topical Anesthetics | Pentair Aquatic Eco-Systems | Cat #: TRS1 | |
| Chemical compound, drug | Triton X –100 | Sigma-Aldrich | Cat #: T9284 | |
| Chemical compound, drug | Tween-20 | Sigma-Aldrich | Cat #: P1379 | |
| Chemical compound, drug | Digitonin (5%) | Thermo Fisher Scientific | Cat #: BN2006 | |
| Chemical compound, drug | DAPI | Thermo Fisher Scientific | Cat #: D1306 | |
| Chemical compound, drug | 16% Paraformaldehyde aqueous solution | Electron Microscopy Sciences | Electron Microscopy Sciences | |
| Chemical compound, drug | cOmplete, EDTA-free Protease Inhibitor Cocktail | Roche | ||
| Chemical compound, drug | T7 RNA Polymerase | Roche | Cat #: RPOLT7-RO | |
| Chemical compound, drug | Glycoblue | Thermo Fisher Scientific | Cat #: AM9516 | |
| Software, algorithm | ZebraLab | ViewPoint Behavior Technology | http://viewpoint.fr/en/p/software/zebralab-zebrafish-behavior-screening | |
| Software, algorithm | MATLAB toolboxes | MathWorks | ||
| Software, algorithm | MATLAB R2018a | MathWorks | http://mathworks.com/products/matlab.html | |
| Software, algorithm | Prism 9 | GraphPad | https://www.graphstats.net/graphpad-prism | |
| Software, algorithm | LabxDB seq | Vejnar and Giraldez, 2020 | Used for managing high-throughput sequencing data | |
| Software, algorithm | LabxPipe | Vejnar, 2023b | available at https://github.com/vejnar/LabxPipe | |
| Software, algorithm | ReadKnead | Vejnar, 2023c | available at https://github.com/vejnar/ReadKnead | |
| Software, algorithm | Bowtie2 | Langmead and Salzberg, 2012 | read mapping | |
| Software, algorithm | BEDTools | Quinlan and Hall, 2010 | genome tracks | |
| Software, algorithm | MACS3 and MACS2 | Zhang et al., 2008 | peak calling | |
| Software, algorithm | DESeq2 | Love et al., 2014 | differential analysis | |
| Software, algorithm | deeptools | Ramírez et al., 2014 | ||
| Software, algorithm | gplots | Galili 2020 | available at https://github.com/talgalili/gplots | |
| Software, algorithm | MEME suite | McLeay and Bailey, 2010 | available at https://meme-suite.org/meme/tools/ame | |
| Software, algorithm | GeneAbacus | Vejnar, 2023c | available at https://github.com/vejnar/geneabacus | |
| Software, algorithm | cellranger-arc pipeline (v1.0.1) | 10x Genomics | ||
| Software, algorithm | Weighted Nearest Neighbor (WNN) | Hao et al., 2021 | ||
| Software, algorithm | Integrated Diffusion | Kuchroo et al., 2021; Kuchroo et al., 2022 | ||
| Software, algorithm | Custom sleep analysis software | Rihel, 2023 | available at https://github.com/JRihel/Sleep-Analysis/tree/Sleep-Analysis-Code |
Additional files
-
Supplementary file 1
Information on sORFs identified within lincRNAs and targeting/genotyping information (3 sheets).
- https://cdn.elifesciences.org/articles/82249/elife-82249-supp1-v1.xlsx
-
Supplementary file 2
Protein and proximal 3'UTR BLAST results, and related HMGN1 across species (5 sheets).
- https://cdn.elifesciences.org/articles/82249/elife-82249-supp2-v1.xlsx
-
Supplementary file 3
Correlating Drugs to linc-mipep1 heterozygous and homozygous mutants, from hierarchical clustering analysis against>500 FDA-approved small molecues (from Rihel et al., 2010), and concentrations used (1 sheet).
- https://cdn.elifesciences.org/articles/82249/elife-82249-supp3-v1.xlsx
-
Supplementary file 4
Bulk omni-ATAC-seq on WT or linc-mipep;linc-wrb mutant brains at 5 dpf (4 sheets).
- https://cdn.elifesciences.org/articles/82249/elife-82249-supp4-v1.xlsx
-
Supplementary file 5
Single cell Multiome Analyses of WT or linc-mipep mutant brains (sibling-matched) at 5 dpf (8 sheets).
- https://cdn.elifesciences.org/articles/82249/elife-82249-supp5-v1.xlsx
-
Supplementary file 6
Integrated Diffusion/MELD analyses using WNN clusters and conditional clusters (2 sheets).
- https://cdn.elifesciences.org/articles/82249/elife-82249-supp6-v1.xlsx
-
Supplementary file 7
RNA Polymerase II ChIP-seq on wild type (WT) or linc-mipep; linc-wrb dissected brains at 5days post-fertilization (dpf) (2 sheets).
- https://cdn.elifesciences.org/articles/82249/elife-82249-supp7-v1.xlsx
-
Supplementary file 8
ATAC peak intensity plots for statistically different peaks between wild type and linc-mipep mutant cells.
- https://cdn.elifesciences.org/articles/82249/elife-82249-supp8-v1.pdf
-
Supplementary file 9
Key for raw sequencing data from this study deposited in NCBI BioProject PRJNA945049 (1 sheet).
- https://cdn.elifesciences.org/articles/82249/elife-82249-supp9-v1.xlsx
-
MDAR checklist
- https://cdn.elifesciences.org/articles/82249/elife-82249-mdarchecklist1-v1.pdf
Download links
A two-part list of links to download the article, or parts of the article, in various formats.
Downloads (link to download the article as PDF)
Open citations (links to open the citations from this article in various online reference manager services)
Cite this article (links to download the citations from this article in formats compatible with various reference manager tools)
linc-mipep and linc-wrb encode micropeptides that regulate chromatin accessibility in vertebrate-specific neural cells
eLife 12:e82249.
https://doi.org/10.7554/eLife.82249


