Effects of smoking on genome-wide DNA methylation profiles: A study of discordant and concordant monozygotic twin pairs
- Department of Biological Psychology, Vrije Universiteit Amsterdam, Netherlands
- Amsterdam Public Health Research Institute, Netherlands
- Amsterdam Reproduction and Development (AR&D) Research Institute, Netherlands
- Virginia Institute for Psychiatric and Behavioral Genetics, Virginia Commonwealth University, United States
Figures
Figure 1
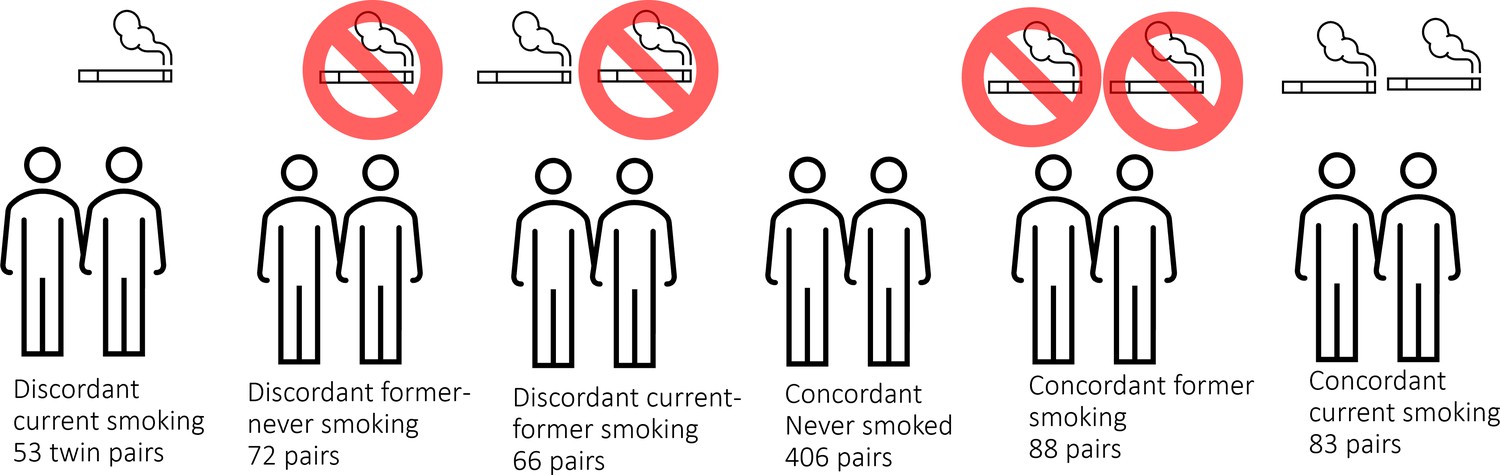
DNA methylation analysis in smoking discordant and smoking concordant monozygotic twin pairs.
Blood DNA methylation profiles (Illumina 450k array) from six groups of monozygotic twin pairs were analysed.
Figure 2
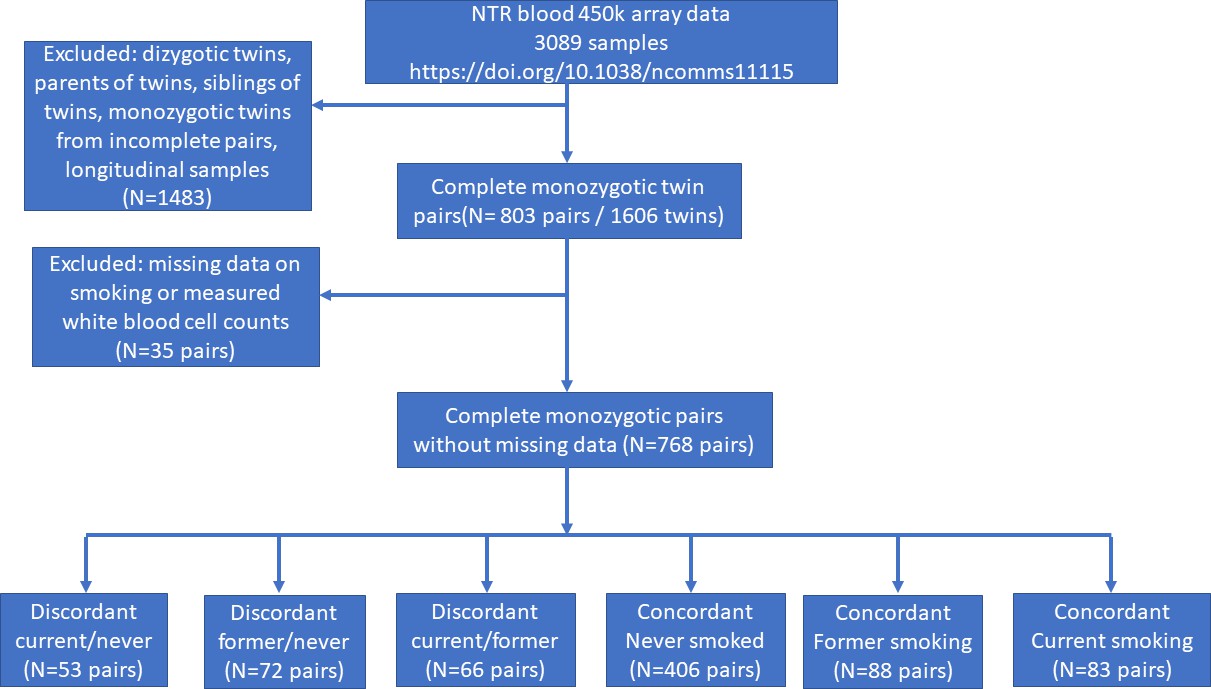
Study flowchart.
Figure 3 with 1 supplement
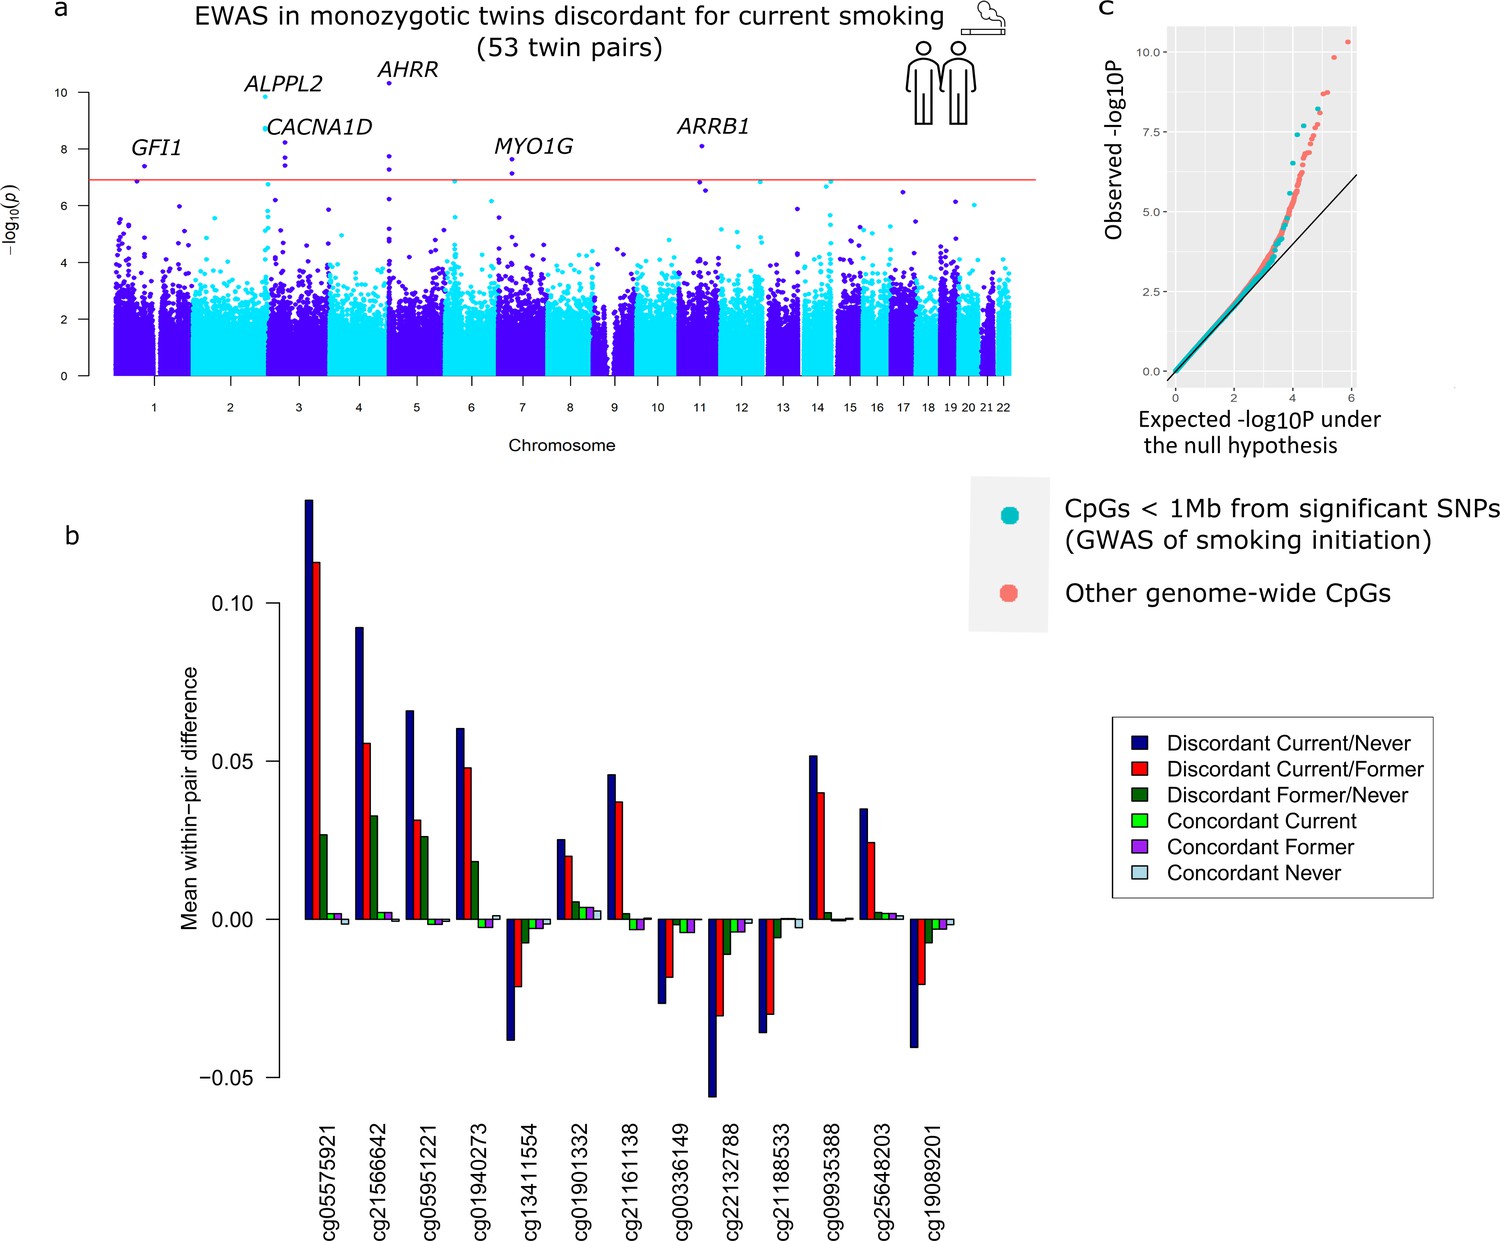
Top differentially methylated loci identified in monozygotic twin pairs discordant for current smoking.
(a) Manhattan plot of the epigenome-wide association study (EWAS) in 53 smoking discordant monozygotic twin pairs (current versus never). The red horizontal line denotes the epigenome-wide significance threshold (Bonferroni correction) and 13 CpGs with significant differences are highlighted. (b) Mean within-pair differences in monozygotic twin pairs at the 13 CpGs that were epigenome-wide significant in smoking discordant monozygotic pairs. Mean within-pair differences of the residuals obtained after correction of methylation β-values for covariates are shown for 53 monozygotic pairs discordant for current/never smoking, 66 monozygotic pairs discordant for current/former smoking, 72 monozygotic pairs discordant for former/never smoking, 83 concordant current smoking monozygotic pairs, 88 concordant former smoking monozygotic pairs, and 406 concordant never smoking monozygotic pairs. (c) QQ-plot showing p-values from the EWAS in 53 smoking discordant monozygotic twin pairs (current versus never). P-values for CpGs located nearby significant SNPs from the genome-wide association study (GWAS) of smoking initiation are plotted in blue and all other genome-wide CpGs are plotted in orange.
Figure 3—figure supplement 1
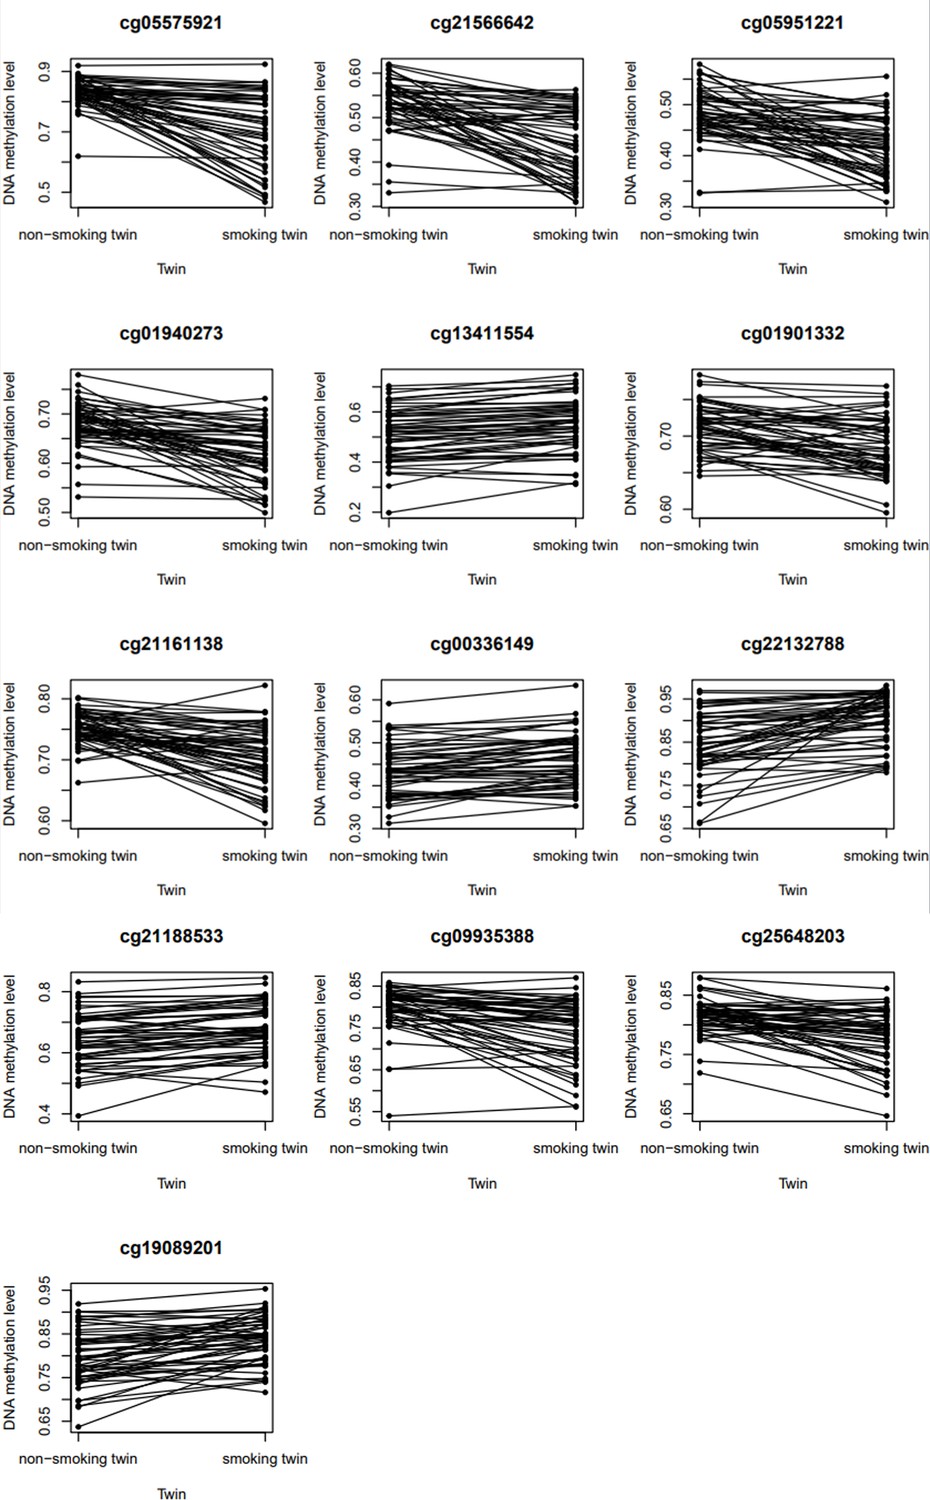
DNA methylation levels in current/never smoking discordant monozygotic twin pairs.
Figures show the DNA methylation β-values (unadjusted for any covariates) in 53 discordant monozygotic twin pairs for the 13 significant CpGs.
Figure 4
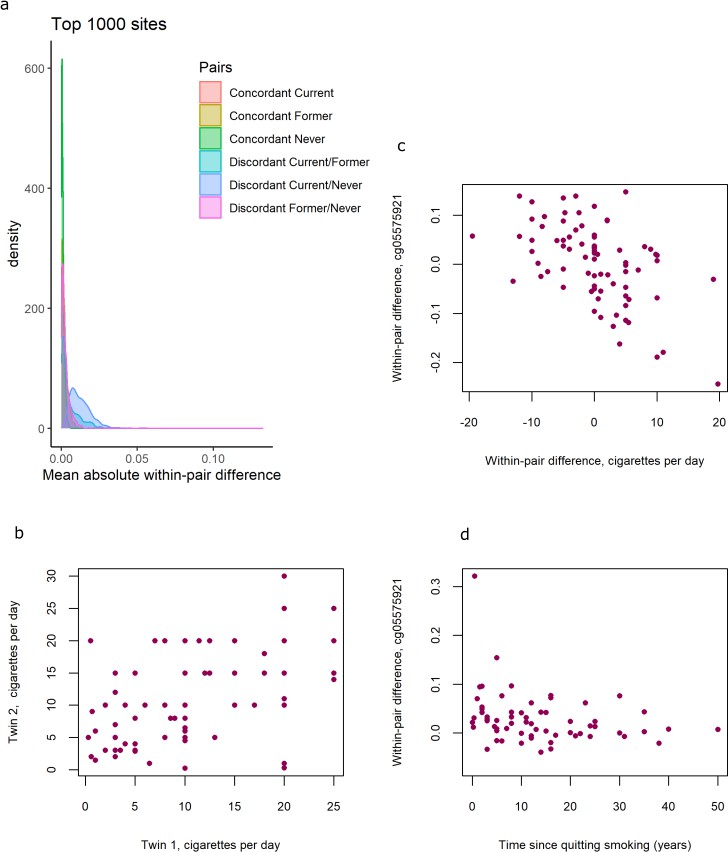
DNA methylation differences in smoking discordant and smoking concordant pairs.
(a) Distributions of the mean absolute within-pair differences in discordant and concordant pairs at the top 1000 CpGs with the lowest p-value from the epigenome-wide association study (EWAS) in discordant monozygotic pairs (current versus never smokers). (b) Scatterplot of cigarettes smoked per day in 80 concordant current smoking monozygotic pairs with complete data. (c) Scatterplot of within-pair differences in cigarettes smoked per day versus DNA methylation at cg05575921 (AHRR) in 80 concordant current smoking monozygotic pairs with complete data. (d) Scatterplot of within-pair differences in DNA methylation at cg05575921 (AHRR) versus time since quitting smoking (years) in 63 pairs discordant for former smoking.
Tables
Table 1
Descriptive statistics for smoking discordant and concordant monozygotic twin pairs.
| Discordant current/never(53 pairs) | Discordant former/never(72 pairs) | Discordant current/former(66 pairs) | Concordant current(83 pairs) | Concordant never(406 pairs) | Concordant former(88 pairs) | |||||||||||||||||||
|---|---|---|---|---|---|---|---|---|---|---|---|---|---|---|---|---|---|---|---|---|---|---|---|---|
| Current smoker | Never-smoker | Mean diff | p-value | Former smoker | Never-smoker | Mean diff | p-value | Current smoker | Former smoker | Mean diff | p-value | Twin 1 | Twin 2 | Mean diff | p-value | Twin 1 | Twin 2 | Mean diff | p-value | Twin 1 | Twin 2 | Mean diff | p-value | |
| % Female pairs | 60.4% | 60.4% | n.a. | n.a. | 77.80% | 77.80% | n.a. | n.a. | 69.7% | 69.7% | n.a. | n.a. | 61.4% | 61.4% | n.a. | n.a. | 73.6% | 73.6% | n.a. | n.a. | 64.8% | 64.8% | n.a. | n.a. |
| Age at blood sampling, mean (SD) | 33.1 (8.0) | 33.0 (7.9) | 0.10 | 0.34 | 41.4 (13.2) | 41.4 (13.1) | 0.02 | 0.83 | 42.2 (12.6) | 42.2 (12.5) | −0.06 | 0.45 | 33.8 (10.3) | 33.9 (10.5) | −0.12 | 0.10 | 33.1 (11.3) | 33.0 (11.2) | 0.06 | 0.08 | 45.2 (13.4) | 45.2 (13.4) | 0.09 | 0.29 |
| Cigarettes per day at blood sampling, mean (SD), N missings | 8.9 (6.4), 6 | n.a. | n.a. | n.a. | n.a. | n.a. | n.a. | n.a. | 11.9 (7.2), 9 | n.a. | n.a. | n.a. | 11.1 (7.0), 2 | 10.9 (6.9), 1 | 0.00 | 1.00 | n.a. | n.a. | n.a. | n.a. | n.a. | n.a. | n.a. | n.a. |
| Packyears, mean (SD), N missings | 6.8 (7.0), 13 | n.a. | n.a. | n.a. | 5.9 (11.1), 15 | n.a. | n.a. | n.a. | 13.6 (13.2), 9 | 9.3 (8.7), 10 | 3.9 | 0.05 | 9.7 (9.3), 10 | 8.3 (7.6), 9 | 0.22 | 0.82 | n.a. | n.a. | n.a. | n.a. | 10.6 (11.5), 7 | 9.8 (10.4), 11 | 0.78 | 0.55 |
| Years since quitting smoking, mean (SD), N missings | n.a. | n.a. | n.a. | n.a. | 13.5 (11.4), 9 | n.a. | n.a. | n.a. | n.a. | 9.0 (10.2), 2 | n.a. | n.a. | n.a. | n.a. | n.a. | n.a. | n.a. | n.a. | n.a. | n.a. | 11.9 (9.1), 8 | 13.6 (11.8), 7 | −1.62 | 0.20 |
| Plasma cotinine level, mean (SD), N missings* | 222 (197.5), 1 | 1.8 (2.6), 28 | 261.1 | 1.6 × 10⁻⁵ | 1.4 (1.8), 49 | 0.9 (1.0), 52 | 0.62 | 0.43 | 286.7 (330.5), 2 | 19.2 (70.0), 28 | 293.8 | 2.5 × 10⁻⁶ | 267 (290.9), 3 | 279 (308.1), 3 | −8.7 | 0.78 | 1.3 (9.7), 274 | 0.5 (0.8), 260 | 0.07 | 0.50 | 55.8 (222.2), 61 | 6 (16.2), 64 | 83.3 | 0.26 |
| Educational Attainment, N (%) | 0.04 | 0.97 | 0.34 | 0.60 | 0.76 | 0.83 | ||||||||||||||||||
| N missing | 18 | 11 | 13 | 13 | 14 | 14 | 28 | 34 | 105 | 108 | 14 | 20 | ||||||||||||
| 1. Primary school only | 0 (0%) | 1 (2.3%) | 0 (0%) | 1 (1.7%) | 2 (3.8%) | 5 (9.6%) | 1 (1.8%) | 2 (4.1%) | 3 (1.0%) | 4 (1.3%) | 6 (8.1%) | 4 (5.9%) | ||||||||||||
| 2. Lower vocational schooling | 1 (2.9%) | 0 (0%) | 7 (11.9%) | 6 (10.2%) | 10 (19.2%) | 4 (7.7%) | 4 (7.3%) | 1 (2.0%) | 8 (2.7%) | 10 (3.4%) | 2 (2.7%) | 10 (14.7%) | ||||||||||||
| 3. Lower secondary schooling (general) | 2 (5.7%) | 2 (4.8%) | 11 (18.6%) | 8 (13.6%) | 7 (13.5%) | 4 (7.7%) | 5 (9.1%) | 7 (14.3%) | 11 (3.7%) | 11 (3.7%) | 10 (13.5%) | 6 (8.8%) | ||||||||||||
| 4. Intermediate vocational schooling | 12 (34.3%) | 15 (35.7%) | 13 (23.7%) | 19 (32.2%) | 8 (15.4%) | 13 (25.0%) | 16 (29.1%) | 16 (32.7%) | 81 (26.9%) | 85 (28.5%) | 26 (35.1%) | 17 (25.0%) | ||||||||||||
| 5. Intermediate/higher secondary schooling (general) | 2 (5.7%) | 1 (2.4%) | 3 (6.8%) | 3 (5.1%) | 2 (3.8%) | 2 (3.8%) | 4 (7.3%) | 6 (12.2%) | 15 (5.0%) | 17 (5.7%) | 3 (4.1%) | 2 (2.9%) | ||||||||||||
| 6. Higher vocational schooling | 14 (40.0%) | 14 (33.3%) | 14 (22.0%) | 11 (18.6%) | 15 (28.8%) | 16 (30.8%) | 19 (34.5%) | 11 (22.4%) | 97 (32.2%) | 81 (27.2%) | 17 (23.0%) | 17 (25.0%) | ||||||||||||
| 7. University | 4 (11.4%) | 9 (21.4%) | 10 (16.9%) | 11 (18.6%) | 8 (15.4%) | 8 (15.4%) | 6 (10.9%) | 6 (12.2%) | 86 (28.6%) | 90 (30.2%) | 10 (13.5%) | 12 (17.6%) | ||||||||||||
| BMI, mean (SD), N missings | 23.8 (3.8), n.a. | 24.0 (3.4), n.a. | −0.17 | 0.74 | 25.0 (3.6), n.a. | 25.1 (4.2), n.a. | −0.13 | 0.75 | 23.7 (3.1) | 25.2 (4.2) | −1.47 | 3.4 × 10⁻⁴ | 23.6 (3.5), n.a. | 23.1 (3.2), n.a. | 0.47 | 0.06 | 23.8 (3.8),4 | 23.6 (3.4), 2 | 0.27 | 0.03 | 25.6 (4.0), n.a. | 24.9 (3.7), n.a. | 0.63 | 0.02 |
| Percentage monocytes, mean (SD), N missings | 8.0 (2.3), 0 | 8.5 (2.4), 0 | −0.44 | 0.19 | 8.6 (2.0), 0 | 8.3 (1.8), 0 | 0.29 | 0.19 | 8.6 (1.9),0 | 9.2 (3.1), 0 | −0.57 | 0.14 | 8.3 (2.1), 0 | 8.1 (1.9), 0 | 0.20 | 0.36 | 8.5 (2.0), 0 | 8.5 (2.2), 0 | 0.03 | 0.75 | 8.4 (2.4), 0 | 8.5 (2.4), 0 | −0.06 | 0.75 |
| Percentage lymphocytes, mean (SD), N missings | 35.0 (8.9), 0 | 35.9 (10.0) | −0.94 | 0.50 | 33.6 (8.5), 0 | 34.0 (8.7) | −0.37 | 0.77 | 35.8 (8.2),0 | 35.6 (8.5), 0 | 0.25 | 0.84 | 33.7 (8.3), 0 | 34.1 (8.3), 0 | −0.44 | 0.67 | 36.3 (8.4), 0 | 36.2 (8.4), 0 | 0.04 | 0.92 | 35.0 (7.7), 0 | 34.1 (8.4), 0 | 0.95 | 0.26 |
| Percentage neutrophils, mean (SD), N missings | 53.4 (9.5), 0 | 52.1 (9.8), 0 | 1.34 | 0.38 | 54.4 (9.1), 0 | 54.5 (9.1), 0 | −0.08 | 0.95 | 51.6 (9.0),0 | 51.7 (8.9), 0 | 0–0.06 | 0.96 | 53.7 (8.9), 0 | 53.7 (9.3), 0 | 0.03 | 0.98 | 51.8, (8.7), 0 | 51.9 (9.3), 0 | −0.08 | 0.86 | 52.8 (8.2), 0 | 53.7 (8.4), 0 | −0.84 | 0.35 |
| Percentage eosinophils, mean (SD), N missings | 3.1 (2.5), 0 | 3.1 (2.1), 0 | 0.05 | 0.91 | 3.1 (1.9), 0 | 2.9 (2.0), 0 | 0.15 | 0.53 | 3.3 (1.9),0 | 3.1 (1.7), 0 | 0.21 | 0.33 | 3.4 (2.2), 0 | 3.4 (1.8), 0 | −0.03 | 0.91 | 2.9 (1.8), 0 | 2.9 (1.9), 0 | −0.04 | 0.66 | 3.1 (1.9), 0 | 3.2 (2.4), 0 | −0.06 | 0.77 |
| Percentage basophils, mean (SD), N missings | 0.5 (0.7), 0 | 0.5 (0.7), 0 | −0.01 | 0.96 | 0.3 (0.3), 0 | 0.4 (0.5), 0 | −0.02 | 0.76 | 0.6 (0.9),0 | 0.4 (0.4), 0 | 0.18 | 0.12 | 0.9 (3.1), 0 | 0.6 (1.1), 0 | 0.25 | 0.49 | 0.5 (0.7), 0 | 0.4 (0.7), 0 | 0.06 | 0.21 | 0.6 (1.1), 0 | 0.6 (0.9), 0 | −0.01 | 0.97 |
-
*
Missing values include values that are below the detection limit. BMI = body mass Index.
Table 2
Epigenome-wide significant differentially methylated CpGs in monozygotic pairs discordant for current smoking status.
| Current smoking discordant pairs | Former smoking discordant pairs (former/never) | |||||||||||||
|---|---|---|---|---|---|---|---|---|---|---|---|---|---|---|
| IlmnID | CHR | MAPINFO | Gene* | Nearest gene | Mean diff | p-value | 95conf_L | 95conf_H | T-Statistic | Mean diff | p-value | 95conf_L | 95conf_H | T-Statistic |
| cg05575921 | 5 | 373378 | AHRR | AHRR | 0.132 | 4.9 × 10⁻¹¹ | 0.100 | 0.165 | 8.265 | 0.027 | 3.3 × 10⁻⁴ | 0.013 | 0.041 | 3.778 |
| cg21566642 | 2 | 233284661 | ALPPL2 | 0.092 | 1.5 × 10⁻¹⁰ | 0.069 | 0.115 | 7.960 | 0.033 | 3.2 × 10⁻⁶ | 0.020 | 0.046 | 5.067 | |
| cg05951221 | 2 | 233284402 | ALPPL2 | 0.066 | 1.8 × 10⁻⁹ | 0.048 | 0.084 | 7.270 | 0.026 | 4.6 × 10⁻⁶ | 0.016 | 0.037 | 4.964 | |
| cg01940273 | 2 | 233284934 | ALPPL2 | 0.060 | 2.1 × 10⁻⁹ | 0.044 | 0.077 | 7.240 | 0.018 | 1.3 × 10⁻⁴ | 0.009 | 0.027 | 4.052 | |
| cg13411554 | 3 | 53700276 | CACNA1D | CACNA1D | −0.038 | 6.0 × 10⁻⁹ | −0.049 | −0.027 | −6.947 | −0.007 | 0.10 | −0.016 | 0.002 | −1.655 |
| cg01901332 | 11 | 75031054 | ARRB1 | ARRB1 | 0.025 | 8.0 × 10⁻⁹ | 0.018 | 0.033 | 6.868 | 0.006 | 0.16 | −0.002 | 0.013 | 1.425 |
| cg21161138 | 5 | 399360 | AHRR | AHRR | 0.046 | 1.9 × 10⁻⁸ | 0.032 | 0.059 | 6.642 | 0.002 | 0.64 | −0.006 | 0.009 | 0.466 |
| cg00336149 | 3 | 53700195 | CACNA1D | CACNA1D | −0.027 | 2.0 × 10⁻⁸ | −0.035 | −0.019 | −6.615 | −0.002 | 0.60 | −0.008 | 0.005 | −0.524 |
| cg22132788 | 7 | 45002486 | MYO1G | MYO1G | −0.056 | 2.4 × 10⁻⁸ | −0.073 | −0.039 | −6.596 | −0.011 | 4.5 × 10⁻³ | −0.019 | −0.004 | −2.930 |
| cg21188533 | 3 | 53700263 | CACNA1D | CACNA1D | −0.036 | 3.9 × 10⁻⁸ | −0.047 | −0.025 | −6.437 | −0.006 | 0.24 | −0.015 | 0.004 | −1.196 |
| cg09935388 | 1 | 92947588 | GFI1 | GFI1 | 0.052 | 4.1 × 10⁻⁸ | 0.035 | 0.068 | 6.423 | 0.002 | 0.61 | −0.006 | 0.010 | 0.519 |
| cg25648203 | 5 | 395444 | AHRR | AHRR | 0.035 | 5.3 × 10⁻⁸ | 0.024 | 0.046 | 6.353 | 0.002 | 0.48 | −0.004 | 0.008 | 0.710 |
| cg19089201 | 7 | 45002287 | MYO1G | MYO1G | −0.040 | 7.5 × 10⁻⁸ | −0.053 | −0.028 | −6.260 | −0.007 | 0.13 | −0.017 | 0.002 | −1.529 |
-
Coordinates are given based on genome build 37. Mean differences represent non-smoking twin minus smoking-twin (hence positive values indicate a higher methylation level in non-smoking twins). The table shows the 13 epigenome-wide significant CpGs from the within-pair EWAS in 53 discordant monozygotic twin pairs (current versus never smokers). Results from the comparison within 72 monozygotic pairs discordant for former smoking are also shown.
-
*
CpGs without a gene name are located in intergenic regions. 95conf_L = 95% confidence interval lower bound, 95conf_H = 95% confidence interval upper bound.
Table 3
Correlations of within-pair differences in DNA methylation with within-pair differences in cigarettes per day and packyears in 83 concordant current smoking monozygotic pairs.
| cgid | CHR | Position | Gene | Nearest gene | Cigarettes per day | Packyears | p-value | |||
|---|---|---|---|---|---|---|---|---|---|---|
| r | p-value | r | r | |||||||
| cg05575921 | 5 | 373378 | AHRR | AHRR | −0.52 | 5.9 × 10⁻⁷ | −0.55 | 1.2 × 10⁻⁶ | −0.08 | 0.50 |
| cg21566642 | 2 | 233284661 | ALPPL2 | −0.49 | 4.7 × 10⁻⁶ | −0.56 | 8.1 × 10⁻⁷ | −0.19 | 0.10 | |
| cg05951221 | 2 | 233284402 | ALPPL2 | −0.44 | 4.7 × 10⁻⁵ | −0.56 | 9.0 × 10⁻⁷ | −0.18 | 0.12 | |
| cg01940273 | 2 | 233284934 | ALPPL2 | −0.56 | 7.0 × 10⁻⁸ | −0.65 | 2.0 × 10⁻⁹ | −0.23 | 0.04 | |
| cg13411554 | 3 | 53700276 | CACNA1D | CACNA1D | 0.27 | 1.4 × 10⁻² | 0.32 | 7.4 × 10⁻³ | 0.20 | 0.08 |
| cg01901332 | 11 | 75031054 | ARRB1 | ARRB1 | −0.23 | 3.8 × 10⁻² | −0.34 | 5.5 × 10⁻³ | −0.04 | 0.71 |
| cg21161138 | 5 | 399360 | AHRR | AHRR | −0.52 | 8.4 × 10⁻⁷ | −0.52 | 7.4 × 10⁻⁶ | −0.05 | 0.65 |
| cg00336149 | 3 | 53700195 | CACNA1D | CACNA1D | 0.36 | 1.0 × 10⁻³ | 0.42 | 3.5 × 10⁻⁴ | 0.16 | 0.16 |
| cg22132788 | 7 | 45002486 | MYO1G | MYO1G | 0.41 | 2.1 × 10⁻⁴ | 0.41 | 8.4 × 10⁻⁴ | 0.14 | 0.23 |
| cg21188533 | 3 | 53700263 | CACNA1D | CACNA1D | 0.32 | 4.1 × 10⁻³ | 0.38 | 1.4 × 10⁻³ | 0.27 | 0.01 |
| cg09935388 | 1 | 92947588 | GFI1 | GFI1 | −0.42 | 9.1 × 10⁻⁵ | −0.59 | 1.4 × 10⁻⁷ | −0.03 | 0.80 |
| cg25648203 | 5 | 395444 | AHRR | AHRR | −0.28 | 1.2 × 10⁻² | −0.42 | 4.3 × 10⁻⁴ | −0.06 | 0.61 |
| cg19089201 | 7 | 45002287 | MYO1G | MYO1G | 0.15 | 1.8 × 10⁻¹ | 0.27 | 2.6 × 10⁻² | 0.23 | 0.05 |
Table 4
Significantly associated transcripts in cis for CpGs that are differentially methylated in smoking discordant monozygotic twin pairs.
| CpG | Gene | Z score | p-value | FDR |
|---|---|---|---|---|
| cg25648203 | EXOC3 | −7.34 | 2.11e−13 | 0 |
| cg19089201 | RP4-647J21.1 | 5.55 | 2.84e−8 | 0 |
| cg05575921 | EXOC3 | −4.86 | 0.00000119 | 0.00039 |
| cg21161138 | EXOC3 | −3.82 | 0.000133 | 0.0254 |
Author response table 1
| check | |||||
|---|---|---|---|---|---|
| Frequency | Percent | Valid Percent | Cumulative Percent | ||
| Valid | 1,00 no changes in original status | 9349 | 97.1 | 97.1 | 97.1 |
| 2,00 original status were adjusted based on data checks | 33 | .3 | .3 | 97.4 | |
| 3,00 original status was missing, added from survey data | 192 | 2.0 | 2.0 | 99.4 | |
| 4,00 made missing based on data checks | 11 | .1 | .1 | 99.6 | |
| 5,00 original status missing and insufficient data to add status | 43 | .4 | .4 | 100.0 | |
| Total | 9628 | 100.0 | 100.0 |
Additional files
-
Supplementary file 1
Questions on smoking that were asked at blood draw and quality control of longitudinal smoking data.
- https://cdn.elifesciences.org/articles/83286/elife-83286-supp1-v2.docx
-
Supplementary file 2
Genomic inflation factor of each epigenome-wide association study (EWAS) analysis.
- https://cdn.elifesciences.org/articles/83286/elife-83286-supp2-v2.xlsx
-
Supplementary file 3
Within-pair analysis results for 13 epigenome-wide significant CpGs in current/never discordant pairs.
- https://cdn.elifesciences.org/articles/83286/elife-83286-supp3-v2.xlsx
-
Supplementary file 4
Epigenome-wide significant CpGs in MZ twin pairs discordant for current/former smoking.
- https://cdn.elifesciences.org/articles/83286/elife-83286-supp4-v2.xlsx
-
Supplementary file 5
Correlations between the within-pair difference in DNA methylation level and time since quitting smoking in MZ pairs discordant for former smoking.
- https://cdn.elifesciences.org/articles/83286/elife-83286-supp5-v2.xlsx
-
Supplementary file 6
Epigenome-wide association study (EWAS) atlas trait enrichment analysis results for top CpGs identified in current/never smoking discordant twin pairs.
- https://cdn.elifesciences.org/articles/83286/elife-83286-supp6-v2.xlsx
-
Supplementary file 7
Kegg pathway enrichment analysis results for top CpGs identified in current/never smoking discordant twin pairs.
- https://cdn.elifesciences.org/articles/83286/elife-83286-supp7-v2.xlsx
-
Supplementary file 8
GO pathway enrichment analysis results for top CpGs identified in current/never smoking discordant twin pairs.
- https://cdn.elifesciences.org/articles/83286/elife-83286-supp8-v2.xlsx
-
Supplementary file 9
Biobank-based Integrative Omics Studies (BIOS) consortium investigators.
- https://cdn.elifesciences.org/articles/83286/elife-83286-supp9-v2.docx
-
MDAR checklist
- https://cdn.elifesciences.org/articles/83286/elife-83286-mdarchecklist1-v2.docx
-
Source code 1
R-script for within-MZ pair epigenome-wide association study (EWAS analysis).
- https://cdn.elifesciences.org/articles/83286/elife-83286-code1-v2.zip
-
Reporting standard 1
This manuscript follows the guidelines of STROBE (Strengthening the reporting of observational studies in epidemiology).
The STROBE checklist has been included in the submission.
- https://cdn.elifesciences.org/articles/83286/elife-83286-repstand1-v2.docx
Download links
A two-part list of links to download the article, or parts of the article, in various formats.
Downloads (link to download the article as PDF)
Open citations (links to open the citations from this article in various online reference manager services)
Cite this article (links to download the citations from this article in formats compatible with various reference manager tools)
Effects of smoking on genome-wide DNA methylation profiles: A study of discordant and concordant monozygotic twin pairs
eLife 12:e83286.
https://doi.org/10.7554/eLife.83286


