Hybridization led to a rewired pluripotency network in the allotetraploid Xenopus laevis
- Department of Biological Sciences, University of Pittsburgh, United States
Figures
Figure 1 with 1 supplement
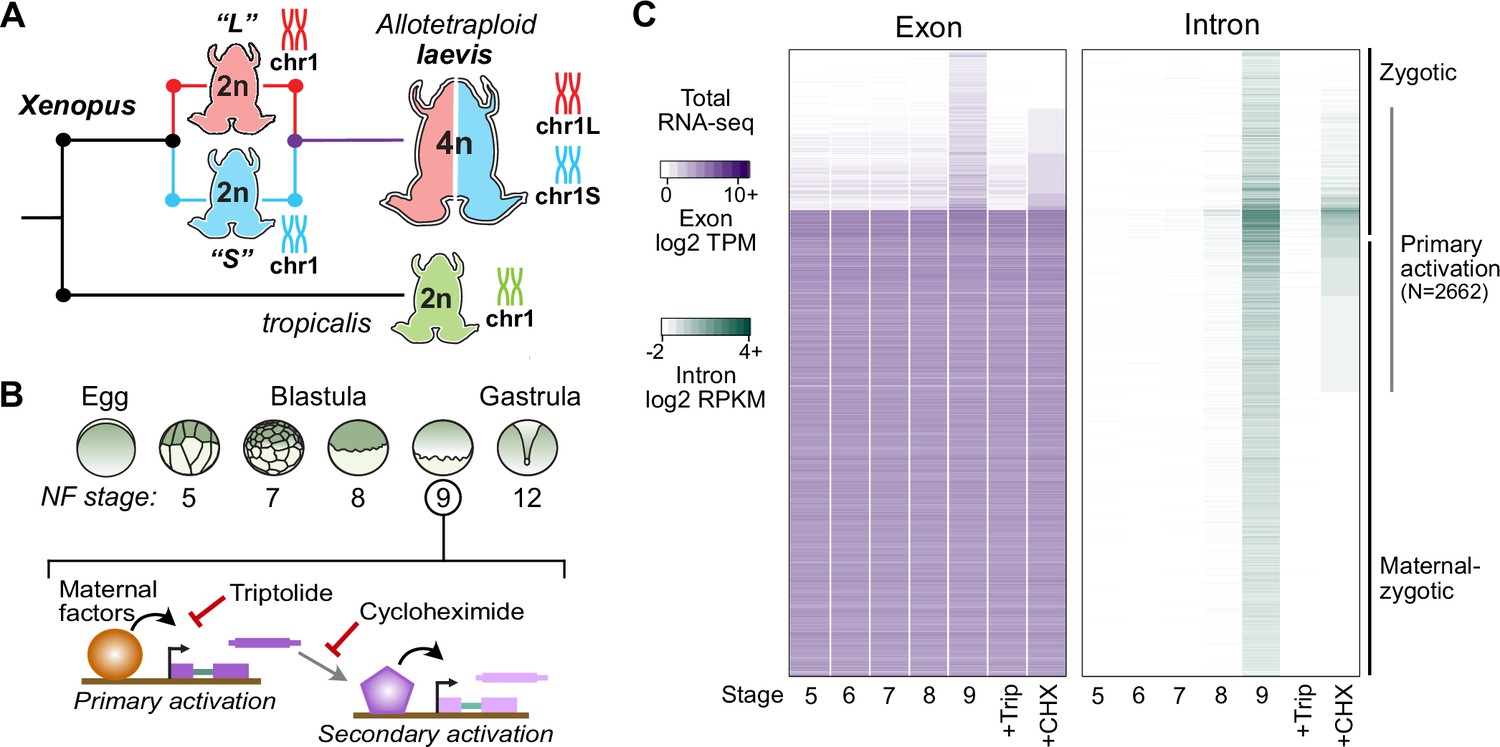
Identifying the first wave of genome activation across the two subgenomes.
(A) The allotetraploid X. laevis genome contains two distinct subgenomes “L” and “S” due to interspecific hybridization of ancestral diploids. (B) Triptolide inhibits genome activation, as measured in the late blastula, while cycloheximide inhibits only secondary activation, distinguishing genes directly activated by maternal factors. NF = Nieuwkoop and Faber. (C) Heatmap of RNA-seq coverage over exons (left) and introns (right) of activated genes.
Figure 1—figure supplement 1

Measuring genome activation.
(A) (Top) Animal and vegetal views of embryos treated with DMSO (vehicle) versus triptolide. Triptolide-treated embryos fail to gastrulate. (Bottom) Comparison of DMSO versus cycloheximide treated embryo. Treatment was at stage 8, which inhibits progression to stage 9. Scale bar = 0.5 mm. (B) Biplot of RNA-seq for untreated versus DMSO-treated embryos at stage 9, showing no effect on the transcriptome. (C) Biplot of RNA-seq for DMSO versus triptolide treated embryos, showing inhibited activation as detected by exonic (purple) and intronic (green) signal. The predicted mir-427 primary transcript is labeled and exhibits >95% expression inhibition. (D) Histogram of mRNA percent identity between homeolog pairs, as measured by Needleman-Wunsch alignment. Maximum is 0.975 (5 in every 200 bases, which should be generally distinguishable by RNA-seq using 2x100 sequencing reads).
Figure 2 with 2 supplements
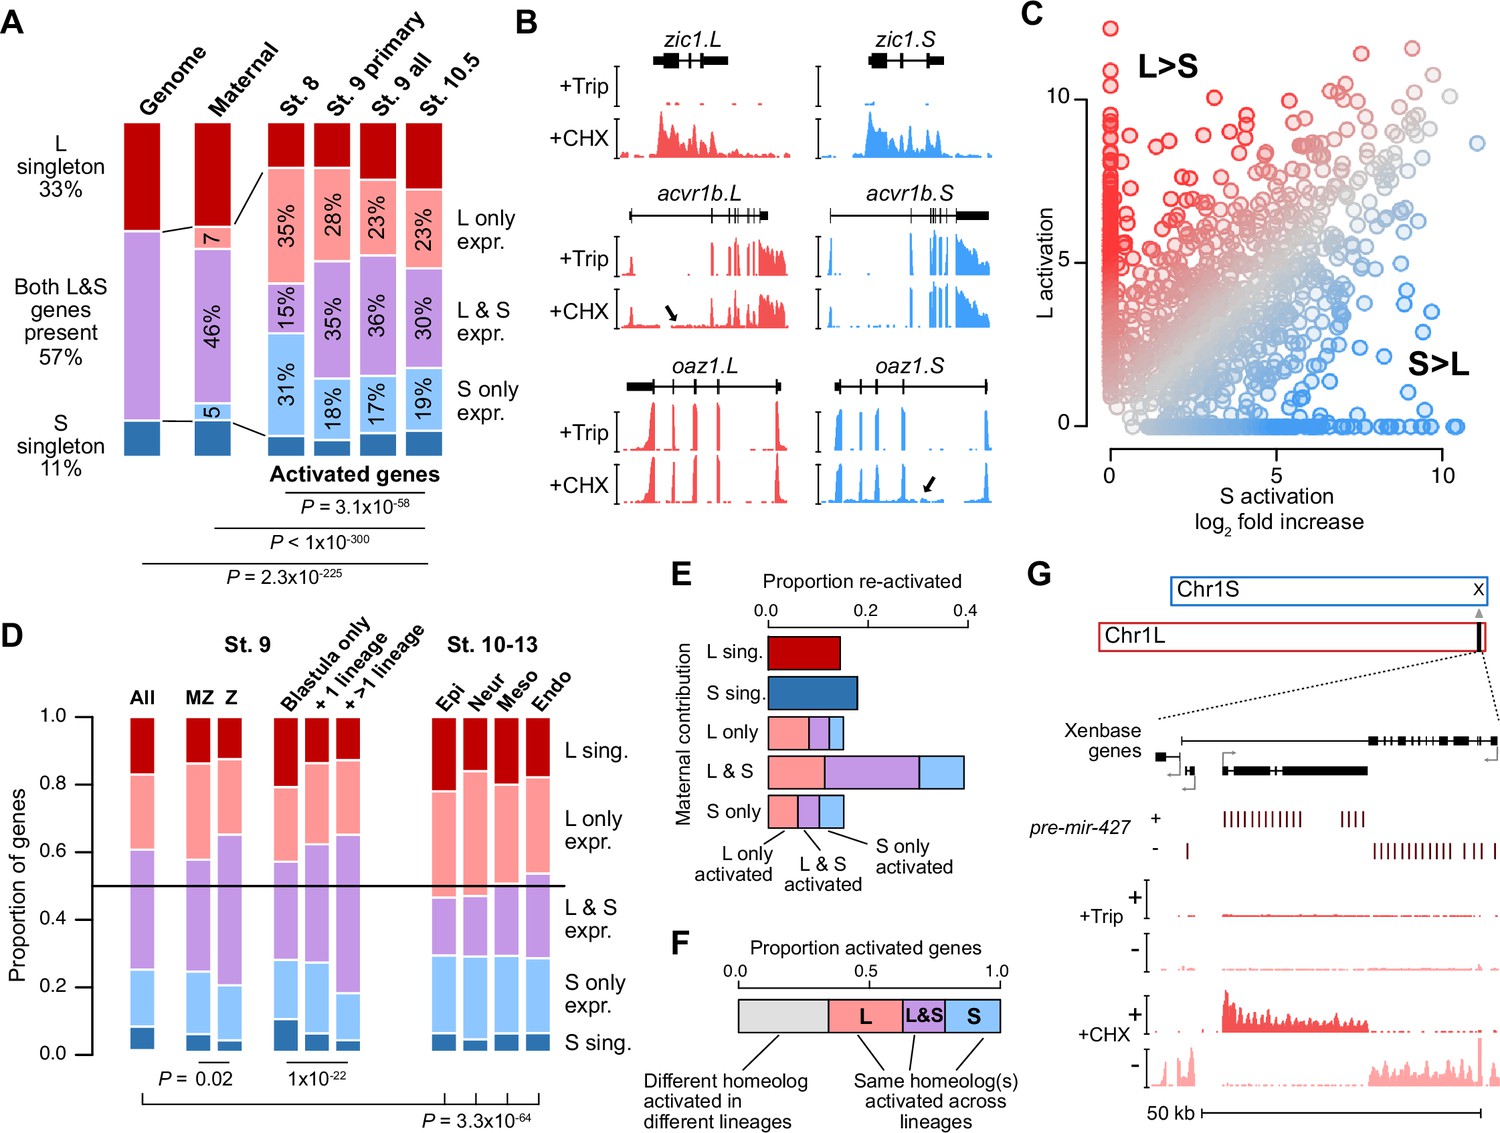
Homeologous genes are differentially activated in the early embryo.
(A) Proportion of genes encoded as homeologs on both subgenomes versus only one subgenome (singleton) (left), as compared to expression patterns in the early embryo. p Values are from χ-squared tests, 10 d.o.f., comparing genomic to expressed proportions, 16 d.o.f., comparing proportions between activated genes and the maternal contribution, 12 d.o.f., comparing proportions at subsequent stages of activation. (B) Browser tracks showing log2 reads-per-million RNA-seq coverage of equivalently activated homeologs (top) and differentially activated homeologs (L-specific, middle; S-specific, bottom). Trip = triptolide, CHX = cycloheximide. (C) Biplot comparing log2 fold primary activation over triptolide treated embryos for the S homeolog (x axis) versus the L homeolog. (D) Left, proportion of genes activated symmetrically or asymmetrically from the L or S subgenomes, stratified into whether there is a maternal contribution for either homeolog (MZ) or not (Z) (p=0.02, χ-squared test, 4 d.o.f.); and whether a gene is activated only in the stage 9 blastula or is additionally increased in only one or more than one differentiated lineage from stages 10–13 (p=1.3 × 10⁻²², χ-squared test, 8 d.o.f.). Right, homeolog proportions of later gene activation in epidermal (Epi), neural progenitor (Neur), ventral mesodermal (Meso), and endodermal (Endo) lineages from stages 10–13 (p=3.3 × 10–64, χ-squared test comparing stage 9 and the four lineages, 16 d.o.f.). Lineage-specific gene expression data are from Johnson et al., 2022. (E) Homeolog-specific stage 9 activation proportions, versus maternal contribution homeolog expression patterns, for maternal-zygotic genes. (F) Concordance of homeolog activation patterns across the differentiated lineages at stages 10–13, for genes initially activated at stage 9 and also increased in at least two differentiated lineages. (G) Browser track showing strand-separated reads-per-million RNA-seq coverage over the mir-427 encoding locus on the distal end of Chr1L (v10.1).
Figure 2—figure supplement 1

Differential homeolog activation over early development.
(A) Proportion of genes activated only from one homeolog or from both homeologs at stage 8, as compared to their homeolog activation patterns at stage 9. (B) Biplots showing L dominant (red) or S dominant (blue) activation at stage 8 (left), that resolves to more balanced homeolog activation patterns at stage 9. Each gene is the same color in both plots. (C) Biplot comparing log2 fold all stage 9 activation over triptolide treated embryos for the S homeolog (x axis) versus the L homeolog. (D) Proportion of genes activated symmetrically or asymmetrically from the L or S subgenomes, stratified into whether there is a maternal contribution for either homeolog (MZ) or not (Z), for primary activated genes, all stage 9 activated genes, and stage 10.5 activated genes. p Values are from χ-squared tests, 4 d.o.f. (E) Proportion of genes activated symmetrically or asymmetrically from the L or S subgenomes from stages 10–13 in differentiated lineages. Top plots represent all genes increased at each stage, bottom plots represent genes with maternal contribution <1 TPM. Lineage-specific gene expression data are from Johnson et al., 2022. (F) Proportion of genes encoded on both subgenomes that change homeolog activation patterns in a differentiated lineage in stages 10–13. (G) Concordance of homeolog activation patterns across the differentiated lineages at stages 10–13, for all genes up in at least two different lineages (top) or only genes with maternal contribution <1 TPM (bottom). (H) Boxplots showing log2 L versus S expression ratio for each differentiated lineage over stages 10–13, in the whole transcriptome. N = 8271 homeolog pairs. (I) Zoom of boxplots in (H), demonstrating a gradual bias toward L-dominant expression over time. (J) Significantly (FDR <0.05, Fisher’s exact test, two-sided) enriched Gene Ontology terms in genes activated from both homeologs, as compared to genes activated from only one subgenome. (K) Boxplots of non-synonymous to synonymous substitution rate ratio (dN/dS) shown on a log10 scale, for genes activated from both subgenomes or only one subgenome (p=0.15, Kruskal-Wallis test; median L=0.15, LS = 0.14, S=0.14). All gene groups trend toward stabilizing selection. N = 465, 585, 305 for L, L+S, and S groups, respectively. (L) Boxplots of CDS percent similarity for activation groups as in (K) (p=0.23, Kruskal-Wallis test). For all boxplots: center line, median; box limits, upper and lower quartiles; whiskers, 1.5x interquartile range; points, outliers.
Figure 2—figure supplement 2
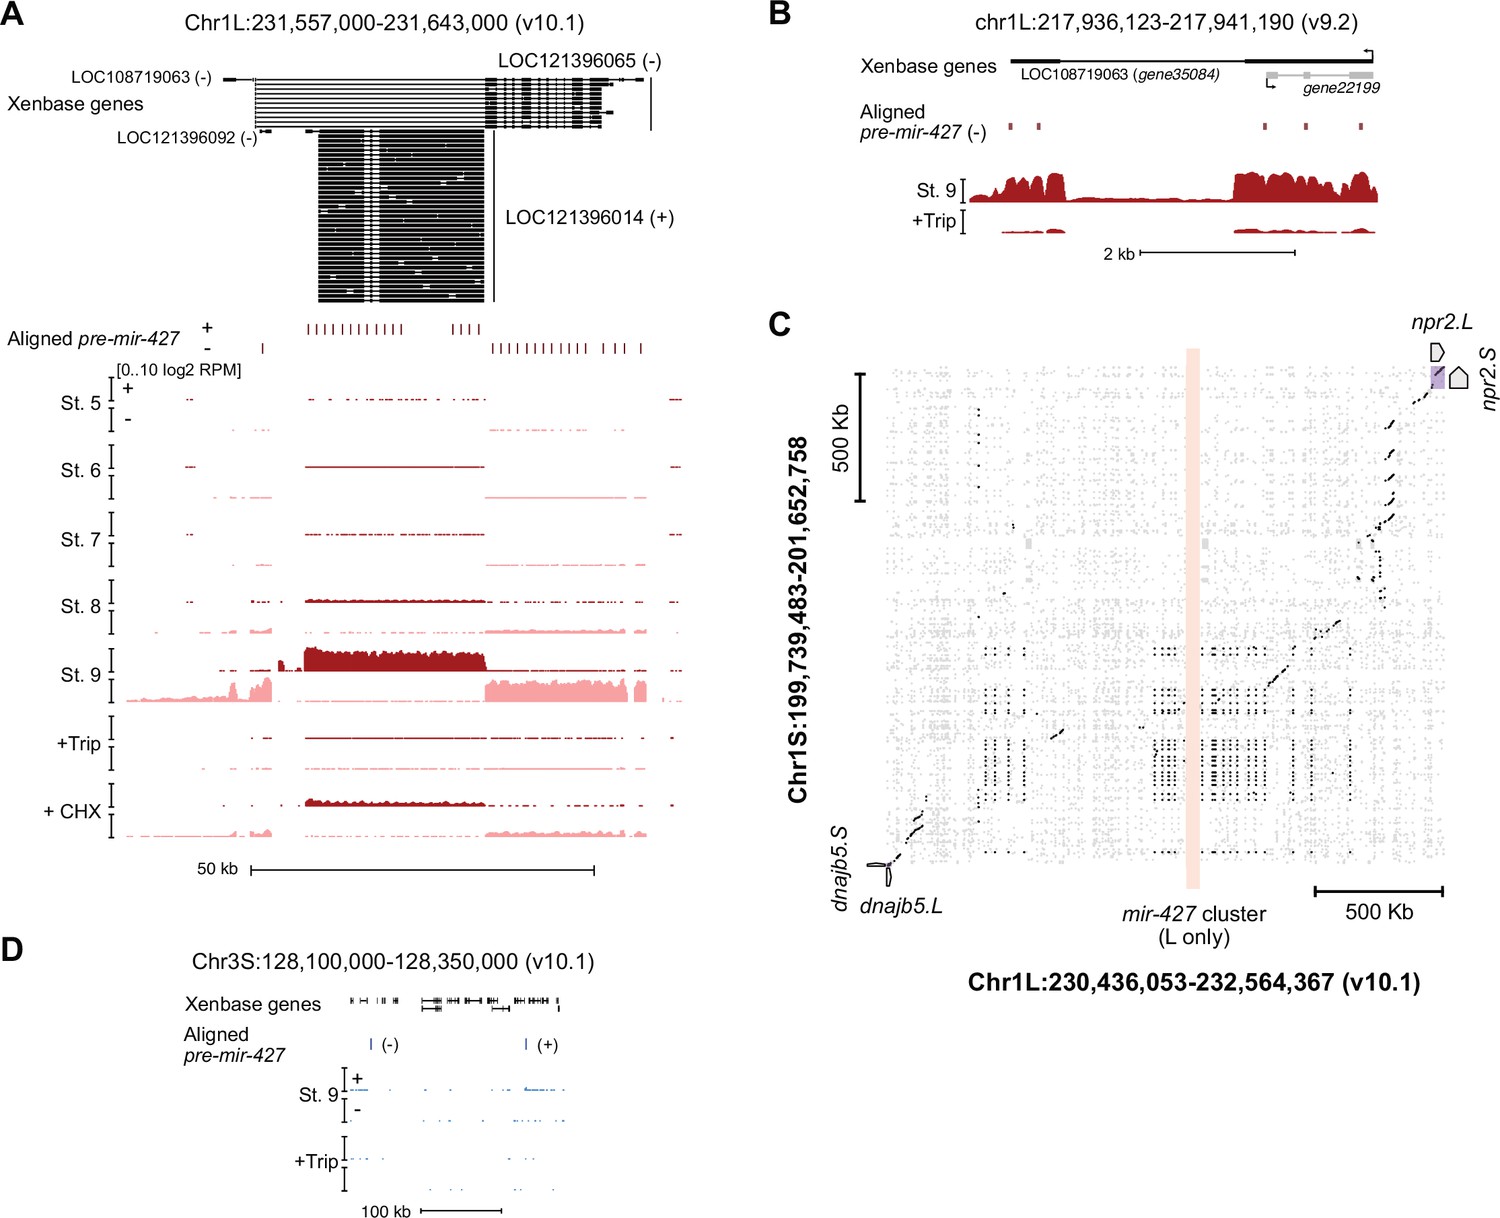
The mir-427 locus.
(A) Browser tracks showing strand-separated log2 reads-per-million RNA-seq coverage over the predicted mir-427 primary transcript near the telomere of Chr1L on the v10.1 genome assembly. Xenbase gene isoforms are annotated at the top, aligned precursor mir-427 sequences are annotated in the middle according to strand orientation. (B) Browser track showing log2 reads-per-million RNA-seq coverage over the presumed mir-427 encoding region on the v9.2 genome assembly. The overlapping antisense transcript is not transcribed (all coverage shown is sense to the mir-427 transcript). (C) Dot matrix alignment plot showing BLAST local alignments between v10.1 Chr1L and Chr1S in the region flanking the mir-427 locus. Repetitive sequence alignments (Xenbase soft-masked genomic sequence) are shown in gray, non-repetitive alignments in black. Upstream (dnajb5) and downstream (npr2) homeologous genes are labeled. The L-specific mir-427 locus is highlighted in light red, showing no alignments to Chr1S. (D) Region of v10.1 Chr3S where two additional sequence matches to the mir-427 hairpin are found by BLAT. However, there is minimal RNA-seq coverage, suggesting the Chr1L locus is the only bona fide mir-427 encoding region in the v10.1 assembly. Log2 reads-per-million coverage is shown on the same scale as panel (A).
Figure 3 with 2 supplements
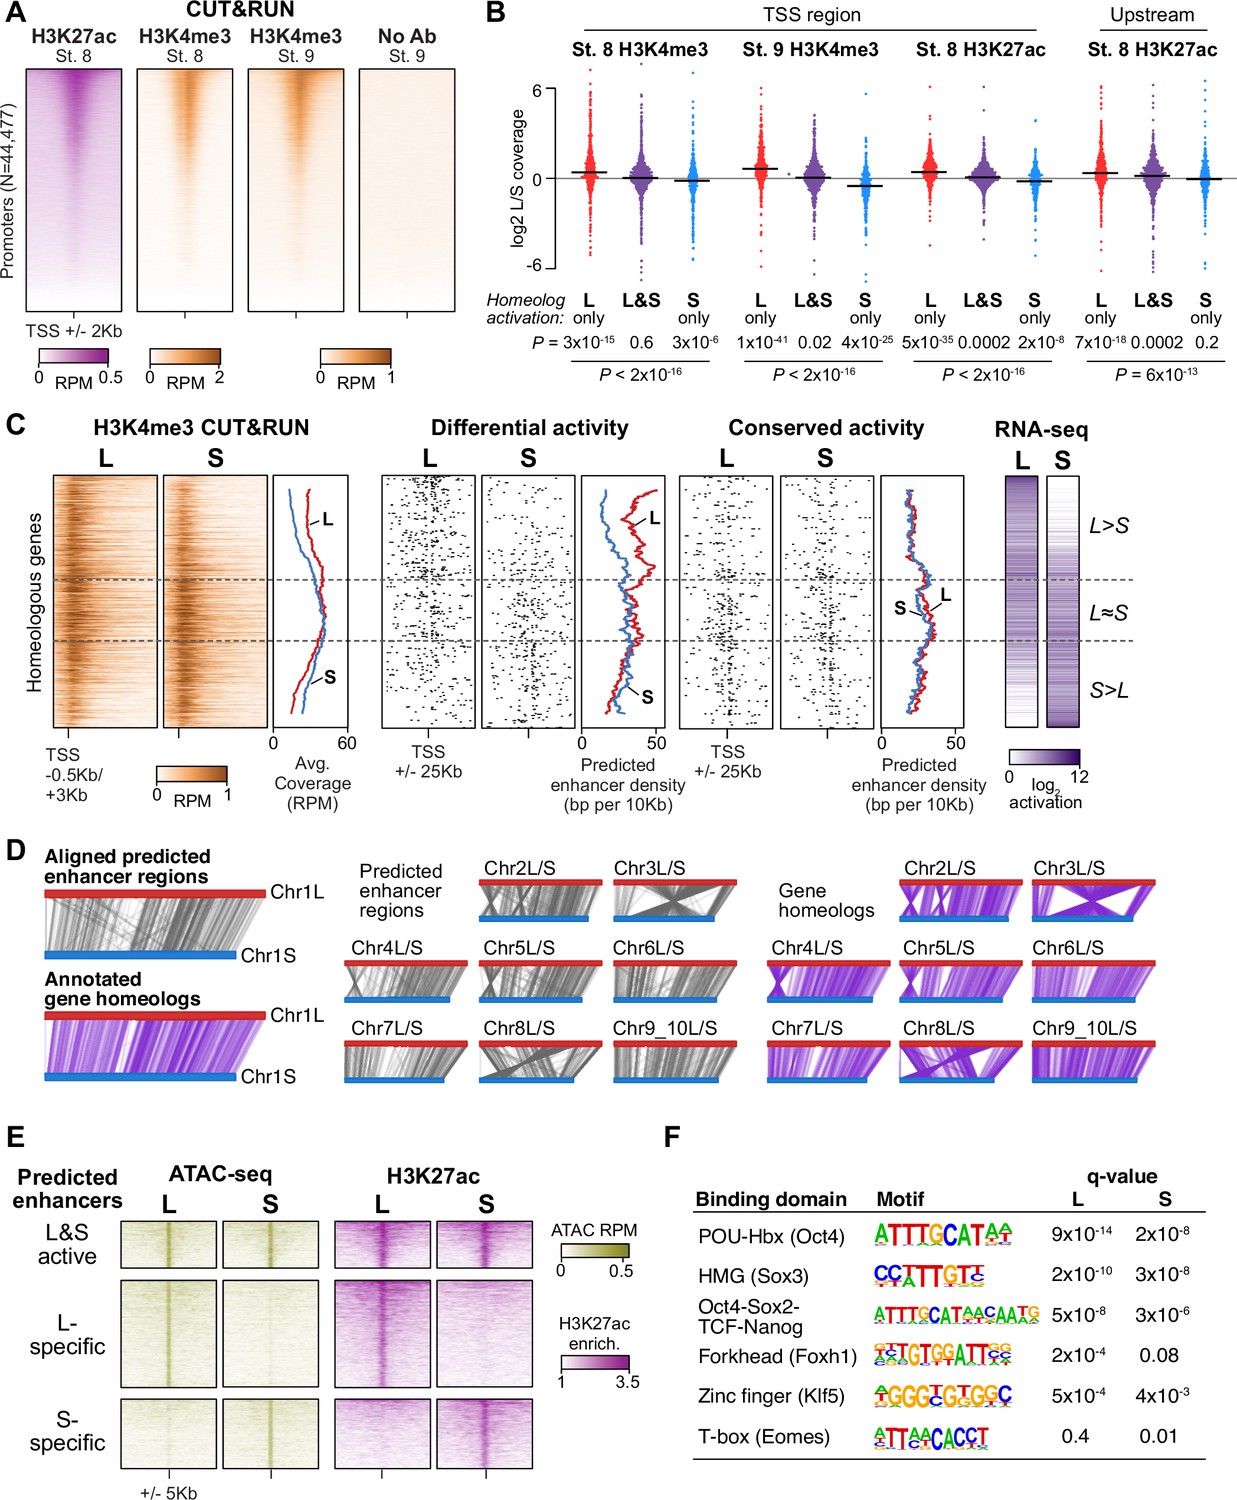
Differential homeolog activation is regulated by subgenome-specific enhancers.
(A) CUT&RUN coverage over all annotated transcription-start site (TSS) regions, sorted by descending stage 8 H3K27ac signal. (B) Bee-swarm plots showing the log2 ratio of L versus S homeolog coverage among genes where only one homeolog is activated (L only, S only), or both homeologs are activated. TSS region is 1 kb centered on the TSS; upstream region is 500 bp to 3 kb upstream of the TSS. Horizontal bars show medians. Individual category p values are from two-sided paired t-tests of log2 L homeolog coverage vs log2 S homeolog coverage, p values across the three categories are from a one-way ANOVA on the log2 ratios. (C) Stage 9 H3K4me3 CUT&RUN coverage over paired homeologous gene regions around the TSS (left) and maps comparing high-confidence predicted enhancer density near homeologous TSSs (middle). Differential predicted enhancers are active in only one subgenome, conserved predicted enhancers are active in both. Average densities are plotted to the right of each paired map. Gene pairs are sorted according to L versus S subgenome RNA-seq activation ratio (right). (D) Schematics showing aligned predicted enhancers and their homeologous regions (gray) mapped onto L (red, top lines) and S (blue, bottom lines) chromosomes. Comparable schematics show Xenbase annotated homeologous gene pairs (lavender). (E) Heatmap of stage 9 ATAC-seq and stage 8 H3K27ac CUT&RUN over L & S homeologous regions for equivalently active high-confidence predicted enhancers (top) and subgenome-specific predicted enhancers. (F) Top enriched transcription factor motif families in L-specific and S-specific active high-confidence predicted enhancers compared to inactive homeologous regions. FDR-corrected p-values from Homer are shown. RPM = reads per million.
Figure 3—figure supplement 1
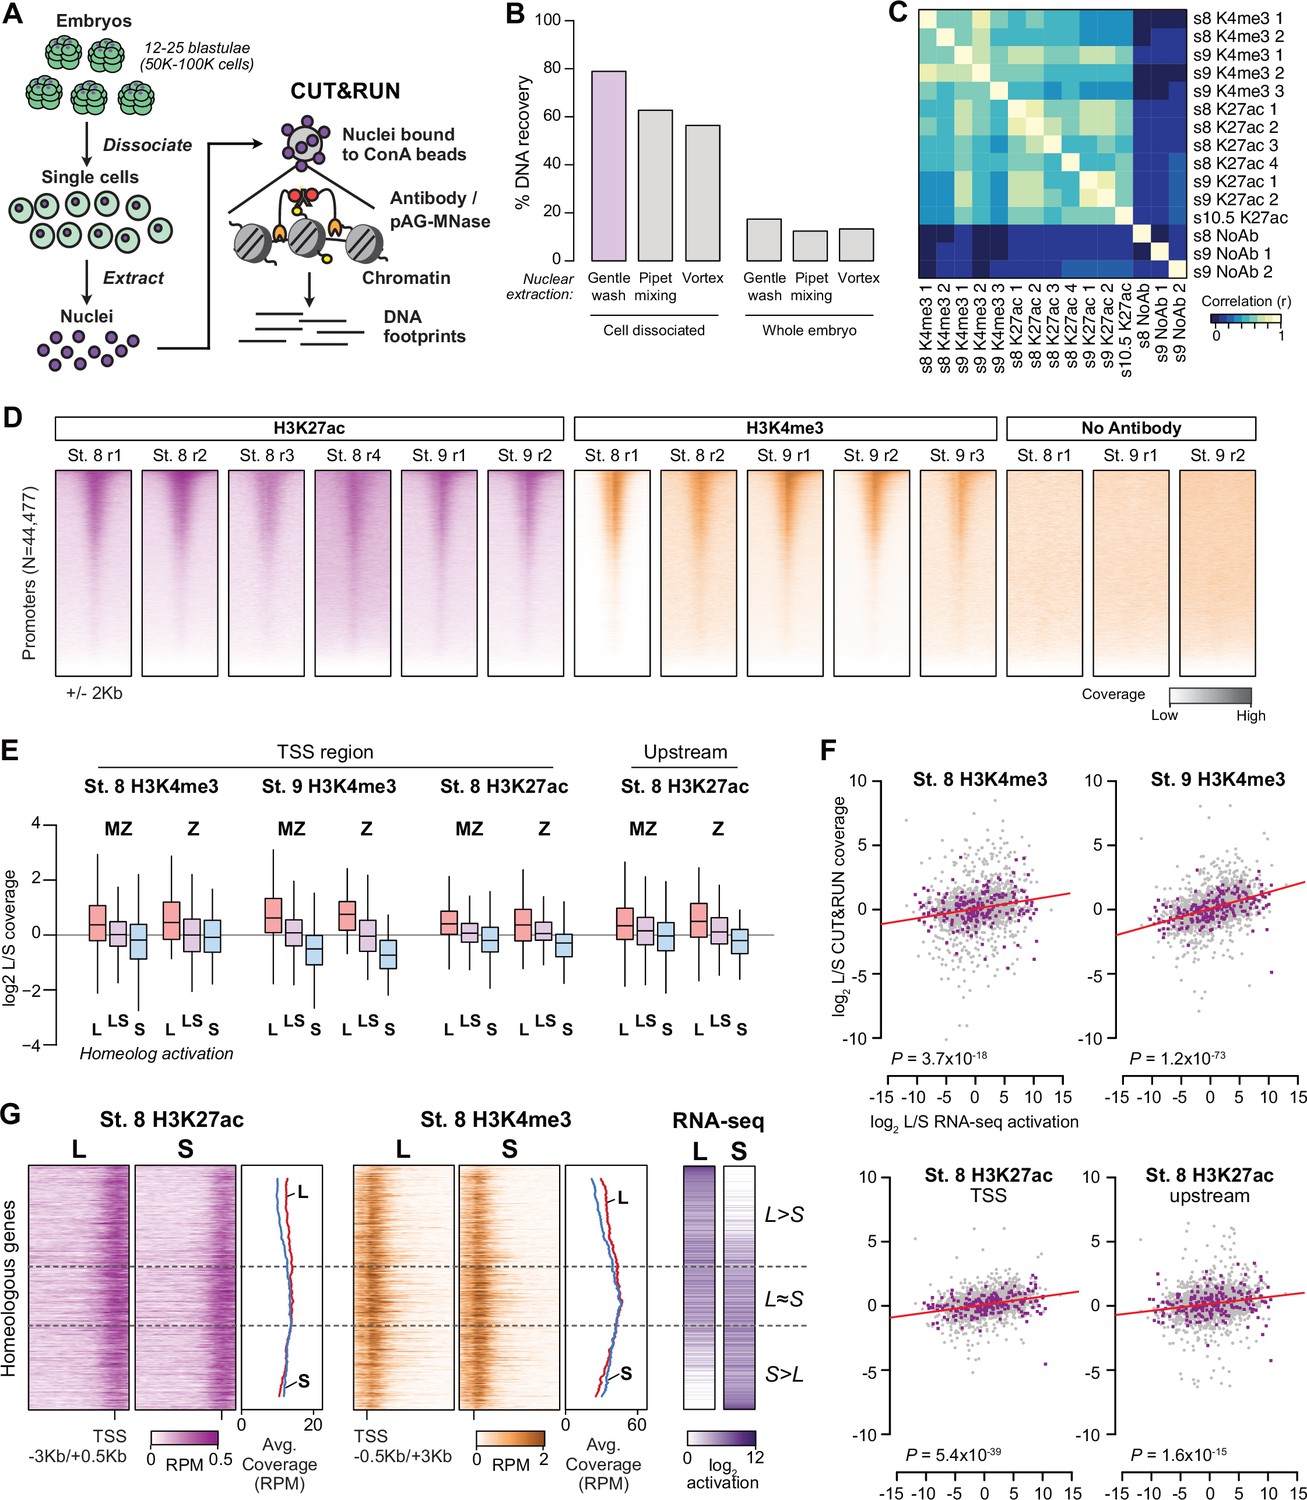
Profiling homeologous regulatory elements.
(A) CUT&RUN for X. laevis blastulae requires cell dissociation prior to nuclear extraction. (B) Comparison of different nuclear extraction techniques. Percent DNA recovered was estimated by NanoDrop quantification of phenol-chloroform extracted DNA after nuclear extraction, as a percentage of theoretical total nuclear DNA mass based on the length of the reference genome sequence. Three nuclear extraction methods were tested with and without cell dissociation: gentle washing by pipeting buffer on the surface of the cells, pipet mixing, vortexing at 1500 rpm. (C) Heatmap of pairwise sample correlation between CUT&RUN samples, as measured by log2 coverage in a 1 Kb window around the center of ATAC-seq open regions (N=58223). (D) Heatmaps showing CUT&RUN coverage over transcription start sites for all samples. (E) Boxplots as in Figure 3B showing CUT&RUN log2 coverage L/S on genes in which only one homeolog is activated at stage 9 (L, S) or both activated (LS), stratified into maternal-zygotic genes (MZ) with >1 TPM maternal contribution (N = 547, 889, 398 for L, LS, and S respectively), and strictly zygotic genes (Z) (N = 46, 126, 35 for L, LS, and S respectively). Two-way ANOVA for each of the four sets indicates there is no significant interaction between MZ/Z and homeolog activation pattern (p=0.37–0.91). (F) Biplots comparing log2 L versus S RNA-seq activation ratio (x axis) and log2 L versus S CUT&RUN read coverage. Linear regression lines are overlaid in red; each has positive slope. p Values are from two-sided Pearson’s correlation tests. (G) CUT&RUN coverage over paired homeologous gene regions around the TSS. Gene pairs are sorted according to L versus S RNA-seq activation ratio (right).
Figure 3—figure supplement 2

Enhancer prediction and homeologous region comparison.
(A) Heatmaps showing ATAC-seq peaks divided into predicted high-confidence enhancers with H3K27ac CUT&RUN enrichment in ≥3 of four individual replicates, lower-confidence enhancers with pooled H3K27ac CUT&RUN enrichment, and non-enhancers lacking H3K27ac enrichment. (B) Proportion of predicted homeologous enhancers that are flanked upstream and downstream by homeologous genes (at least one of the five nearest genes up/downstream). Only high-confidence enhancers that lift over to the other subgenome were considered. (C) Heatmaps of later-stage ATAC-seq (Esmaeili et al., 2020) and H3K27ac CUT&RUN coverage (this study) plotted over predicted enhancers and homeologous regions. (D) Similar to Figure 3C, maps comparing all (high and lower confidence) predicted enhancer density near homeologous TSSs (middle). Differential predicted enhancers are active in only one subgenome, conserved predicted enhancers are active in both. Average densities are plotted to the right of each paired map. Gene pairs are sorted according to L versus S subgenome RNA-seq activation ratio (right). Differential predicted enhancer density correlates with differential homeolog RNA-seq expression (p=1.0 × 10⁻³⁰, Pearson’s correlation test), while conserved predicted enhancer density does not (p=0.06). (E) Maternal (stage 5) RNA-seq levels for L and S sequence-specific transcription factors, as annotated by Gene Ontology. pou5f3.3 and sox3 are the top expressed transcription factors for both L and S. pou5f3.2 is also maternally contributed at lower levels. pou5f3.1 is not maternal.
Figure 4 with 2 supplements
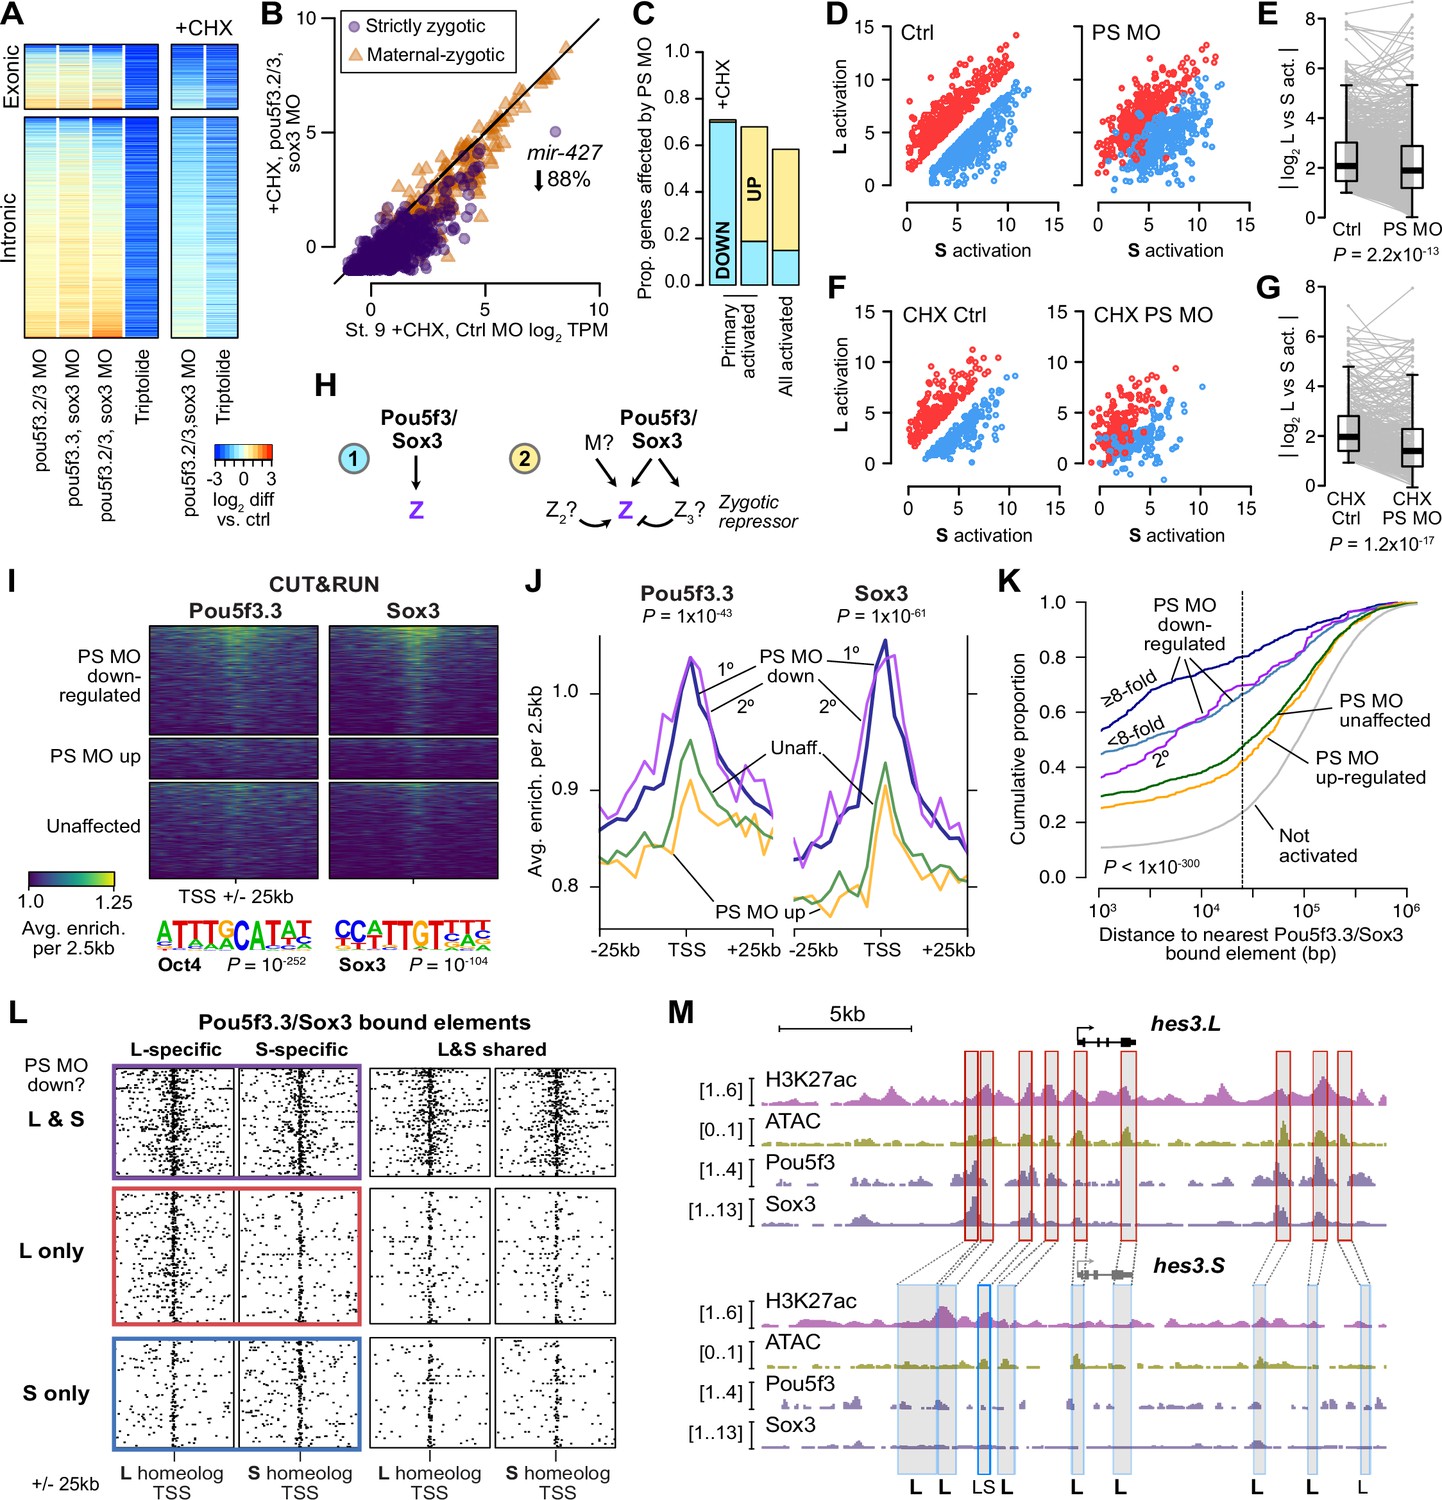
Pou5f3.3 and Sox3 binding drives genome activation.
(A) Heatmap showing log2 fold activation differences for exonic and intronic regions of primary-activated genes for combinations of pou5f3.2, pou5f3.3, and sox3 morpholino-treatments, or Triptolide treatment, compared to controls. Right panel is in the presence of cycloheximide (CHX). (B) Biplot comparing exonic expression levels in cycloheximide-treated control embryos versus embryos also injected with pou5f3.2, pou5f3.3, and sox3 morpholinos. Primary-activated genes with maternal contribution <1 TPM (strictly zygotic) are purple circles, maternal-zygotic genes detected by exonic increases are orange triangles. TPM = transcripts per million. (C) Barplot summarizing the proportion of genes affected by morpholino treatment with cycloheximide on primary-activated genes (left bar), without cycloheximide (middle bar), and all stage 9 activated genes without cycloheximide (right bar). Down = significantly decreased in one of the morpholino treatments, up = significantly increased. (D, F) Biplots showing genes with >2 fold L or S biased activation (upper red and lower blue points, respectively) in control embryos (left panel) versus their activation in pou5f3.2, pou5f3.3, and sox3 morpholino-treated embryos (right panel, maintaining the same color per gene). (E, G) Quantification of the biplots in (D, F) in before-and-after plots. Y-axis is the absolute value of the log2 L vs S activation difference. p Values are from Wilcoxon signed-rank tests (paired). Overlaid boxplots show median, upper and lower quartiles, and 1.5 x interquartile range. (H) Regulatory networks consistent with direct regulation of embryonic gene activation by Pou5f3 and Sox3 (1) versus additional regulation by zygotic factors (2), which likely accounts for genes up-regulated in MO treatments. (I) Stage 8 Pou5f3.3 (left) and Sox3 (right) CUT&RUN coverage near TSSs for genes down-regulated in morpholino-treated embryos with or without cycloheximide (top), genes up-regulated (middle), and genes not significantly affected in any morpholino treatment (bottom). Top enriched motifs for each factor are shown below with p-values from Homer de novo discovery. (J) Aggregate plots of the binding signal in (I), with down-regulated genes further separated into genes down-regulated with morpholino treatment and cycloheximide (1°) or only down-regulated without cycloheximide (2°). p Values are from Kruskal-Wallis tests on summed signal per TSS. (K) Cumulative distributions of distance from a Pou5f3/Sox3-bound regulatory element for genes strongly (≥8 fold) and less strongly (<8 fold) down-regulated in morpholino-treated embryos with or without cycloheximide, compared to up-regulated, unaffected and unactivated genes. p Value is from a Kruskal-Wallis test. (L) Maps showing density of Pou5f3/Sox3-bound regulatory elements around paired homeologous TSSs, divided into elements with differential homeologous L & S binding (left panels) versus both bound (right panels). TSSs are grouped according to L versus S homeolog sensitivity to morpholino treatment. (M) Browser tracks showing CUT&RUN enrichment and ATAC-seq coverage near active homeolog hes3.L and inactive homeolog hes3.S. Seven L-specific high-confidence regulatory regions are highlighted with their homeologous S regions (bold ‘L’), as well as two lower-confidence enhancers, one of which also has weak activity in S, but minimal Pou5f3 or Sox3 binding (labeled ‘LS’).
Figure 4—figure supplement 1

Assessing Pou5f3 and Sox3 roles in genome activation.
(A) Embryos injected with 40 ng of each pou5f3.2, pou5f3.3, and sox3 morpholinos have gastrulation defects compared to stage 10.5 control embryos, and fail to close the blastopore. Embryos injected with two of the three morpholinos plus 40 ng of gfp morpholino also had developmental delays, with one of two batches of pou5f3.2+pou5f3.3 morpholino embryos also failing to close the blastopore. Stage 12 phenotype counts are summed over two different rounds of injections on different days. Scale bar = 0.5 mm. (B) Heatmap showing RNA-seq intron log2 fold difference compared to control for exonic and intronic signal, with individual replicates shown. The left columns are for morpholino treatments without cycloheximide, right columns with cycloheximide comared against a cycloheximide control. Triptolide samples are shown for comparison. All samples are from embryos collected when untreated wild-type controls were at stage 9. (C) Heatmap for two morpholino samples that likely had problems with the cycloheximide treatment, based on the RNA-seq patterns. These samples are excluded from subsequent analyses. (D–F) Biplots comparing exonic expression levels in cycloheximide-treated control embryos versus embryos with deficient genome activation. Primary-activated genes with minimal maternal contribution (strictly zygotic) are purple circles, maternal-zygotic genes detected by exonic increases are orange triangles. TPM = transcripts per million. (G–I) Venn diagrams showing overlap of significantly different genes in the morpholino treatments. (J) Proportions of genes classified as significantly up-regulated in morpholino treatments detected by intronic levels. (K) log2 fold difference RNA-seq expression of pou5f3.2+pou5f3.3+sox3 morpholino treated embryos over control for different groups of genes, according to whether they were classified as significantly up-regulated in various morpholino combinations. Although some gene groups achieve significance in the double but not triple morpholino conditions, all gene groups significantly up in at least one treatment nonetheless have elevated expression in the triple morpholino conditions. Center line, median; box limits, upper and lower quartiles; whiskers, 1.5x interquartile range; points, outliers. N = 60, 778, 210, 102, 140, 215, 553, left to right. (L) Proportions of morpholino-affected genes (no cycloheximide) stratified into strictly zygotic genes (Z, maternal contribution <1 TPM) versus maternal-zygotic genes and whether wild-type activation is only in the stage 9 blastula or also observed in differentiated lineages (left, middle). Strictly zygotic genes overall are significantly more likely to be down-regulated by morpholino treatment (p=6.6 × 10⁻¹⁸, χ-squared test, 3 d.o.f.), and this is a stronger effect in blastula-specific genes compared to genes also up-expressed in differentiated lineages (p=2.0 × 10⁻³⁴, χ-squared test, 6 d.o.f.). (Right) proportions are not significantly different when comparing in which lineages those genes are further expressed (p=0.11, χ-squared test, 6 d.o.f.). (M) Proportions of genes affected by morpholino treatment in the presence of cycloheximide, according to their homeolog expression patterns. Strictly zygotic genes encoded in both subgenomes are more likely to depend on Pou5f3 and Sox3 for their primary activation than singleton genes, regardless of the patterns of homeolog activation (p=0.0020, χ-squared test, 5 d.o.f.). Maternal-zygotic genes have a subtler trend. (M) Proportions of genes affected by morpholino treatment without cycloheximide, according to their homeolog expression patterns. Genes expressed only on the S homeolog, particularly S singletons, are somewhat less likely to be regulated by Pou5f3 and Sox3 (p=3.4 × 10⁻⁵, χ-squared test, 10 d.o.f.), though only among maternal-zygotic genes.
Figure 4—figure supplement 2

Pou5f3 and Sox3 CUT&RUN.
(A) Heatmaps of Pou5f3.3 and Sox3 CUT&RUN coverage over MACS2 and SEACR predicted peaks, in each of the replicates and no-antibody samples. (B) Heatmaps of enrichment over no antibody (NoAb) at the union of peaks per method for pooled Pou5f3 and Sox3 CUT&RUN samples. Pou5f3 enrichment is observed across many of the Sox3 peaks, suggesting that both methods are under-calling Pou5f3 peaks. (C) Venn diagrams showing peak overlap between factors for MACS2 and SEACR. (D) Venn diagrams showing peak overlap between methods. (E) Top enriched motif for Homer de novo motif finding among the top 1000 MACS2 peaks for Pou5f3 (left) and Sox3 (middle) compared to the closest database match. The Pou5f3-Sox3 dimer motif (right) was predicted using a subset of Pou5f3 and Sox3 peaks with adjacent motif locations. (F) Table of occurrence of Homer database Oct4, Sox3, and Oct4-Sox2 dimer motifs among the peaks. The range indicates proportion of highly-centralized motifs (+/-50 bp from the summit) versus in a wider window (+/-100 bp). Dimer proportions are conservative and additionally require matches to each of the monomer Oct4 and Sox3 motifs in the peak, which reduces the proportions by 3–6 fold; thus, these may be underestimates of heterodimer binding, which may be better able to bind adjacent weak-affinity sites compared to the individual factors alone. The background regions are ATAC-seq open regions lacking H3K27ac enrichment (N=5413). (G) Cumulative distributions of distance from a Pou5f3-bound (left) or Sox3-bound (right) regulatory element. Curves represent gene groups according to the degree that they are affected by pou5f3.3/sox3 morpholino treatment. P values are from Kruskal-Wallis tests. (H) Maps showing density of Pou5f3-bound (left) and Sox3-bound (right) regulatory elements around paired homeologous TSSs, divided into elements with differential homeologous L&S binding (i.e. one bound, the other not) versus both L & S homeologous region bound. TSSs are grouped according to whether both L & S homeologs are down-regulated by pou5f3.3/sox3 morpholino treatment, or only one or the other homeolog is down regulated. For Pou5f3, p=2.2 × 10⁻⁸, Kruskal-Wallis test for L-S differential bound enhancer count difference among the three gene groups; for Sox3, p=2.9 × 10⁻¹⁰. For both-bound enhancers, p=0.09 for Pou5f3, p=0.17 for Sox3. (I) Heatmaps showing Pou5f3 and Sox3 CUT&RUN binding enrichment over no-antibody control, plotted over homeologous enhancers as previously defined by ATAC-seq and H3K27ac.
Figure 5 with 1 supplement
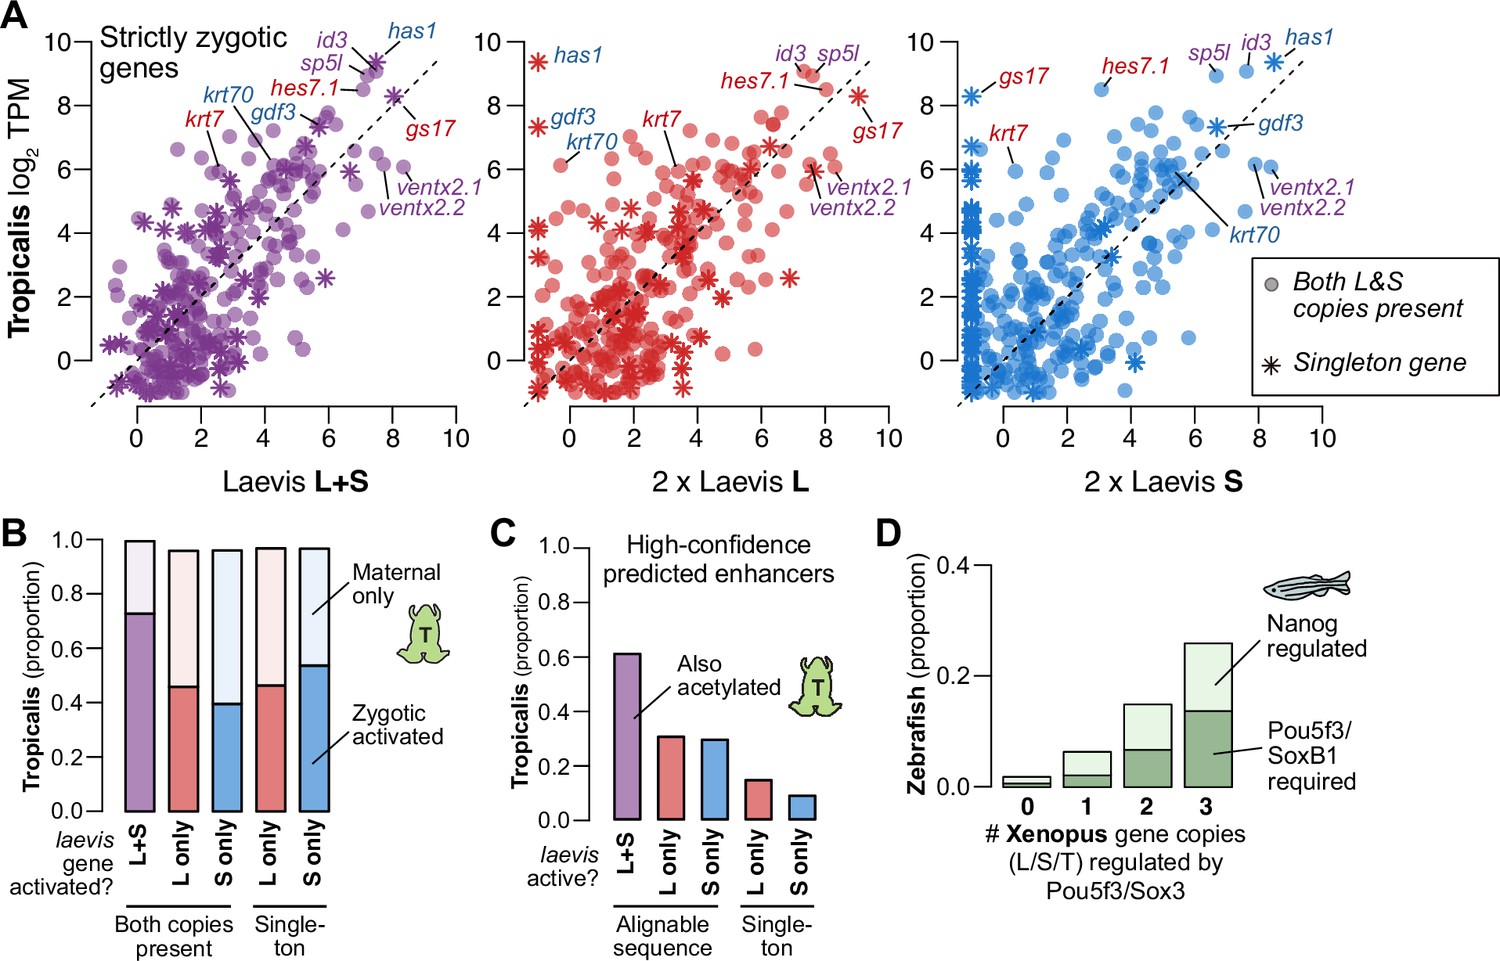
Regulatory divergence underlies dosage maintenance.
(A) Biplots comparing relative expression levels of activated genes in X. laevis and X. tropicalis, treating L and S homeolog contributions separately (middle, right) or summed (left). Individual subgenome expression is scaled 2 x, since transcript per million (TPM) normalization is calculated relative to the entire X. laevis transcriptome. Individual labeled genes are color coded according to the dominant expressed homeolog (red = L, blue = S, purple = equivalent). (B) Barplots showing the proportion of X. laevis genes across homeolog activation categories whose orthologs are also activated in X. tropicalis or part of the maternal contribution. (C) Barplots showing the proportion of X. laevis enhancers across homeolog activity categories that are acetylated in X. tropicalis. (D) Barplots showing the proportion of Xenopus genes whose orthologs are regulated by Pou5f3/SoxB1 and Nanog in zebrafish. Xenopus genes are classified according to how many homeo/orthologs are regulated by Pou5f3/Sox3. Genes with conserved regulation in both X. laevis homeologs and X. tropicalis are more likely to be regulated by Pou5f3/SoxB1 in zebrafish, but also more likely to be regulated by Nanog.
Figure 5—figure supplement 1

Shared patterns of activation with other taxa.
(A) Biplots of RNA-seq expression of X. laevis versus X. tropicalis stage 9 wild-type transcriptomes, with Z-normalized expression values; the result is similar to plotting TPM directly as shown in Figure 5A. Left plot sums L+S homeolog TPM expression per gene prior to Z-normalization, middle and right plots quantify only L or S homeolog expression, respectively. Colored points correspond to strictly zygotic genes as plotted in Figure 5A. (B) Comparison of residuals per gene (laevis minus tropicalis Z-normalized expression values), i.e. deviation from X. tropicalis, for the full L+S transcriptome versus counting expression from only one subgenome. Points below the y=x diagonal are genes whose tropicalis expression is a better predictor for laevis L+S expression compared to single homeolog expression. P values are from Wilcoxon signed-rank tests comparing residuals. (C) Similar to Figure 5A, but plotting activated genes with a maternal contribution ≥1 TPM. The maternal contribution buffers the differences for many genes. Spearman’s ρ correlations are shown. (D) Barplots showing the proportion of Pou5f3/Sox3-regulated X. laevis genes also regulated by Pou5f3/Sox3 in X. tropicalis according to Gentsch et al. X. tropicalis is more likely to have concordant regulation in genes where both homeologs are regulated by Pou5f3 and Sox3 (p=8.9 × 10⁻¹¹ for X. laevis down genes, p=0.002 for up genes, p=1.7 × 10⁻⁶ for genes with primary activation defects in Pou5f3/Sox3 loss, χ-squared tests, 8 d.o.f.). (E) Similar to Figure 4C: barplots showing the proportion of X. laevis predicted enhancers (left) and high-confidence predicted enhancers (right) across activity categories that are acetylated in X. tropicalis, additionally showing the proportion of enhancers that lift over but are not acetylated in X. tropicalis. Among successfully lifted-over enhancers, enhancers with conserved activity between L & S are highly more likely to have acetylation in X. tropicalis (p<1 × 10–300 for all enhancers, p=1.5 × 10–76 for higher-confidence enhancers, χ-squared tests, 4 d.o.f). (F) Barplots showing the proportion of X. laevis genes in different homeolog activation categories whose orthologs are also activated in zebrafish as part of the first wave by maternal factors, activated by 6 h.p.f., or part of the maternal contribution. Both-activated homeologs are more likely to also be activated and directly by maternal factors (primary activation) in zebrafish (p=2.6 × 10⁻¹¹, χ-squared test, 12 d.o.f.). (G) Barplots showing the proportion of Pou5f3/Sox3-regulated X. laevis genes also regulated by Nanog/Pou5f3/Sox3 in zebrafish according to Lee et al., 2013. Both-regulated homeologs are more likely to also be regulated by maternal pluripotency factors Nanog, Pou5f3, SoxB1 in zebrafish (p=2.1 × 10⁻¹⁵, χ-squared test, 4 d.o.f.). Overall proportions are higher for X. laevis genes whose primary activation depends on Pou5f3 and Sox3 (right), but there is no significant difference between homeolog expression patterns (p=0.16, χ-squared test, 4 d.o.f.). (H) Barplots showing the proportion of enhancers that lift over and are acetylated in zebrafish according to Bogdanovic et al., 2012. L+S conserved enhancers have low conservation with zebrafish, but significantly higher proportion than L- or S-only enhancers (p=2.8 × 10–58 for all enhancers, p=5.0 × 10⁻⁴ for higher confidence enhancers, χ-squared tests, 4 d.o.f.).
Figure 6
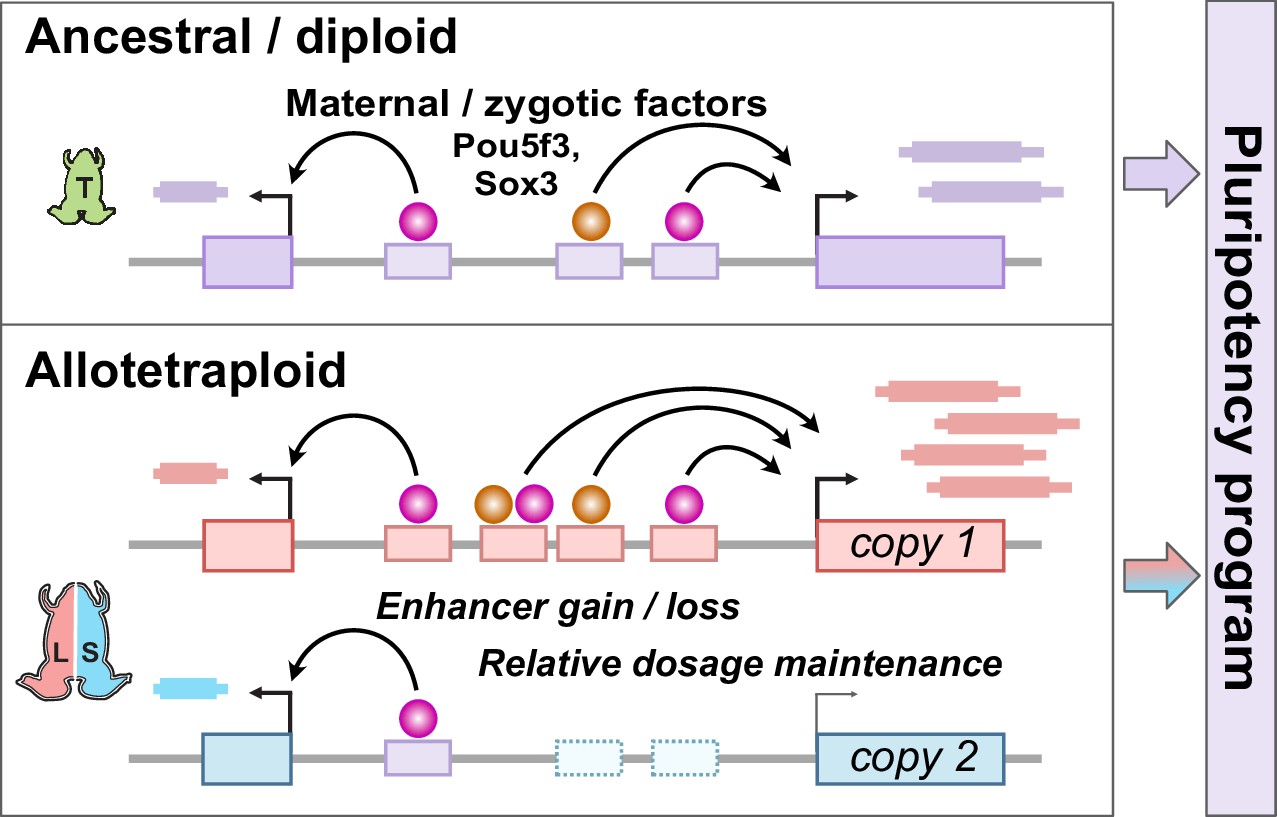
Model for pluripotency network evolution.
X. laevis likely underwent extensive enhancer turnover between its two subgenomes, which nonetheless maintained stoichiometry of pluripotency reprogramming in the early embryo.
Tables
Appendix 1—key resources table
| Reagent type (species) or resource | Designation | Source or reference | Identifiers | Additional information |
|---|---|---|---|---|
| Strain, strain background (Xenopus laevis) | Nasco wildtype | eNasco | Research Resource #NXR_0.0031 | |
| Antibody | Anti-H3K4me3 recombinant (rabbit polyclonal) | Invitrogen | Cat #711958 RRID #AB_2848246 | CUT&RUN (1:100) |
| Antibody | Anti-H3K4me3 recombinant (rabbit monoclonal) | Millipore | Cat #05–745 R RRID # AB_1587134 | CUT&RUN (1:100) |
| Antibody | Anti-H3K27ac recombinant (rabbit polyclonal) | Active Motif | Cat #39135 RRID #AB_2614979 | CUT&RUN (1:100) |
| Antibody | Anti-V5 (mouse monoclonal) | Invitrogen | Cat #R960-25 RRID #2556564 | CUT&RUN (1:100) |
| Chemical compound, drug | Isethionic acid | Sigma Aldrich | Cat #220078 | |
| Chemical compound, drug | Triptolide | Apexbio | Cat #50-101-1030 | |
| Chemical compound, drug | Cycloheximide | Sigma Aldrich | Cat #01810 | |
| Gene (Xenopus laevis) | pou5f3.3.L | RefSeq | NM_001088114.1 | Homeolog used for TF CUT&RUN |
| Gene (Xenopus laevis) | sox3.S | RefSeq | NM_001090679.1 | Homeolog used for TF CUT&RUN |
| Sequence-based reagent | X. laevis rRNA depletion oligomers | Phelps et al., 2021 | DOI: 10.1093/nar/gkaa1072 | |
| Recombinant DNA reagent | Tn5 (plasmid) | Addgene | Cat #112112 | |
| Recombinant DNA reagent | pA/G-MNase (plasmid) | Addgene | Cat #123461 | Purified enzyme gift from S. Hainer |
| Sequence-based reagent | Tn5ME-A | Picelli et al., 2014 | DOI: 10.1101/gr.177881.114 | |
| Sequence-based reagent | Tn5ME-B | Picelli et al., 2014 | DOI: 10.1101/gr.177881.114 | |
| Sequence-based reagent | Tn5MErev | Picelli et al., 2014 | DOI: 10.1101/gr.177881.114 | |
| Sequence-based reagent | Pou5f3.3 morpholino | GeneTools/Morrison and Brickman, 2006 | DOI: 10.1242/dev.02362 | Targets both homeologs; GTACAATATGGGCTGGTCCATCTCC |
| Sequence-based reagent | Sox3 morpholino | GeneTools/Zhang et al., 2003 | DOI: 10.1242/dev.00798 | Targets both homeologs; AACATGCTATACATTTGGAGCTTCA |
| Sequence-based reagent | Pou5f3.2 morpholino | Genetools/Takebayashi-Suzuki et al., 2007 | DOI: 10.1016 /j.mod.2007.09.005 | Targets both homeologs; AGGGCTGTTGGCTGTACATGGTGTC |
| Sequence-based reagent | GFP control morpholino | Genetools | ACAGCTCCTCGCCCTTGCTCACCAT | |
| Sequence-based reagent | Hi-Fi F primer for Pou5f3.3.L ORF | This paper | GGACAGCACGGGAGGCGGGGGATCCGACCAGCCCATATTGTACAGCCAAAC | |
| Sequence-based reagent | Hi-Fi R primer for Pou5f3.3.L ORF | This paper | TATCATGTCTGGATCTACGTCTAGATCAGCCGGTCAGGACCCC | |
| Sequence-based reagent | F primer for Sox3.S ORF | This paper | aaaggatccTATAGCATGTTGGACACCGACATCA | |
| Sequence-based reagent | R primer for Sox3.S ORF | This paper | aaatctagaTTATATGTGAGTGAGCGGTACCGTG | |
| Commercial assay, kit | Ultra II RNA library build kit | NEB | Cat #E7760 | |
| Commercial assay, kit | Ultra II DNA library build kit | NEB | Cat #E7645 | |
| Commercial assay, kit | RNA Clean and Concentrator-5 | Zymo | Cat #R1013 | |
| Software, algorithm | Bowtie2 | Langmead and Salzberg, 2012; http://bowtie-bio.sourceforge.net/bowtie2 | DOI: 10.1038/nmeth.1923 | v2.4.2 |
| Software, algorithm | Hisat2 | Kim et al., 2015; http://daehwankimlab.github.io/hisat2/ | DOI: 10.1038/nmeth.3317 | v2.0.5 |
| Software, algorithm | featureCounts | Liao et al., 2014; https://subread.sourceforge.net/ | DOI: 10.1093/bioinformatics/btt656 | v2.0.1 |
| Software, algorithm | SEACR | Meers et al., 2019; https://github.com/FredHutch/SEACR | DOI: 10.1186 /s13072-019-0287-4 | v1.3 |
| Software, algorithm | MACS2 | Zhang et al., 2008; https://github.com/taoliu/MACS | DOI: 10.1186 /gb-2008-9-9-r137 | v2.2.7.1 |
| Software, algorithm | BEDtools | Quinlan and Hall, 2010; https://bedtools.readthedocs.io/en/latest/ | DOI: 10.1093/bioinformatics/btq033 | v2.30.0 |
| Software, algorithm | DESeq2 | Love et al., 2014; https://bioconductor.org/packages/release/bioc/html/DESeq2.html | DOI: 10.1186 /s13059-014-0550-8 | v4.0.3 |
| Software, algorithm | LiftOver | Kent et al., 2002; https://hgdownload.soe.ucsc.edu/downloads.html#utilities_downloads | DOI: 10.1101/gr.229102 | |
| Software, algorithm | BLAT | Kent et al., 2002; https://hgdownload.soe.ucsc.edu/downloads.html#utilities_downloads | DOI: 10.1101/gr.229102 | |
| Software, algorithm | Blast | Camacho et al., 2009; https://blast.ncbi.nlm.nih.gov/doc/blast-help/downloadblastdata.html | DOI: 10.1186/1471-2105-10-421 | v2.11.0+ |
| Software, algorithm | Samtools | Li et al., 2009; http://www.htslib.org | DOI: 10.1093/bioinformatics/btp352 | v1.12 |
| Software, algorithm | deeptools | Ramírez et al., 2014; https://github.com/deeptools/deepTools | DOI: 10.1519/JSC.0b013e3182a1f44c | v3.5.1 |
| Software, algorithm | LastZ | Harris, 2007; https://github.com/lastz/lastz | v1.04.00 | |
| Software, algorithm | Homer | Heinz et al., 2010; http://homer.ucsd.edu/homer/download.html | DOI: 10.1016 /j.molcel.2010.05.004 | v4.11.1 |
| Software, algorithm | Paml | Yang, 1997; https://github.com/abacus-gene/paml | DOI: 10.1093/bioinformatics/13.5.555 | v4.9f |
| Software, algorithm | pal2nal | Suyama et al., 2006; http://www.bork.embl.de/pal2nal/ | DOI: 10.1093/nar/gkl315 | v14 |
| Software, algorithm | EMBOSS needle | Rice et al., 2000; https://emboss.sourceforge.net/download/ | DOI: 10.1016 /s0168-9525(00)02024–2 | v6.6.0 |
| Software, algorithm | R | R core team, 2013; https://www.r-project.org | v4.0.4 | |
| Software, algorithm | Trim_galore | Martin, 2011; https://github.com/FelixKrueger/TrimGalore | DOI: 10.14806/ej.17.1.200 | v0.6.6 |
| Software, algorithm | Cutadapt | Martin, 2011; https://github.com/marcelm/cutadapt | DOI: 10.14806/ej.17.1.200 | v1.15 |
| Other | X. laevis genome | Xenbase; https://www.xenbase.org/xenbase/static-xenbase/ftpDatafiles.jsp | X. laevis v9.2 genome assembly | Genomic resource. v9.2 |
| Other | X. laevis genome | Xenbase; https://www.xenbase.org/xenbase/static-xenbase/ftpDatafiles.jsp | X. laevis v10.1 genome assembly | Genomic resource. v10.1 |
| Other | X. laevis gene models | Xenbase; https://www.xenbase.org/xenbase/static-xenbase/ftpDatafiles.jsp | X. laevis v9.2 gene models | Genomic resource. v9.2 |
| Other | X. laevis gene models | Xenbase; https://www.xenbase.org/xenbase/static-xenbase/ftpDatafiles.jsp | X. laevis v10.1 gene models | Genomic resource. v10.1 |
| Other | X. laevis page IDs | Xenbase; https://www.xenbase.org/xenbase/static-xenbase/ftpDatafiles.jsp | X. laevis v7.1 page IDs | Genomic resource. v7.1 |
| Other | CUT&RUN for histone marks, ATAC-seq, RNA-seq in X. laevis | This study | GEO #GSE207027 | High-throughput sequencing data |
| Other | mir-427 gene model | miRBase; Kozomara et al., 2019 | MI0001449 and MI0038331 | High-throughput sequencing data |
| Other | X. laevis wildtype stage 5 RNA-seq | Phelps et al., 2021 | GEO #GSE152902 | High-throughput sequencing data. SRR12758941; SRR12758940 |
| Other | X. tropicalis wildtype RNA-seq | Owens et al., 2016 | GEO #GSE65785 | High-throughput sequencing data. SRR1795666; SRR1795634 |
| Other | X. tropicalis morpholino and amanitin affected genes | Gentsch et al., 2019 | GEO #GSE113186 | High-throughput sequencing data |
| Other | Zebrafish Pou/Sox/Nanog affected genes | Lee et al., 2013 | GEO #GSE47558 | High-throughput sequencing data |
| Other | X. tropicalis acetylated enhancers | Gupta et al., 2014 | GEO #GSE56000 | High-throughput sequencing data |
| Other | Zebrafish acetylated enhancers | Bogdanovic et al., 2012 | GEO #GSM915197 | High-throughput sequencing data |
| Other | Chains from X. laevis v2 to X. tropicalis v9 | UCSC genome browser | xenLae2ToXenTro9 | Genomic resource for liftover. 10% minimum sequence matching |
| Other | Chains from X. tropicalis v2 to X. tropicalis v7 | UCSC genome browser | xenTro2ToXenTro7 | Genomic resource for liftover. 90% minimum sequence matching |
| Other | Chains from X. tropicalis v7 to X. tropicalis v9 | UCSC genome browser | xenTro7ToXenTro9 | Genomic resource for liftover. 90% minimum sequence matching |
| Other | Chains from X. tropicalis v7 to zebrafish v10 | UCSC genome browser | xenTro7ToDanRer10 | Genomic resource for liftover. 10% minimum sequence matching |
| Other | Chains from zebrafish v10 to zebrafish v11 | UCSC genome browser | danRer10ToDanRer11 | Genomic resource for liftover. 90% minimum sequence matching |
Additional files
-
Supplementary file 1
RNA-seq expression values and DESeq2 comparisons.
- https://cdn.elifesciences.org/articles/83952/elife-83952-supp1-v2.xlsx
-
Supplementary file 2
Annotations and expression values for activated genes.
- https://cdn.elifesciences.org/articles/83952/elife-83952-supp2-v2.xlsx
-
Supplementary file 3
Transcription start site coordinates used for all genes.
- https://cdn.elifesciences.org/articles/83952/elife-83952-supp3-v2.xlsx
-
Supplementary file 4
Motif search results.
- https://cdn.elifesciences.org/articles/83952/elife-83952-supp4-v2.xlsx
-
Supplementary file 5
Enhancer annotations.
- https://cdn.elifesciences.org/articles/83952/elife-83952-supp5-v2.xlsx
-
Supplementary file 6
Comparative genomics with X. tropicalis and zebrafish.
- https://cdn.elifesciences.org/articles/83952/elife-83952-supp6-v2.xlsx
-
MDAR checklist
- https://cdn.elifesciences.org/articles/83952/elife-83952-mdarchecklist1-v2.docx
Download links
A two-part list of links to download the article, or parts of the article, in various formats.
Downloads (link to download the article as PDF)
Open citations (links to open the citations from this article in various online reference manager services)
Cite this article (links to download the citations from this article in formats compatible with various reference manager tools)
Hybridization led to a rewired pluripotency network in the allotetraploid Xenopus laevis
eLife 12:e83952.
https://doi.org/10.7554/eLife.83952


