Liver type 1 innate lymphoid cells lacking IL-7 receptor are a native killer cell subset fostered by parenchymal niches
- Laboratory of Immune Regulation, Department of Virus Research, Institute for Life and Medical Sciences, Kyoto University, Japan
- Graduate School of Medicine, Kyoto University, Japan
- Department of Human Health Sciences, Graduate School of Medicine, Kyoto University, Japan
- Life Science Center for Survival Dynamics, Tsukuba Advanced Research Alliance (TARA), University of Tsukuba, Japan
- Department of Immunology, Faculty of Medicine, University of Tsukuba, Japan
- R&D Center for Innovative Drug Discovery, University of Tsukuba, Japan
- Reproductive Engineering Team, Institute for Life and Medical Sciences, Kyoto University, Japan
- Graduate School of Biostudies, Kyoto University, Japan
- Center for Medical Science, Fujita Health University, Japan
- Laboratory of Immunology, Institute for Life and Medical Sciences, Kyoto University, Japan
- RIKEN Center for Integrative Medical Sciences, Japan
Figures
Figure 1 with 1 supplement
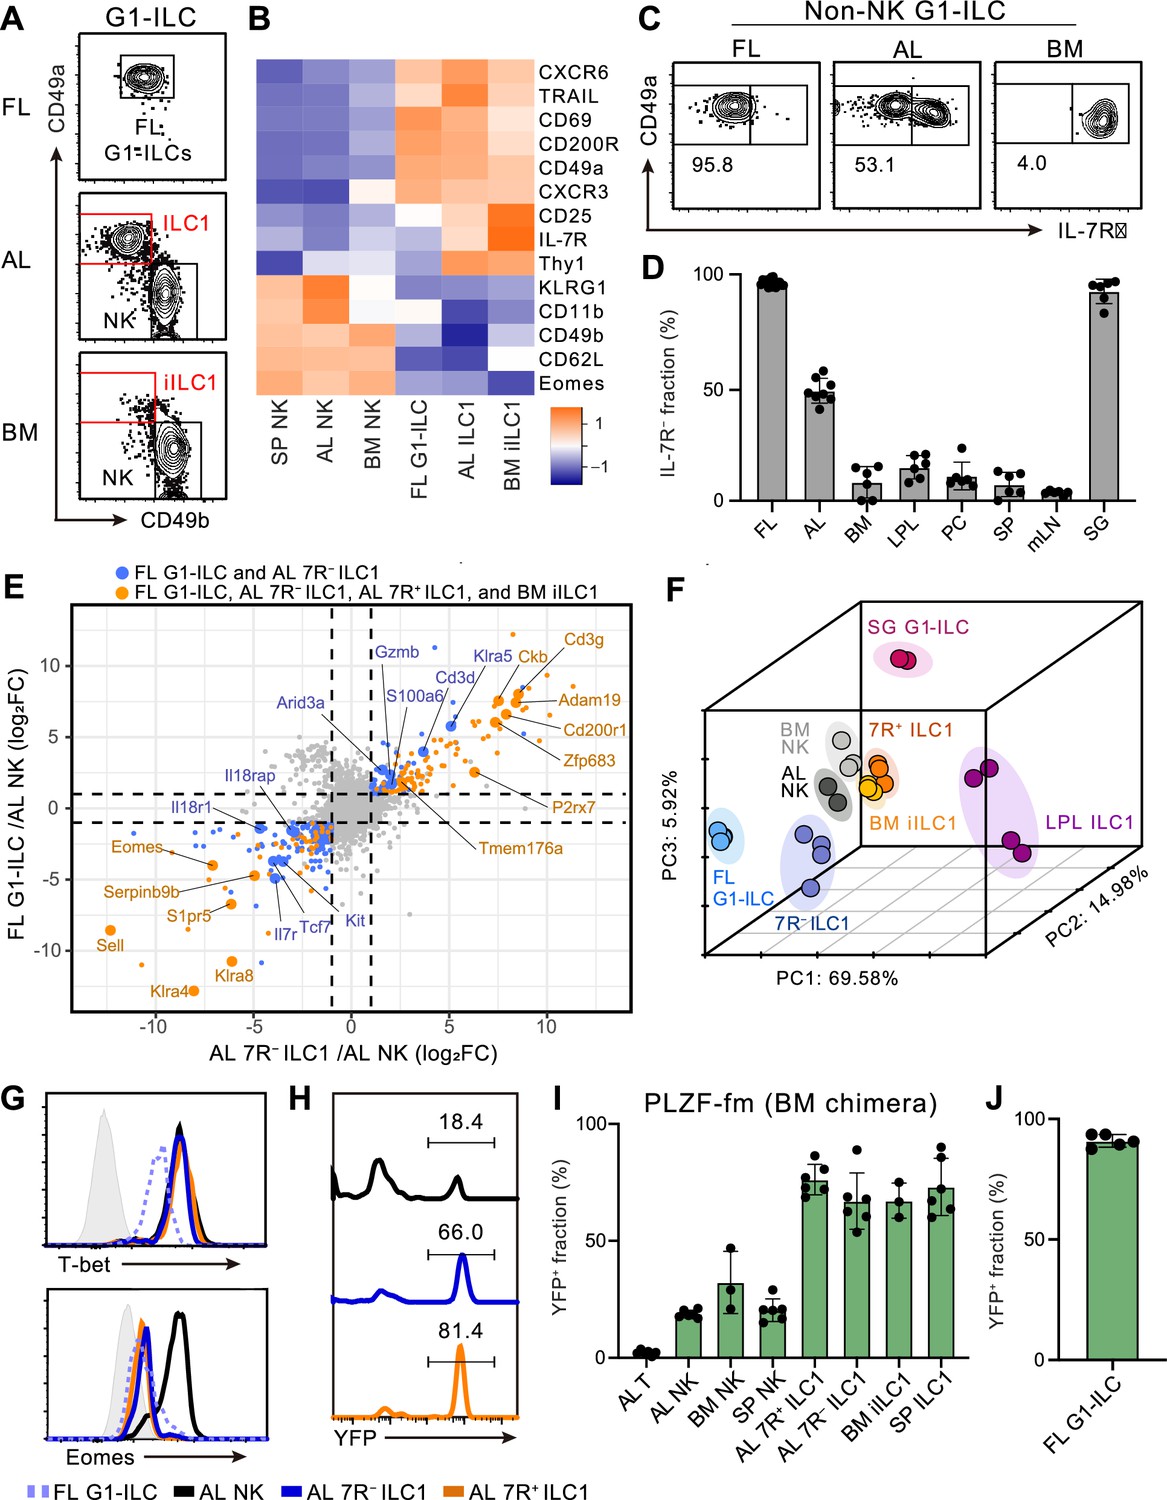
Fetal and adult liver contain bona fide ILC1s lacking IL-7R.
(A) Gating strategy of subpopulations of G1-ILCs (CD3−NK1.1+NKp46+) in the E18.5 fetal liver (FL), adult liver (AL), and bone marrow (BM). iILC1, immature ILC1. Data represent three independent experiments (FL, n=15; AL, n=8; BM, n=6). (B) Heatmap representing log2 transformed mean fluorescence intensity (MFI) of indicated protein expression normalized by z-score transformations (n=3 for all subsets). SP, spleen. (C) Expression of IL-7Rα on G1-ILCs except for CD49a−CD49b+ NK cells (non-NK G1-ILCs) in FL, AL, and BM. Data represent three independent experiments (FL, n=15; AL, n=8; BM, n=6). (D) The percentages of IL-7R− fractions in non-NK G1-ILCs in the indicated tissues. LPL, small intestinal lamina propria lymphocytes; PC, peritoneal cavity; mLN, mesenteric lymph node; SG, salivary gland. Data are pooled from three independent experiments (FL, n=15; AL, n=8; BM, n=6; LPL, n=6; PC, n=6; SP, n=6; mLN, n=6; SG, n=6). (E) Scatter plot showing relative gene expression of FL G1-ILCs and AL 7 R− ILC1s compared to AL NK cells in RNA-seq. Genes differentially expressed by FL G1-ILCs, AL 7 R− ILC1s, AL 7R+ ILC1s, and BM iILC1s (orange) or only by FL G1-ILCs and AL 7 R− ILC1s (blue) compared to AL NK cells are highlighted. FC, fold change. (F) First three principal components in PCA of top 3,000 variant genes. (G) Expression of T-bet (upper) and Eomes (lower) on FL G1-ILCs as well as NK cells, 7 R− ILC1s, and 7R+ ILC1s in AL. Shaded histograms (grey) indicate isotype controls. Data represent two independent experiments. (H and I) Fate-mapping analysis of adult chimeric mice reconstituted with BM YFP−Lin−Sca1+c-Kit+ (LSK) cells from PLZFGFPcre/+ Rosa26-YFP (PLZF-fm) mice. Representative histograms of YFP expression (H) and the percentages of YFP+ cells in indicated cell populations (I) are shown. Data represent or are pooled from two independent experiments (n=6 for AL T, AL NK, AL 7 R− ILC1, AL 7R+ ILC1, and SP ILC1; n=3 for BM NK and BM iILC1). (J) The percentage of YFP+ cells in FL G1-ILCs in E18.5 straight PLZF-fm mice. Data are from one experiment (n=5). RNA-seq data are from two (AL NK cells and SG G1-ILCs), three (AL 7R+ ILC1s, BM iILC1s, and BM NK cells), and four (FL G1-ILCs, AL 7 R− ILC1s, and LPL ILC1s) biological replicates (E and F). Data are presented as mean ± SD.
-
Figure 1—source data 1
Fetal and adult liver contain bona fide ILC1s lacking IL-7R.
- https://cdn.elifesciences.org/articles/84209/elife-84209-fig1-data1-v1.xlsx
Figure 1—figure supplement 1

Characterization of fetal and adult G1-ILC identities.
(A and B) Flow cytometry (FCM) analysis of AL lymphocytes in control or Il7−/− mice. Representative FCM profiles of G1-ILCs (A) and the cell number of each cell population (B) are shown. Data represent or are pooled from two independent experiments (WT, n=5; Il7−/−, n=5). (C) Normalized read counts of Eomes, Tbx21, Gata3, and Rorc expressed on each G1-ILC population in FL, AL, and BM obtained from RNA-seq. (D) Normalized read counts of Icos, Il2ra, and Kit expressed on each G1-ILC population. (E) Dot plots showing the significantly enriched pathways on DEGs less expressed in FL G1-ILCs and 7 R− ILC1s but not in 7R+ ILC1s and BM iILC1s compared to AL NK cells, analyzed by Metascape. Gene ratio indicates the ratio of the gene number corresponding to the DEGs in the pathway (gene count) to the total gene number in the pathway. Pathways related to cytokine responses were highlighted (blue). (F) Normalized read counts of Mki67 expressed on each G1-ILC population obtained from RNA-seq. (G) Expression of Ki-67 protein on FL G1-ILCs as well as NK cells, 7 R− ILC1s, and 7R+ ILC1s in AL. Data represent two independent experiments. (H) Representative histograms of YFP expression in AL lymphocyte populations of straight PLZFGFPcre/+ Rosa26-YFP (PLZF-fm) mice, Data represent one experiment (n=2 for all subsets). (I) Fate-mapping analysis of adult chimeric mice reconstituted with FL YFP− LSK cells from PLZF-fm mice. The percentages of YFP+ cells in indicated cell populations are shown. Data are from one experiment (n=3 for all subsets). RNA-seq data are from two (AL NK cells), three (AL 7R+ ILC1s, BM iILC1s, and BM NK cells), and four (FL G1-ILCs and AL 7 R− ILC1s) biological replicates (C–F). Data are presented as mean ± SD. *p<0.05, **p<0.01, ****p<0.0001.
Figure 2 with 1 supplement
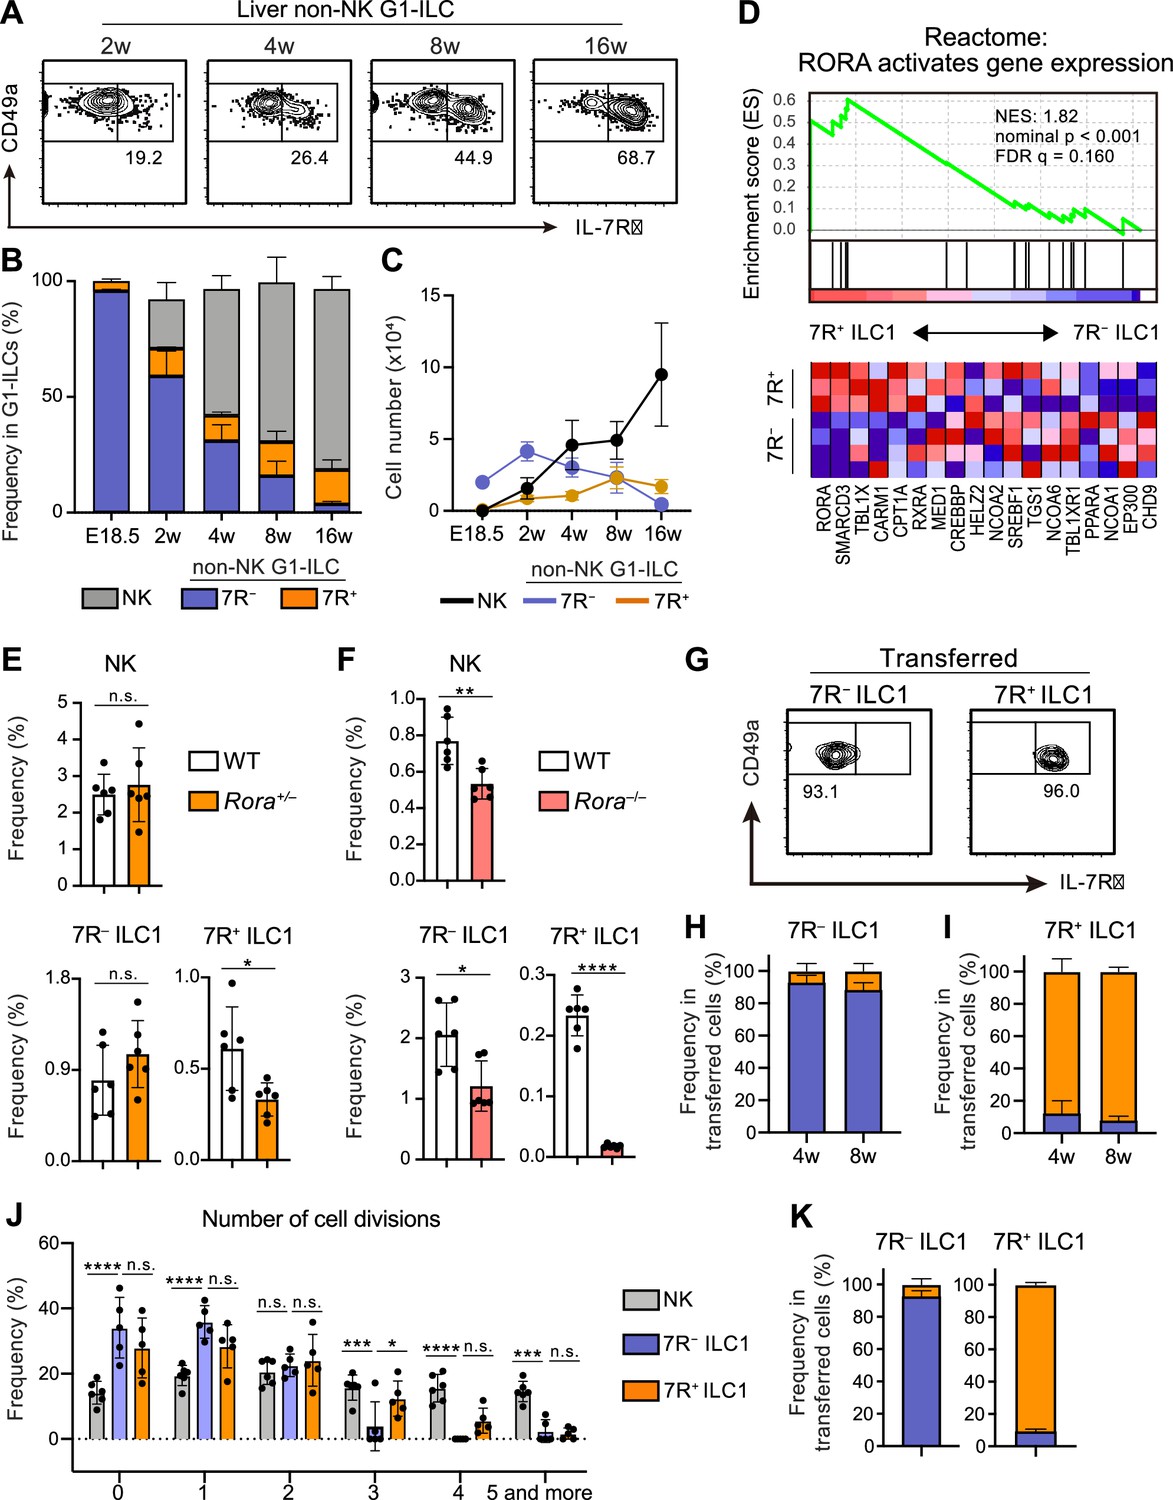
7R+ ILC1 s are dispensable for the development of 7 R− ILC1s in AL.
(A–C) Kinetics of IL-7Rα expression on liver non-NK G1-ILCs with age. Representative FCM profiles (A), the percentages within G1-ILCs (B), and the cell number (C) are shown. Data represent or are pooled from one (E18.5, n=6), two (2 w, n=5; 4 w, n=6; 8 w, n=9), and five (16 w, n=10) independent experiments. (D) GSEA of transcriptomes in 7R+ ILC1s compared to 7 R− ILC1s. Eighteen genes included in an indicated gene set from Reactome Pathway are shown. The lower heatmap shows relative gene expression levels in AL 7 R− and 7R+ ILC1s. (E) The percentages of AL G1-ILC populations in control or Rora+/− mice. Data are pooled from two independent experiments (WT, n=6; Rora+/−, n=6). (F) The percentages of AL G1-ILC populations in control or Rora−/− mice. Data are from one experiment (WT, n=6; Rora−/−, n=6). (G–I) Flow cytometric (FCM) analysis of transferred AL 7 R− and 7R+ ILC1s detected in the host liver at 4 weeks and 8 weeks post-transfer. Representative FCM profiles at 4 weeks post-transfer (G) and the percentages of the fate of transferred 7 R− ILC1s (H) and 7R+ ILC1s (I) are shown. Data represent or are pooled from two (7 R− ILC1 8 w, 7R+ ILC1 8w; n=3) and three (7 R− ILC1 4 w, n=6; 7R+ ILC1 4w; n=4) independent experiments. (J and K) Host mice received with CPD-eFluor 450-labeled 7 R− and 7R+ ILC1s are stimulated with i.p. injection of IL-15/IL-15Rα complex at days 1, 3, and 5. After 7 days, liver leukocytes of recipient mice were analyzed. Frequency of how many times each cell divides are calculated based on the FCM analysis of CPD-eFluor 450 dye dilution (J) (two independent experiments; n=6 for NK, n=5 for 7 R− ILC1 and 7R+ ILC1) and the percentages of the fate of transferred AL 7 R− ILC1s and 7R+ ILC1s (K) (two independent experiments; n=6 for 7 R− ILC1, n=5 for 7R+ ILC1) are shown. RNA-seq data are from three (AL 7R+ ILC1s) and four (AL 7 R− ILC1s) biological replicates (D). Data are presented as mean ± SD. *p<0.05, **p<0.01, ***p<0.001, ****p<0.0001.
-
Figure 2—source data 1
7R+ ILC1s are dispensable for the development of 7 R− ILC1s in AL.
- https://cdn.elifesciences.org/articles/84209/elife-84209-fig2-data1-v1.xlsx
Figure 2—figure supplement 1
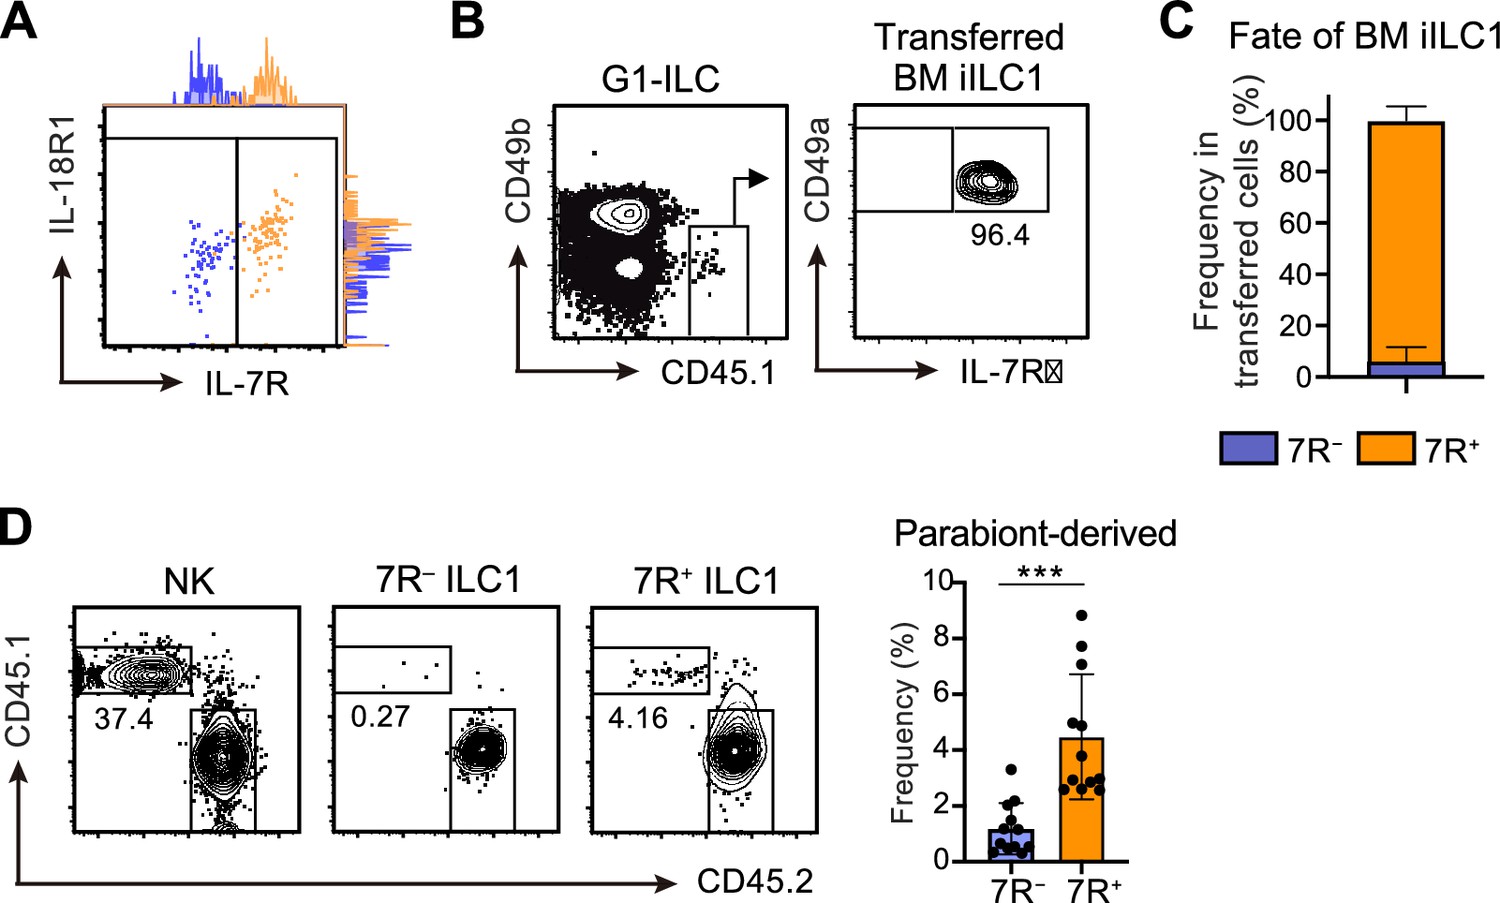
BM iILC1s have ability to give rise to AL 7R+ ILC1 s in vivo.
(A) Representative FCM profiles and adjunct histograms of IL-7R and IL-18R1 expressions on transferred AL 7 R− (blue) and 7R+ (orange) ILC1s detected in the host liver at 4 weeks post-transfer. Data represent two independent experiments (n=4 for 7 R− ILC1 and 7R+ ILC1). (B and C) FCM analysis of transferred BM iILC1s (CD45.1) detected in the host liver (CD45.2) at 4 weeks post-transfer. Representative FCM profiles (B) and the percentages of transferred cell fate (C) are shown. Data represent or are pooled from two independent experiments (n=6). (D) FCM analysis of AL G1-ILCs in CD45.2 WT mice conjoined with CD45.1 WT mice in parabiosis experiments. Representative FCM profiles and the percentages of parabiont-derived cells in AL 7 R− and 7R+ ILC1s are shown. Data represent or are pooled from four independent experiments (n=12 for 7 R− ILC1 and 7R+ ILC1). Data are presented as mean ± SD. ***p<0.001.
Figure 3 with 1 supplement
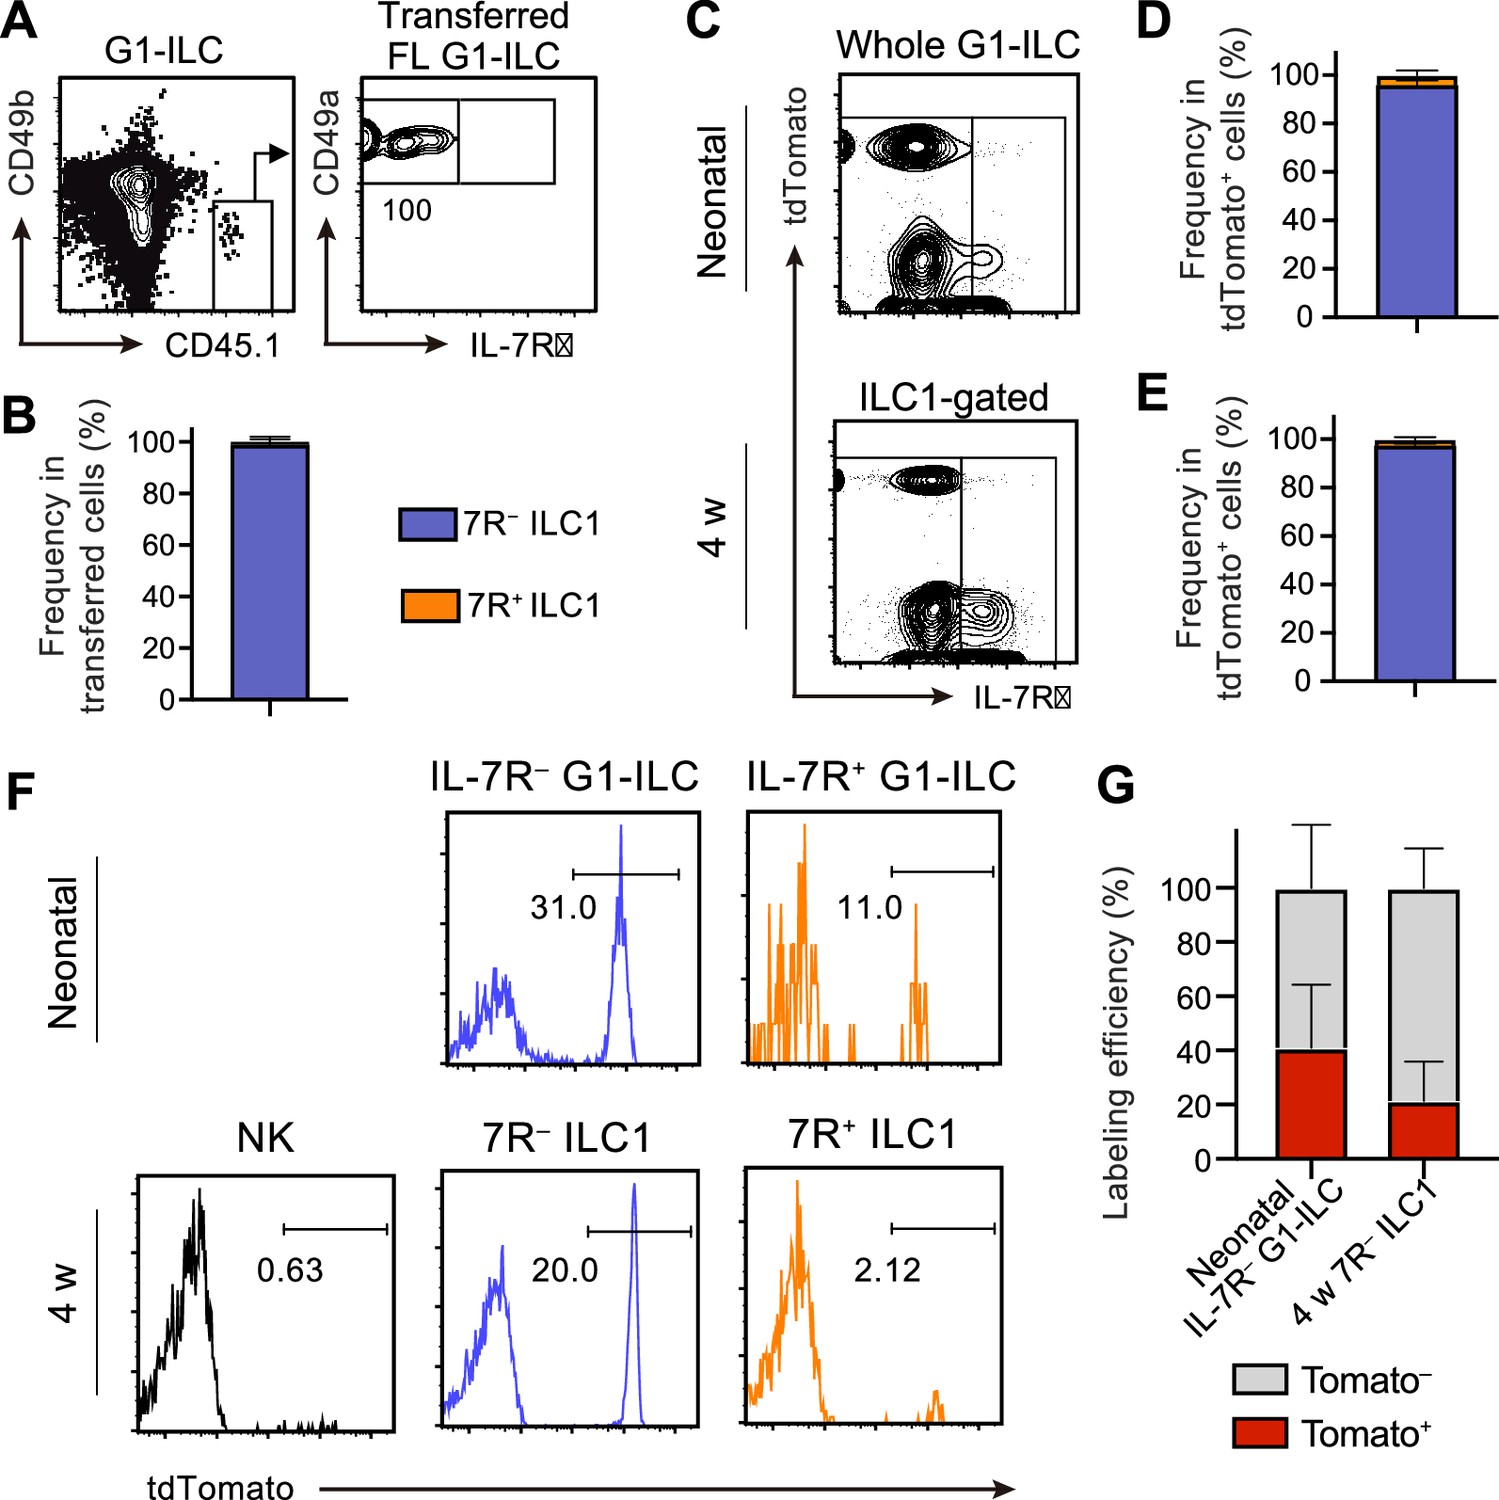
FL G1-ILCs exclusively give rise to 7 R− ILC1s.
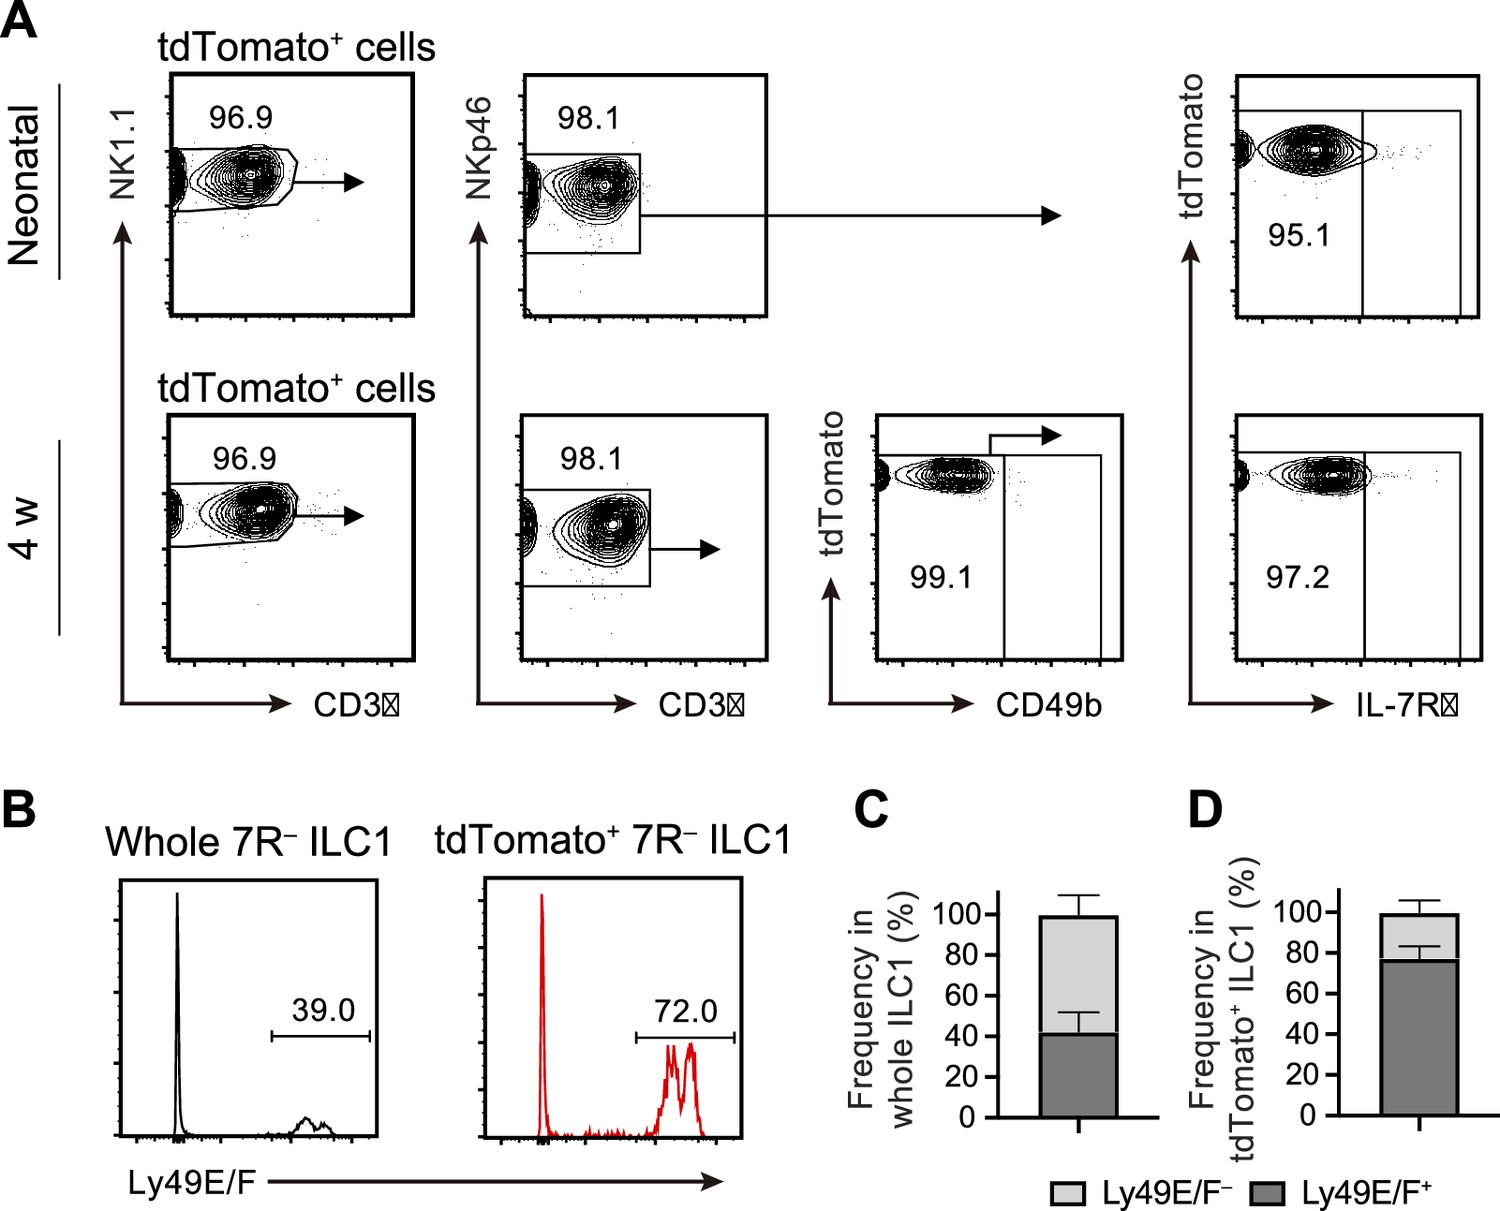
(A and B) FCM analysis of transferred FL G1-ILCs (CD45.1) detected in the host liver (CD45.2) at 4 weeks post-transfer. Representative FCM profiles (A) and the percentages of transferred cell fate (B) are shown. Data represent or are pooled from two independent experiments (n=4). (C–E) FCM analysis of tdTomato+ cells in neonatal and adult Ncr1-CreERT2 Rosa26-tdTomato mice treated with tamoxifen at E17.5. Representative FCM plots (C) and the percentage of the fate of tdTomato+ cells in neonates (D) and 4 weeks old mice (E) are shown. Blue, IL-7R− fraction; orange, IL-7R+ fraction. Data represent or are pooled from three independent experiments (neonatal, n=10; 4 w, n=5). (F and G) FCM analysis of tdTomato expression on indicated G1-ILC populations in Ncr1-CreERT2 Rosa26-tdTomato mice treated with tamoxifen at E17.5. Representative histograms (F) and the percentages of tdTomato+ and tdTomato− fractions in neonatal IL-7R− G1-ILCs and 7 R− ILC1s in 4 weeks old mice (G) are shown. Data represent or are pooled from three independent experiments (neonatal, n=10; 4 w, n=5). Data are presented as mean ± SD.
-
Figure 3—source data 1
FL G1-ILCs exclusively give rise to 7 R− ILC1s.
- https://cdn.elifesciences.org/articles/84209/elife-84209-fig3-data1-v1.xlsx
Figure 3—figure supplement 1
FL G1-ILCs contribute to AL 7 R− ILC1 pool.
(A) FCM analysis of tdTomato+ cells in AL of Ncr1-CreERT2 Rosa26-tdTomato mice treated with tamoxifen at E17.5. Representative FCM plots in neonates and 4 weeks old mice are shown. Data represent three independent experiments (neonatal, n=10; 4 w, n=5). (B–D) FCM analysis of Ly-49E/F expression on 7 R− ILC1s. Representative histograms (B) and the percentages of Ly-49E/F+ and Ly-49E/F− fraction in whole 7 R− ILC1s (C) or in tdTomato+ 7R− ILC1s (D) are shown. Data represent or are pooled from three independent experiments (n=5). Data are presented as mean ± SD.
Figure 4
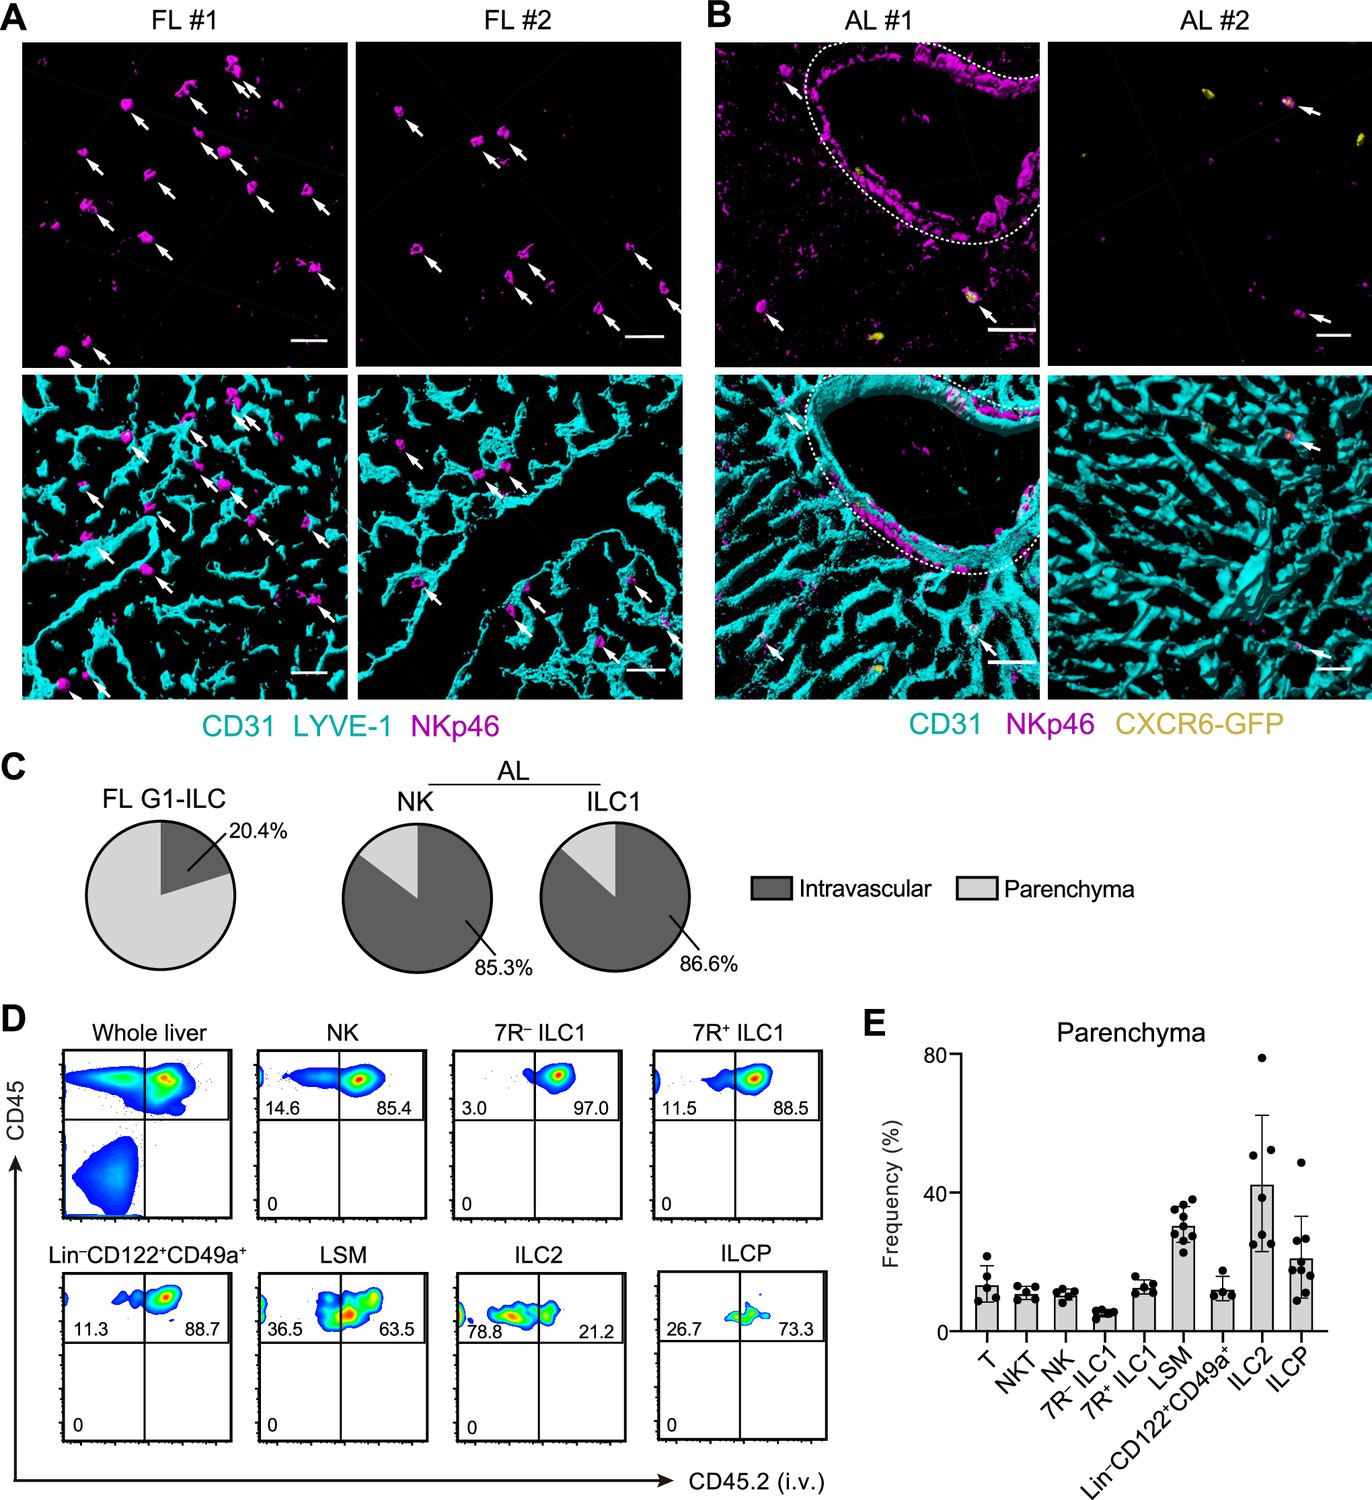
Liver G1-ILCs shift distributions from parenchyma to sinusoids during development.
(A and B) 3D-reconstructed immunofluorescence images of frozen sections of FL from WT mice (A; n=4) and AL from Cxcr6GFP/+ mice (B; n=4) stained with anti-NKp46 (magenta) and anti-CD31 and/or anti-LYVE-1 (for FL endothelium) (cyan) antibodies. GFP signals are shown in yellow. White arrows indicate G1-ILCs. Hepatic artery is circled by a dotted line. Scale bar, 40 μm. (C) The percentages of indicated G1-ILC subsets localized inside (intravascular) or outside (parenchyma) of the blood vessels. Data represent randomly counted 323 cells for FL G1-ILCs pooled from four E18.5 WT mice and 232 cells for AL NK cells as well as 136 cells for AL ILC1s pooled from four Cxcr6GFP/+ mice. (D and E) FCM analysis of AL of mice injected i.v. with PE/Cy7 anti-CD45.2 antibody 2 min before the liver perfusion and leukocyte isolation. Representative FCM profiles (D) and the percentages of cells unlabeled by i.v. CD45.2 staining within CD45+ cells (considered as parenchyma-distributed cells) (E) are shown. Data represent or are pooled from two (n=5 for T, NKT, NK, 7R+ ILC1, and 7 R− ILC1), four (n=7 for ILC2 and Lin–CD49a+CD122+ cells), and five (n=9 for ILCP and LSM cells) independent experiments. Data are presented as mean ± SD.
-
Figure 4—source data 1
Liver G1-ILCs shift distributions from parenchyma to sinusoids during development.
- https://cdn.elifesciences.org/articles/84209/elife-84209-fig4-data1-v1.xlsx
Figure 5 with 1 supplement
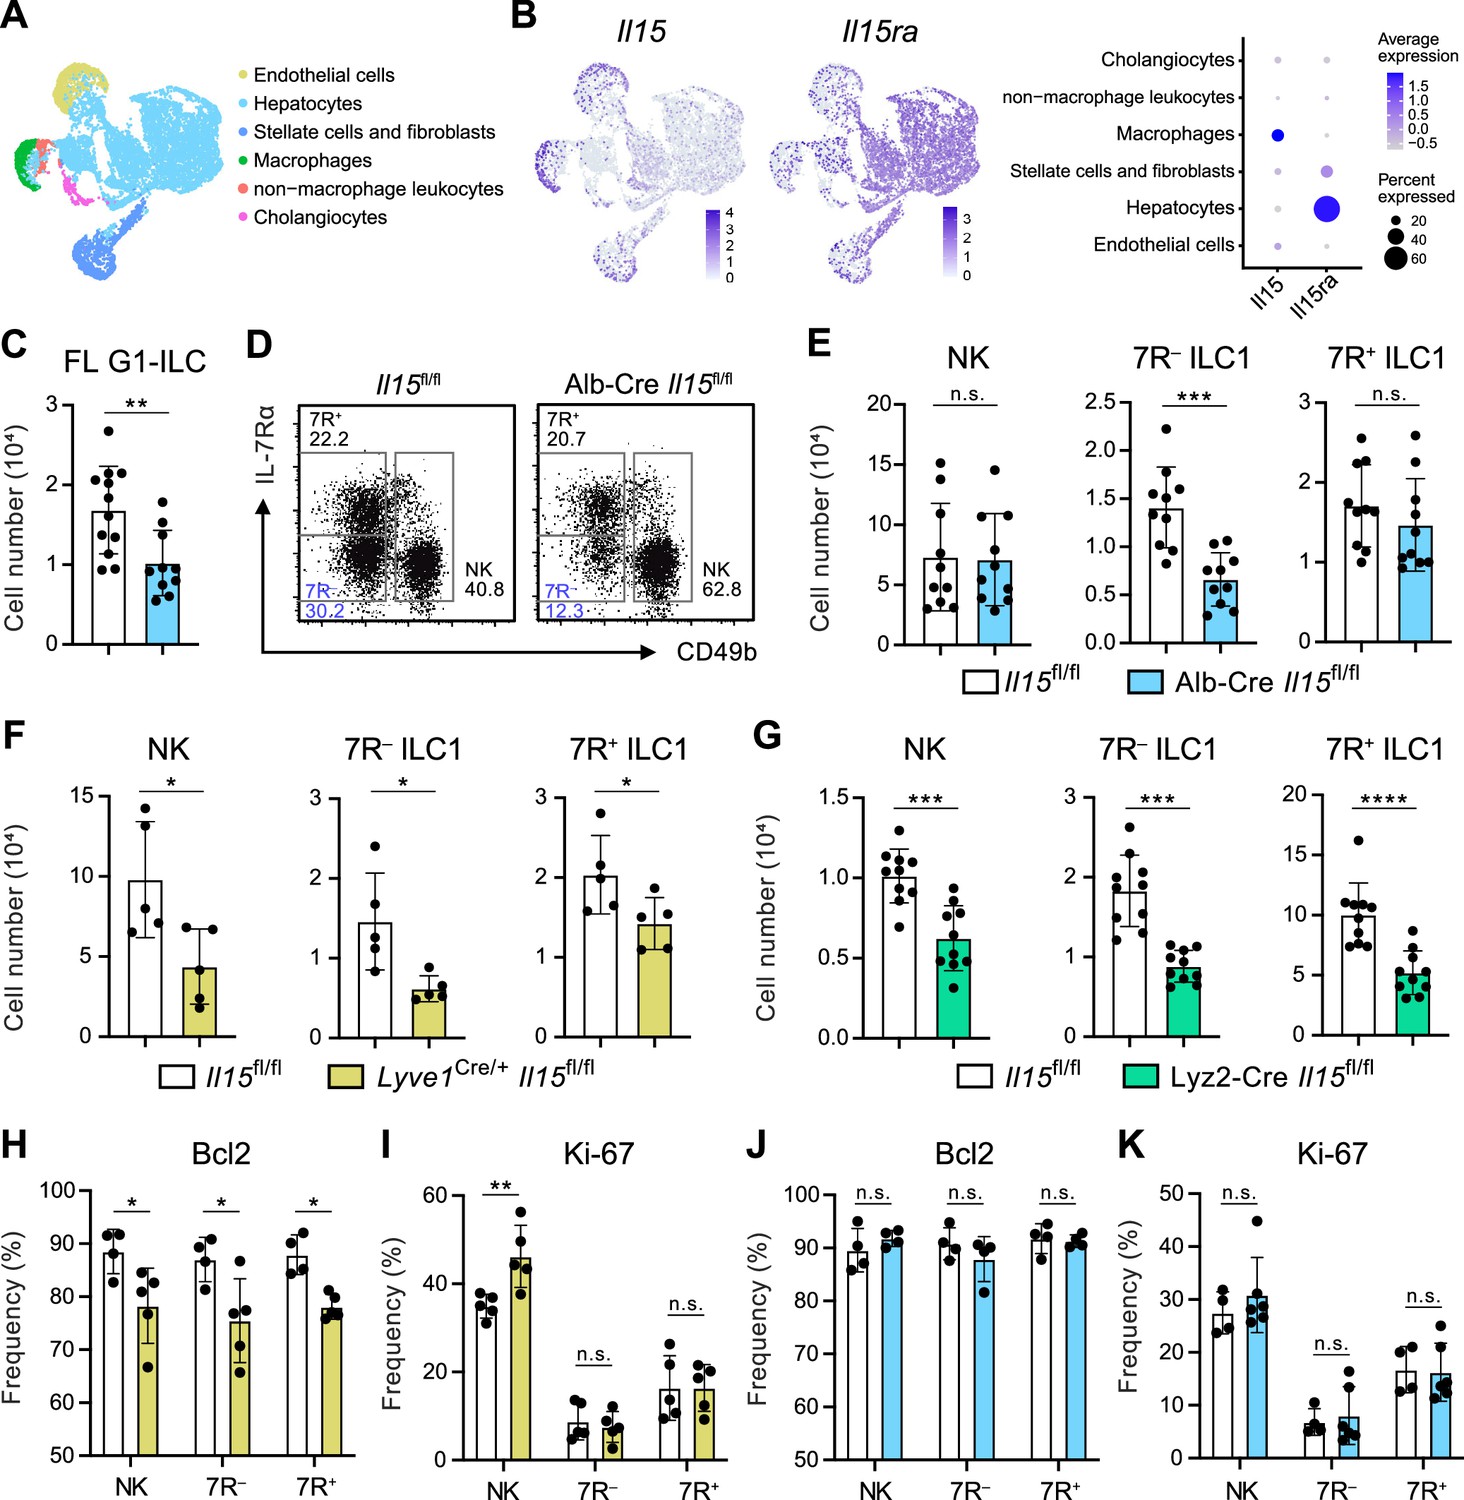
Hepatocytes provide the parenchymal IL-15 niche regulating the local development of 7 R− ILC1s.
(A and B) Single nuclei RNA-seq (snRNA-seq) analysis of mouse whole liver cells (Liver Cell Atlas; https://www.livercellatlas.org/). UMAP visualization (A) and expression levels of Il15 and Il15ra (B) in each cell population assigned in Figure 5—figure supplement 1B are shown. (C) The cell number of FL G1-ILCs in control or Alb-Cre Il15fl/fl mice. Data are pooled from two independent experiments (Il15fl/fl, n=12; Alb-Cre Il15fl/fl, n=10). (D and E) FCM analysis of AL G1-ILCs in control or Alb-Cre Il15fl/fl mice. Representative FCM plots (D) and the cell number of each population (E) are shown. Data represent or are pooled from two independent experiments (Il15fl/fl, n=10; Alb-Cre Il15fl/fl, n=10). (F and G) The cell number of indicated G1-ILC populations in Lyve1Cre/+ Il15fl/fl mice (F) (two independent experiments; n=5 for Il15fl/fl and Lyve1Cre/+ Il15fl/fl mice) or Lyz2-Cre Il15fl/fl mice (G) (two independent experiments; n=10 for Il15fl/fl and Lyz2-Cre Il15fl/fl mice) compared to controls. (H and I) The percentages of Bcl-2 (H) (two independent experiments; n=4 for Il15fl/fl, n=5 for Lyve1Cre/+ Il15fl/fl mice) and Ki-67 (I) (two independent experiments; n=5 for Il15fl/fl, n=5 for Lyve1Cre/+ Il15fl/fl mice) expressing cells within each G1-ILC population in control or Lyve1Cre/+ Il15fl/fl mice. (J and K) The percentages of Bcl-2 (J) (two independent experiments; n=4 for Il15fl/fl, n=4 for Alb-Cre Il15fl/fl mice) and Ki-67 (K) (two independent experiments; n=4 for Il15fl/fl, n=6 for Alb-Cre Il15fl/fl mice) expressing cells within each G1-ILC population in control or Alb-Cre Il15fl/fl mice. Data are presented as mean ± SD. *p<0.05, **p<0.01, ***p<0.001, ****p<0.0001.
-
Figure 5—source data 1
Hepatocytes provide the parenchymal IL-15 niche regulating the local development of 7 R− ILC1s.
- https://cdn.elifesciences.org/articles/84209/elife-84209-fig5-data1-v1.xlsx
Figure 5—figure supplement 1
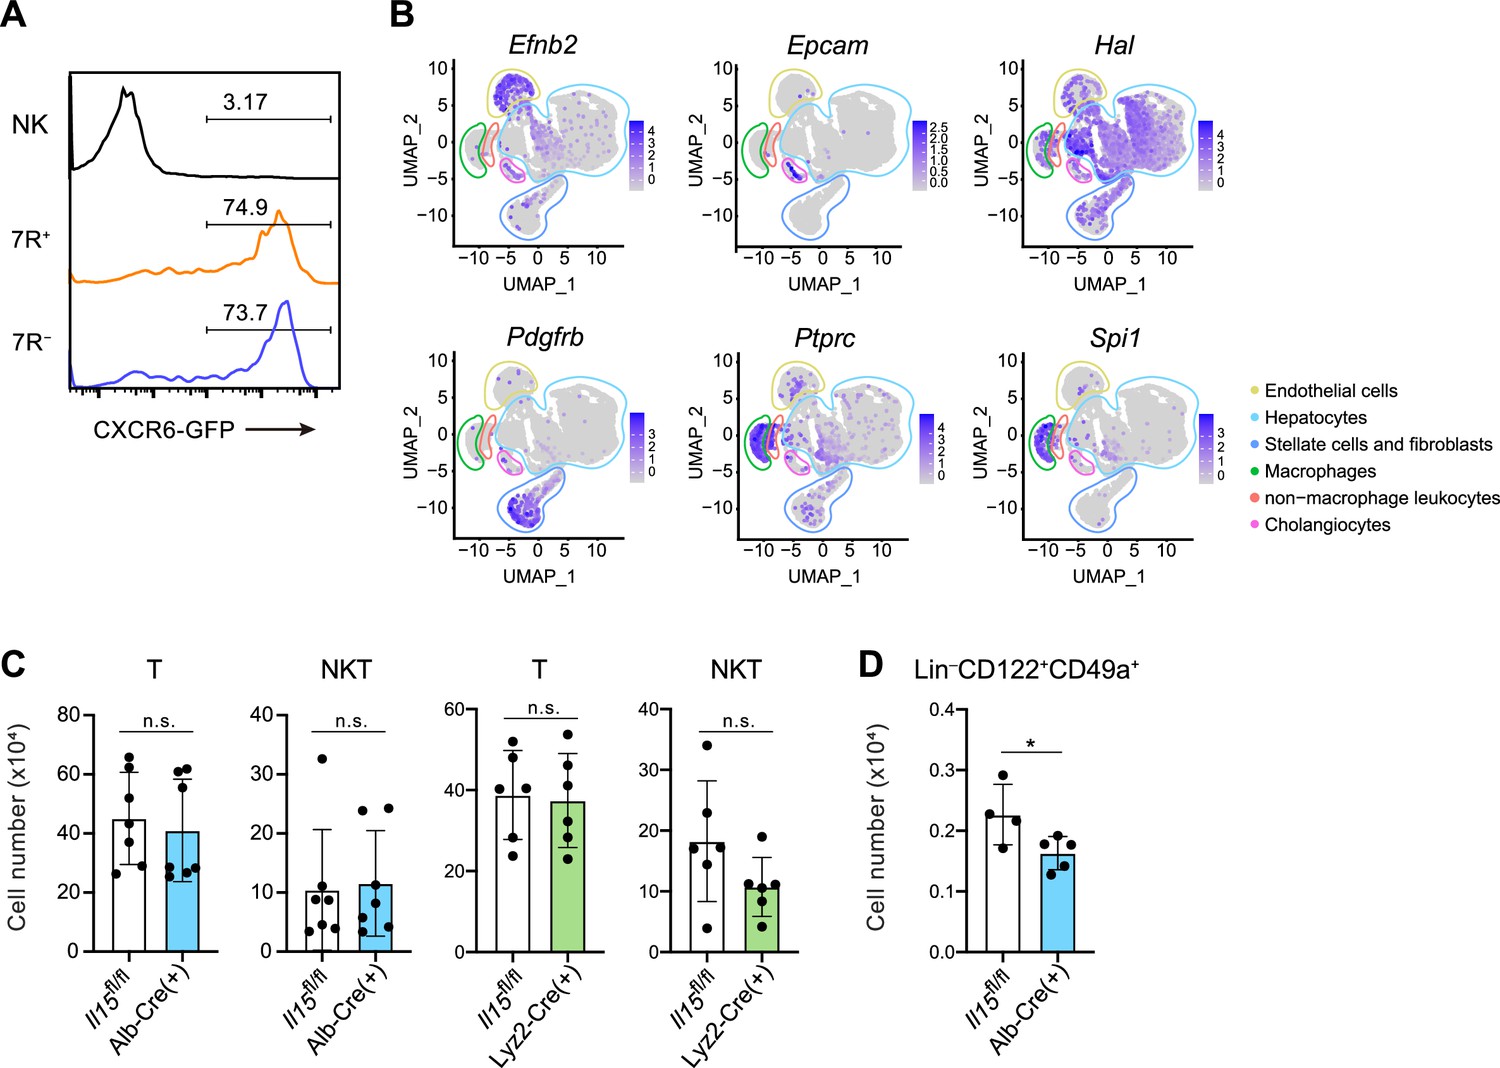
Liver IL-15-producing cells supports lymphoid cells in a subset-dependent manner.
(A) Expression of GFP on AL NK cells, 7 R− ILC1s, and 7R+ ILC1s in Cxcr6GFP/+ mice. Data represent two independent experiments (n=4 for all subsets). (B) UMAP visualization of snRNA-seq analysis of mouse whole liver cells (Liver Cell Atlas; https://www.livercellatlas.org/). Cell identity of each cluster was defined based on the expression of Efnb2, Epcam, Hal, Pdgfb, Ptprc, and Spi1. (C) The cell number of AL T cells and CD3+NK1.1+ (NKT) cells in control, Alb-Cre Il15fl/fl mice, or Lyz2-Cre Il15fl/fl mice. Data are pooled from four (left; n=7 for T and NKT cells in Il15fl/fl and Alb-Cre Il15fl/fl mice) and three (right; n=6 for T and NKT cells in Il15fl/fl and Lyz2-Cre Il15fl/fl mice) independent experiments. (D) The cell number of Lin−CD122+CD49a+ cells in control or Alb-Cre Il15fl/fl mice. Data are pooled from two independent experiments (n=4, Il15fl/fl; n=5, Alb-Cre Il15fl/fl). Data are presented as mean ± SD. *p<0.05.
Figure 6 with 1 supplement
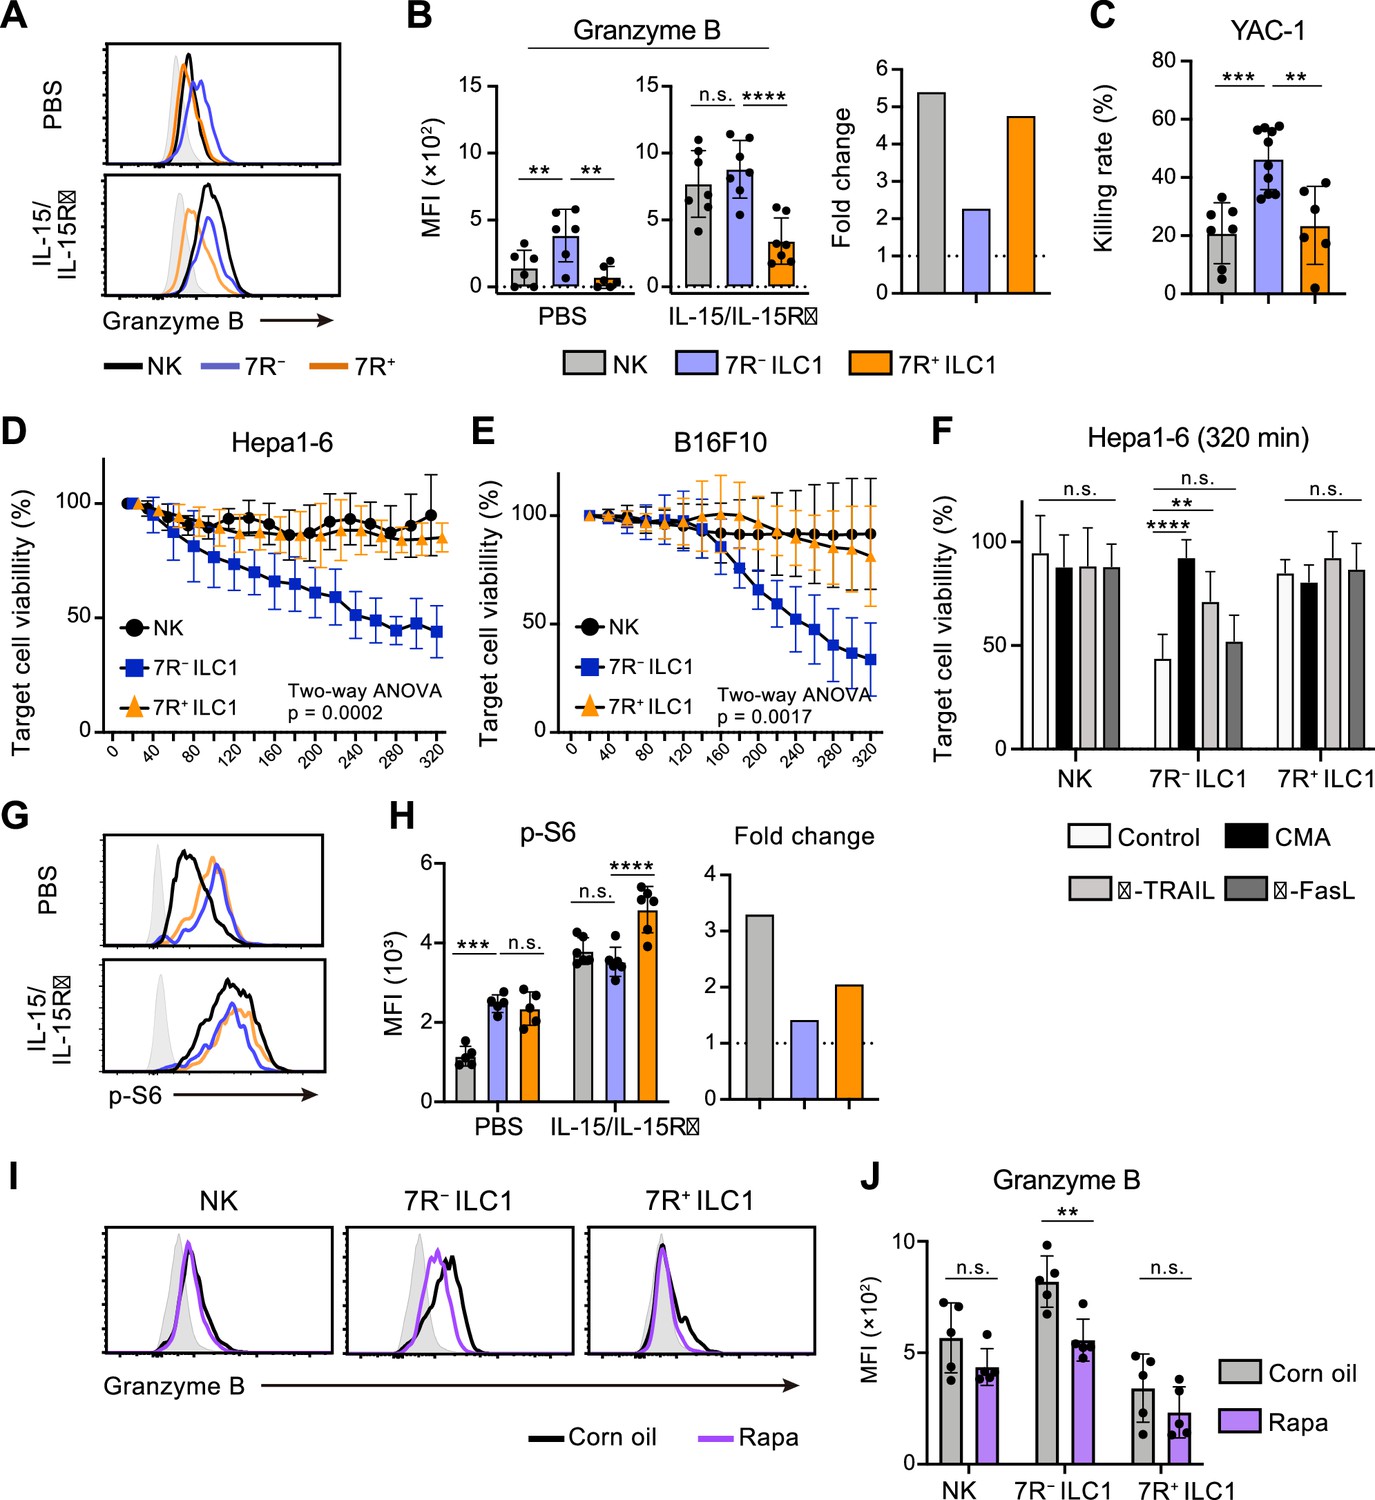
7 R− ILC1s exhibit cytotoxicity via granzyme B expression underpinned by steady-state mTOR activation.
(A and B) Granzyme B expression on each AL G1-ILC population in control or IL-15/IL-15Rα-treated mice. Representative histograms (A), MFI (B, left), and its fold change after the IL-15/IL-15Rα treatments (B, right) are shown. Shaded histograms (grey) indicate isotype controls. Data represent or are pooled from three independent experiments (PBS, n=6; IL-15/IL-15Rα, n=7). (C) The percentages of annexin Ⅴ+PI+ YAC-1 cells in flow-based cytotoxicity assays. Freshly isolated effector cells were co-cultured with target cells for 4 hours (E:T ratio = 10:1). Data are pooled from two independent experiments (NK, n=7; 7 R− ILC1, n=10; 7R+ ILC1, n=6). (D and E) Target cell viability at each timepoint in time-lapse cytotoxicity assay using Hepa1-6 cells (D) (two independent experiments; n=6 for NK, n=6 for 7 R− ILC1, and n=4 for 7R+ ILC1 in all timepoints) and B16F10 cells (E) (two independent experiments; n=7 for NK, n=8 for 7 R− ILC1, and n=8 for 7R+ ILC1 in all timepoints) as target cells. Freshly isolated effector cells were co-cultured with target cells up to 6 hours (E:T ratio = 10:1). (F) Hepa1-6 cell viability at 320 min in time-lapse cytotoxicity assays supplemented with concanamycin A (CMA) or neutralizing antibody for TRAIL (α-TRAIL) or FasL (α-FasL) compared to vehicle-supplemented controls. Data are pooled from two independent experiments (NK, n=6; 7 R− ILC1, n=6; 7R+ ILC1, n=4). (G and H) FCM analysis of phosphorylation of S6 in NK cells (black), 7 R− ILC1s (blue), and 7R+ ILC1s (orange) in control or IL-15/IL-15Rα-treated mice. Representative histograms (G), MFI (left), and its fold change after the IL-15/IL-15Rα treatments (right) (H) are shown. Shaded histograms (grey) indicate isotype controls. Data represent or are pooled from three independent experiments (PBS, n=5; IL-15/IL-15Rα, n=6). (I and J) FCM analysis of granzyme B expressed on each AL G1-ILC population in control or rapamycin-treated (rapa) mice. Representative histograms (I) and MFI (J) are shown. Shaded histograms (grey) indicate isotype controls. Data represent or are pooled from three independent experiments (corn oil, n=5; rapa, n=5). Data are presented as mean ± SD. **p<0.01, ***p<0.001, ****p<0.0001.
-
Figure 6—source data 1
7 R− ILC1s exhibit cytotoxicity via granzyme B expression underpinned by steady-state mTOR activation.
- https://cdn.elifesciences.org/articles/84209/elife-84209-fig6-data1-v1.xlsx
Figure 6—figure supplement 1

Differential effector molecule expression and cytokine responsiveness among heterogenous G1-ILC subsets.
(A and B) Expression of FasL (A) (two independent experiments; n=6 for PBS and IL-15/IL-15Rα) and TRAIL (B) (two independent experiments; n=6 for PBS and IL-15/IL-15Rα) on each AL G1-ILC population in control or IL-15/IL-15Rα-treated mice. Representative histograms (upper), MFI (lower left), and its fold change after the IL-15/IL-15Rα treatments (lower right) are shown. (C) Normalized read counts of Gzma and Gzmc expressed on each G1-ILC population obtained from RNA-seq. (D) Expression of granzyme C protein on NK cells, 7 R− ILC1s, and 7R+ ILC1s in AL. Data represent two independent experiments (n=3 for all subsets). (E) Expression of granzyme B, TRAIL, and granzyme C on G1-ILC subsets after the in vitro stimulation with indicated cytokines, cross-linking of NK receptors, and the co-culture with tumor cells (two independent experiments; n=4 for all subsets and conditions). (F and G) Phosphorylation levels of Akt (F) (three independent experiments; n=5 for PBS and IL-15/IL-15Rα) and STAT5 (G) (three independent experiments; n=6 for PBS and IL-15/IL-15Rα) on each AL G1-ILC population in control or IL-15/IL-15Rα-treated mice. MFI (left) and its fold change after the IL-15/IL-15Rα treatments (right) are shown. RNA-seq data are from two (AL NK cells), three (AL 7R+ ILC1s, BM iILC1s, and BM NK cells), and four (FL G1-ILCs and AL 7 R− ILC1s) biological replicates (C). Data are presented as mean ± SD. *p<0.05, ***p<0.001, ****p<0.0001.
Author response image 1
Additional files
Download links
A two-part list of links to download the article, or parts of the article, in various formats.
Downloads (link to download the article as PDF)
Open citations (links to open the citations from this article in various online reference manager services)
Cite this article (links to download the citations from this article in formats compatible with various reference manager tools)
Liver type 1 innate lymphoid cells lacking IL-7 receptor are a native killer cell subset fostered by parenchymal niches
eLife 12:e84209.
https://doi.org/10.7554/eLife.84209


