The Uso1 globular head interacts with SNAREs to maintain viability even in the absence of the coiled-coil domain
- Department of Cellular and Molecular Biology, CSIC Centro de Investigaciones Biológicas, Spain
- Instituto de Tecnologías Biomédicas, Hospital Universitario Nuestra Señora de Candelaria, Spain
- Department of Infectious Diseases, Faculty of Medicine, Flowers Building, Imperial College, United Kingdom
- Department of Structural and Chemical Biology, CSIC Centro de Investigaciones Biológicas, Spain
- Division of Cell Biology, MRC Laboratory of Molecular Biology, Francis Crick Avenue, United Kingdom
Figures
Figure 1 with 1 supplement
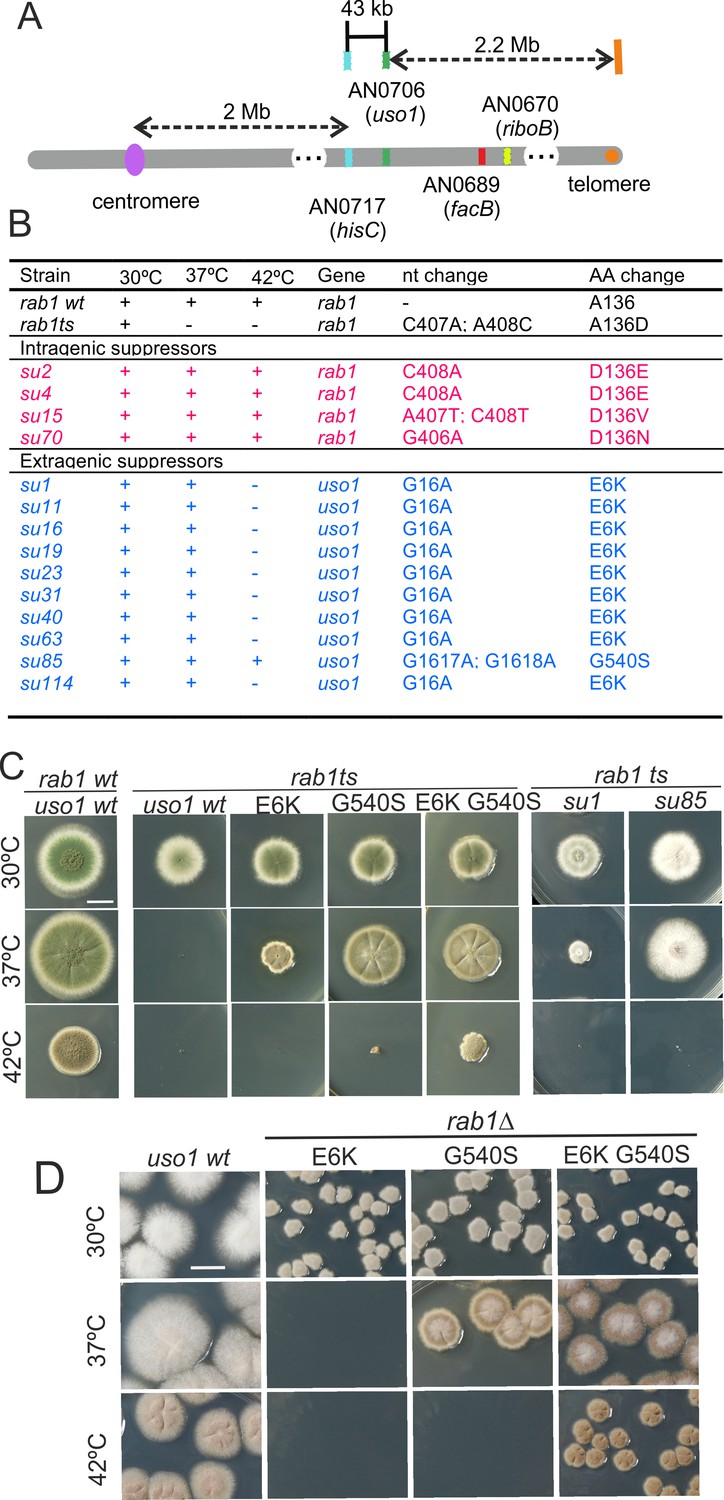
Characterization of mutations bypassing the essential role of RAB1.
(A). Genetic map in the region surrounding uso1 with genetic markers used as landmarks for mapping. (B). Molecular identification of the nucleotide changes in suArab1ts strains. (C) and (D): growth tests showing rab1ts- and rab1∆-rescuing phenotypes, respectively, of individual mutations, and synthetic positive interaction between E6K and G540S. Strains produce either green or white conidiospores (conidiospore colors are used as genetic markers). In (C), strains were point-inoculated. In (D) conidiospores were spread on agar plates to give individual colonies.
Figure 1—figure supplement 1
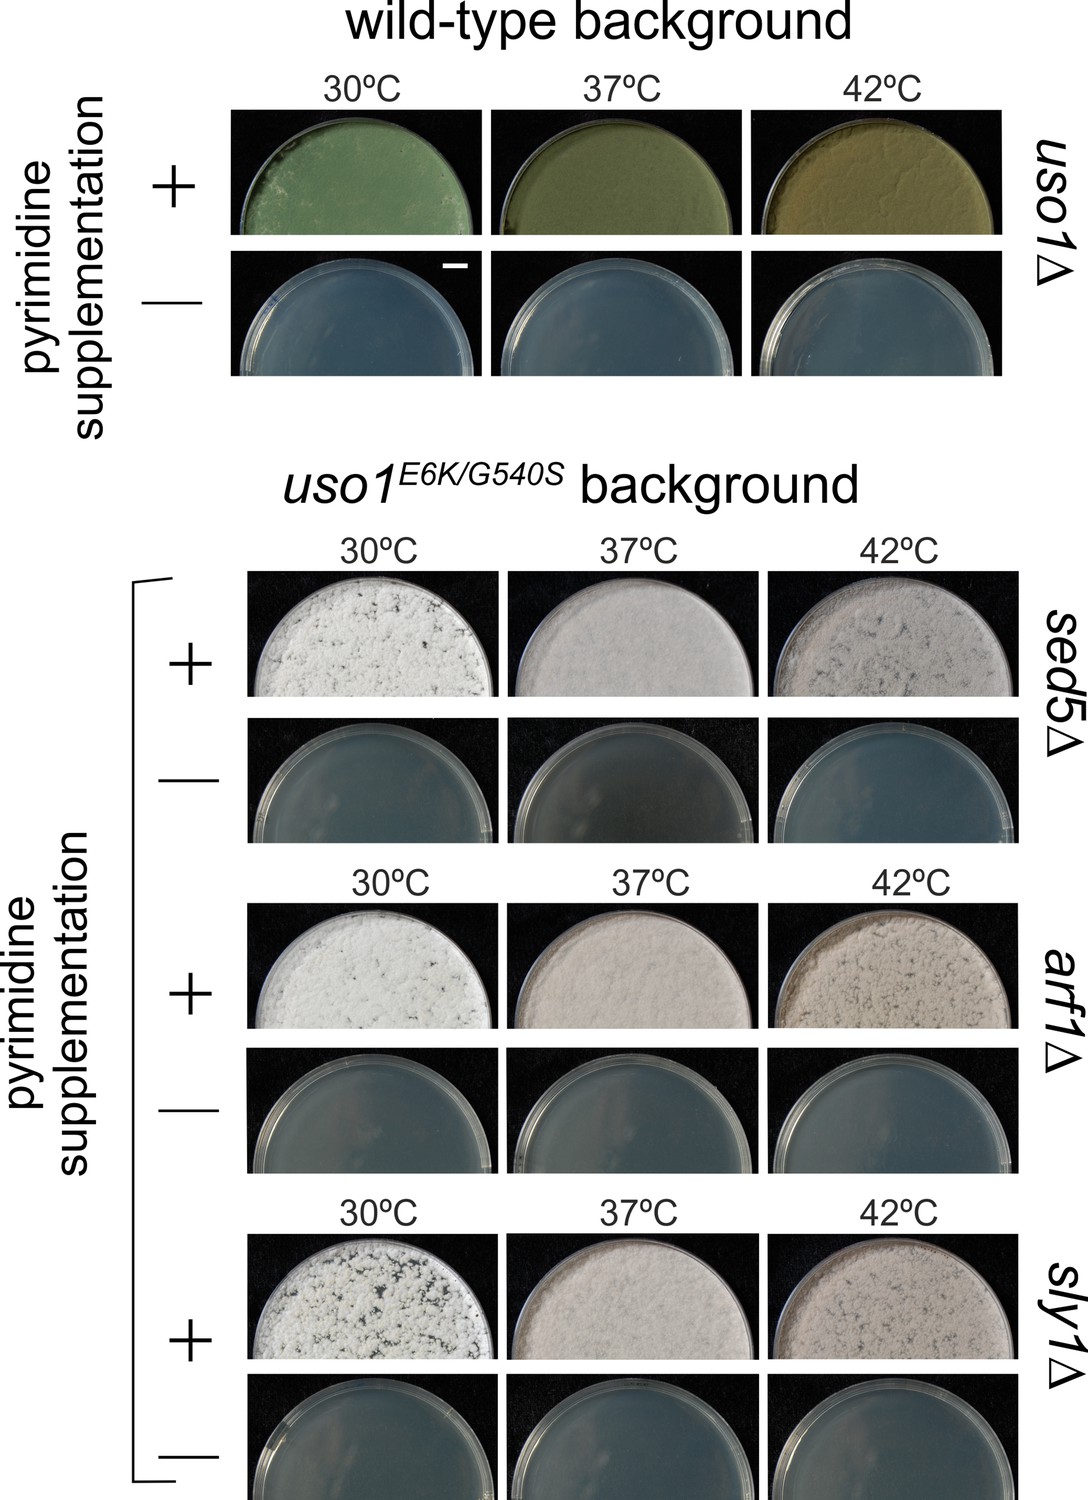
E6K/G540S do not rescue lethality resulting from arf1∆, sly1∆, or sed5∆.
Top, uso1 is an essential gene. Singly-nucleated conidiospores derived from a heterokaryotic strain in which one class of nuclei carries a deficient pyrG uracil biosynthetic gene whereas the second class contains a uso1∆ allele tagged with functional pyrG were unable to grow on medium lacking pyrimidines at any of the tested temperatures. Bottom: Similar experiments show that unlike rab1∆ strains, strains carrying lethal arf1∆, sly1∆, and sed5∆ alleles cannot be rescued by uso1E6K/G540S. Top panel, strains with green conidiospores; bottom, strains with white conidiospores.
Figure 2 with 1 supplement
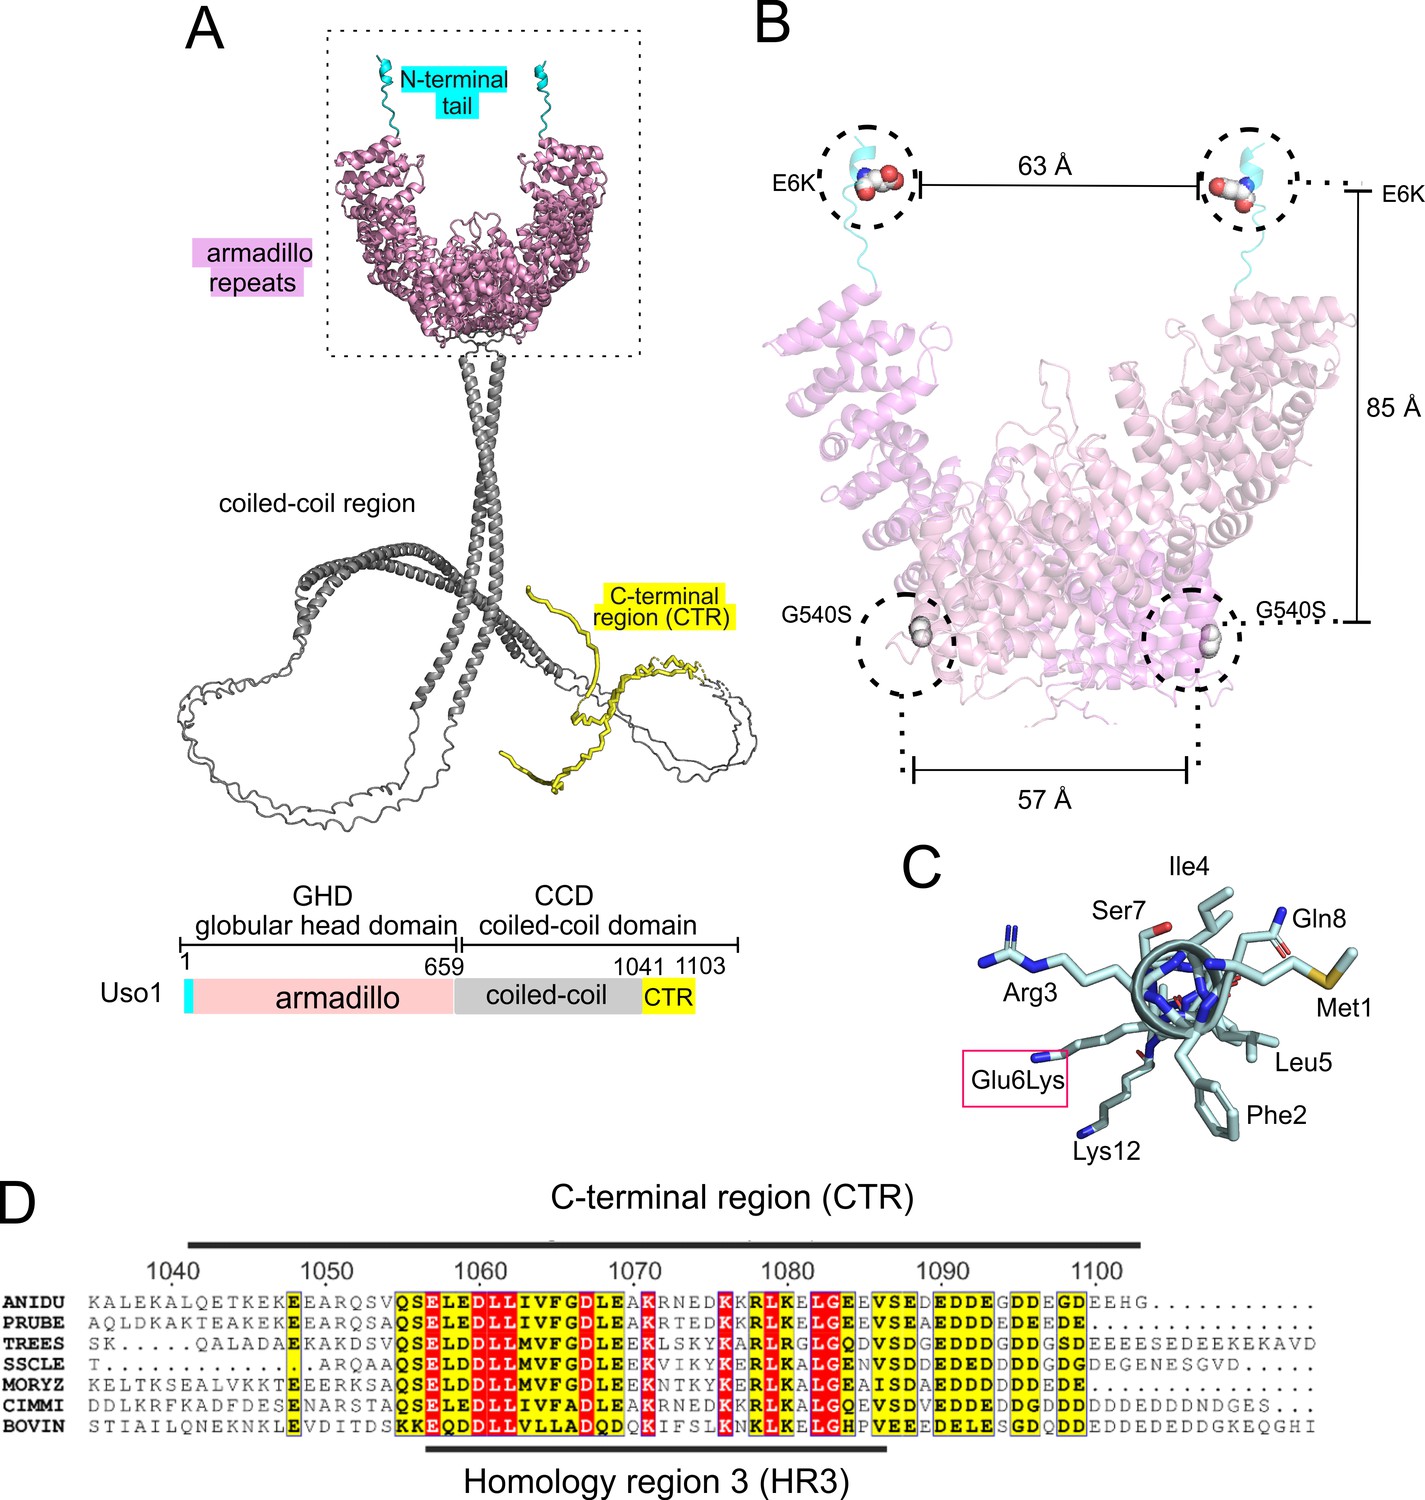
Localization of the amino acid substitutions within the Uso1 AlphaFold2 structure.
(A). AlphaFold2 cartoon representations of A. nidulans Uso1 dimer. Note that the depiction of the coiled-coil domain (CCD) is highly speculative. It is included with the sole purpose of visually appreciating the relative sizes of the globular-head-domain (GHD) and the CCD domains. Confidence estimations for Uso1 models are detailed in Figure 2—figure supplement 1. Colors are as in the scheme below: Cyan, N-terminal tail; pink, globular head domain; gray, coiled-coil; yellow, C-terminal region (CTR). (B). Position of the Gly6Lys and Gly540Ser substitutions. Only the GHD of dimeric full-length Uso1 is shown. Distances between mutated residues are displayed in angstroms. (C). The N-terminal amphipathic α-helix affected by the Glu6Lys substitution. (D). Amino acid alignment of fungal sequences with mammalian p115 showing strong conservation within the CTR: ANIDU, Aspergillus nidulans; PRUBE, Penicillium rubens; TREES, Thrichoderma ressei; SSCLE, Sclerotinia scleriotorum; MORYZ, Magnaporthe oryzae; CIMM, Coccidioides immitis; BOVIN, Bos taurus.
Figure 2—figure supplement 1

AlphaFold2 predictions of Uso1.
Ribbon representation of AlphaFold 2-predicted structures of the full-length Uso1 dimer (A) and the Uso1 globular-head-domain(GHD), represented as a monomer (B), color-coded by pLDDT values. Graphs at the bottom are the corresponding plots of predicted aligned error of the residues (PAE).
Figure 3 with 1 supplement
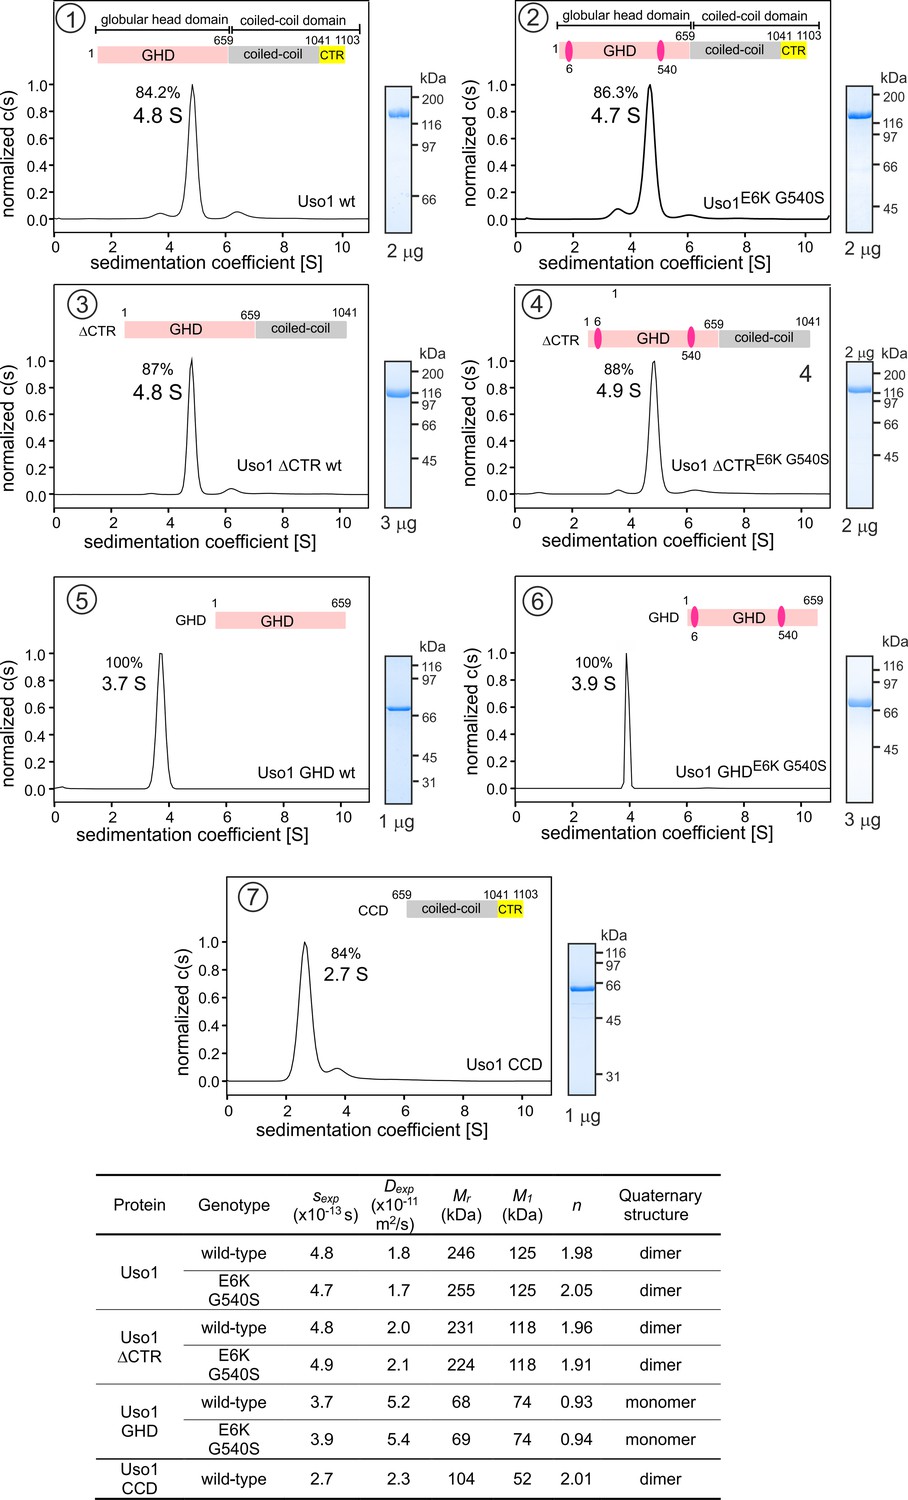
Determining molecular masses and oligomerization status of the different Uso1 constructs by velocity sedimentation analysis.
The different panels display the sedimentation profiles of the protein being analyzed, with % of the main species, scheme of the corresponding constructs (color matching those in Figure 2), and pictures of Coomassie stained gels showing the purity of the protein preparations. The bottom table depicts the biophysical parameters of the constructs used to obtain relative molecular masses. sexp is the experimentally determined Svedberg coefficient; Dexp, translational diffusion coefficient of the main species; Mr, molecular mass deduced from Svedberg equation; M1 predicted molecular mass of the monomer; n = (Mr /M1).
Figure 3—figure supplement 1
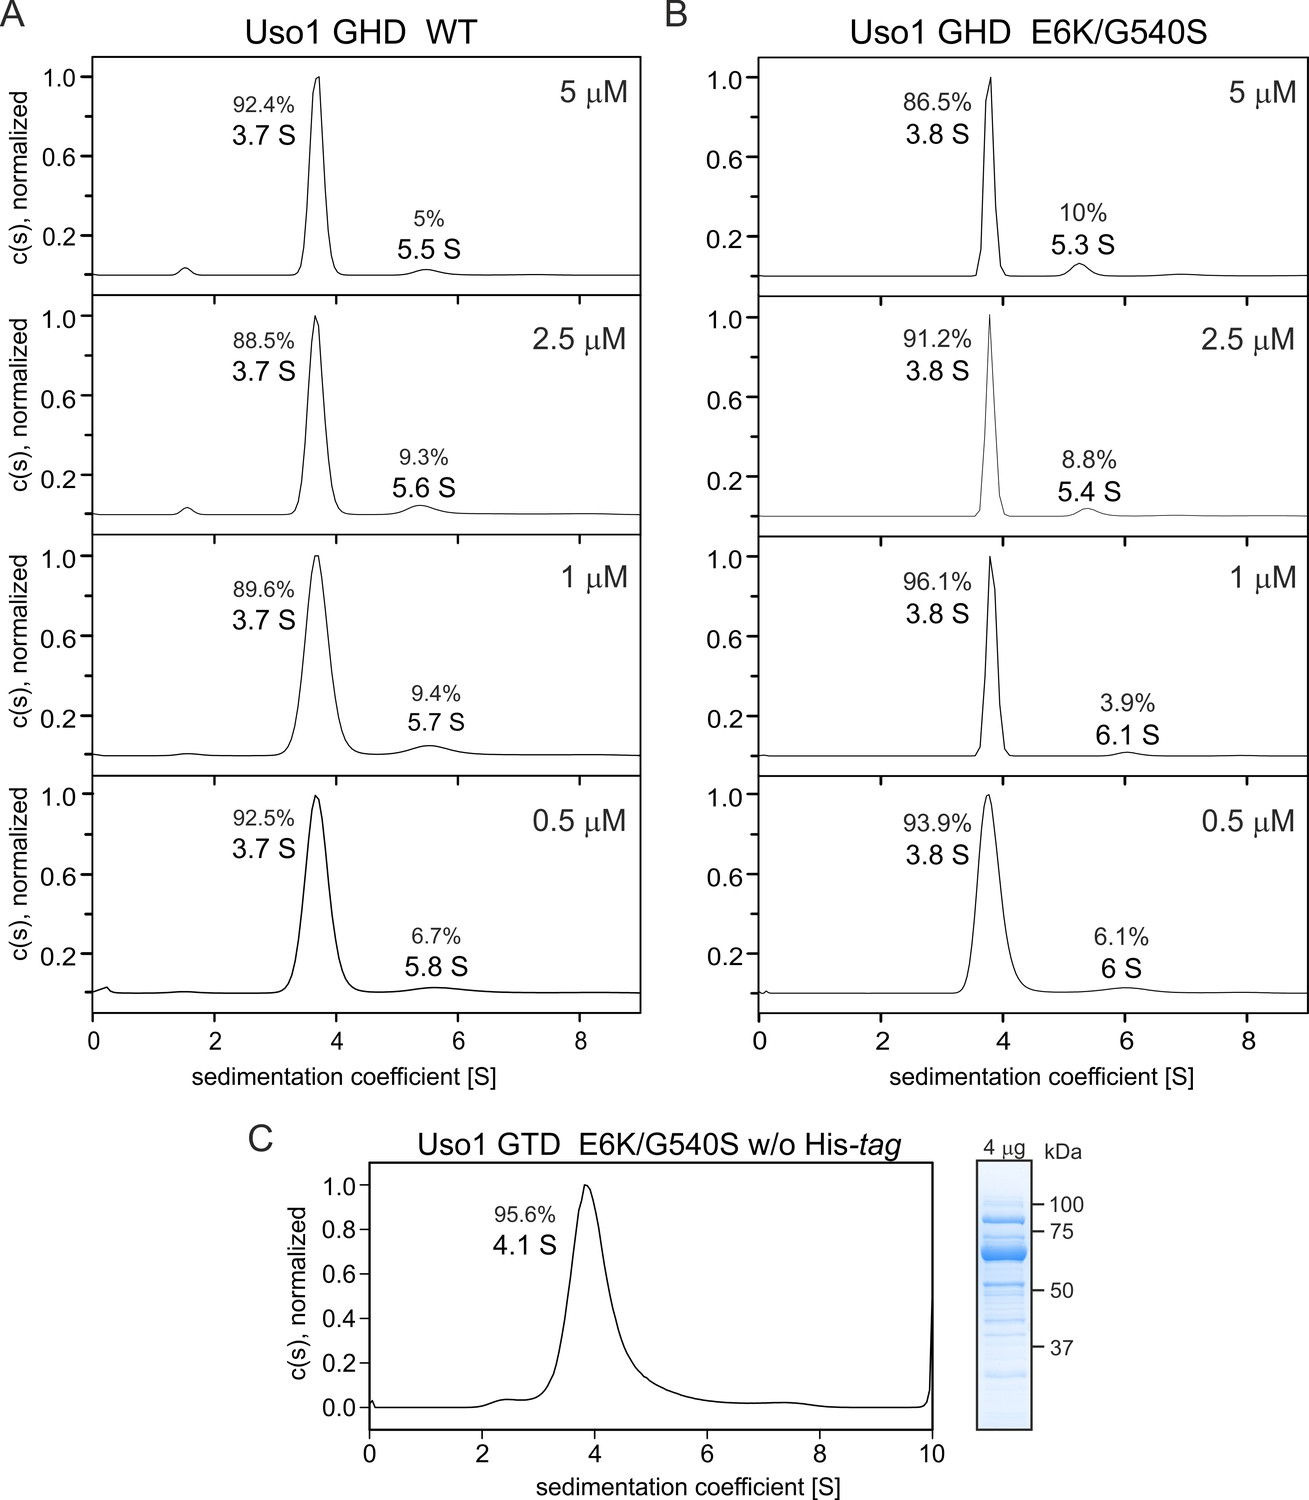
Globular-head-domain (GHD) is a monomer across a range of concentrations.
(A) and (B). Sedimentation velocity experiments with wild-type and E6K/G540S mutant GHD, respectively, show that they behave as monomers at concentrations up to 5 μM. (C). Sedimentation velocity profile of E6K/G540S mutant GHD lacking the His-tag, showing that the presence of the latter does not interfere with oligomerization, and a picture of a Coomassie-stained gel showing the purity of the protein preparation on the right.
Figure 4 with 1 supplement
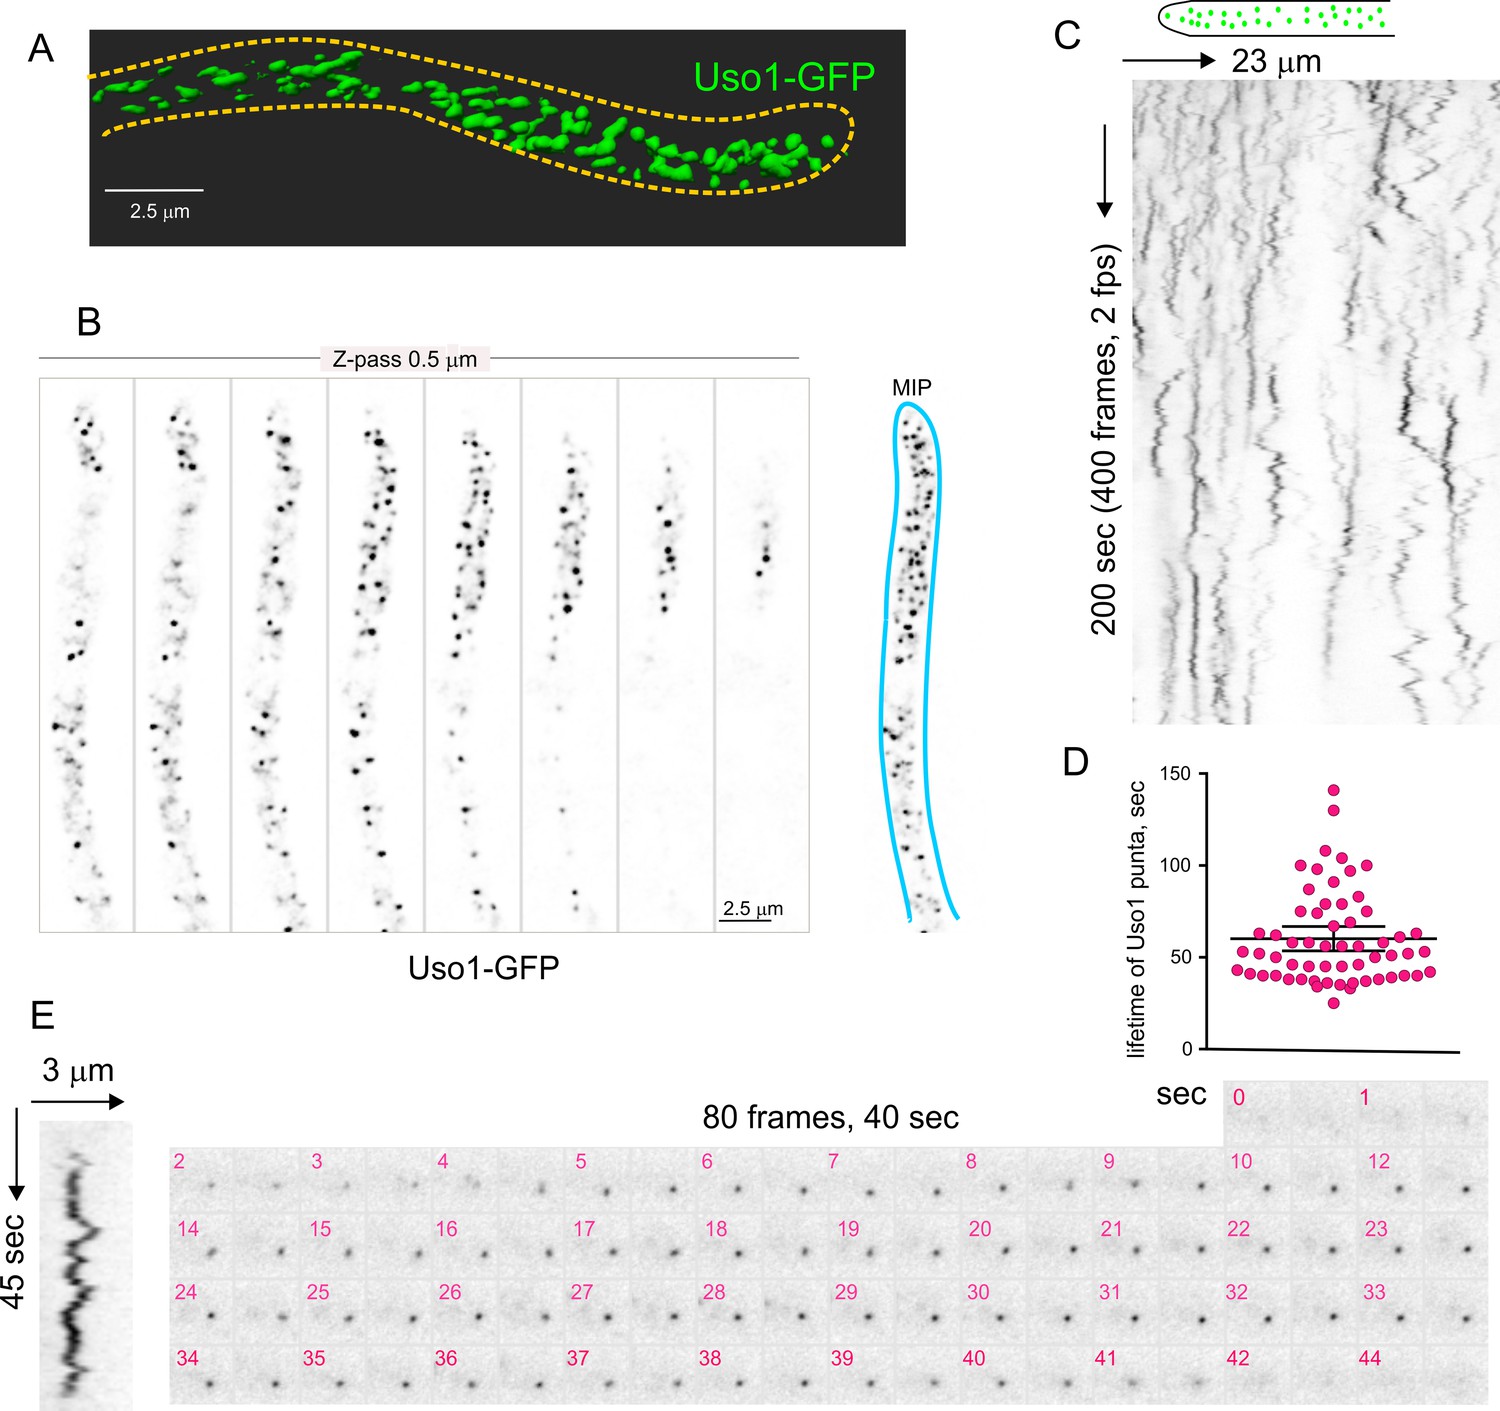
Subcellular localization of Uso1.
(A). Uso1-GFP localizing to punctate cytoplasmic structures, 3D shaded by software. (B). Sections of a deconvolved Z-stack and its corresponding maximal intensity projection (MIP). Uso1-GFP in inverted grayscale for clarity. (C). Kymograph showing the transient recruitment of Uso1 to punctate cytoplasmic structures. (D). Average time of residence of Uso1 in these structures. Error bars, 95% CI. (E). Example of one such structure visualized with a kymograph and with the corresponding movie frames (Video 4).
Figure 4—figure supplement 1
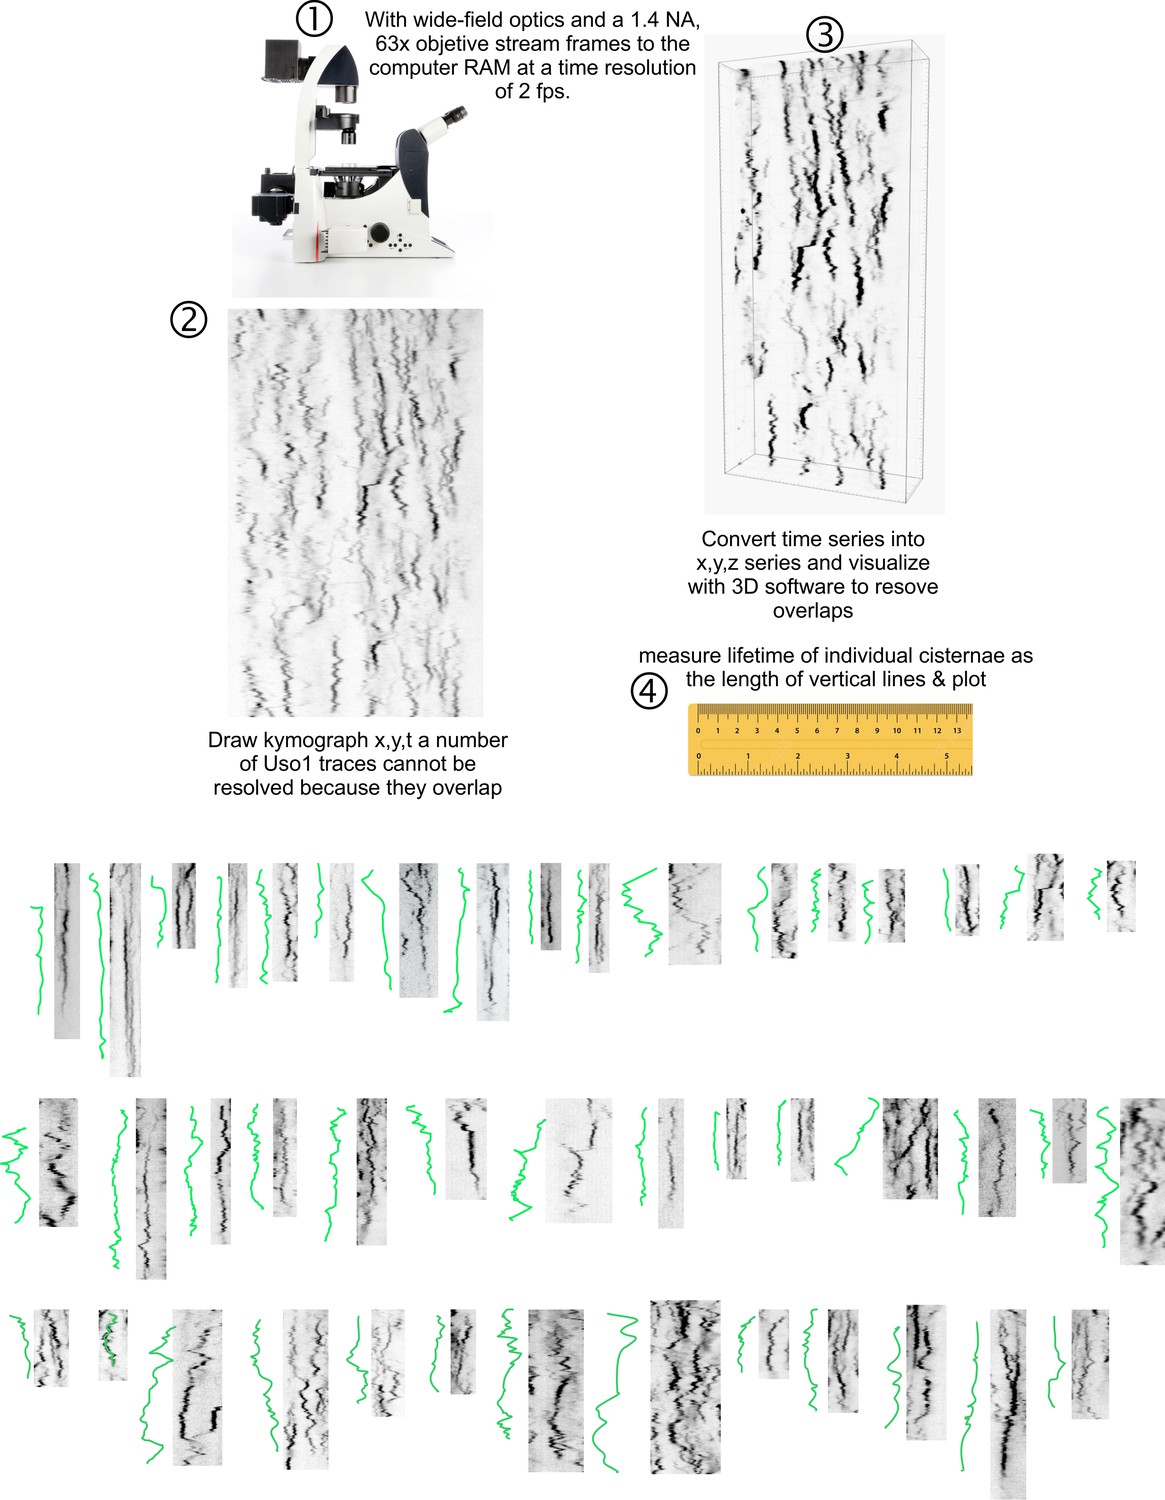
Methodology for tracking the half-life of Uso1-GFP on punctate structures.
3D movies were acquired by streaming pictures to the computer RAM at 2 fps. Appropriate reduction of excitation light intensity permitted the acquisition of 400 frames without apparent phototoxicity. The behavior of punctate structures over time was represented in kymographs, in which vertical lines represent the time of residence of Uso1 on membranes. (3). As vertical lines frequently overlapped, jeopardizing the quality of this analysis, we imported the time series into a 3D viewer as if they were (x, y, z) series. Rotation across the different axes facilitated unambiguous tracking of the trajectories across time. (4). The length of the trajectories was measured and converted to time units. Bottom graphs display examples of time trajectories.
Figure 5

Uso1 puncta do not colocalize with ER exit sites (ERESs).
(A). Low extent co-localization of Sec13 ERES and Uso1 structures. Z-stacks for the two channels were acquired simultaneously, deconvolved, and represented as maximal intensity projections (MIPs). Two rare examples of colocalization are arrowed. (B). Photograms of a dual channel Z-stack with a Sec13-labeled nuclear envelope focused in the middle plane, illustrating that while some puncta show colocalization, the red Sec13 signal, and the green Uso1 signal do not usually overlap. (C). A MIP of the same z-stack showing orthogonal views with some overlapping puncta (arrows). (D). A ts mutation in the sarA gene encoding the SarASar1 GTPase governing ER exit markedly reduces the number of Uso1-GFP puncta upon shifting cells to restrictive conditions. Box-and-whisker plots: Statistical comparison was made using one-way ANOVA with Dunn’s test for multiple comparisons. Whiskers are in Tukey’s style: Only significant differences were indicated, using asterisks.
Figure 6
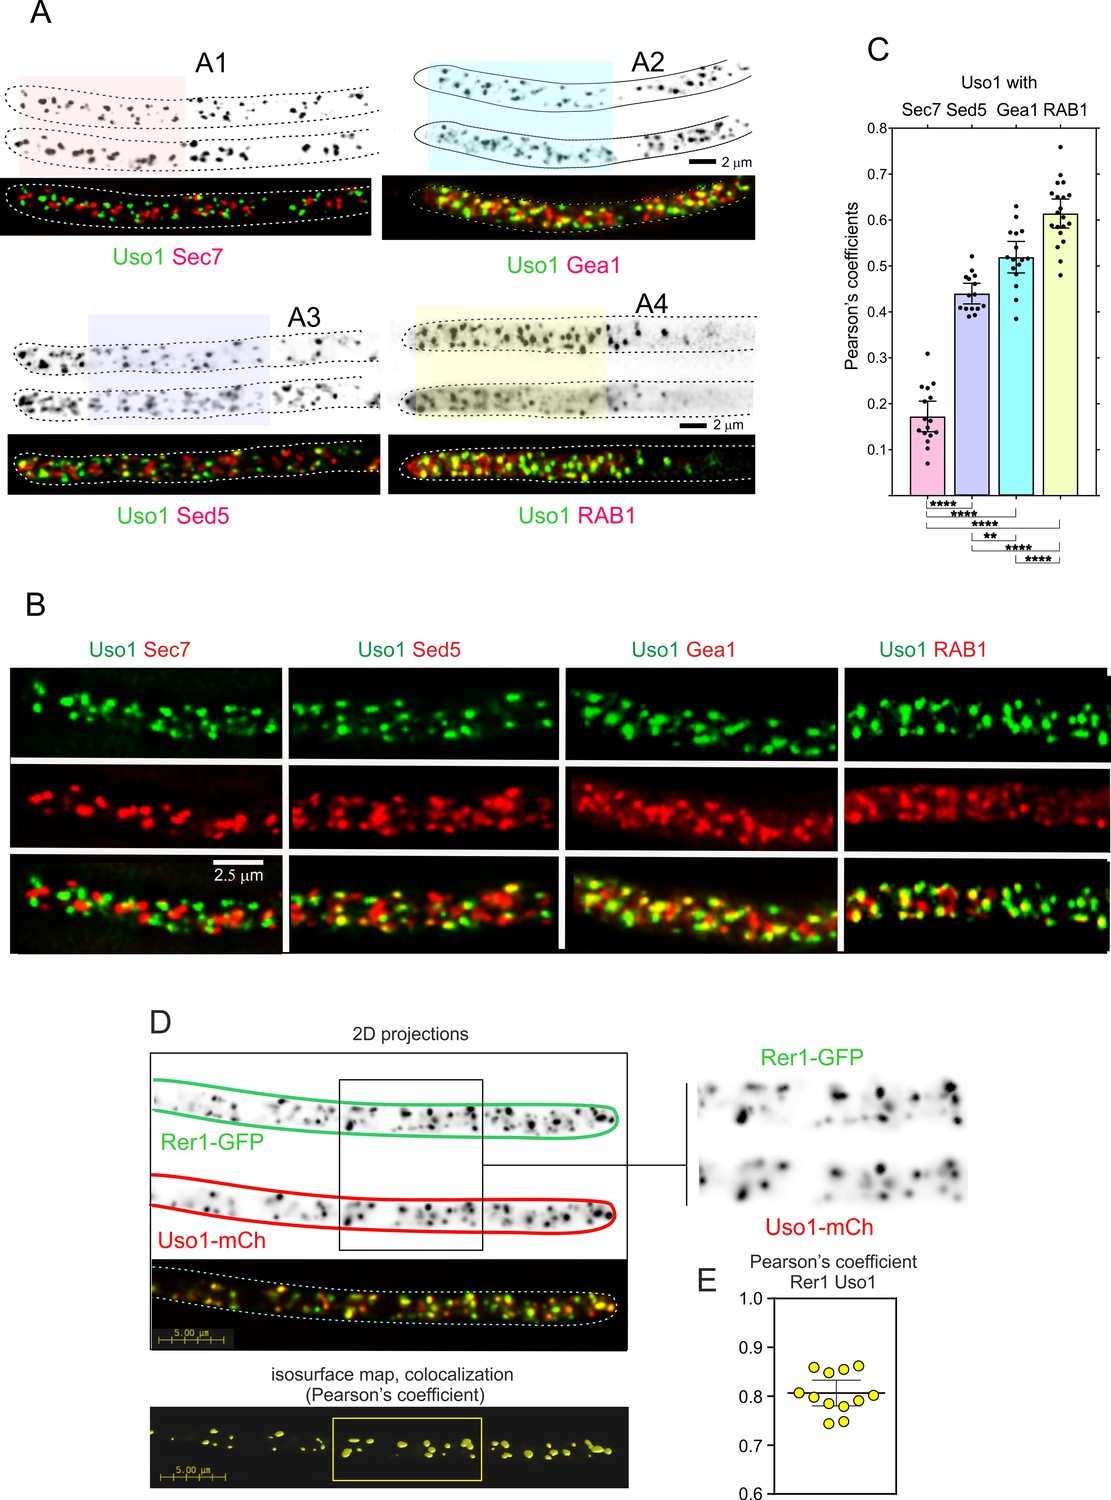
Uso1 localizes to Rer1-containing Golgi cisternae.
(A). Tip cells showing Uso1 colocalization with the indicated subcellular markers. Images are maximal intensity projections (MIPs) of deconvolved Z-stacks. (B). Magnified images of the color-coded shaded regions of the cells shown in A. (C). Pearson’s coefficients of the different combinations. (D) Gray scale: MIPs of deconvolved z-stacks of the individual Rer1-GFP and Uso1-mCh channels, with their merge at the bottom. The boxed section of the channels is magnified on the right. The bottom shows a yellow isosurface map corresponding to the regions with high Pearson’s coefficient (constructed with Huygens software). (E) Pearson’s coefficient in n=12 cells. Error bars indicate 95% CI.
Figure 7
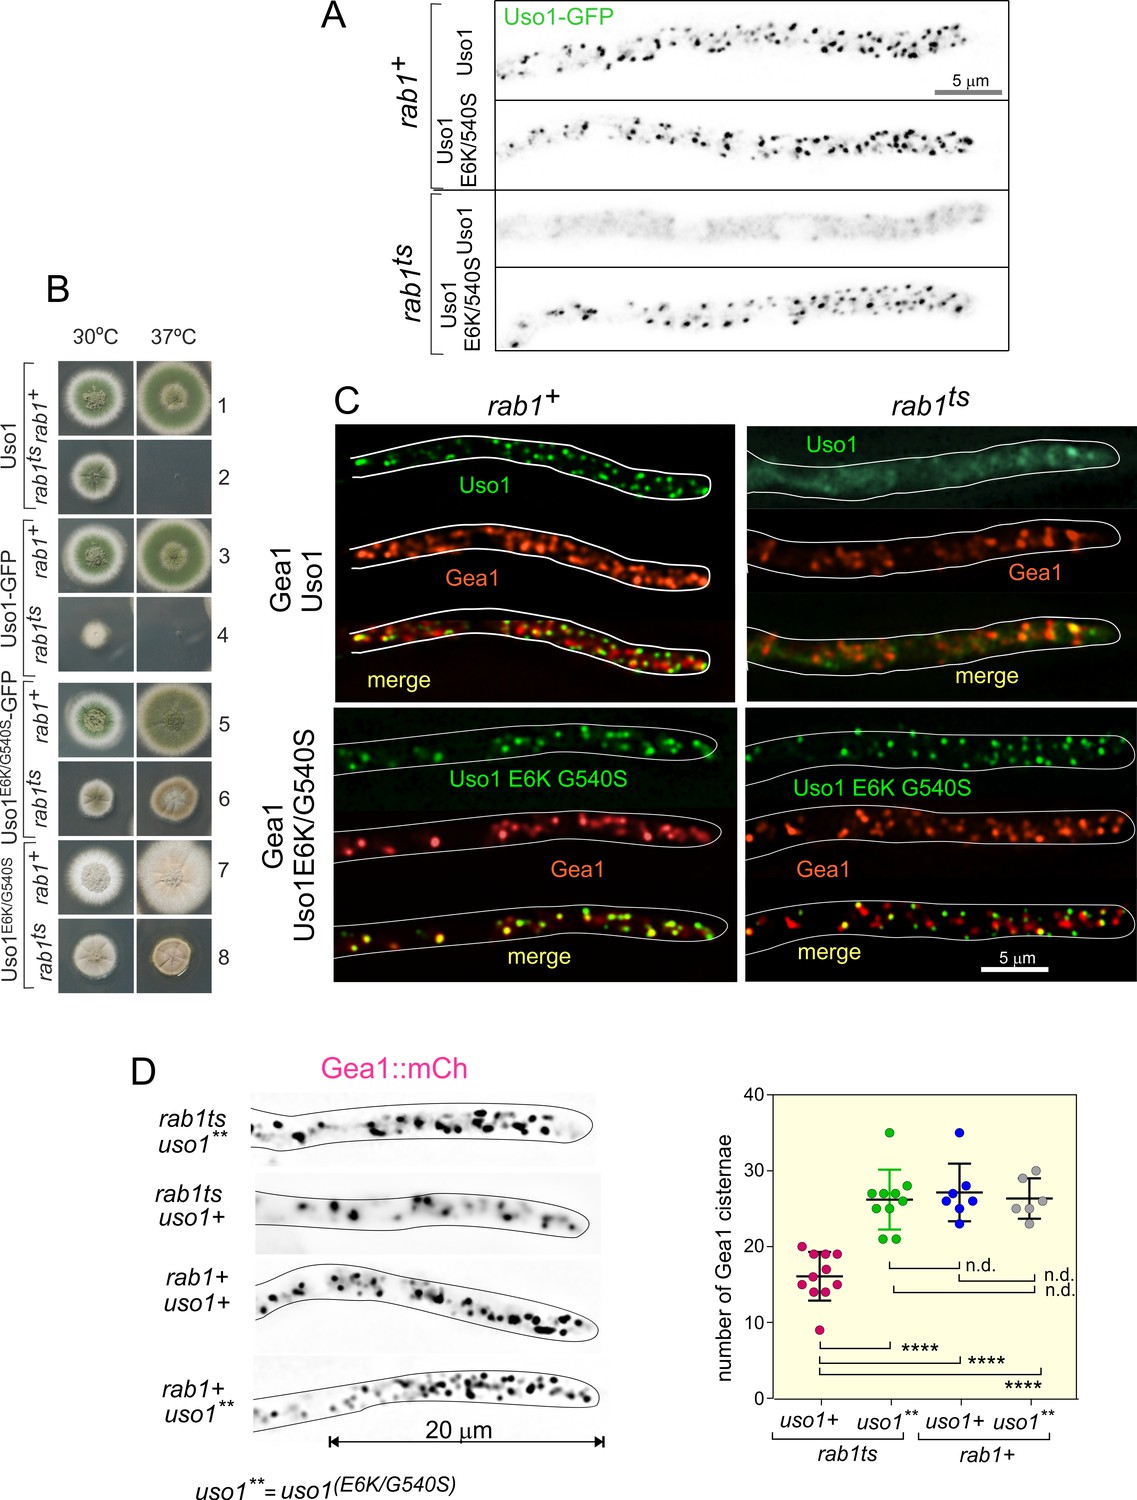
Uso1 localization to punctate structures is dependent on RAB1.
(A). Complete de-localization of Uso1-GFP to the cytosol by rab1ts and relocalization by E6K/G540S. (B). Uso1-GFP and rab1ts show a synthetic negative interaction that is rescued by the E6K/G540S double substitution. Strains in lanes 7 and 8 carry the wA2 mutation resulting in white conidiospores. (C) In rab1ts cells, punctate Uso1-GFP structures largely disappear, correlating with Golgi disorganization (GeaA/Gea1-mCh, see text). The presence of E6K/G540S relocalizes Uso1-GFP to puncta and restores Golgi organization. (D) Representative images (maximal intensity projections(MIPs) of deconvolved Z-stacks) of hyphae used to quantify the number of cisternae within the apex-proximal 20 µm. Datasets were compared by one-way ANOVA with Tukey’s multiple comparison test. Error bars represent S.D.
Figure 8 with 1 supplement
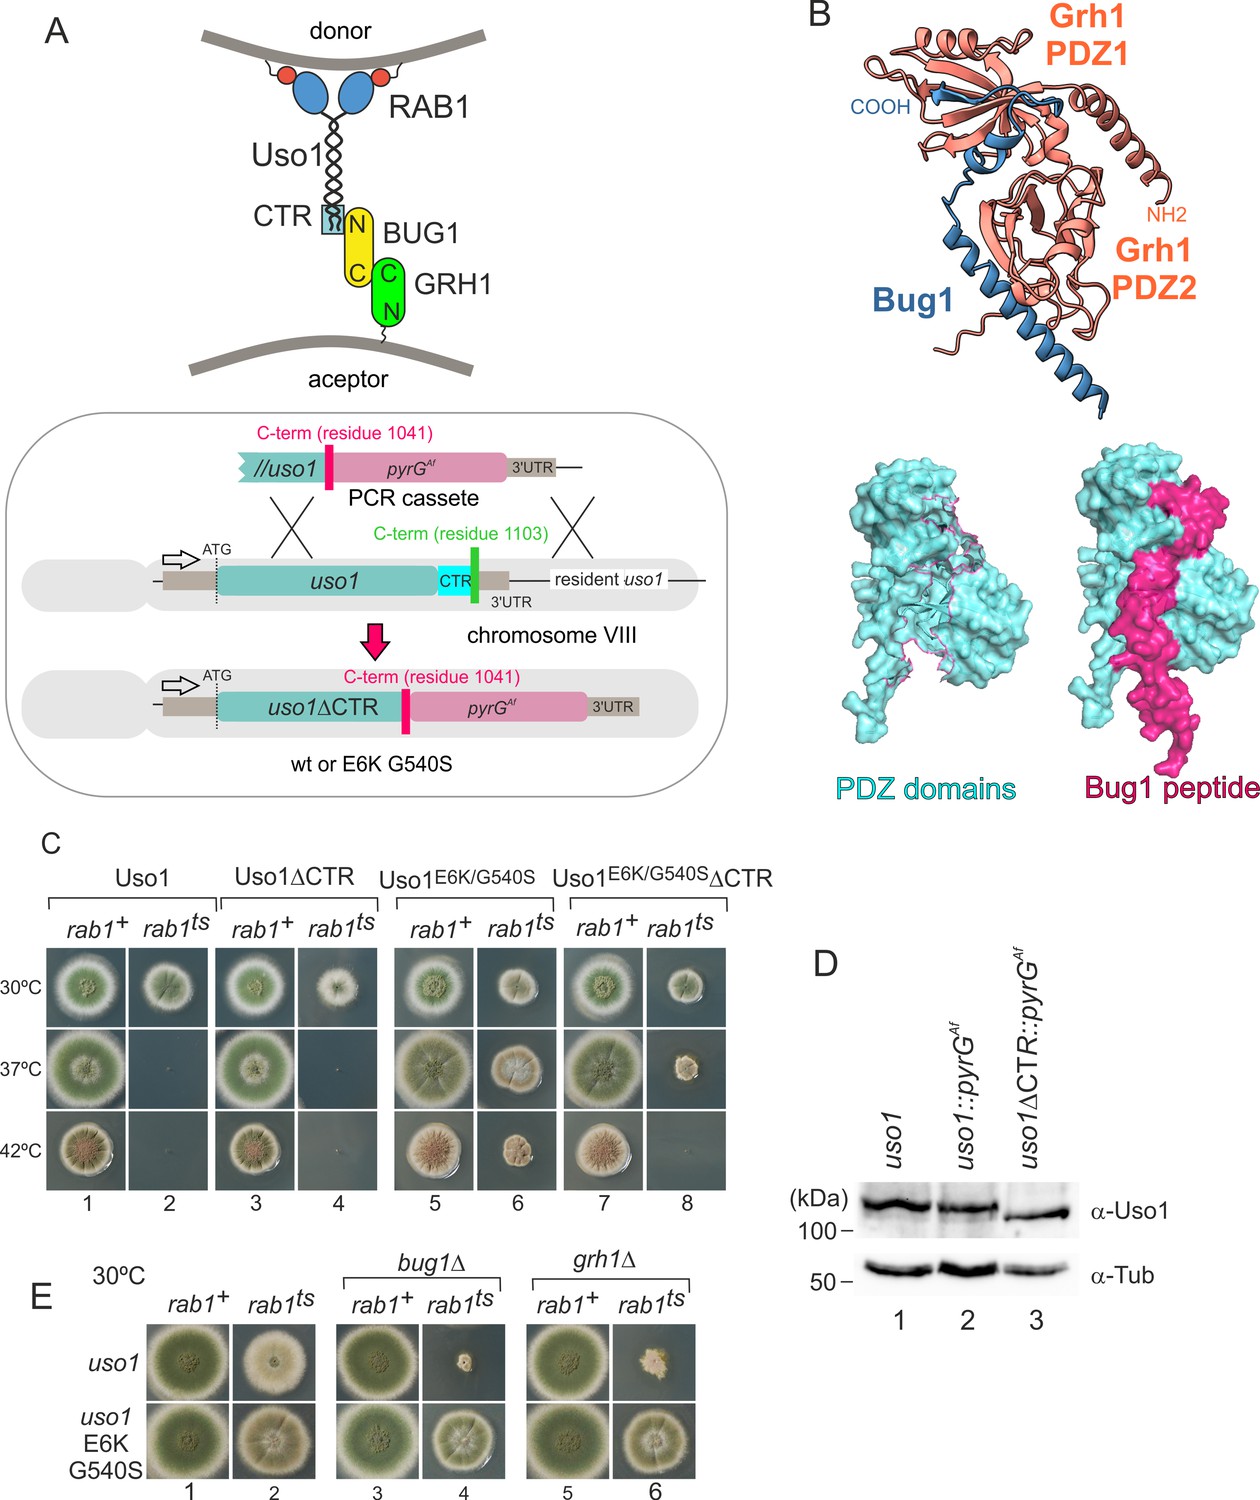
Genetic evidence shows that the C-terminal region (CTR) region of Uso1 contributes to its recruitment to membranes.
(A). Top, scheme of the predicted interactions. Bottom, engineering a gene-replaced allele lacking the CTR domain by homologous recombination. (B). The Bug1 C-terminal residues fit into the groove formed between the two Grh1 PDZ domains and into the pocket of the N-terminal PDZ domain (PDZ1). (C). A gene-replaced uso1∆CTR allele encoding a protein truncated for the CTR domain shows a synthetic negative interaction with rab1ts. (D). Western blot analysis. Removal of the CTR does not result in Uso1 instability. (E). bug1∆ and grh1∆ show a synthetic negative interaction with rab1ts that is rescued by the double E6K/G540S substitution in Uso1.
-
Figure 8—source data 1
Raw images for western blots in panel D and uncropped pictures with used exposures and regions indicated.
- https://cdn.elifesciences.org/articles/85079/elife-85079-fig8-data1-v2.zip
Figure 8—figure supplement 1
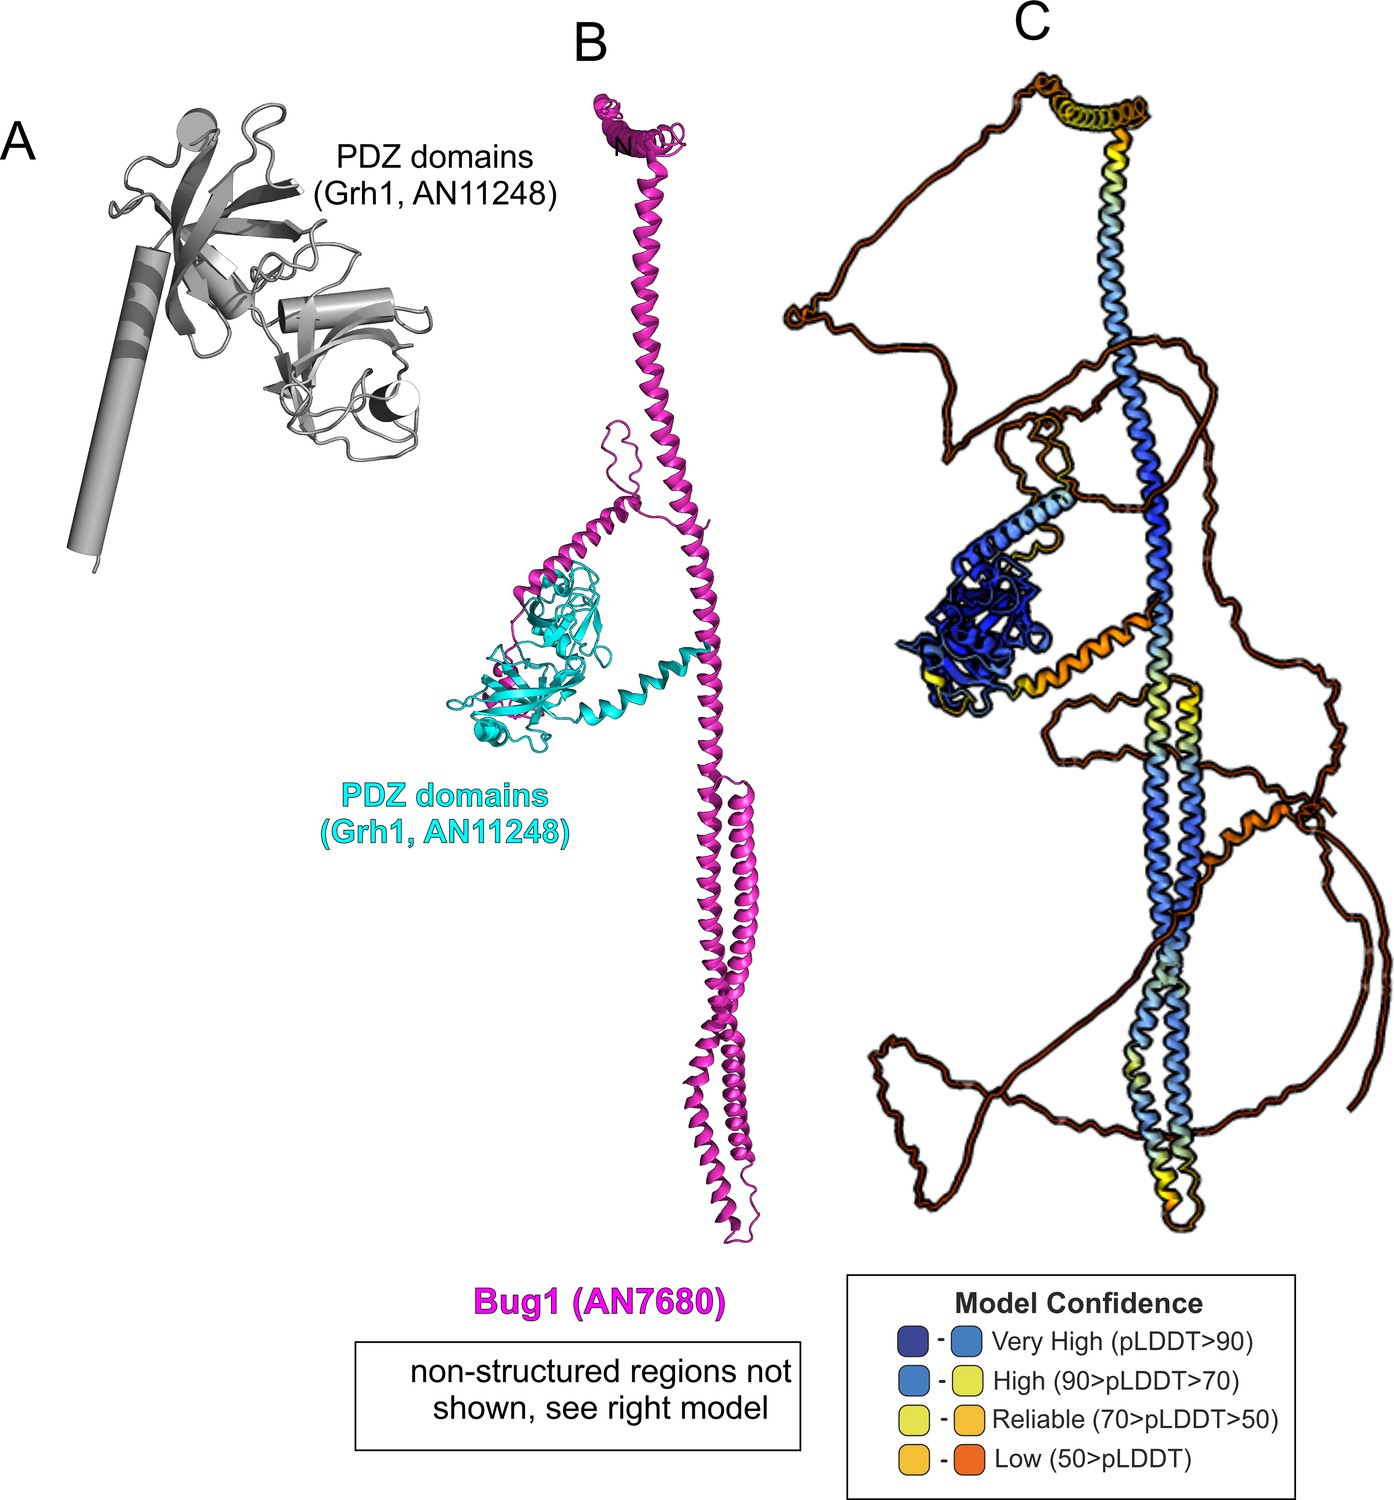
AlphaFold2 modeling of Grh1-Bug1.
(A). Cartoon, with α-helices shown as cylinders, of the nearly N-terminal PDZ domains of Grh1. (B). AlphaFold 2 prediction of a 1:1 Grh1-Bug1 complex, trimmed of disordered regions. (C). complete AlphaFold2 model of Grh1-Bug1 with color-coded model confidence values.
Figure 9
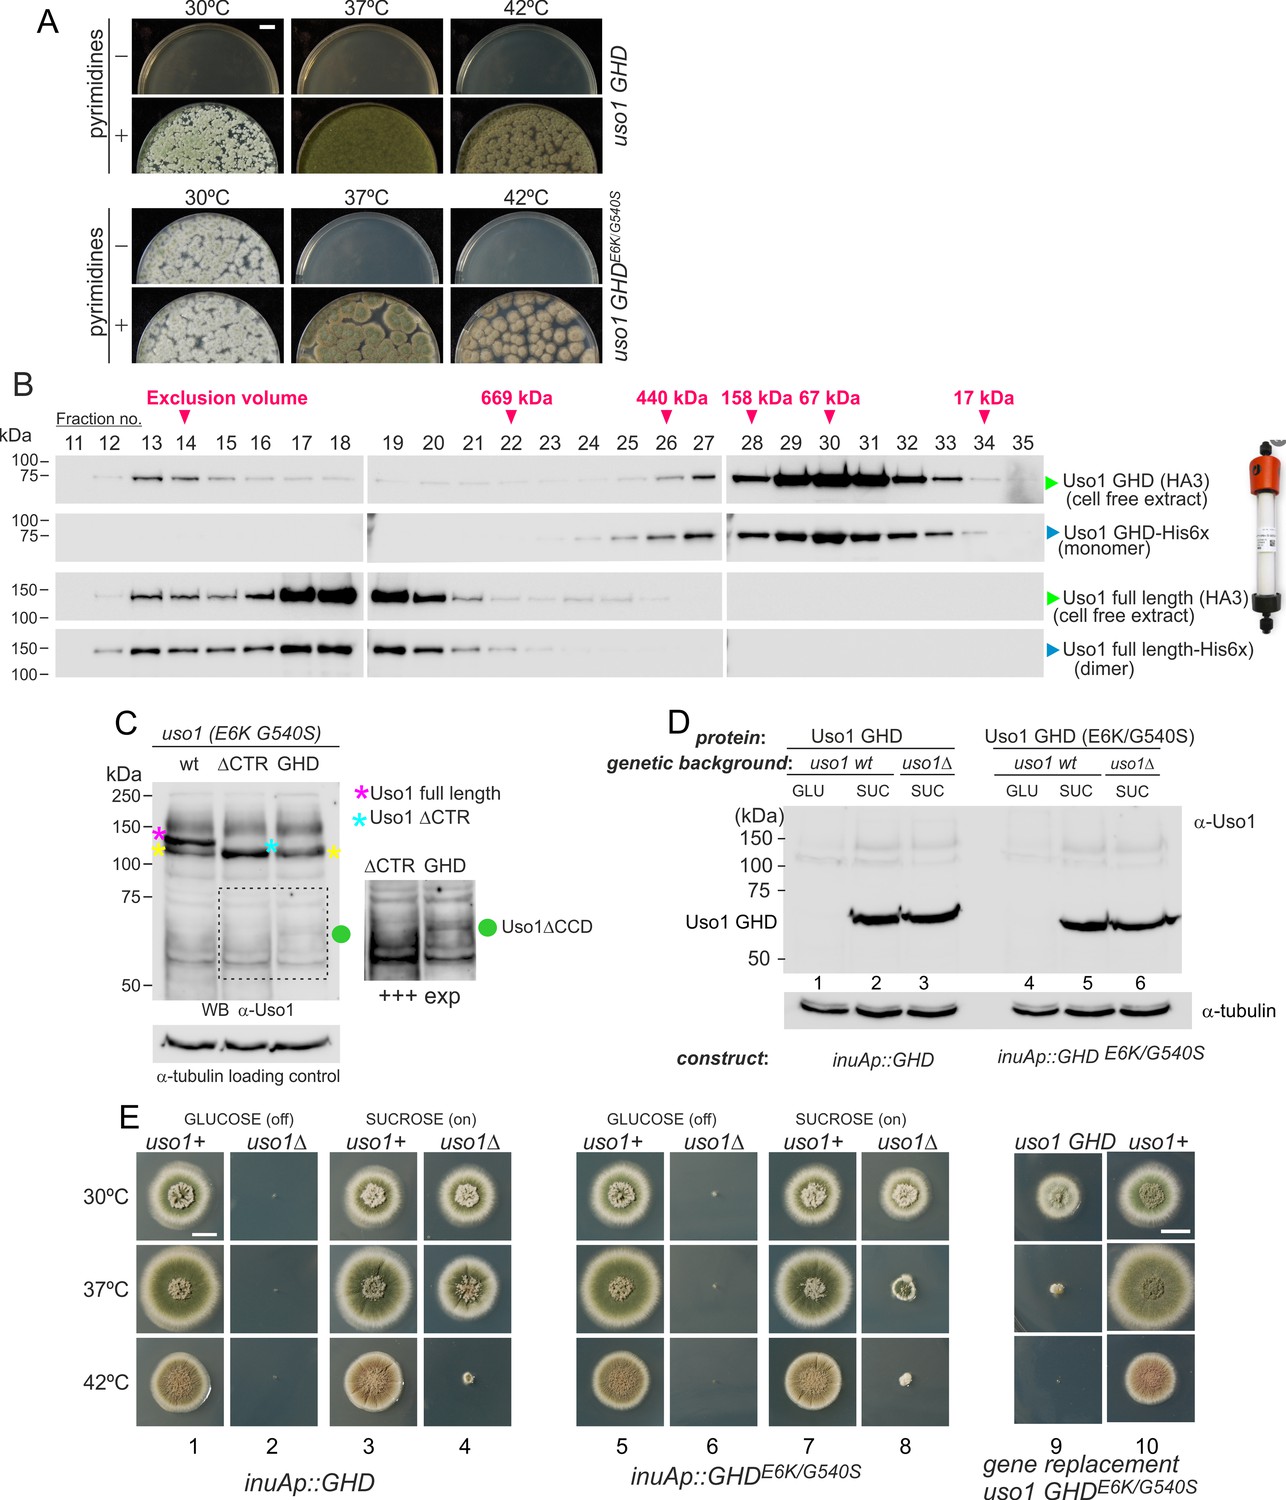
The globular-head-domain (GHD) of Uso1 is sufficient to support cell viability.
(A). Gene-replaced uso1GHD allele carrying the double E6K/G540S substitution is sufficient to rescue viability at 30 °C, but not at higher temperatures. (B). The Uso1 GHD is a monomer in cell extracts. Fractions collected from Superose columns loaded with the indicated protein extracts and reference His-tagged proteins were collected and analyzed by western blotting with α-HA and α-His antibodies. (C) Truncating Uso1 after the GHD results in markedly reduced protein levels, as determined by α-Uso1 GHD western blotting. The band (yellow asterisks) moving slower than Uso1 (magenta asterisk) and at nearly the same position as Uso1 ∆CTR (blue asterisk) represents cross-reacting contaminants unrelated to Uso1. The right panel shows a longer exposure for the indicated region, to reveal the faint GHD band (green dot). (D). Overexpression of wild-type and E6K/G540S mutant GHD, under the control of the inuA promoter, which is turned off on glucose and induced on sucrose. Western blots reacted with α-Uso1 GHD antiserum. (E). Overexpressed GHD, be it E6K/G540S or wild-type, as the only source of Uso1 supports viability.
-
Figure 9—source data 1
For panels B, C, D; raw images for western blots and uncropped pictures with used exposures and regions indicated.
- https://cdn.elifesciences.org/articles/85079/elife-85079-fig9-data1-v2.zip
Figure 10
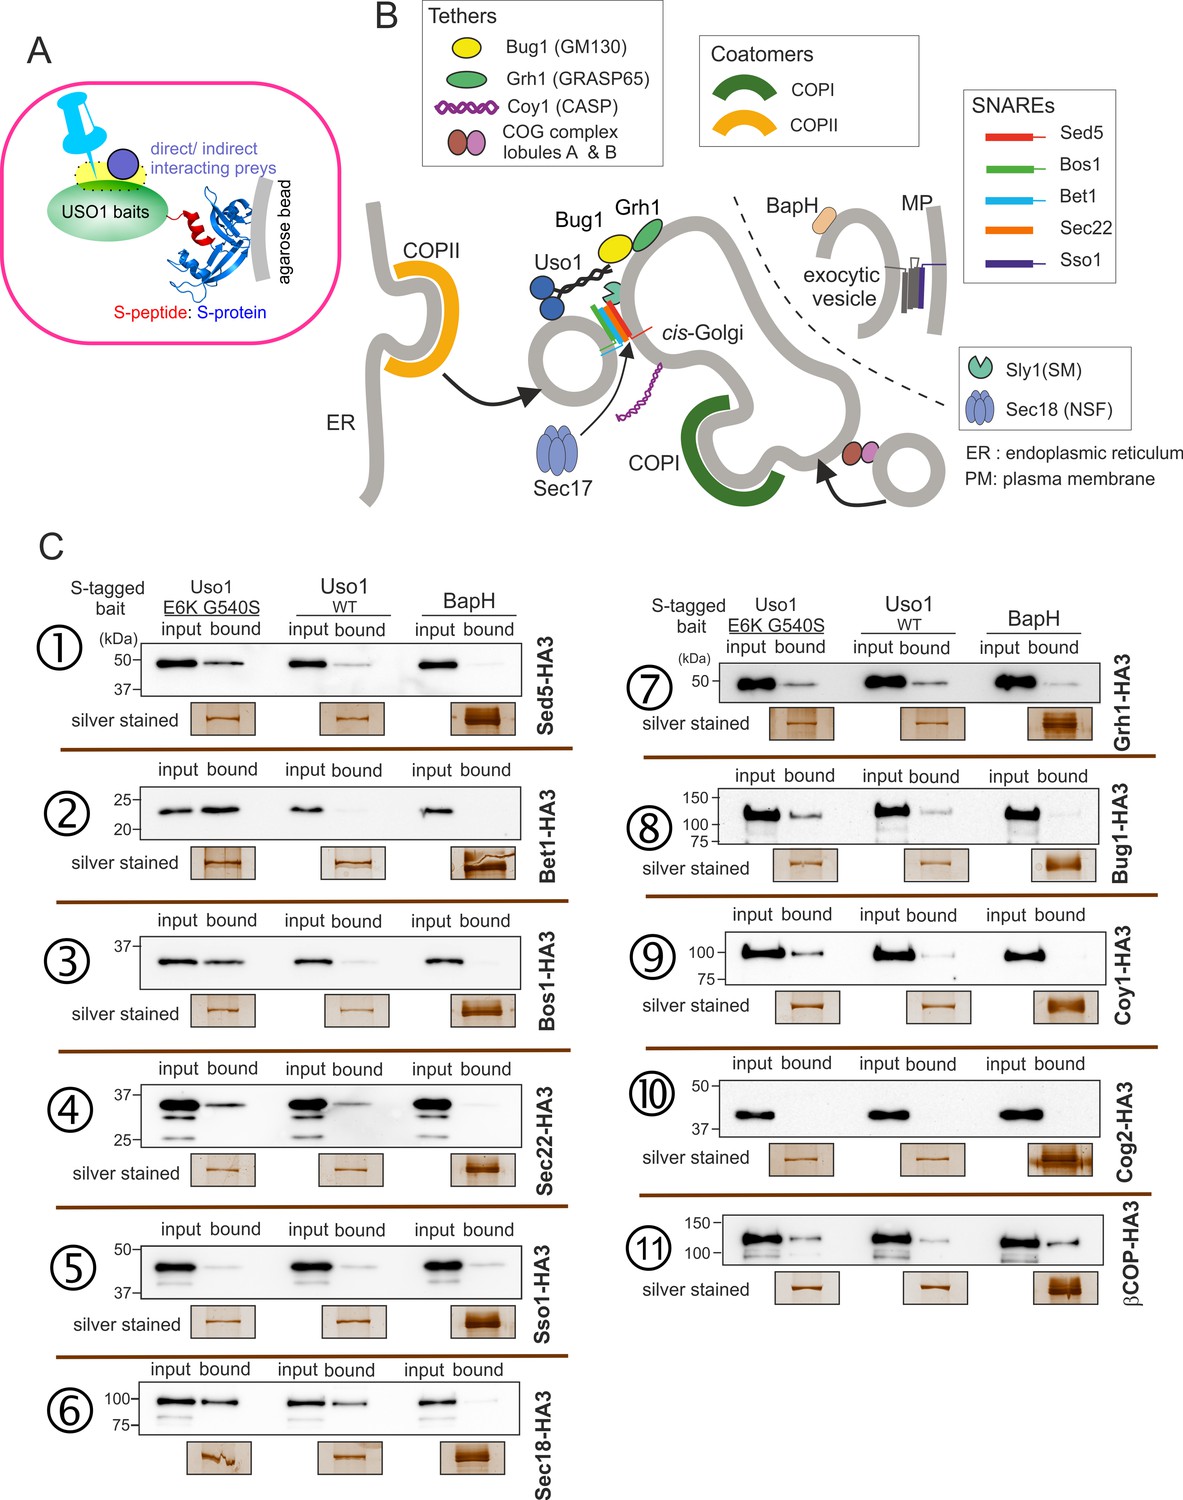
Screening the preferential association of proteins acting in the ER/Golgi interface with E6K/G540S Uso1.
(A) S-tagged baits (Uso1, wt, and E6K/G540S, and the unrelated protein BapH), expressed after gene replacement, were captured with their associated polypeptides on S-protein agarose beads. Candidate associates, also expressed after gene replacement, were tagged with HA3. (B) Schematic depiction of the proteins listed in these experiments showing their sites of action. (C). Anti-HA3 western blot analysis of the indicated S-bait and HA3-prey combinations. Equal loading of Uso1 proteins was confirmed by silver staining of precipitates. Note that BapH, chosen as a negative control, is expressed at much higher levels than Uso1 proteins. Each panel is a representative experiment of three experimental replicates.
-
Figure 10—source data 1
Raw images for western blots and silver-stained gels and uncropped pictures with used exposures and regions indicated.
- https://cdn.elifesciences.org/articles/85079/elife-85079-fig10-data1-v2.zip
Figure 11 with 1 supplement
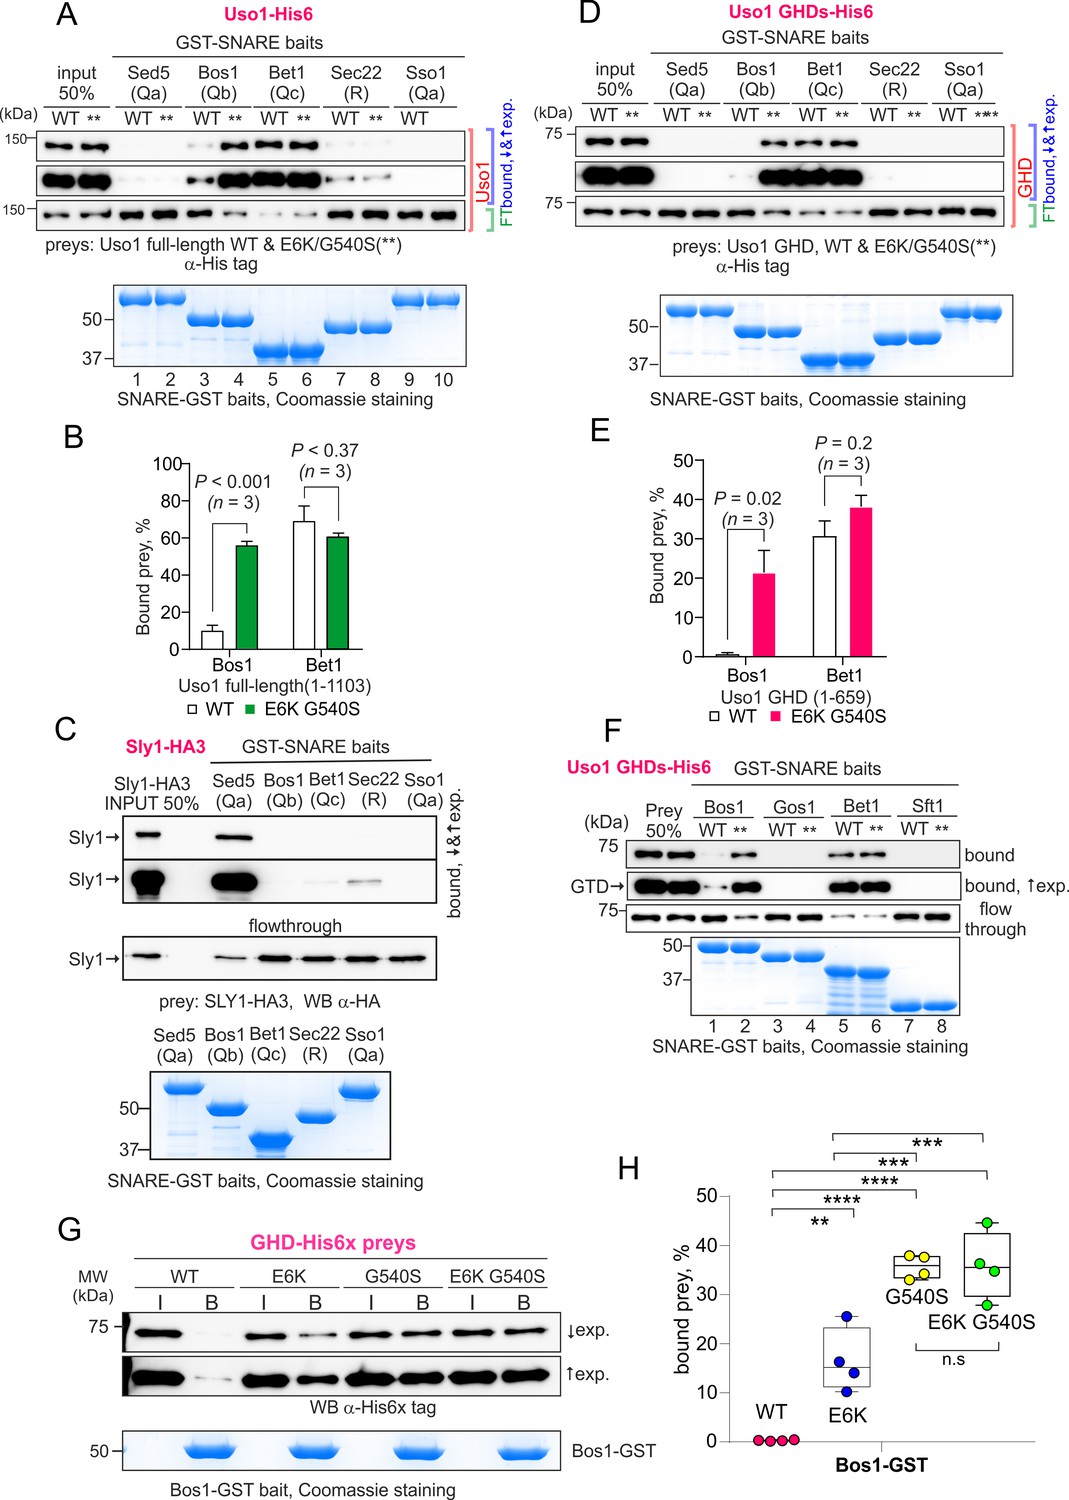
The Uso1 globular-head-domain (GHD) interacts directly with Bos1 and Bet1 SNAREs acting in the ER/Golgi interface.
(A). Purified fusion proteins in which the complete cytosolic domains of the indicated SNAREs have been fused to GST were used in pulldown experiments with His-tagged, purified wild-type and E6K/G540S Uso1. The plasma membrane Qa syntaxin Sso1 was used as a negative control. Pulled-down material was analyzed by anti-His western blotting. In this and other panels ↑exp. and ↓exp. indicate high and low exposure to the chemiluminescent western blots, respectively. (B) Quantitation of the above experiment; significance was determined by unpaired t-student tests. Error bars represent SEM. (C) As in (A), but using in vitro synthesized, HA3-tagged Sly1 as prey. Samples were analyzed by anti-HA western blotting. (D) As in (A), but using wild-type and mutant GHD as preys, rather than full-length Uso1. (E). Quantitation of the experiment in (D). (F). GST pull-down experiment comparing the ability of the GHD to interact with the early Golgi Qb and Qc SNAREs (Bos1 and Bet1), with that of their medial Golgi counterparts (Qb Gos1 and Qc Sft1). (G) Bos1-GST pull-down experiments comparing single E6K and G540S mutants with the double mutant. (I and B) represent input and bound fractions. (H) Percentage of the input prey that is retained by the Bos1-GST beads. Data were analyzed by one-way ANOVA with Tukey’s multiple comparisons. Whiskers indicate minimal and maximal values.
-
Figure 11—source data 1
Raw images for western blots and Coomassie-stained gels and uncropped pictures with used exposures and regions indicated.
- https://cdn.elifesciences.org/articles/85079/elife-85079-fig11-data1-v2.zip
Figure 11—figure supplement 1

AlphaFold2 prediction of the ER/Golgi SNARE bundle.
(A) Sec5/Bos1/Bet1/Sec22 predicted SNARE bundle. (B) Quality control (pLDDT, color-coded, and predicted aligned error (PAE)) of the model.
Figure 12 with 3 supplements
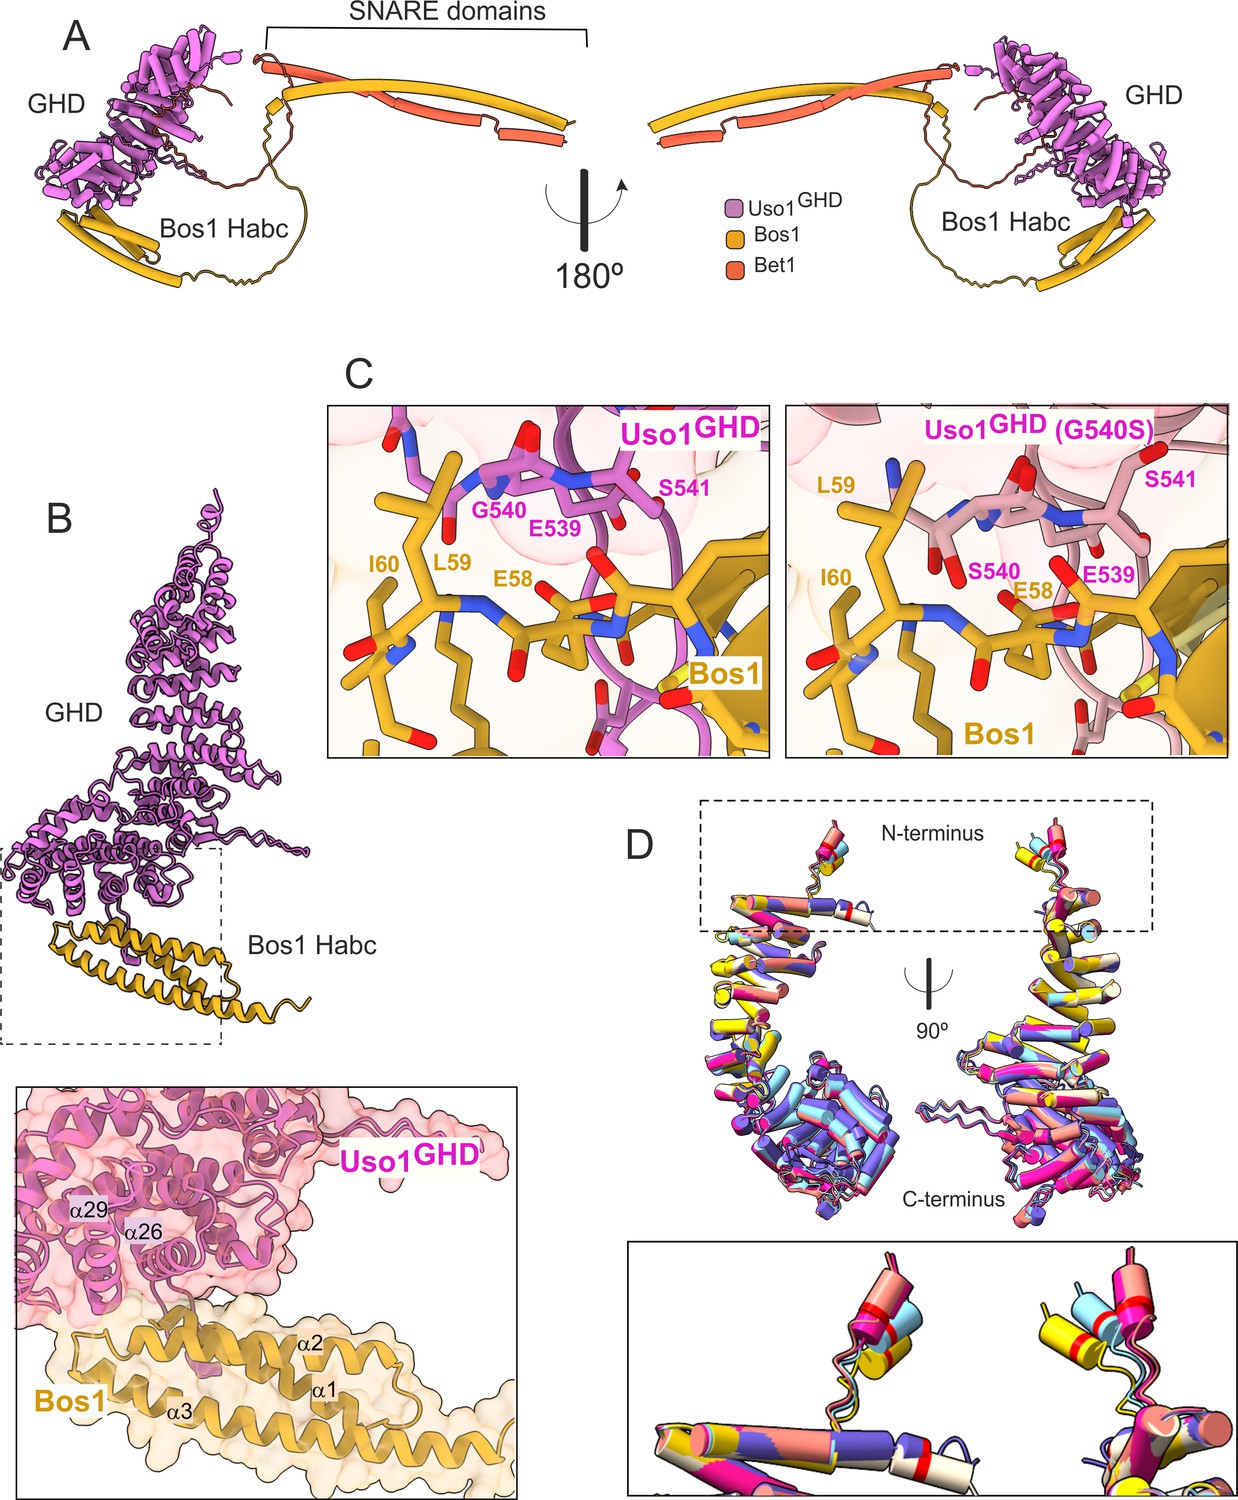
AlphaFold2 models provide insight into the mechanisms of suppression by E6K and G540S.
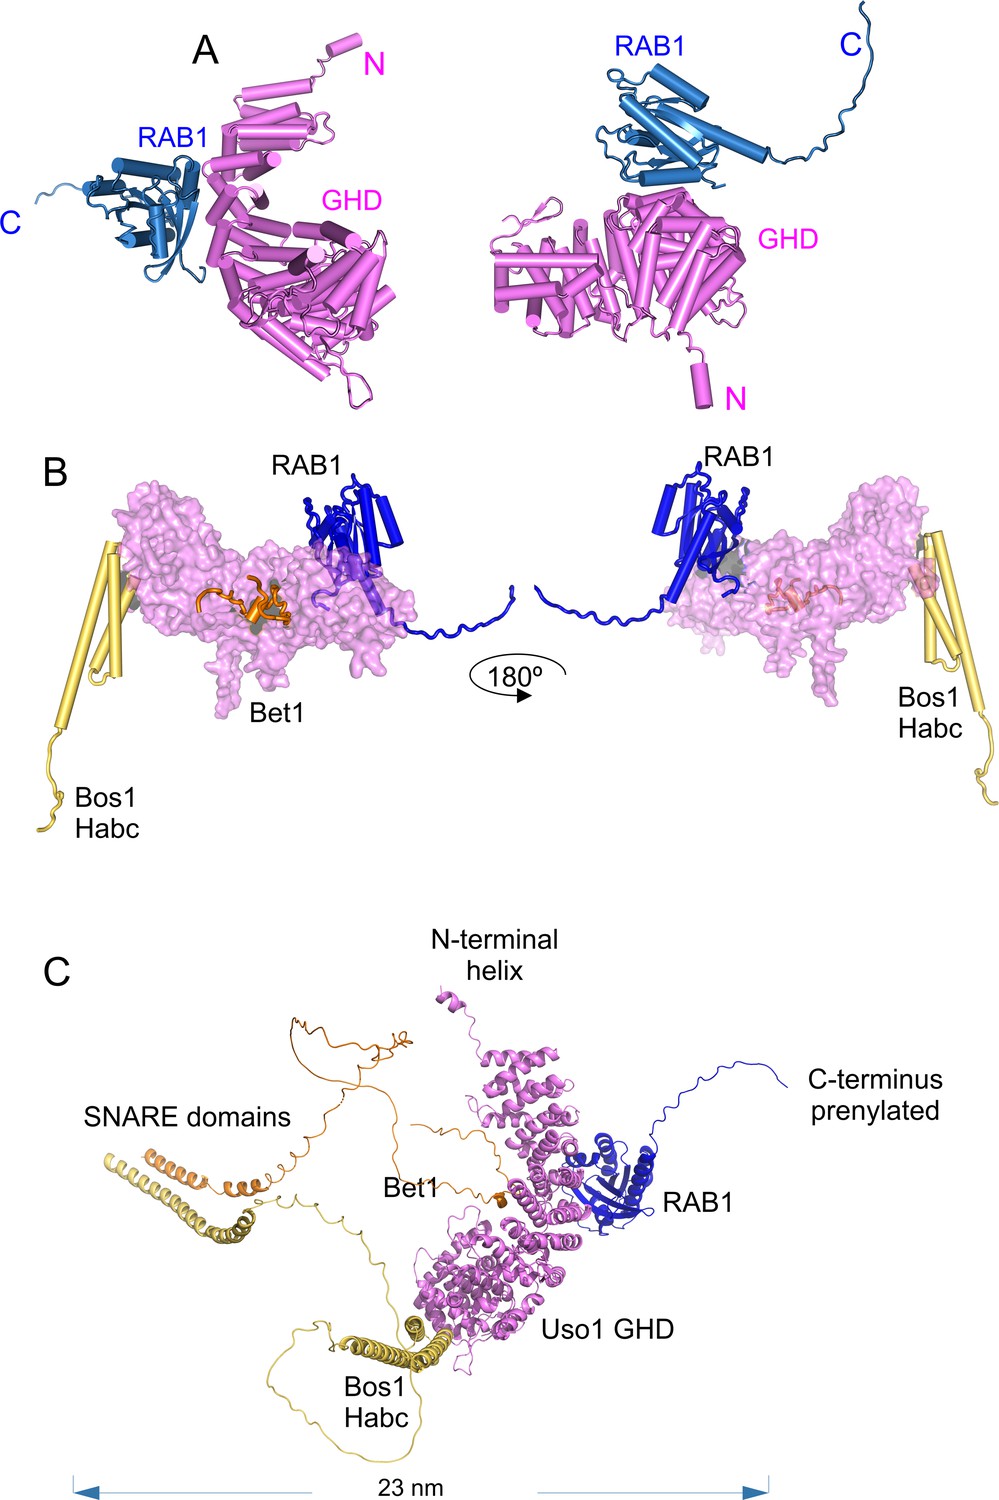
(A). Model of full-length Uso1 bound to the ER/Golgi SNAREs Bos1 and Bet1. (B). Top, ribbon representation of the Bos1 N-terminal Habc domain and Uso1 globular-head-domain (GHD). Bottom, Inset combining surface and ribbon depiction. (C). Increased binding of Bos1 to G540S Uso1 appears to involve the insertion of Ser540 into a pocket located in the Habc domain of the Qb SNARE. Partial view of the Bos1-Uso1 GHD surface of interaction in the wild-type (left) and mutant (right) models. G540 and S540 are annotated. (D). The N-terminal amphipathic α-helix of Uso1 comprising the E6K substitution lies within a flexible stretch of the protein that might facilitate its insertion into membranes. Alignment of six independent predictions, each depicted in a different color, with Glu6 highlighted as a red collar surrounding the cylinders of the N-terminal α-helix. The Uso1 GHD was modeled alone, in a complex with SNARE proteins or with Ypt1. The N-terminal α-helix (boxed) adopts different positions, suggesting high flexibility.
Figure 12—figure supplement 1
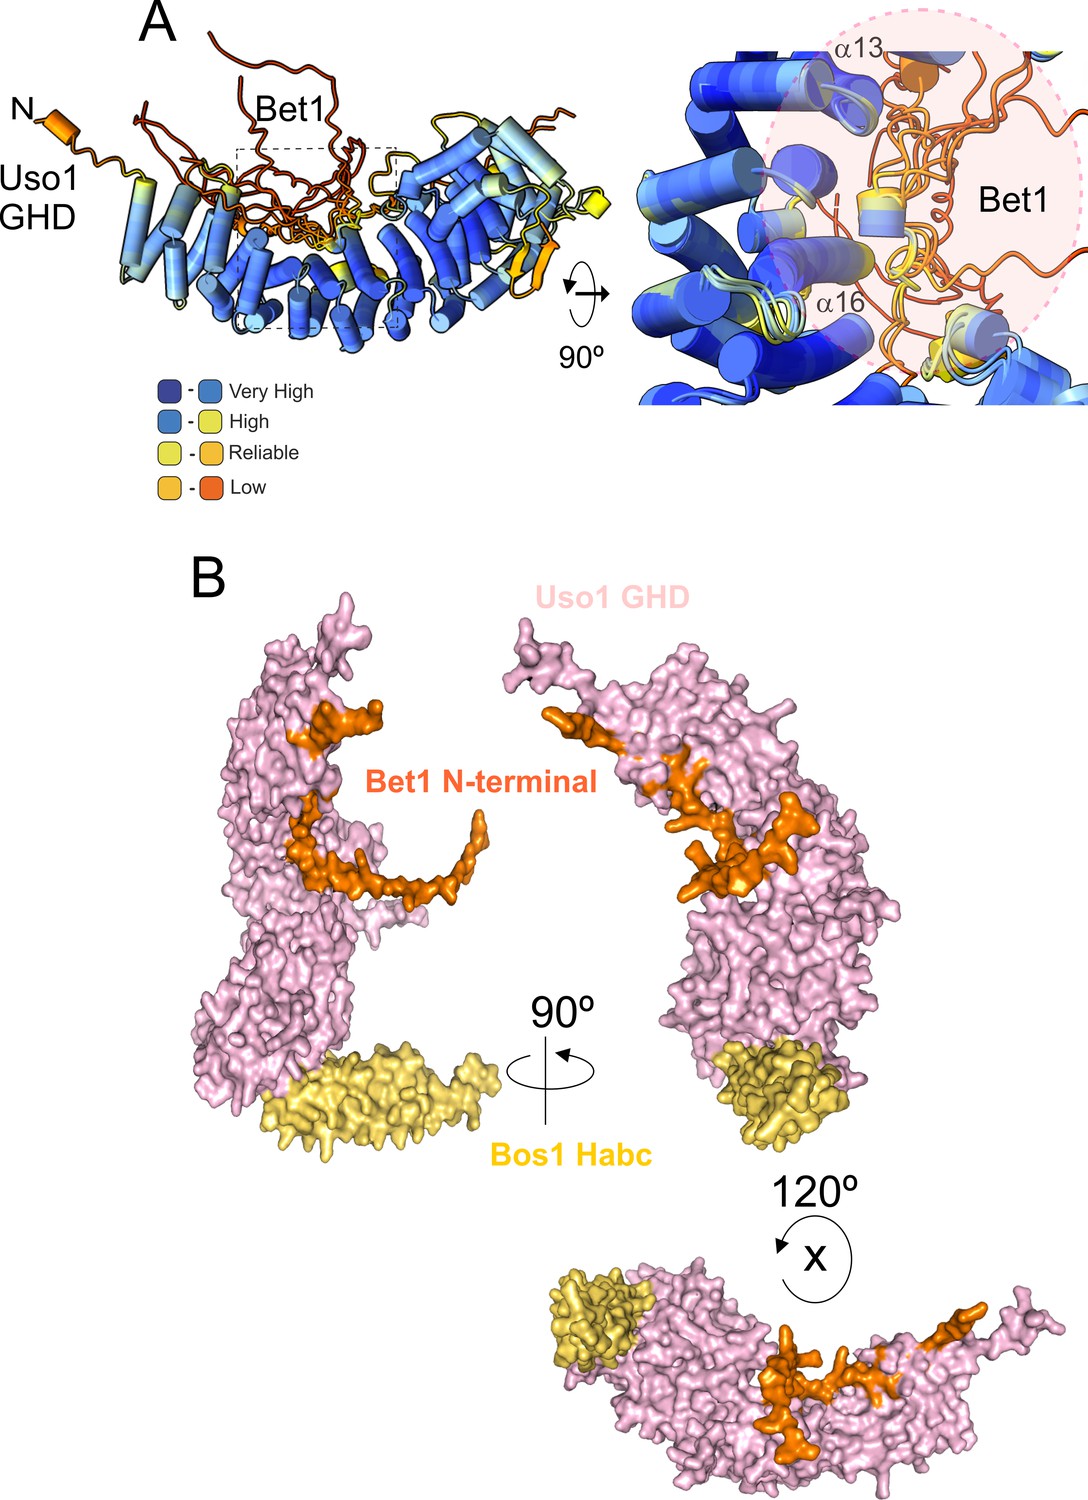
AlphaFold2 prediction of the Bet1-GHD interaction.
(A) The putative binding surface of Bet1 and Uso1 as determined by AlphaFold2. Top images, a cartoon of Bet1-GHD interactions, colored by pLDDT score. Alignment of four independent predictions involving the Bet1 N-terminal region and Uso1 globular-head-domain (GHD). A single model for Uso1 GHD is shown on the top representation for simplicity. In spite of the disordered nature of the N-terminal Bet1 region, the Bet1-Uso1 binding interface is consistent among models. (B) Bottom, surface representation of the N-terminal Bet1 region (orange) in complex with the GHD. Also indicated is the Habc domain of Bos1 (yellow) bound to the GHD.
Figure 12—figure supplement 2
AlphaFold 2 predictions of the RAB1 binding site on the Bet1/Bos1/Uso1 globular-head-domain (GHD) complex.
(A) cartoon representations of the AlphaFold 2-predicted GHD-RAB1 complex, depicted as pipes and planks. (B): Orthogonal views of the Uso1 GHD-RAB1-Bet1-Bos1Habc structural model. The Uso1 GHD is shown as a surface to emphasize the distant predicted binding sites of the Bos1 Habc domain, RAB1, and the Bet1 N-terminal region. (C): Ribbon representation of the model shown in C but including the full-length SNARE subunits, i.e., the GHD domain of Uso1, RAB1, and the SNARES Bet1 and Bos1. Proteins are in the correct orientation to connect membranes separated by 23 nm, counting from the SNARE TMDs to the prenylated RAB1 residues.
Figure 12—figure supplement 3
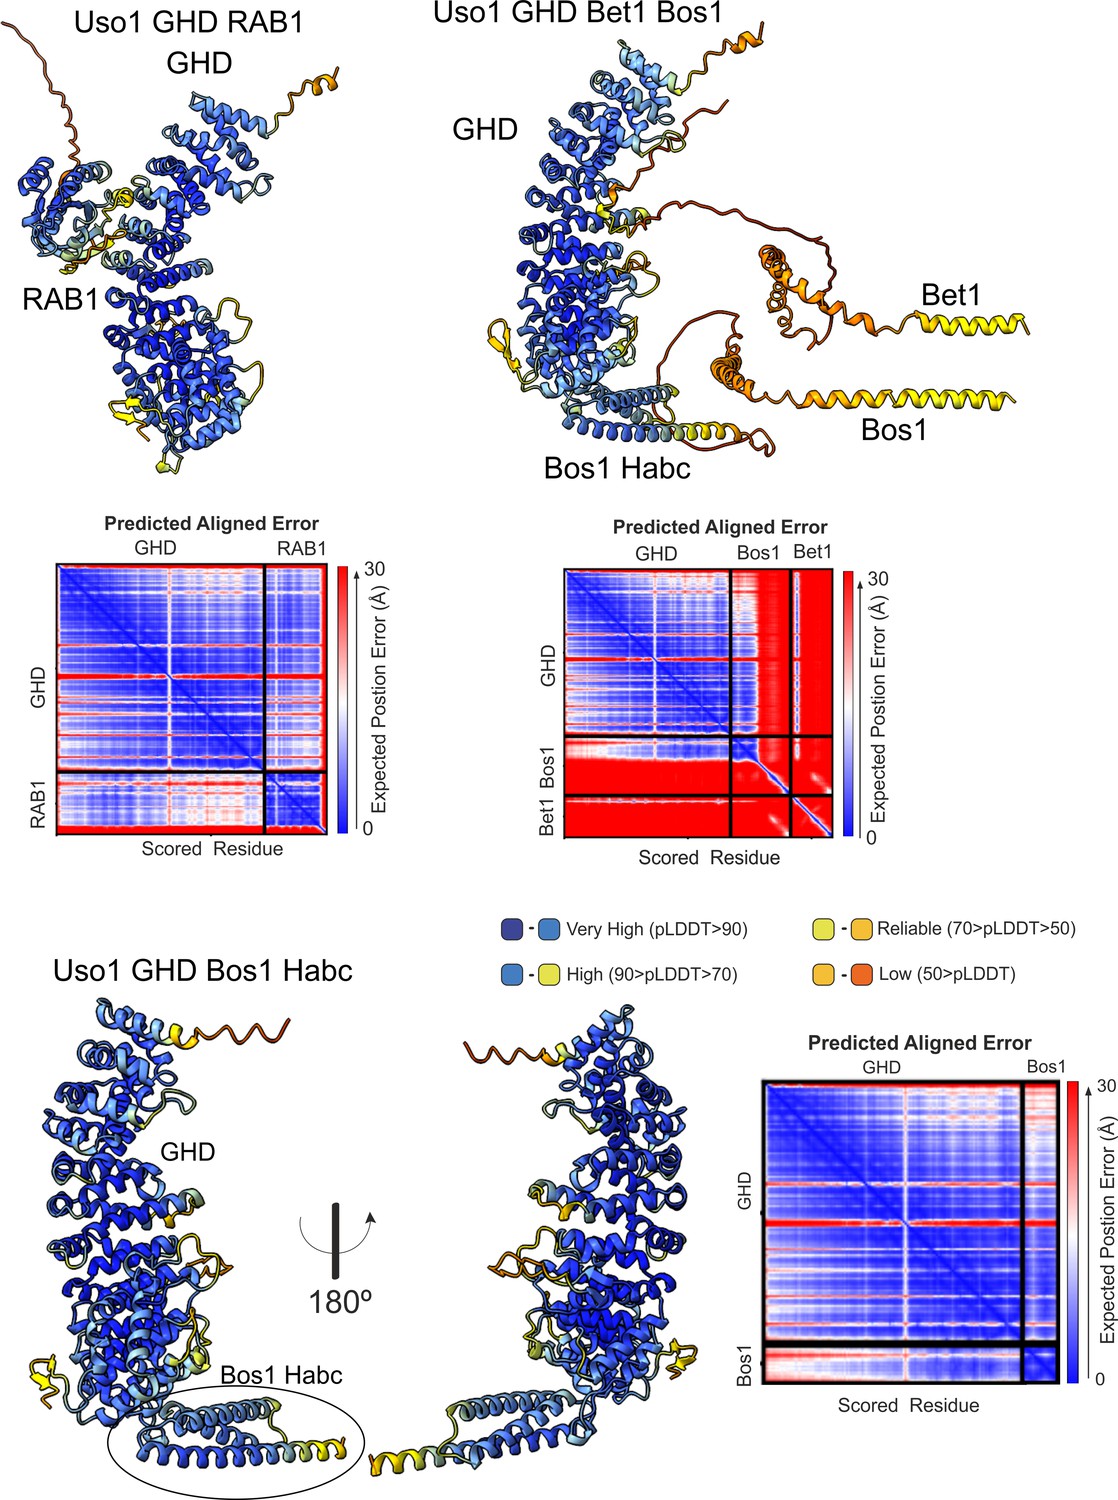
Quality control assessment of AlphaFold2 predictions for the indicated complexes.
Figure 13 with 2 supplements
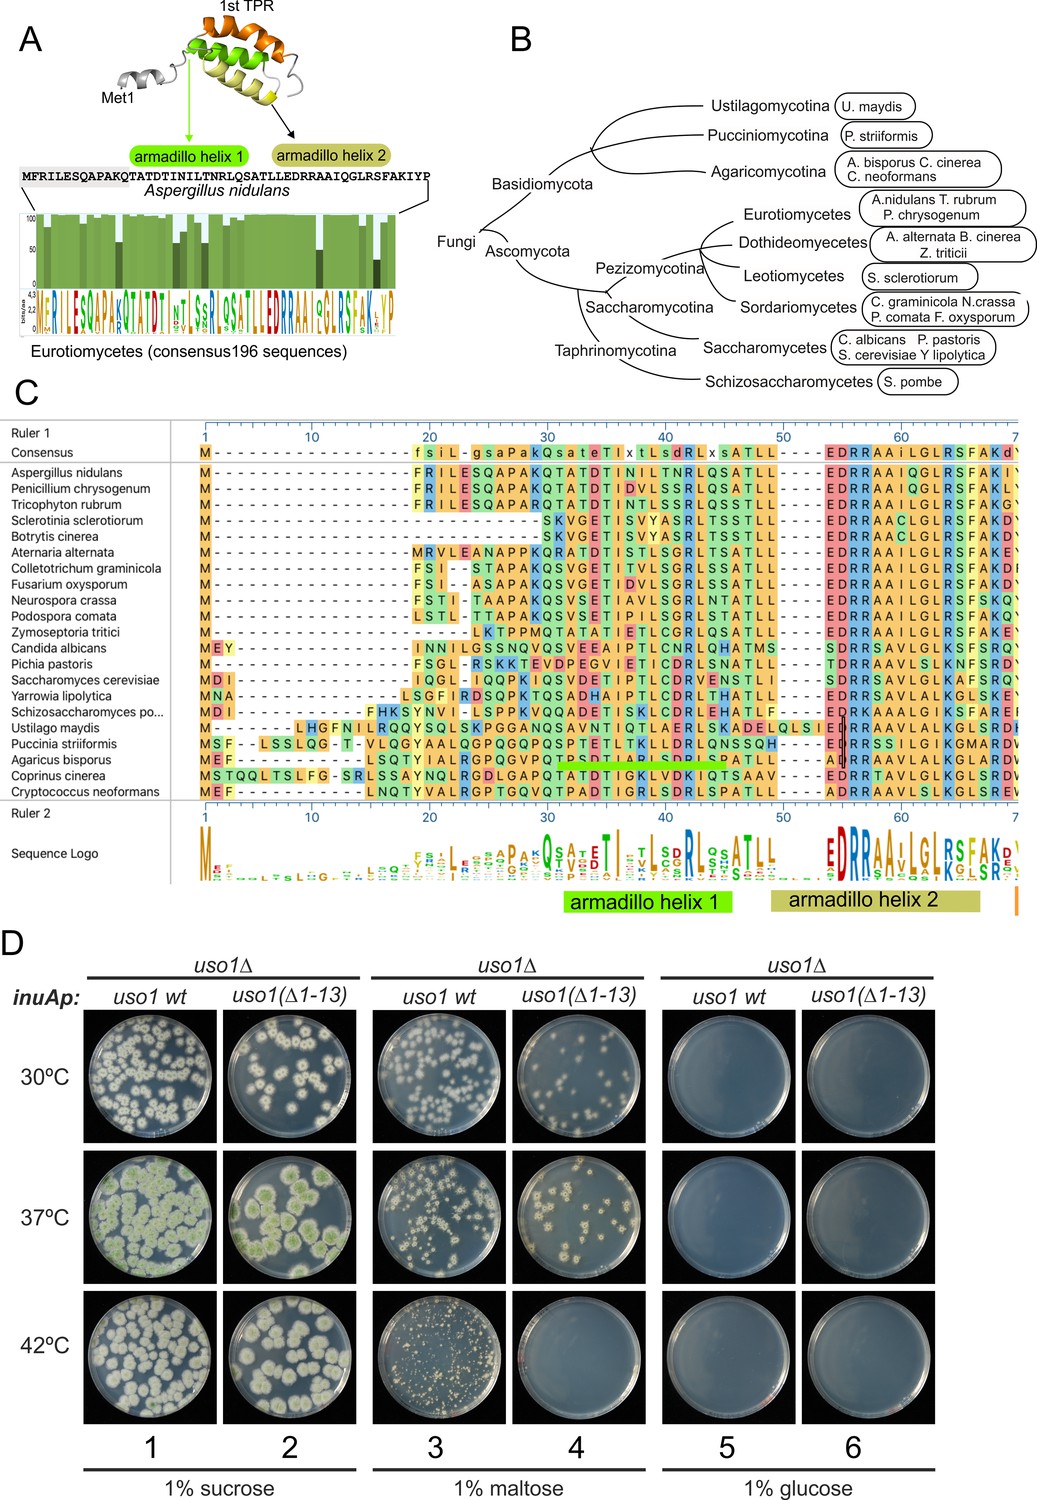
The N-terminal region of Aspergillus Uso1 containing Glu6 is required for full function.
(A) Sequence comparison of N-terminal regions up to the second helix of the first armadillo repeat including 196 Uso1 proteins of Eurotiomycetes available in https://fungidb.org/fungidb/app (B) Phylogenetic tree of the Fungi with the indication of species that were used for the alignment in panel (C). (C) Multiple sequence alignment of indicated Uso1 sequences, constructed with ClustalW and Mega Align Pro of the DNAstar package. (D) The 13 N-terminal amino acids of Uso1 are required for full function (see text and Figure 13—figure supplement 2).
Figure 13—figure supplement 1
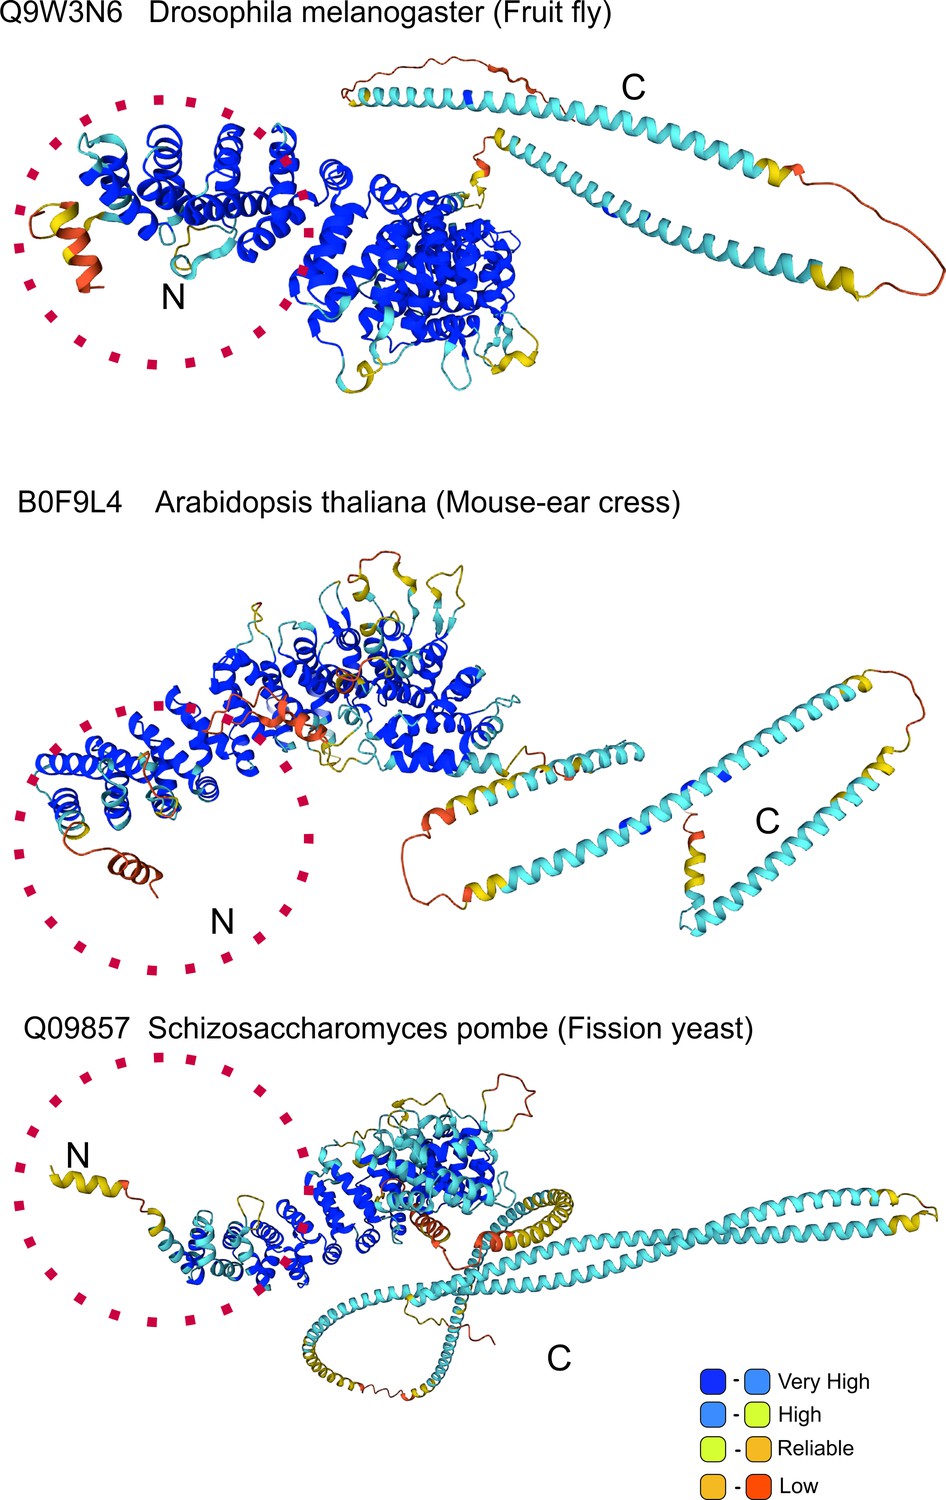
AlphaFold prediction of N-terminal helix: model organisms.
Alpha-Fold Uso1 structures of the indicated model organisms contain an N-terminal extension which includes a short α-helix akin to that detected in Aspergillus.
Figure 13—figure supplement 2
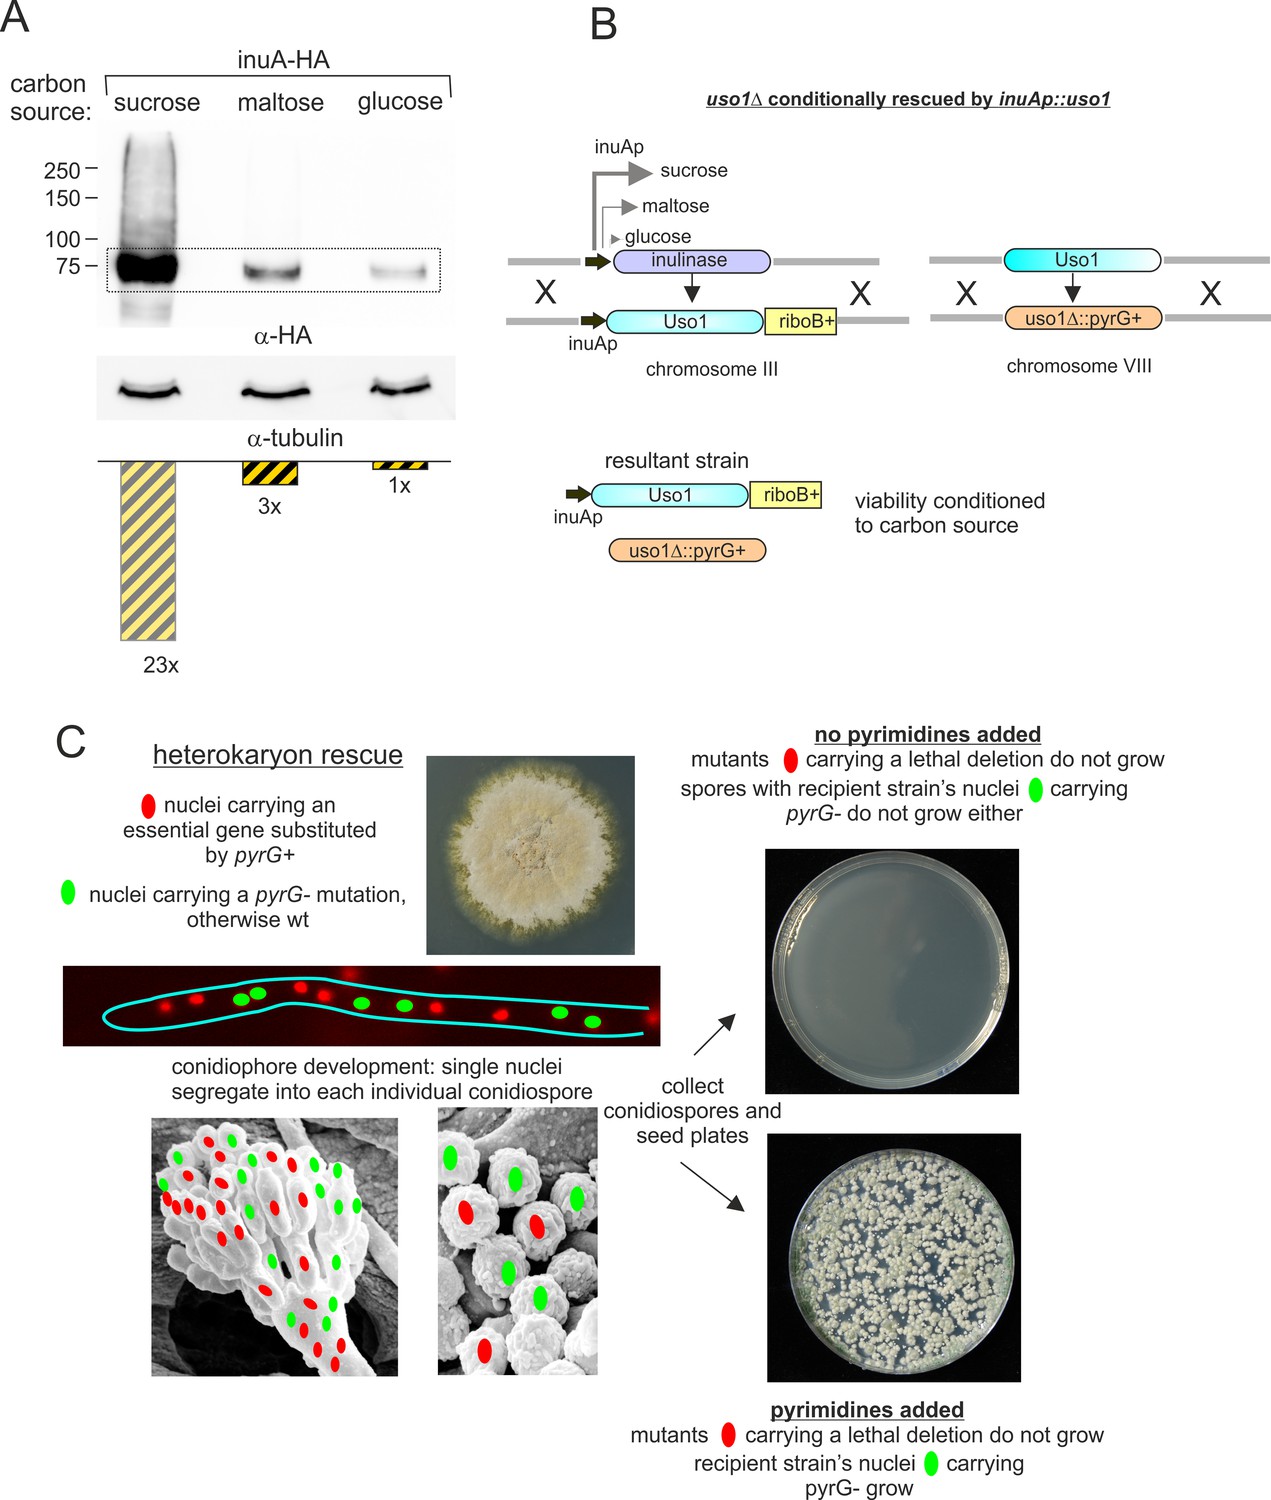
Explanation of key genetic manipulations used for this work.
(A) Relative levels of inulinase (InuA) on different C sources, as determined by western blotting. (B) Genetically engineering of a strain conditionally expressing Uso1. The inulinase coding region was substituted by the Uso1 coding region and kept in a sucrose medium to delete the endogenous uso1 gene. The resulting strain is unviable on glucose, grows like wild-type on sucrose, and less vigorously on maltose (see Figure 13D). (C) Heterokaryon rescue technique. Nuclei carrying a recessive lethal allele can be maintained in heterokaryosis. Its phenotype can be assessed after the development of asexual spores (conidiospores) into which single nuclei segregate.
-
Figure 13—figure supplement 2—source data 1
Raw images for western blots and uncropped pictures with used exposures and regions indicated.
- https://cdn.elifesciences.org/articles/85079/elife-85079-fig13-figsupp2-data1-v2.zip
Figure 14
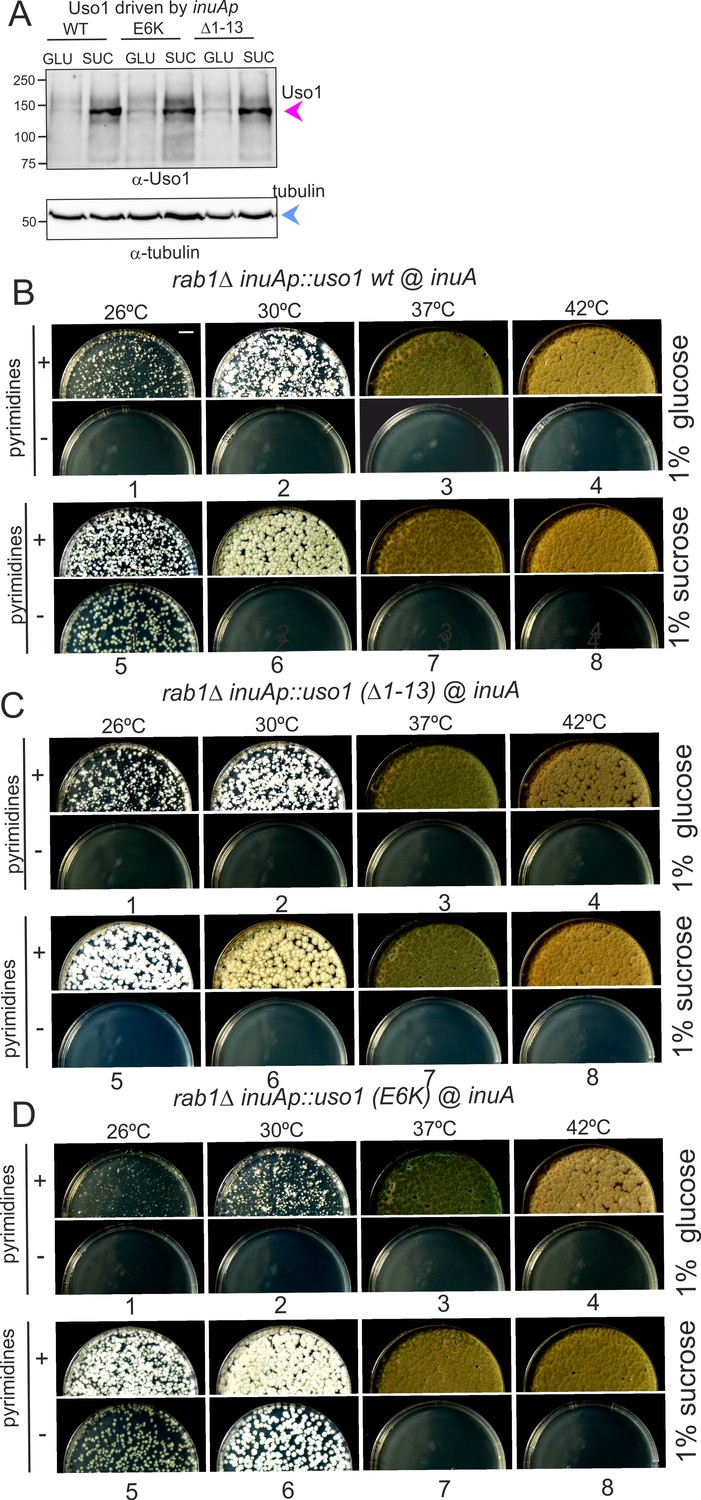
Over-expression of Uso1, but not of Uso1 (∆1–13) rescues the lethality of rab1∆, and rescue is stimulated by E6K.
(A) Western blot showing that all three alleles used in growth tests shown below result in similar levels of protein when driven by the inuAp on sucrose (suc). The protein detected on glucose (glu) corresponds to the endogenous gene. (B) Overexpression of Uso1 wild-type permits growth of rab1∆ at 28 °C (C) Overexpression of Uso1 (∆1–13) does not rescue rab1∆ at any temperature,. (D) Overexpression of Uso1 E6K permits growth at 26°C and 30°C.
-
Figure 14—source data 1
Raw images for western blots and uncropped pictures with used exposures and regions indicated.
- https://cdn.elifesciences.org/articles/85079/elife-85079-fig14-data1-v2.zip
Videos
Video 1
Shaded 3D reconstruction of a hypha expressing Uso1-GFP.
Video 2
4D acquisition showing the dynamics of Uso1-GFP.
4D (x, y, z, t) in which Z-stacks were acquired at a rate of 1 frame every 2.6 s.
Video 3
Dynamics of Uso1-GFP at 2 fps 3D acquisition (200 frames) showing the dynamics of Uso1-GFP.
Time resolution, 2 fps.
Video 4
Single Uso1-GFP cisterna tracked over time Example of Uso1-GFP cisterna.
The video contains 96 photograms acquired at 2fps.
Video 5
3D reconstruction of a hypha expressing fluorescently labeled Uso1-GFP and Sec13-mCh.
There is little colocalization between Uso1-GFP and Sec13 ERES.
Video 6
4D video (1 fpm) of a hypha expressing fluorescently labeled Uso1-GFP and Sec7-mCh Uso1 does not colocalize at all with the TGN marker Sec7.
Additional files
-
Supplementary file 1
‘Protein interfaces, surfaces, and assemblies’ service PISA.
- https://cdn.elifesciences.org/articles/85079/elife-85079-supp1-v2.xlsx
-
Supplementary file 2
List and complete genotypes of A. nidulans strains used in this work.
- https://cdn.elifesciences.org/articles/85079/elife-85079-supp2-v2.docx
-
Supplementary file 3
Primers used for PCR-based genetic manipulations.
- https://cdn.elifesciences.org/articles/85079/elife-85079-supp3-v2.docx
-
MDAR checklist
- https://cdn.elifesciences.org/articles/85079/elife-85079-mdarchecklist1-v2.docx
Download links
A two-part list of links to download the article, or parts of the article, in various formats.
Downloads (link to download the article as PDF)
Open citations (links to open the citations from this article in various online reference manager services)
Cite this article (links to download the citations from this article in formats compatible with various reference manager tools)
The Uso1 globular head interacts with SNAREs to maintain viability even in the absence of the coiled-coil domain
eLife 12:e85079.
https://doi.org/10.7554/eLife.85079


