A scalable and tunable platform for functional interrogation of peptide hormones in fish
- Department of Genetics, the Silberman Institute, The Hebrew University of Jerusalem, Israel
- University of South Bohemia in Ceske Budejovice, South Bohemian Research Center of Aquaculture and Biodiversity of Hydrocenoses, Czech Republic
Figures
Figure 1 with 1 supplement

Perturbation of the killifish hypothalamic-pituitary-somatic axis.
(A) Schematic illustration of the vertebrate hypothalamic-pituitary system, including members of the hypothalamic-pituitary-gonadal axis (HPG), the hypothalamic-pituitary-somatic axis (HPS), and the hypothalamic-pituitary-thyroid axis (HPT). These hormones are released from the pituitary, and travel through the bloodstream to bind/activate their target receptors/organs. FSH: follicle stimulating hormone; GH: growth hormone; TSH: thyroid stimulating hormone. (B) Top: generation of CRISPR mutants for gh1, with the guide RNA (gRNA) targets (red), protospacer adjacent motif (PAM, in bold), and indels. The mutation site is marked with a red asterisk. Bottom: Comparison of fish size between 8-week-old WT and gh1Δ4/Δ4 male (top) and female (bottom) fish. Scale bar: 3.5 mm.
-
Figure 1—source data 1
Physiological effect of growth hormone perturbations.
(A) Corresponding to Figure 1B.
- https://cdn.elifesciences.org/articles/85960/elife-85960-fig1-data1-v1.pdf
Figure 1—figure supplement 1
Physiological effect of growth hormone perturbations.
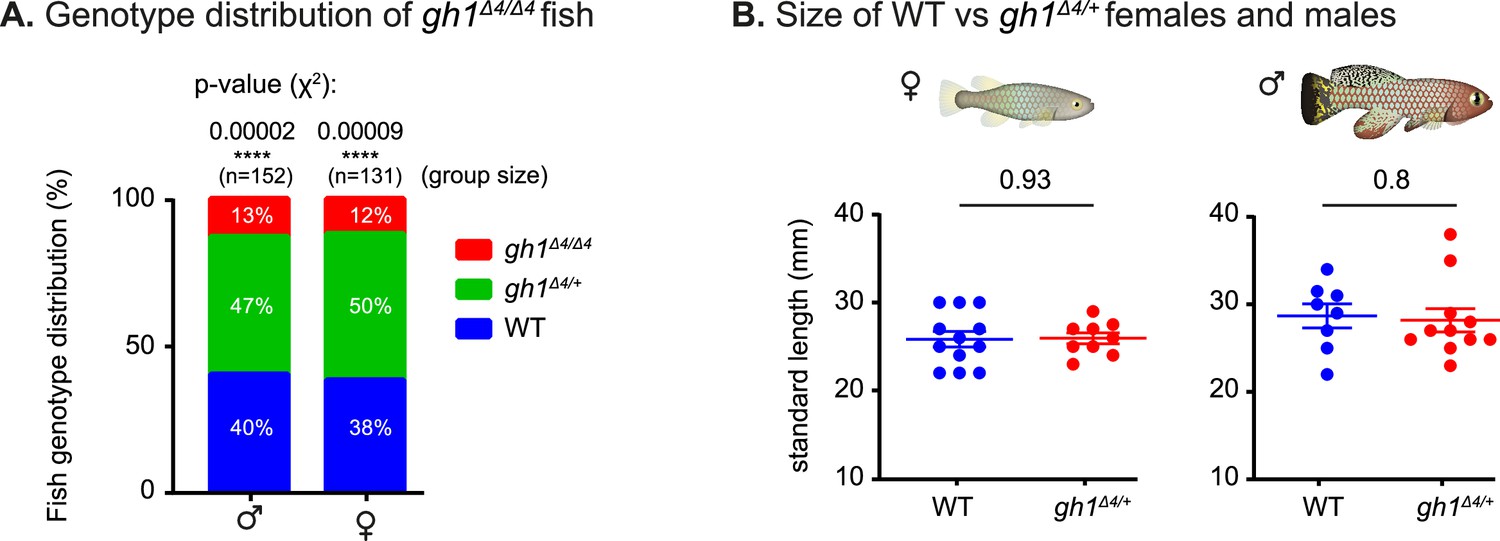
(A) Distribution of genotype progeny from heterozygous gh1Δ4/+ pairs (stratified by sex). n>130 individuals, per sex. Percentages are indicated, and significance was measured by χ2 test with Mendelian proportions (25:50:25) as the expected model and FDR correction. (B) Quantification of somatic growth (standard length) of 12-week-old WT or gh1Δ4/+ heterozygous mutants: females (left) and males (right), n≥9 individuals from each experimental group. Error bars show mean ± SEM. Significance was calculated using an unpaired Student’s t-test. Exact p-values are indicated.
-
Figure 1—figure supplement 1—source data 1
Corresponding to Figure 1—figure supplement 1A, B.
- https://cdn.elifesciences.org/articles/85960/elife-85960-fig1-figsupp1-data1-v1.xlsx
Figure 2 with 1 supplement

Phenotypic analysis of growth and reproduction in gh1Δ4/Δ4 mutants.
(A) Quantification of somatic growth (standard length) of 8-week-old WT or gh1Δ4/Δ4 mutants: males (left) and females (right), n≥6 individuals from each experimental group. Error bars show mean ± SEM. Significance was calculated using one-way ANOVA with a Sidak post-hoc comparing the male and female mutants to the respective WT. Exact p-values are indicated. The relative size of the mutant fish, as compared to the corresponding controls, is indicated as %. (B) Quantification of reproductive output in gh1Δ4/Δ4 mutant pairs over time. Each dot represents the mean number of eggs of the indicated genotypes, per week of egg collection. There were three independent mutant pairs and seven WT pairs. Error bars show mean ± SEM. Significance was calculated using repeated measures two-way ANOVA with a Sidak post-hoc compared to the WT. Exact p-values are indicated. (C) Left: Quantification of the timing of peak fertility of gh1Δ4/Δ4 mutant pairs. Each dot represents the age (in weeks) at which a breeding pair gave the maximal number of eggs. Right: reproductive output of gh1Δ4/Δ4 mutant pairs at peak fertility. Each dot represents the maximal number of eggs per week of a single breeding pair under the indicated experimental conditions. This figure uses the data presented in B. Error bars show mean ± SEM. Significance was calculated using an unpaired Student’s t-test. Exact p-values are indicated. (D) Representative histological sections, depicting ovaries and testis of the indicated genotypes. n≥4 individuals (two-month-old), from each genotype. Scale bar: 50 µm. PG: primary growth; PV: pre-vitellogenic; V: vitellogenic. SG: spermatogonia; SC: spermatocytes; ST: spermatids; SZ: spermatozoa. (E) Distribution of oocyte development stages. Data are presented as the proportion of each developmental stage of the indicated genotypes. n≥4 individuals for each experimental group. Significance was measured by χ2 test with the WT value as the expected model and FDR correction. Percentages and exact p-values are indicated. Oocyte developmental stages as previously reported (Longenecker and Langston, 2016) are indicated as follows: PG: primary growth; PV: pre-vitellogenic; V: vitellogenic; M: Mature. (F) Quantification of sperm maturation, examples in D. Data are presented as the proportion of each developmental stage of the indicated genotypes. n≥4 individuals for each experimental group. Significance was measured by χ2 test with the WT value as the expected model and FDR correction. Percentages and exact p-values are indicated. Sperm developmental stages as previously reported (Longenecker and Langston, 2016) are indicated as follows: SG: spermatogonia; SC: spermatocytes; ST: spermatids; SZ: spermatozoa.
-
Figure 2—source data 1
Reproduction in WT fish.
(A) Corresponding to WT panels in Figure 2D.
- https://cdn.elifesciences.org/articles/85960/elife-85960-fig2-data1-v1.pdf
-
Figure 2—source data 2
Reproduction in gh1Δ4/Δ4 mutants.
(A) Corresponding to gh1Δ4/Δ4 panels in Figure 2D.
- https://cdn.elifesciences.org/articles/85960/elife-85960-fig2-data2-v1.pdf
-
Figure 2—source data 3
Corresponding to Figure 2A–C, E and F and Figure 2—figure supplement 1B.
- https://cdn.elifesciences.org/articles/85960/elife-85960-fig2-data3-v1.xlsx
Figure 2—figure supplement 1
Effect of growth hormone deficiency on ovary and egg size.
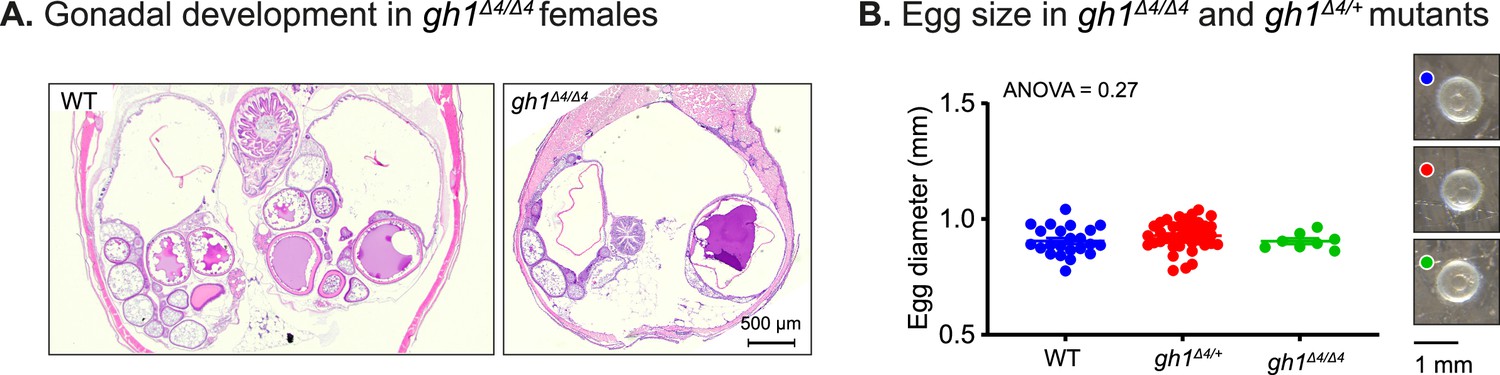
(A) Representative histological sections depicting the body cavity, including ovaries of the indicated genotypes. N≥4 individuals (two-month-old), from each genotype. Scale bar: 500 µm. (B) Left: quantification of the size (diameter) of eggs laid by WT gh1+/Δ4or gh1Δ4/Δ4 mutants. n≥7 eggs from each experimental group. Error bars show mean ± SEM. Significance was calculated using one-way ANOVA. Exact p-values are indicated. Right: representative images of eggs laid by fish of the indicated genotypes. Scale bar: 1 mm.
-
Figure 2—figure supplement 1—source data 1
Effect of growth hormone deficiency on ovary and egg size.
(A) Corresponding to Figure 2—figure supplement 1A. (B) Corresponding to Figure 2—figure supplement 1B.
- https://cdn.elifesciences.org/articles/85960/elife-85960-fig2-figsupp1-data1-v1.pdf
Figure 3 with 1 supplement
Phenotypic rescue of growth hormone deficiency.
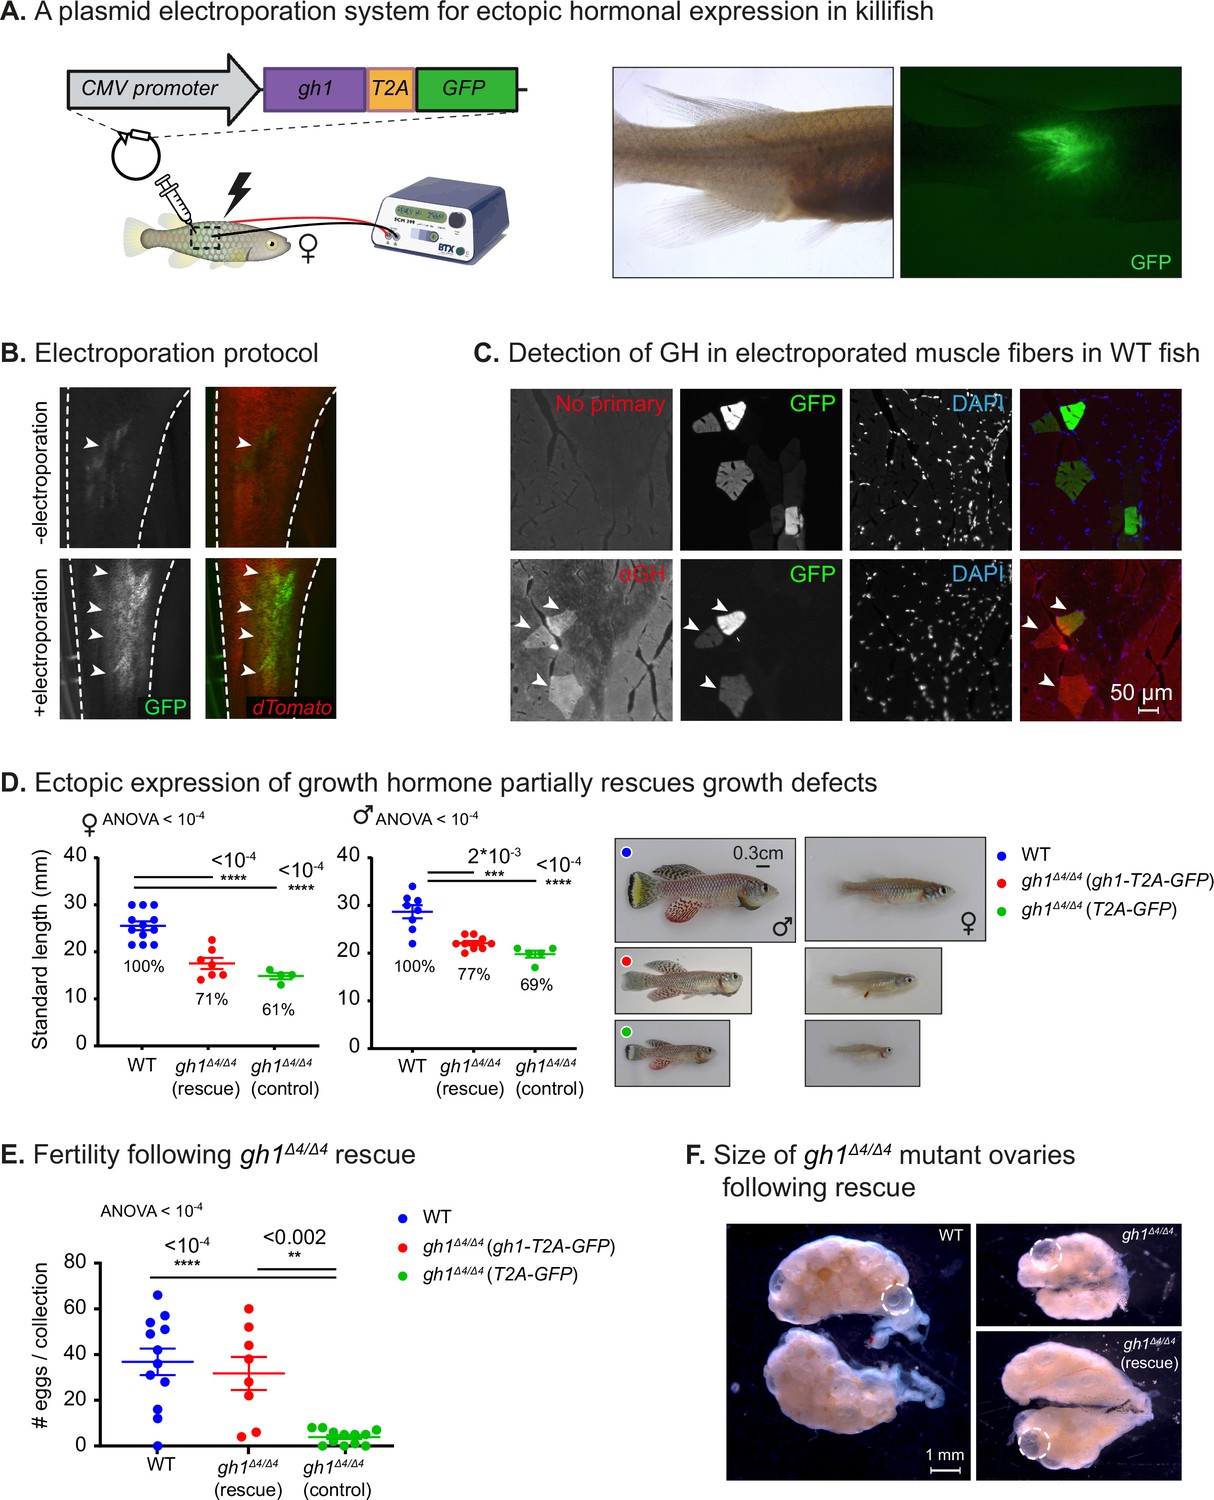
(A) Left: schematic illustration of the gain-of-function plasmid, and intramuscular ectopic plasmid electroporation. Right: GFP is visible following the electroporation of a plasmid encoding for GH-T2A-GFP. (B) Representative images of the transgenic Killibow line (Rozenberg et al., 2023a) (expressing dTomato under the ubiquitin promoter, in red), injected with a plasmid expressing CMV:GFP (green), either without (top) or with (bottom) electroporation. n≥4 from each experimental group. (C) Immunofluorescence for GH expression (red) on muscle cryosections of electroporated fish. GFP expression is shown in green, and nuclear staining (DAPI) in blue. Representative image from each experimental group (n≥3). Scale bar: 50 µm. (D) Left: Quantification of somatic growth (standard length) of 12-week-old gh1Δ4/Δ4 mutants following electroporation of a gh1-T2A-GFP plasmid as compared to WT control and controls injected with an empty vector: females (left) and males (center), n≥4 individuals from each experimental group. Error bars show mean ± SEM. Significance was calculated using one-way ANOVA with a Dunnet post-hoc compared to the WT. Exact p-values are indicated. The relative size of the mutant fish as compared to the corresponding controls is indicated as %. Right: Representative images of 12-week-old males (left) and females (right) from the indicated experimental groups. Scale bar: 3 mm. (E) Quantification of reproductive output in rescued gh1Δ4/Δ4 mutant pairs. Each dot represents the number of eggs per indicated breeding pair, per week of egg collection. Error bars show mean ± SEM. n≥3 pairs for each experimental group. Error bars show mean ± SEM. Significance was calculated using one-way ANOVA with a Dunnet post-hoc compared to the WT. Exact p-values are indicated. (F) Representative images of ovaries from fish of the indicated experimental group. mature eggs are marked by a dashed circle. Scale bar: 1 mm.
-
Figure 3—source data 1
Delivery of growth hormone via intramuscular electroporation.
- https://cdn.elifesciences.org/articles/85960/elife-85960-fig3-data1-v1.pdf
-
Figure 3—source data 2
Phenotypic rescue of growth hormone deficiency.
- https://cdn.elifesciences.org/articles/85960/elife-85960-fig3-data2-v1.pdf
-
Figure 3—source data 3
Corresponding to Figure 3D, E and Figure 3—figure supplement 1B.
- https://cdn.elifesciences.org/articles/85960/elife-85960-fig3-data3-v1.xlsx
Figure 3—figure supplement 1
Delivery of growth hormone via intramuscular electroporation.
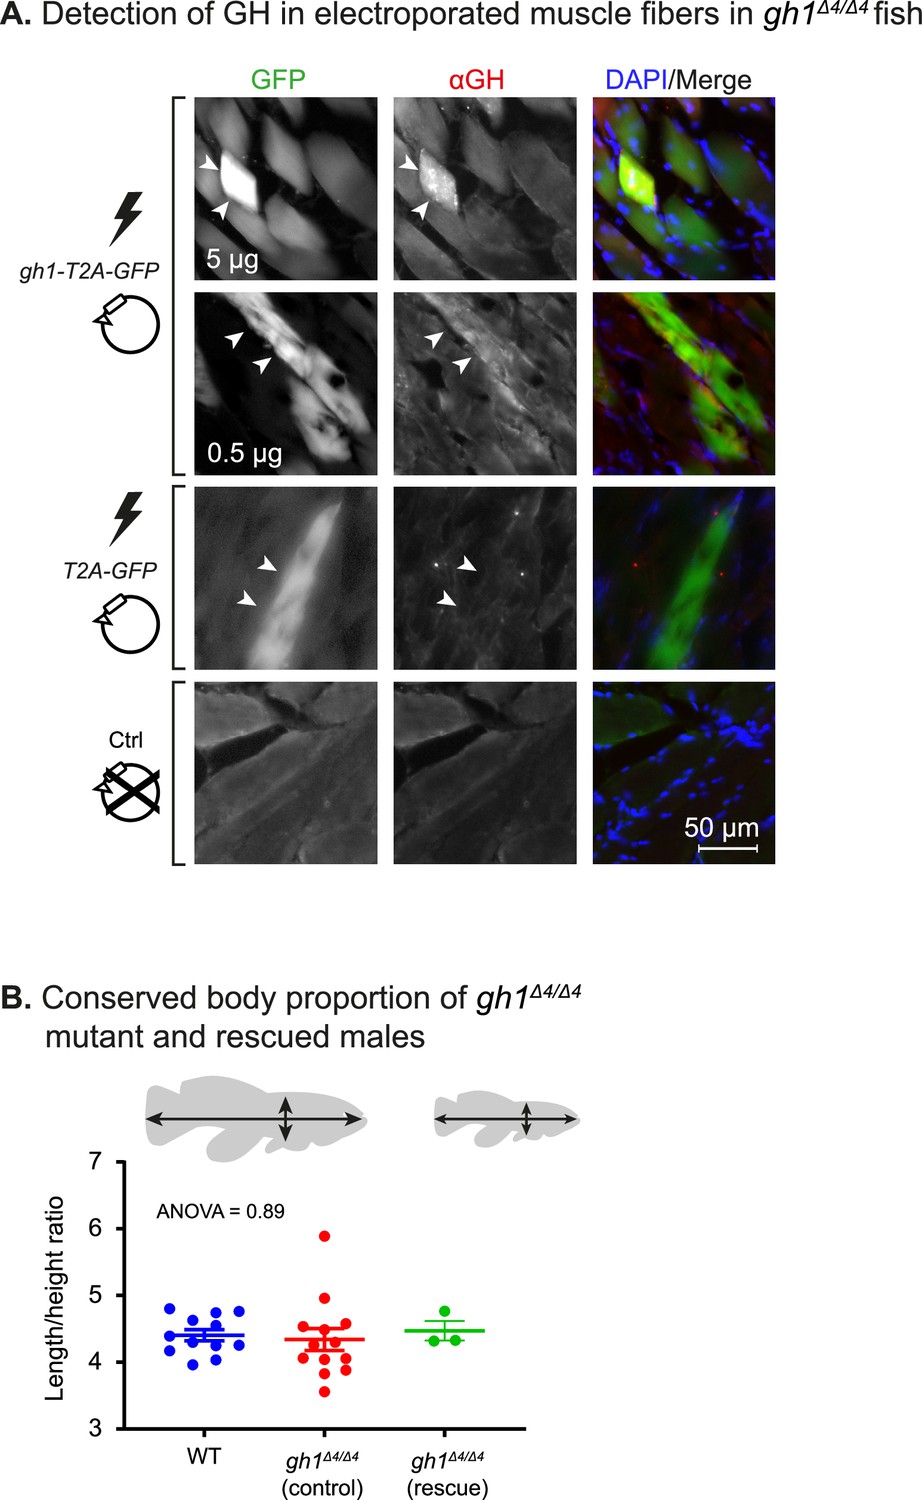
(A) Immunofluorescence for GH expression (red) on muscle cryosections of the indicated gh1Δ4/Δ4 mutants. GFP expression is shown in green, and nuclear staining (DAPI) in blue. Scale bar: 50 µm. (B) Bottom: Quantification of the ratio between length and height of indicated fish. Significance was calculated using one-way ANOVA. Exact p-values are indicated. Top: a schematic model of the measurements used.
-
Figure 3—figure supplement 1—source data 1
Intramuscular electroporation controls.
(A) Corresponding to Figure 3—figure supplement 1A.
- https://cdn.elifesciences.org/articles/85960/elife-85960-fig3-figsupp1-data1-v1.pdf
Figure 4 with 1 supplement
Reversible perturbation of the killifish reproductive axis.
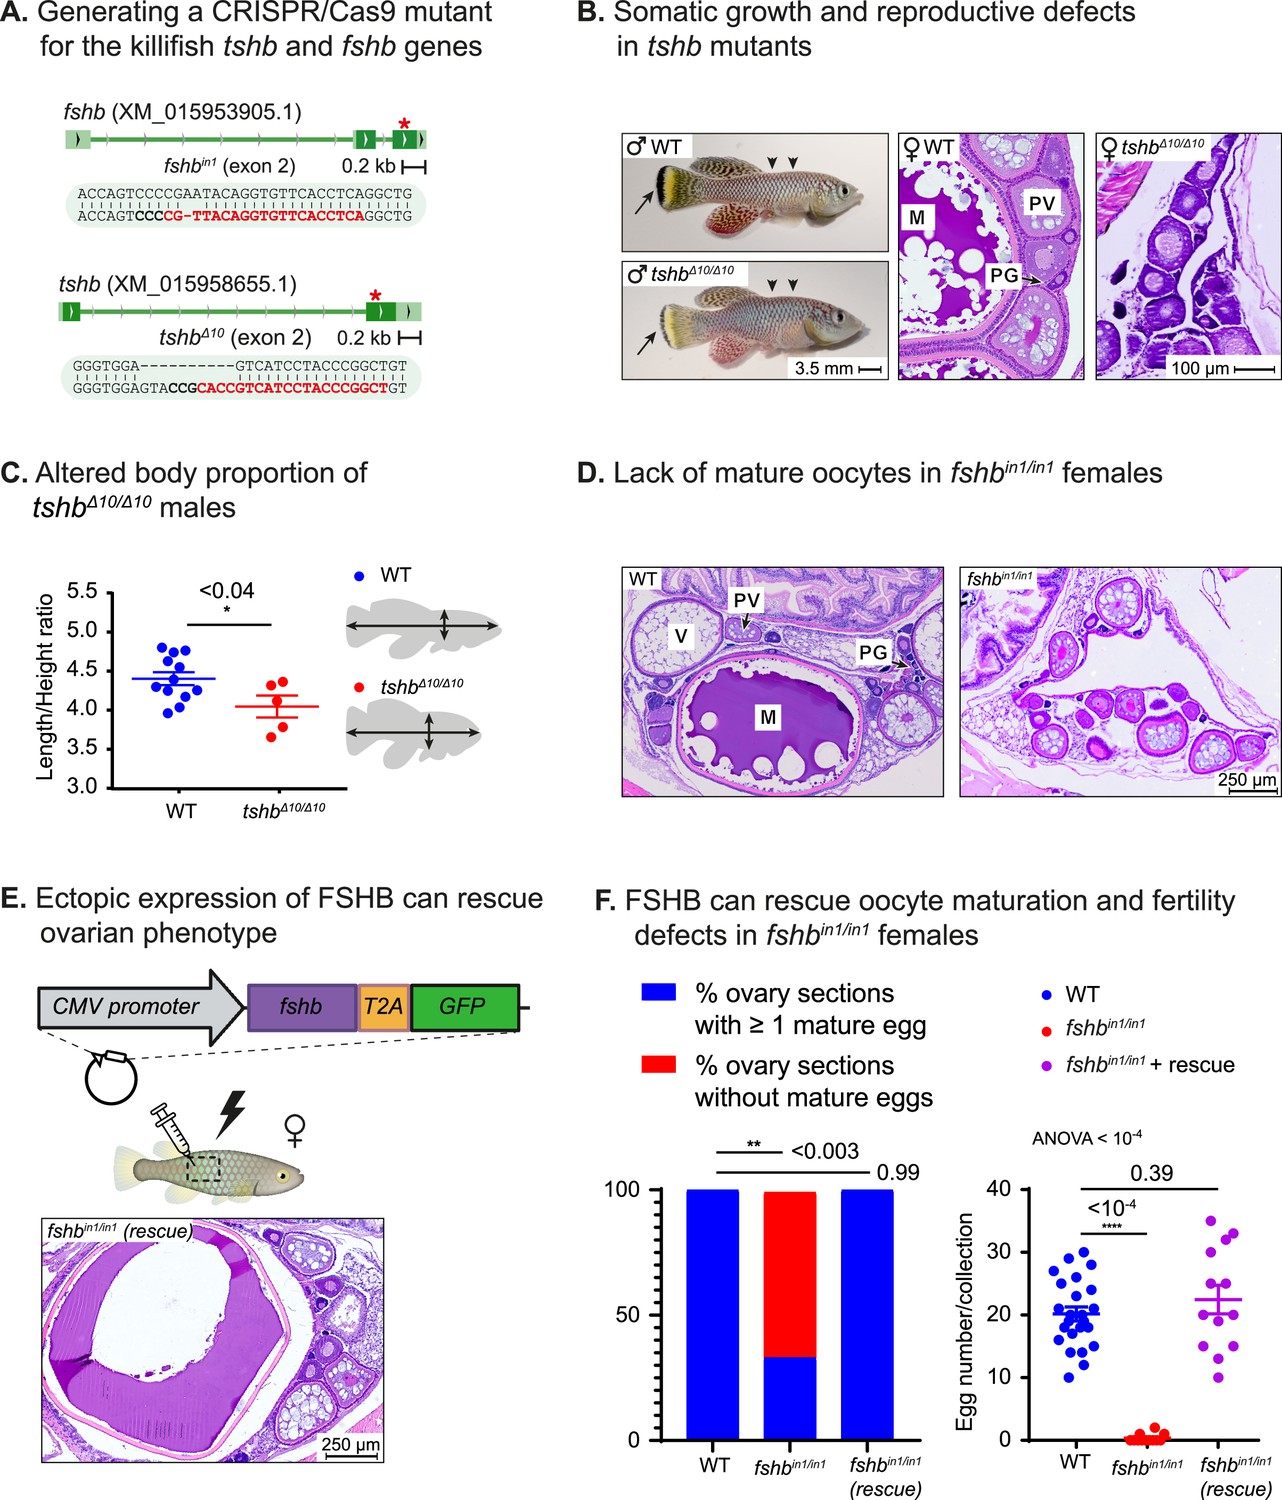
(A) Generation of CRISPR mutants for fshb and tshb, depicting the guide RNA (gRNA) targets (red), protospacer adjacent motif (PAM, in bold), and indels. Red asterisk marks the targeted exon. (B) Left: comparison of 2-month-old WT (top) and tshbΔ10/Δ10 male fish (bottom). Black arrows highlight tail melanocytes, while arrowheads indicate alterations in body shape. Right: representative histological sections demonstrating that 1-month-old tshbΔ10/Δ10 fish (right) lack mature oocytes compared to WT ovaries (left). Oocyte developmental stages as reported previously (Longenecker and Langston, 2016) are: PG: primary growth; PV: pre-vitellogenic; V: vitellogenic; M: Mature. Scale bar: 100 µm. (C) Left: Quantification of the ratio between length and height of experimental fish as indicated. Significance was calculated using an unpaired Student’s t-test. Exact p-values are indicated. Right: a schematic model of the measurements used. (D) Representative histological sections, depicting 1-month-old ovaries of the indicated genotypes. n≥4 individuals from each genotype. Scale bar: 250 µm. Oocyte developmental stages as reported previously (Longenecker and Langston, 2016) are: PG: primary growth; PV: pre-vitellogenic; V: vitellogenic; M: Mature. (E) Representative histological sections of ovaries in one-month-old fshbin1/in1mutant females, one week following electroporation of an fshb-T2A-GFP plasmid. Representative of n≥3 individuals Oocyte developmental stages as reported previously (Longenecker and Langston, 2016) are: PG: primary growth; PV: pre-vitellogenic; V: vitellogenic; M: Mature. Scale bar: 250 µm (F) Left: proportion of histological sections in which at least one mature egg has been detected. Significance was calculated using Fisher’s exact test with an FDR correction, Exact P-values are indicated. Right: quantification of female fertility. Each dot represents the number of eggs per indicated breeding pair, per week of egg collection. The data are from at least 3 independent pairs and 4 independent collections. Error bars show mean ± SEM with individual points. Significance was calculated using one-way ANOVA with a Dunnet post-hoc compared to the WT and exact p-value is indicated.
-
Figure 4—source data 1
Reversible perturbation of the killifish reproductive axis.
(A) Corresponding to live image panels in Figure 4B. (B) Corresponding to H&E staining panels in Figure 4B. (C) Corresponding to Figure 4D. (D) Corresponding to Figure 4E. (E) Corresponding to Figure 4—figure supplement 1C.
- https://cdn.elifesciences.org/articles/85960/elife-85960-fig4-data1-v1.pdf
-
Figure 4—source data 2
Corresponding to Figure 4C and F and Figure 4—figure supplement 1A, B.
- https://cdn.elifesciences.org/articles/85960/elife-85960-fig4-data2-v1.xlsx
Figure 4—figure supplement 1

Physiological effects of FSHB levels.
(A) Quantification of fertility of fshbin1/+ fish. Each dot represents the number of eggs per indicated breeding pair, per week of egg collection. The data are from at least 2 independent pairs and 3 independent collections. Error bars show mean ± SEM with individual points. Significance was calculated using an unpaired Student’s t-test and the exact p-value is indicated. The experiment in this panel and panel C were performed together and share the same WT controls. (B) Quantification of fertility of fshbin/in1 fish rescued with a plasmid expressing FSHB fused to GFP. Each dot represents the number of eggs per indicated breeding pair, per week of egg collection. The data are from at least three independent pairs and four independent collections. Error bars show mean ± SEM with individual points. Significance was calculated using an unpaired Student’s t-test and the exact p-value is indicated. The experiment in this panel and panel B were performed together and share the same WT controls. (C) Representative image of WT ovaries from a non-injected control (top) and a fish injected with a plasmid expressing FSHB fused to GFP (bottom). Green arrow indicates faint GFP expression. Scale bar: 1 mm.
Figure 5

Dose dependent, multiplexed, and inducible expression systems.
(A) A schematic illustration depicting complex expression levels of LH (red line) and FSH (green line) during puberty (top) and ovulation (bottom) in human females. Adapted from Taylor et al., 2019. (B) Top: electroporation of the indicated plasmid concentrations. GFP signal (green arrowheads) and lack of signal (white arrowheads) are shown. n≥3 for each experimental condition. Scale bar = 1 mm. Bottom: electroporation of the indicated plasmids. GFP signal (green arrowheads) and dTomato signal (red arrowheads) are shown. Scale bar = 1 mm. (C) Quantification of GFP intensity (arbitrary units) in muscle of fish injected with 500 ng or 5 μg of a plasmid encoding for CMV:GFP. n≥3 for each experimental condition. Error bars show mean ± SEM. Significance was calculated using an unpaired Student’s t-test and the exact p-value is indicated. (D) Right: Quantification of fertility over time of fshbin/in1 fish rescued with a plasmid expressing FSHB. Each dot represents the number of eggs per indicated breeding pair, per week of egg collection. The data are from at least four independent pairs and four independent collections each month. Error bars show mean ± SEM with individual points. Significance was calculated using a Mixed Effects Model. Exact p-values are indicated.(E) Top: schematic illustration showing electroporation of a plasmid with a doxycycline-inducible promoter, coding for a desired protein (ProteinX) and tagged with a T2A-GFP. Bottom: a GFP signal is observed (green arrowheads) following Dox treatment. In control fish (-Dox), there is no detectable signal (white arrowheads). n≥3 for each experimental condition. Scale bar = 1 mm. (F) Quantification of reproductive output over time in fshbin/in1 females rescued with a plasmid expressing FSHB under Dox induction. Each dot represents the mean number of eggs of the indicated experimental group, per week of egg collection. n≥3 for each experimental condition. Timing of electroporation and Dox treatment is indicated. Error bars show mean ± SEM. Significance was calculated using a Mixed-Effects Model. Exact p-values are indicated.
-
Figure 5—source data 1
Dose dependent, multiplexed, and inducible expression systems.
- https://cdn.elifesciences.org/articles/85960/elife-85960-fig5-data1-v1.pdf
-
Figure 5—source data 2
Corresponding to Figure 5C, D and F.
- https://cdn.elifesciences.org/articles/85960/elife-85960-fig5-data2-v1.xlsx
Figure 6
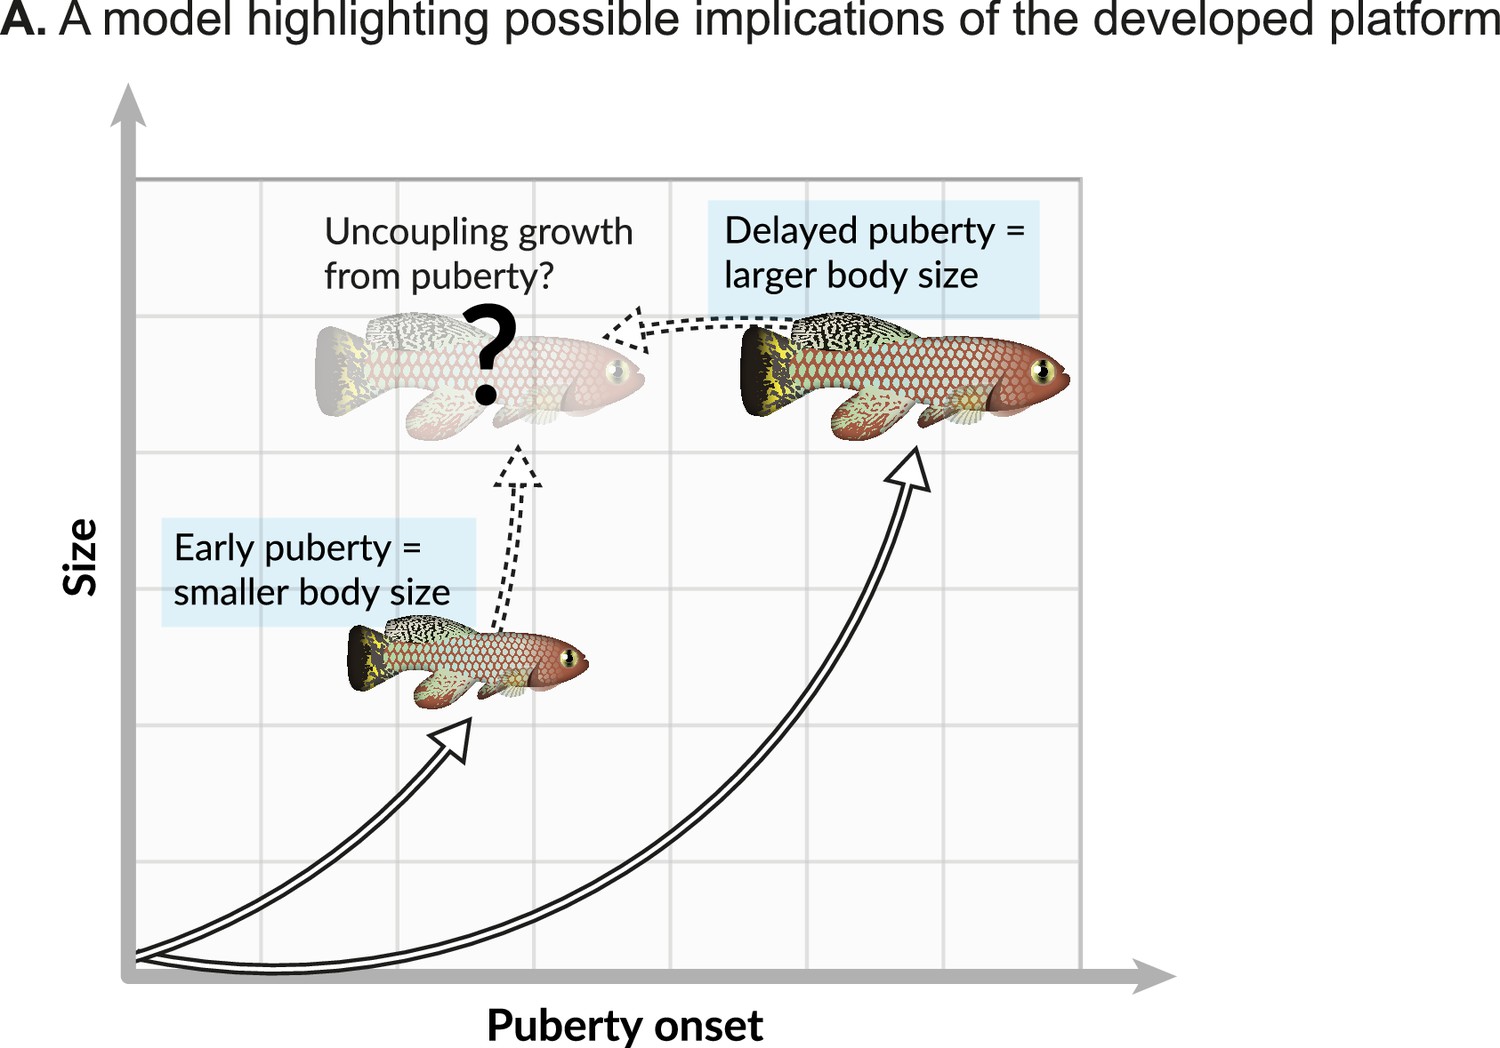
Possible implications.
(A) Onset of maturity can negatively affect growth. Identifying the molecular mechanisms that regulate these seemingly opposing traits, and potentially uncoupling them, holds great promise for basic research and aquaculture.
Author response image 1

(A) Quantification of somatic growth (standard length) of 12-week-old WT fish compared to gh1Δ4/+ mutants, gh1Δ4/Δ4 mutants following electroporation of a gh1-T2A-GFP plasmid, controls injected with an empty vector and 8-week-old fish before injection. males (left) and females (right), n ≥ 3 individuals from each experimental group. Error bars show mean ± SEM. Significance was calculated using oneway ANOVA with a Dunnet post-hoc compared to the WT. Exact p-values are indicated. (B) A phylogenetic tree based on the GH, LHB (another pituitary hormone in the reproductive axis), TSHB, and FSHB proteins of Humans (Homo Sapienes), Mice (Mus musculus), Chickens (Gallus gallus), Japanese Medaka (Oryzias latipes), Nile Tilapia (Oreochromis niloticus), Zebrafish (Danio rerio), Salmon (Salmo salar), and the African Turquoise Killifish (Nothobranchius furzeri).
Tables
Key resources table
| Reagent type (species) or resource | Designation | Source or reference | Identifiers | Additional information |
|---|---|---|---|---|
| Gene (N. furzeri) | gh1 | NCBI | Gene ID: 107390293 | |
| Gene (N. furzeri) | fshb | NCBI | Gene ID: 107381959 | |
| Gene (N. furzeri) | tshb | NCBI | Gene ID: 129164764 | |
| Genetic reagent (N. furzeri) | gh1Δ4 | This paper | Line maintained at the Harel lab | |
| Genetic reagent (N. furzeri) | fshbin1 | This paper | Line maintained at the Harel lab | |
| Genetic reagent (N. furzeri) | tshbΔ10 | This paper | Line maintained at the Harel lab | |
| Recombinant DNA reagent | CMV:gh1-T2A-GFP | This paper, Addgene | 194883 | |
| Recombinant DNA reagent | CMV:fshb-T2A-GFP | This paper, Addgene | 194356 | |
| Recombinant DNA reagent | Tol2-TLCV2 | This paper, Addgene | 196331 | |
| Recombinant DNA reagent | TetOn:fshb-T2A-GFP | This paper, Addgene | 205595 | |
| Recombinant DNA reagent | fshb-GFP fused | This paper, Addgene | 205596 | |
| Recombinant DNA reagent | fshb-t2a-dTOMATO | This paper, Addgene | 205597 | |
| Antibody | Anti rabbit polyclonal anti-tilpia-GH | Levavi-Sivan lab | (1:100) | |
| Sequence-based reagent | fshb sequencing forward | This paper | GAGATCGCGGGCATGAACT | |
| Sequence-based reagent | fshb sequencing reverse | This paper | ACCACACTCATCCACACCAC | |
| Sequence-based reagent | gh1 sequencing forward | This paper | TAACCCTAGCCCATGTCGGT | |
| Sequence-based reagent | gh1 sequencing reverse | This paper | TTTTGTTGAGCTGACGCTGC | |
| Sequence-based reagent | tshb sequencing forward | This paper | TTGGAGTAAACAGGACAGCCG | |
| Sequence-based reagent | tshb sequencing reverse | This paper | TTCCCCGTGTGTCATTCAGG | |
| Sequence-based reagent | fshb cloning forward | This paper | ATGCAACTGGTTGTCATGGCAGC | |
| Sequence-based reagent | fshb cloning reverse | This paper | ACAGCCGAGTACGTGTGGATGGAAGG | |
| Sequence-based reagent | gh1 cloning forward | This paper | ATGGACAGAGCCCTCCTCCTCC | |
| Sequence-based reagent | gh1 cloning reverse | This paper | CAGAGTGCAGTTTGCTTCTGGA |
Additional files
Download links
A two-part list of links to download the article, or parts of the article, in various formats.
Downloads (link to download the article as PDF)
Open citations (links to open the citations from this article in various online reference manager services)
Cite this article (links to download the citations from this article in formats compatible with various reference manager tools)
A scalable and tunable platform for functional interrogation of peptide hormones in fish
eLife 12:e85960.
https://doi.org/10.7554/eLife.85960


