ROCK and the actomyosin network control biomineral growth and morphology during sea urchin skeletogenesis
- Department of Marine Biology, Leon H. Charney School of Marine Sciences, University of Haifa, Israel
- B CUBE Center for Molecular Bioengineering, Technische Universität Dresden, Germany
- Department of Electrical Engineering, Computer Science and Mathematics, Technische Universiteit Delft, Netherlands
Figures
Figure 1 with 2 supplements
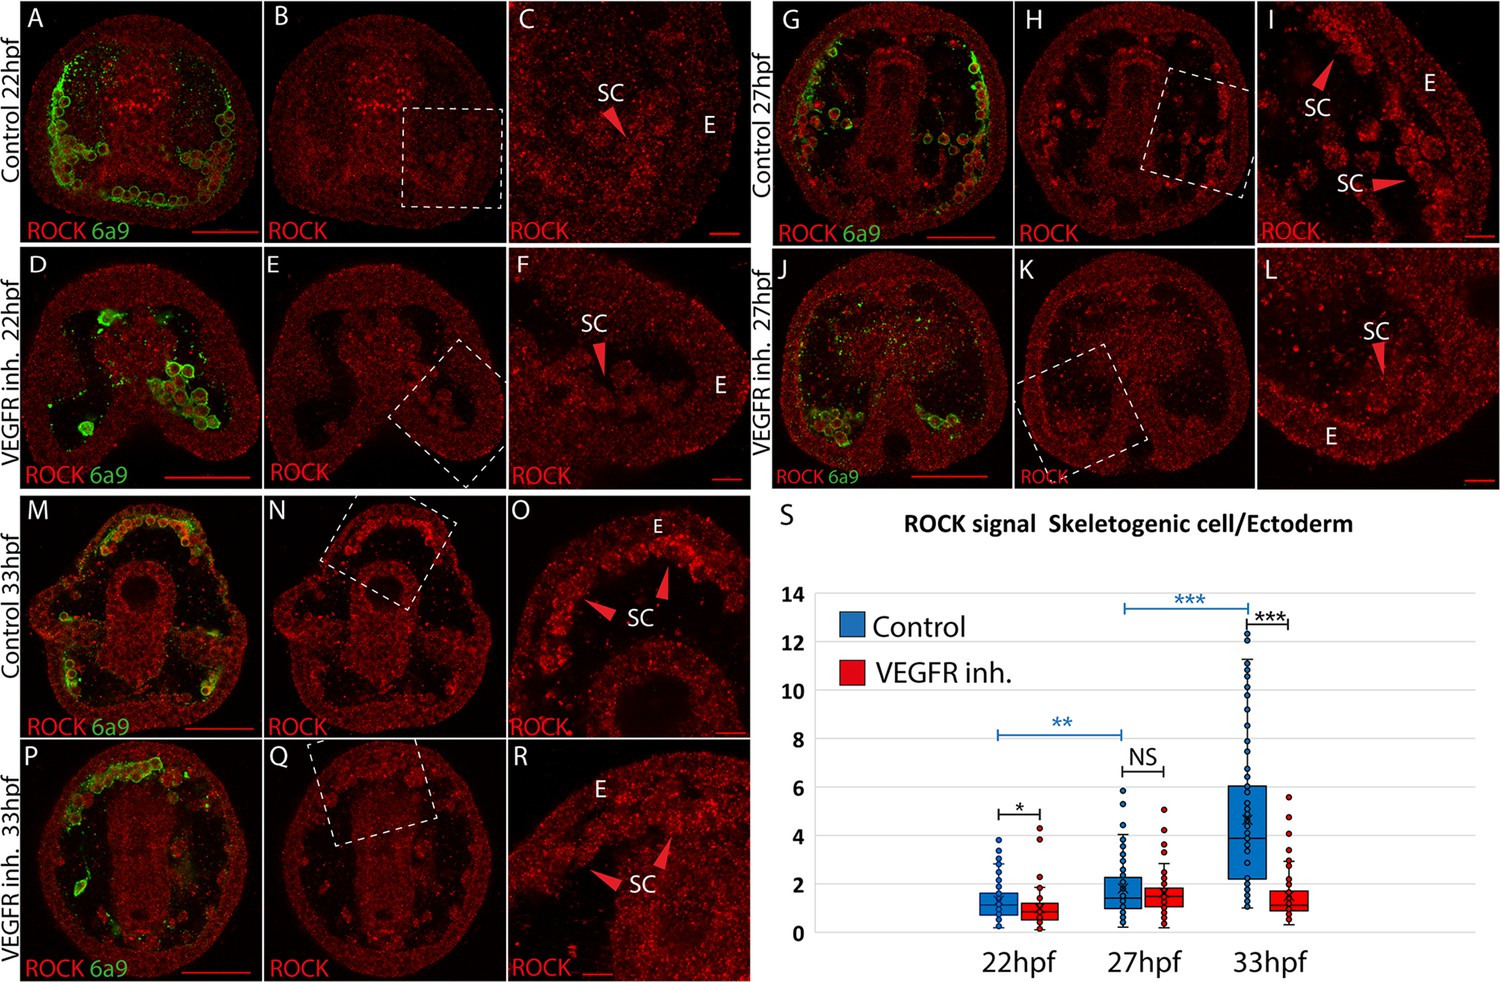
Rho-associated coiled-coil kinase (ROCK) enrichment in the skeletogenic cells increases with time and depends on vascular endothelial growth factor (VEGF) signaling.
(A–R) ROCK immunostaining at different timepoints in control and under VEGFR inhibition (150 nM Axitinib). In each condition and time point, the left image shows ROCK immunostaining and the skeletogenic cell marker, 6a9 (A, D, G, J, M, and P). The middle image shows ROCK immunostaining alone in the whole embryo (B, E, H, K, N, and Q). The right image shows the enlargement of the white rectangle region of the middle image (C, F, I, L, O, R). Scale bar in whole embryo is 50 µm and in enlargements is 10 µm. E – ectoderm, SC – skeletogenic cells. (S) Quantification of the ratio between ROCK signal/area in the skeletogenic cells compared to the ectodermal cells (see methods for details). Each box plot shows the average marked in x, the median, the first and the third quartiles (edges of boxes), and all experimental measurements (dots). Experiments were performed in three independent biological replicates and in each condition, at least 33 embryos were measured. Statistical significance was measured using paired two-tailed t-test where, * indicates p<0.05, ** indicates p<0.005, and *** indicates p<0.0005.
-
Figure 1—source data 1
Measurements of Rho-associated coiled-coil kinase (ROCK) signal in the skeletogenic cell vs. the ectoderm, in control and VEGFR inhibition.
- https://cdn.elifesciences.org/articles/89080/elife-89080-fig1-data1-v1.xlsx
Figure 1—figure supplement 1
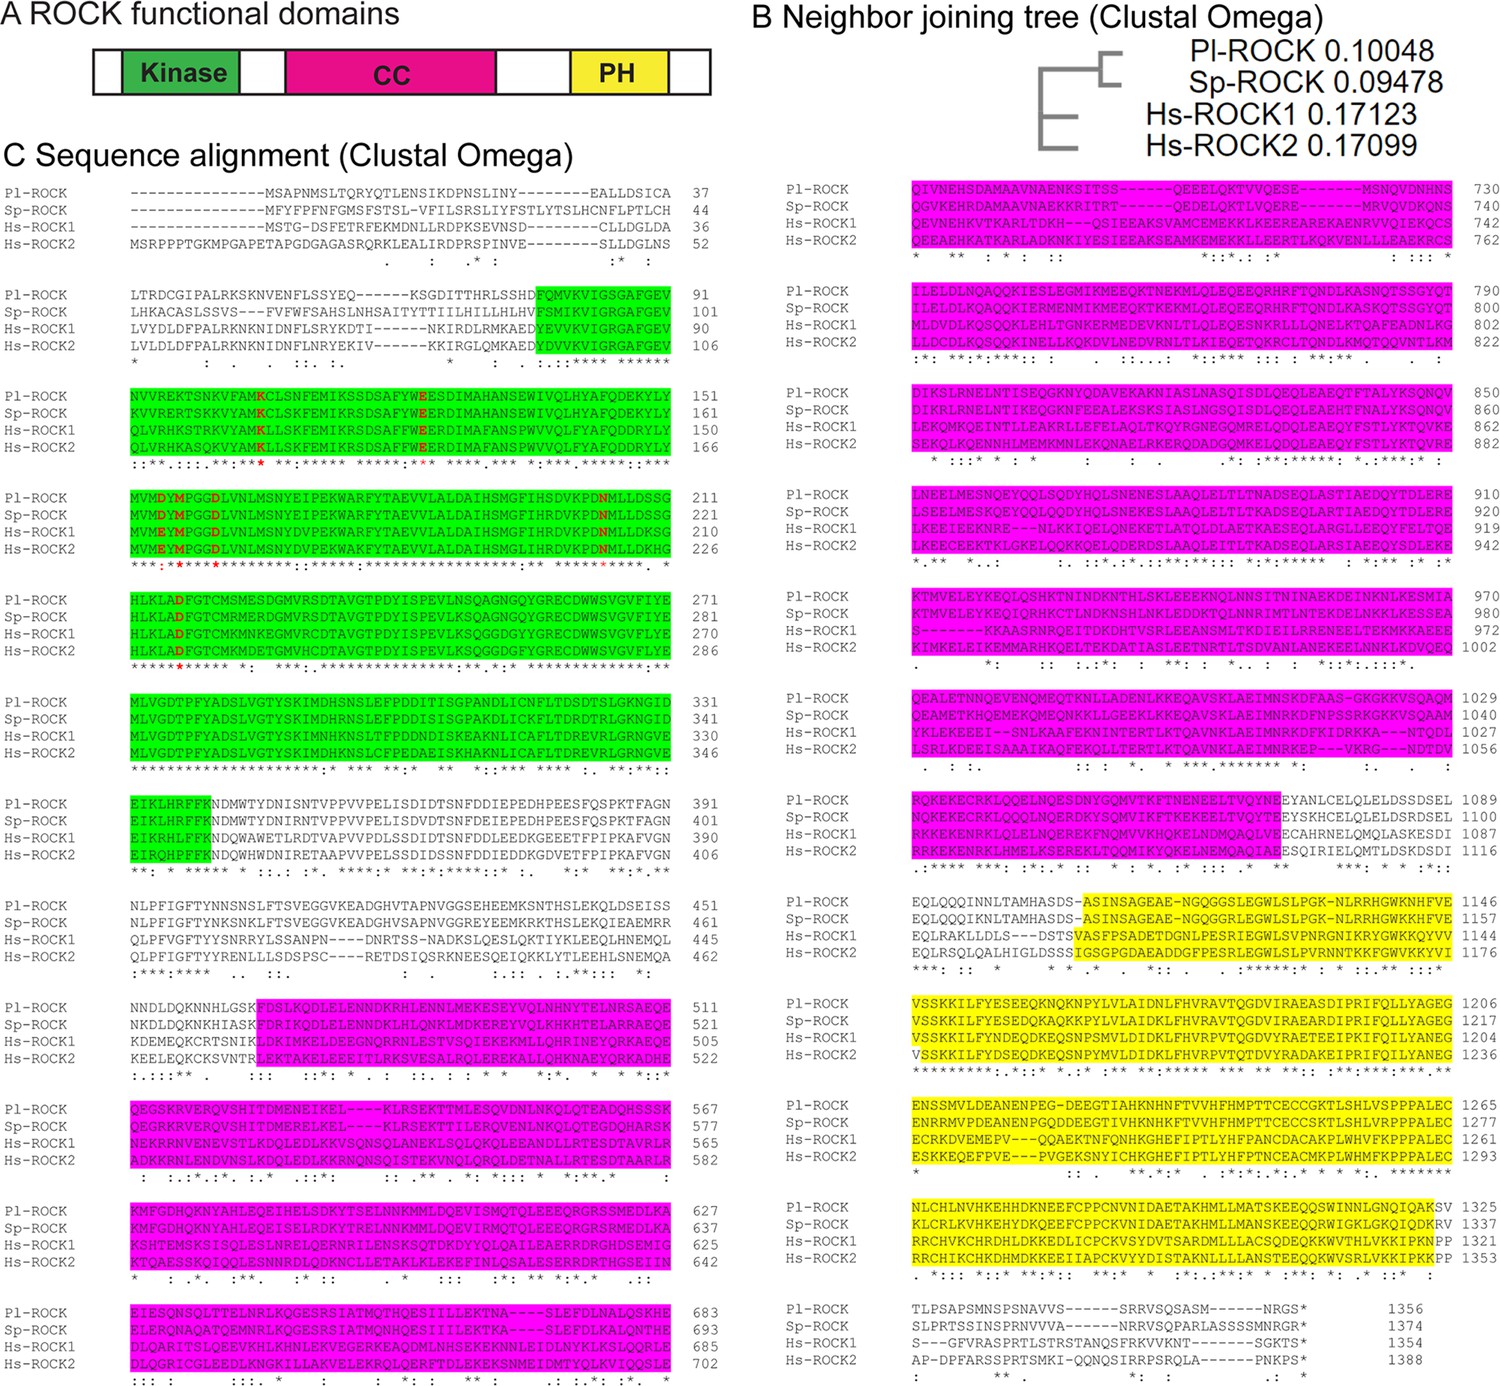
Sea urchin Rho-associated coiled-coil kinase (ROCK) sequence and conserved domains.
(A) Diagram showing the functional domains in the human ROCK protein. (B) Neighbor joining tree of human ROCK1, ROCK2, and the sea urchin genes using clustal omega showing unrooted tree. (C) Sequence alignment of Pl-ROCK, Sp-ROCK, Hs-ROCK1, and Hs-ROCK2. The amino acids where Y-27632 binds are marked in red (Jacobs et al., 2006). Asterisk indicates amino acid identity; highly similar amino acids are indicated in two dots and similar amino acids are indicated in one dot. Six of the Y-27632 bound amino acids are conserved and the seventh one is highly similar between human and sea urchin (E->D). Yellow background indicates the PH domain, green background the kinase domain, and Pink background indicates the coil-coil domain.
Figure 1—figure supplement 2
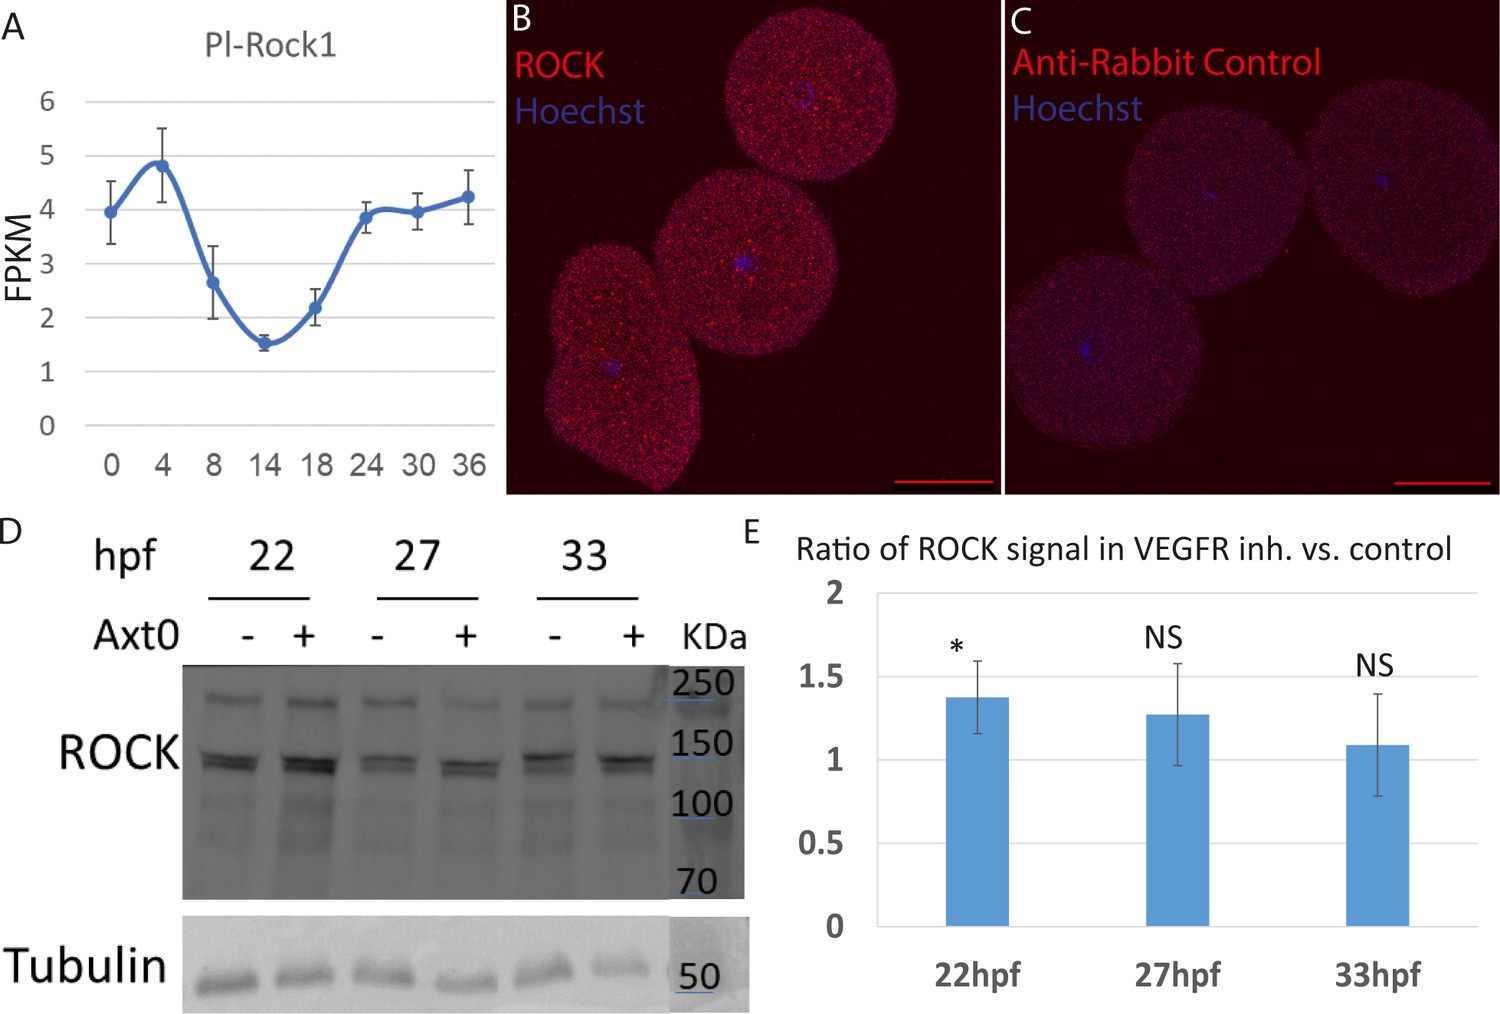
Time course of Pl-ROCK, immunostaining, and western blot of Rho-associated coiled-coil kinase (ROCK) antibody in sea urchin embryos.
(A) Time course of Pl-ROCK measured by RNA-seq in fragments per kilobase of transcript per million mapped reads (FPKM). Error bars indicate standard deviation over three independent biological replicates. The data is taken from Morgulis et al., 2019. (B) ROCK immunostaining (red) in fertilized eggs, overlaid with Hoescht nuclear staining (blue). (C) Negative control, using only the secondary anti-rabbit antibody (red), overlaid with Hoescht nuclear staining (blue). The experiment was done in three biological replicates, where in ROCK, n=80, and in the negative control n=81 embryos were scored. Scale bars in B and C are 50 µm. (D) Representative image of western blot analysis of the ROCK antibody using crude extracts of whole embryos at 22hpf, 27hpf, and 33hpf, in control and VEGFR-inhibited embryos. (E) Quantification of ROCK protein abundance in VEGFR inhibition compared to control embryos at the three timepoints. ROCK protein abundance was normalized to the Tubulin signal. Statistical significance was measured using a z-test where * indicates p<0.05, and NS - non-significant, p>0.05 (p=0.04 at 22hpf, p=0.22 at 27hpf, and p=0.4 at 33hpf). The experiments were conducted in four biological replicates for 22hpf and three biological replicates for 27hpf and 33hpf.
-
Figure 1—figure supplement 2—source data 1
RNA-seq measurement of Pl-ROCK temporal expression.
- https://cdn.elifesciences.org/articles/89080/elife-89080-fig1-figsupp2-data1-v1.xlsx
-
Figure 1—figure supplement 2—source data 2
Quantification of the western blot of Rho-associated coiled-coil kinase (ROCK) antibody in control and VEGFR inhibition.
- https://cdn.elifesciences.org/articles/89080/elife-89080-fig1-figsupp2-data2-v1.xlsx
Figure 2 with 3 supplements
Rho-associated coiled-coil kinase (ROCK) activity is essential for spicule formation, normal elongation, and branching in whole embryos and in skeletogenic cultures.
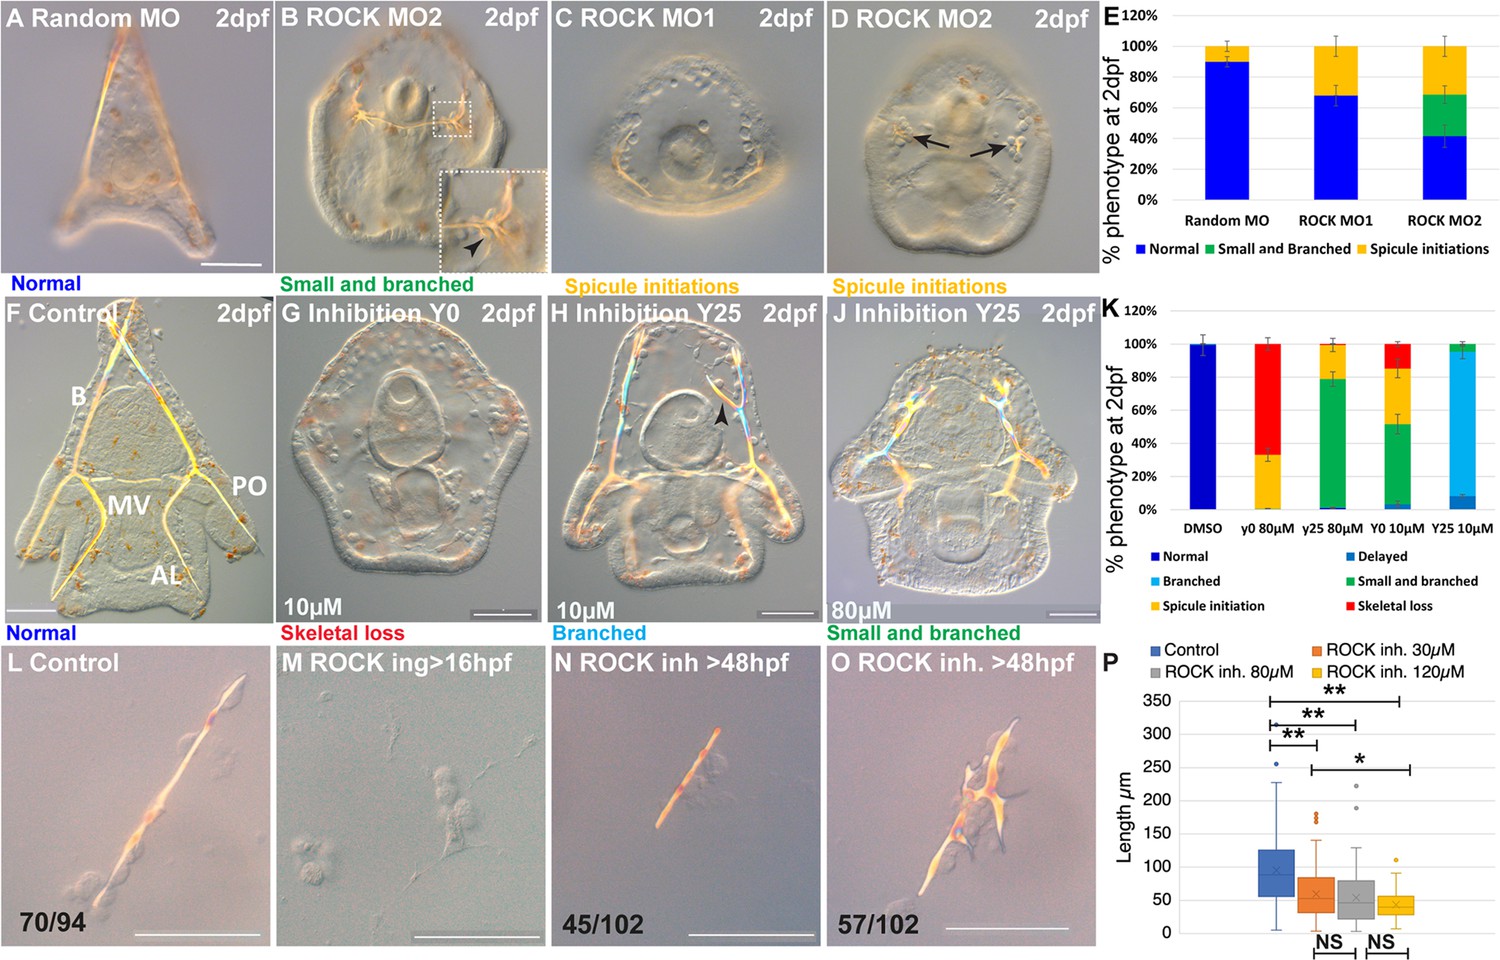
(A–E) genetic perturbation of ROCK translation using two different morpholino anti-sense oligonucleotides (MASOs) observed at 2dpf. (A) Control embryo injected with Random MASO. (B) Embryo injected with ROCK MO-2 shows ectopic spicule branching. (C, D) Embryos injected with ROCK MO-1 or MO-2 show spicule initiations. (E) Summary of MASO injection phenotypes based on 4–6 independent biological replicates. (F–K) Pharmacological perturbations of ROCK activity using 10 µM and 80 µM of the inhibitor Y27632 were observed at 2dpf. (F) Representative control embryo with normal skeletal rods, B, body; AL, anterolateral; PO, post-oral and MV, midventral. (G) Complete skeletal loss in embryos treated continuously with 10 µM ROCK inhibitor. (J) Reduced skeletal growth and enhanced ectopic branching in embryos where 10 µM ROCK inhibitor was added at 25hpf. (J) Small spicules with enhanced ectopic branching in embryos where 80 µM ROCK inhibitor was added at 25hpf. (K) Summary of perturbation phenotypes based on three to eight biological replicates for each treatment. See additional concentrations, phenotypes, and summary in Figure 2—figure supplement 2 and Supplementary file 1a. (L–O) Representative spicules from skeletogenic cell cultures in control and under 30 µM Y27632 at 72hpf. (L) linear spicule in control culture, (M) Y27632 addition at 16hpf, before spicule initiation, completely blocks spiculogenesis. (N, O) Y27632 addition after spicule initiation, at 48hpf, reduces spicule elongation (N), and enhances branching (O). (P) Quantification of spicule length in control and ROCK inhibition (>48 hpf) at 72hpf. *p<0.05, **p<0.001, Kruskal-Wallis non-parametric test. Results are based on three biological repeats for each treatment, except from 120 µm that was done in two biological repeats. Scale bars are 50 µm. In L, N, and O, the numbers at the bottom indicate the number of spicules that show this phenotypes (left) over all observed spicules (right).
-
Figure 2—source data 1
Phenotypes of Rho-associated coiled-coil kinase (ROCK) morpholino anti-sense oligonucleotides (MASO) experiments presented in Figure 2E.
- https://cdn.elifesciences.org/articles/89080/elife-89080-fig2-data1-v1.xlsx
-
Figure 2—source data 2
Phenotypes of Rho-associated coiled-coil kinase (ROCK) inhibitor experiments presented in Figure 2K and Figure 2—figure supplement 2Y.
- https://cdn.elifesciences.org/articles/89080/elife-89080-fig2-data2-v1.xlsx
-
Figure 2—source data 3
Measurements of spicule length in skeletogenic cell cultures in control and Rho-associated coiled-coil kinase (ROCK) inhibition, presented in Figure 1P.
- https://cdn.elifesciences.org/articles/89080/elife-89080-fig2-data3-v1.xlsx
Figure 2—figure supplement 1

Rho-associated coiled-coil kinase (ROCK) and F-actin expression in control and ROCK morpholino anti-sense oligonucleotides (MASO) injections at 33hpf.
Representative images of embryos stained with ROCK antibody (red), Phalloidin (green), and the skeletogenic marker 6a9 (blue) at 33hpf. (A–D) Uninjected control, (E–H) Random MASO, (I–L) ROCK MASO1, (M–P) ROCK MASO2, (Q–T) Enlargement of the marked square in A of Uninjected embryo, showing the minor overlap between the ROCK and the Phalloidin signal. (U–X) Enlargement of the marked square in M of embryo injected with ROCK MASO2. The green arrows point to the enriched F-actin signal around the spicule. These experiments were done in three independent biological replicates where the total number of embryos scored was n=24 uninjected embryos; n=25 Random MASO; n=35 ROCK MASO1; and n=35 ROCK MASO2. Scale bars are 50 µm in A and 10 µm elsewhere.
Figure 2—figure supplement 2
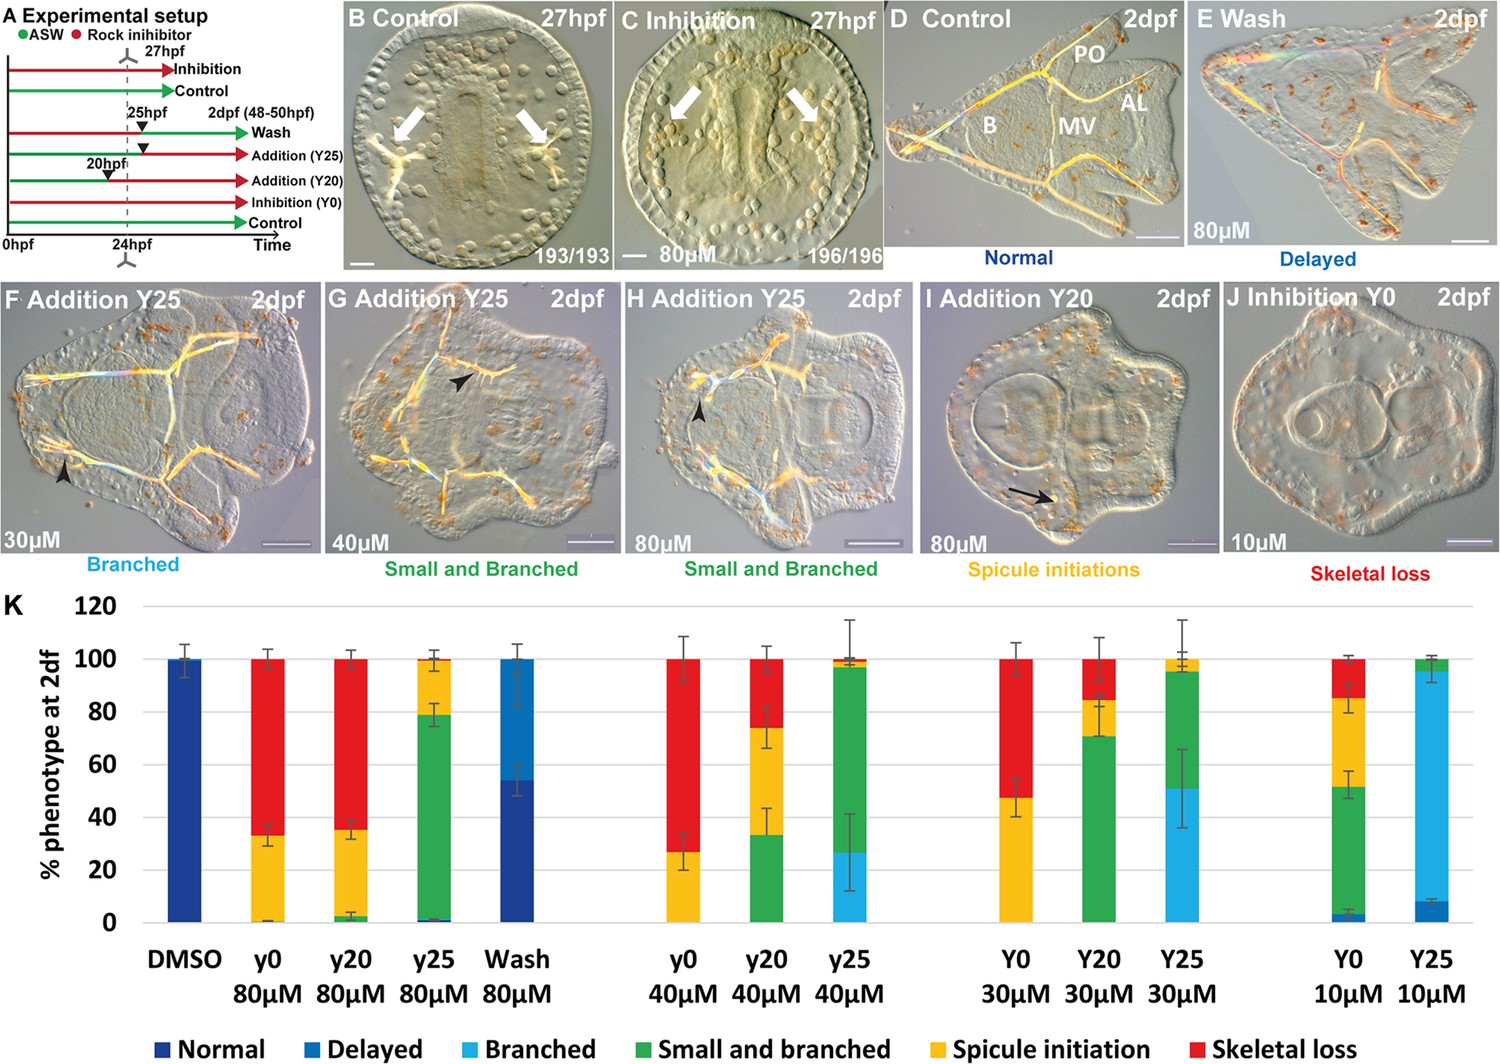
Rho-associated coiled-coil kinase (ROCK) inhibition phenotypes for different treatments and concentrations.
(A) Experimental design of the various ROCK treatments showing the time of inhibitor addition/wash. (B) Representative control embryo and (C) embryo under ROCK inhibition using 80 µM of the inhibitor Y27632 at 27hpf. The numbers at the bottom indicate the number of embryos that show this phenotypes (left) over all observed spicules (right). (D-J) Various skeletogenic phenotypes due to ROCK inhibition at different times and concentrations observed at 2dpf, organized from normal to most sever skeletogenic phenotypes. Treatment and concentrations are indicated for each image. (K) Summary of ROCK perturbation phenotypes at 2dpf. Color codes of phenotypes match the color of the phenotypes reported in B-H. Scale bars are 20 µm in B, C, and 50 µm in D-J. Results are based on three to eight biological replicates for the different treatments, the exact number of replicates and embryo scores for each experiment is provided in Supplementary file 1a.
Figure 2—figure supplement 3
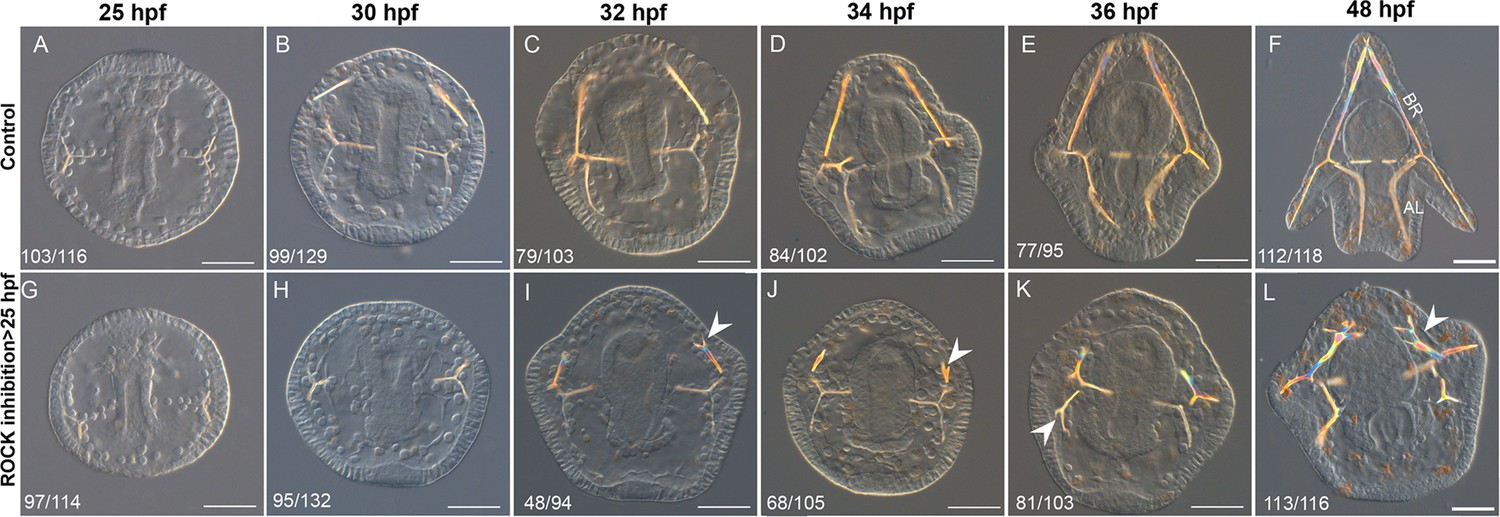
Time course of the effect of Rho-associated coiled-coil kinase (ROCK) inhibition after 25hpf.
(A–F) Representative images of control embryos from gastrulation (25hpf) until pluteus stage (48hpf). (G–L) representative images of embryos treated with 30 µM ROCK inhibitor Y27632 from 25hpf and on, at equivalent developmental stages to A–F. Arrowheads point to ectopic branching. Three biological replicates were conducted for each treatment and the numbers at the bottom left of each panel indicate the number of embryos that show this phenotype out of all embryos scored. Scale bars are 50 μm. BR- body rods, AL- anterolateral rods.
Figure 3 with 2 supplements
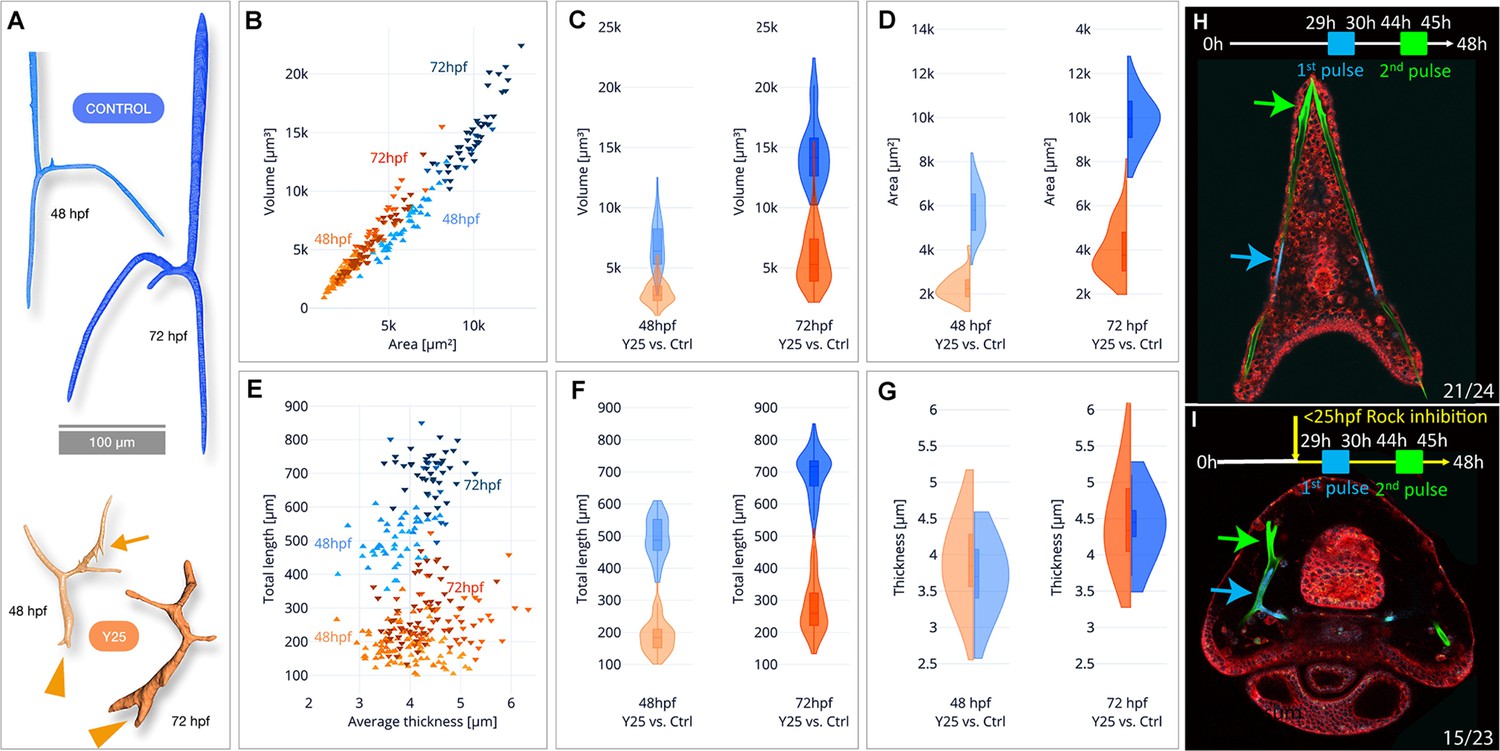
Synchrotron radiation micro-computed tomography (SR-µCT) studies of Rho-associated coiled-coil kinase (ROCK)-inhibited spicules show a reduction in skeletal volume, surface area, and total length, but not thickness and two-pulse calcein shows loss of tip-dominance.
(A) Exemplary 3D-renderings of control spicules (top, blue) and spicules where 40 µM of ROCK inhibitor was added at 25hpf (bottom, orange), dissected at 48hpf and 72hpf. Arrowheads point to tip splitting and arrows at 48hpf point to spicule dripping at the back. (B) Spicule volume vs. area for control and ROCK-inhibited spicules at 48 and 72 hpf. Each data point represents a single spicule. (C–D) Frequency distributions for volume and surface area of control and ROCK-inhibited spicules at 48 hpf and 72 hpf (left and right violin plots, respectively). (E) Spicules’ total branch length and average thickness for control and ROCK-inhibited spicules at 48 and 72 hpf. (F–G) Frequency distributions for spicule lengths and thickness of control and ROCK-inhibited spicules were dissected at 48hpf and 72hpf. (H, I) Calcein two-pulses experiment. Embryos were exposed to blue calcein at 29-30hpf, to green calcein at 44-45hpf, and stained with FM4-64 membrane marker (red) prior to image acquisition at 48hpf. (H) Control embryo, (G) Embryo where 30 µM of Y27632 was added at 25hpf. The experiments were done in three biological replicates and the numbers at the bottom indicate the number of embryos that show this phenotype out of all embryos scored.
-
Figure 3—source data 1
Measurements of spicule length, width, surface area, and volume in µ-CT.
- https://cdn.elifesciences.org/articles/89080/elife-89080-fig3-data1-v1.xlsx
Figure 3—figure supplement 1
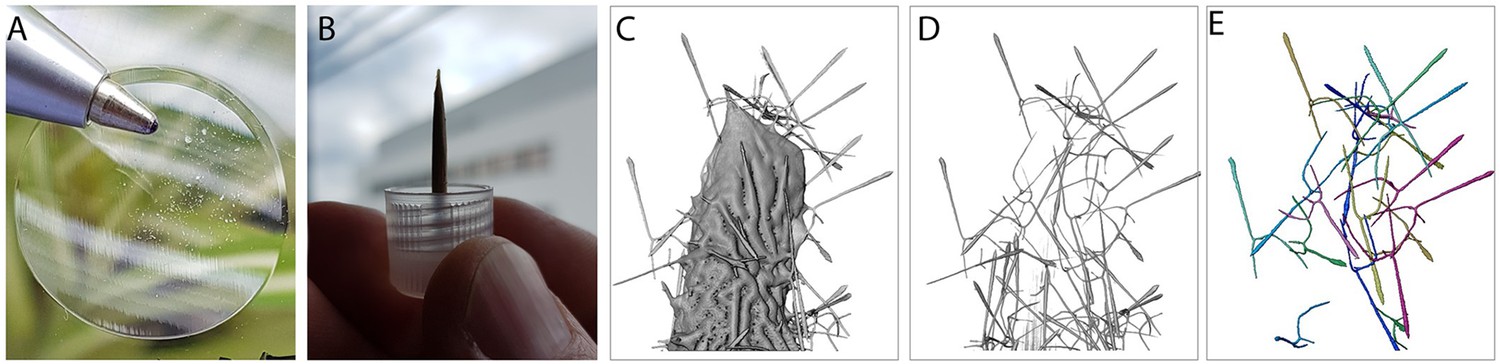
Sample preparation for synchrotron radiation micro-computed tomography (SR-µCT) data acquisition and analysis.
(A) Dissected, dried spicules were used for tomographic image acquisition. (B) Typically, hundreds to a dozen spicules were glued to sharpened toothpick tips for sample fixation. Tooth picks were mounted on 3 ml vial twist-off lids and securely stored in the vial. (C) 3D rendering of an exemplary tomographic data set, showing multiple calcitic spicules attached to the toothpick tip. (D) User-augmented data segmentation (excluding background and toothpick) and visualization of intact spicules were performed in Amira. (E) Volume, area, length, and thickness measurements were performed on segmented and labeled spicules as described in the methods section.
Figure 3—figure supplement 2
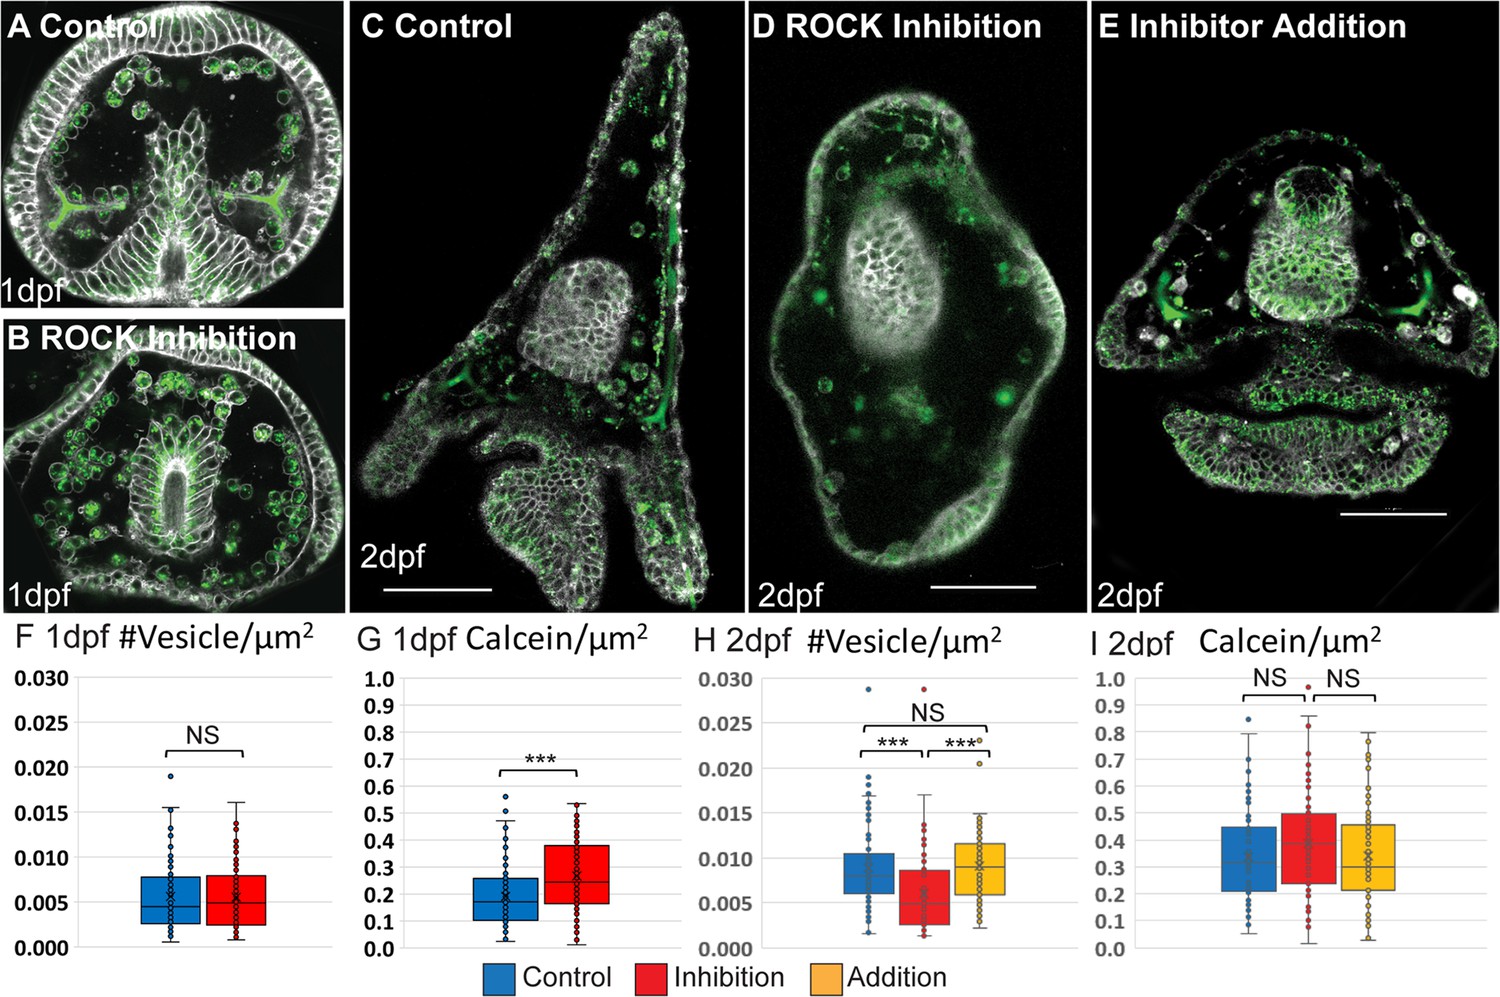
Effect of Rho-associated coiled-coil kinase (ROCK) inhibition on calcein stained area and vesicle number.
(A-E) Confocal images of calcein staining (green) and FM4-64 membrane marker (white) show the presence of calcium vesicles in the skeletogenic cells in normal and ROCK-inhibited embryos at 1dpf and 2dpf. Scale bars are 50 µm. (F, H) Vesicle number per µm2 in the skeletogenic cells in control and ROCK inhibition at 1dpf (F) and 2dpf (H). (G, I) calcein pixels per µm2 in the skeletogenic cells in control and ROCK inhibition at 1dpf (G) and 2dpf (I). Inhibition refers to continuous inhibition from fertilization, and addition refers to the addition of the inhibitor at 25hpf. Experiments were performed in four independent biological replicates where in each condition at least 30 embryos were measured. Each box plot shows the median (black line), average (x) the first and the third quartiles (edges of boxes), and all measured points. Statistical significance was measured using paired two-tailed t-test where, * indicates p<0.05, and *** indicates p<0.0005. (n=3, exact number of cells in each condition is provided in Supplementary file 1a).
-
Figure 3—figure supplement 2—source data 1
Quantification of vesicle number and area in control and Rho-associated coiled-coil kinase (ROCK) inhibition.
- https://cdn.elifesciences.org/articles/89080/elife-89080-fig3-figsupp2-data1-v1.xlsx
Figure 4
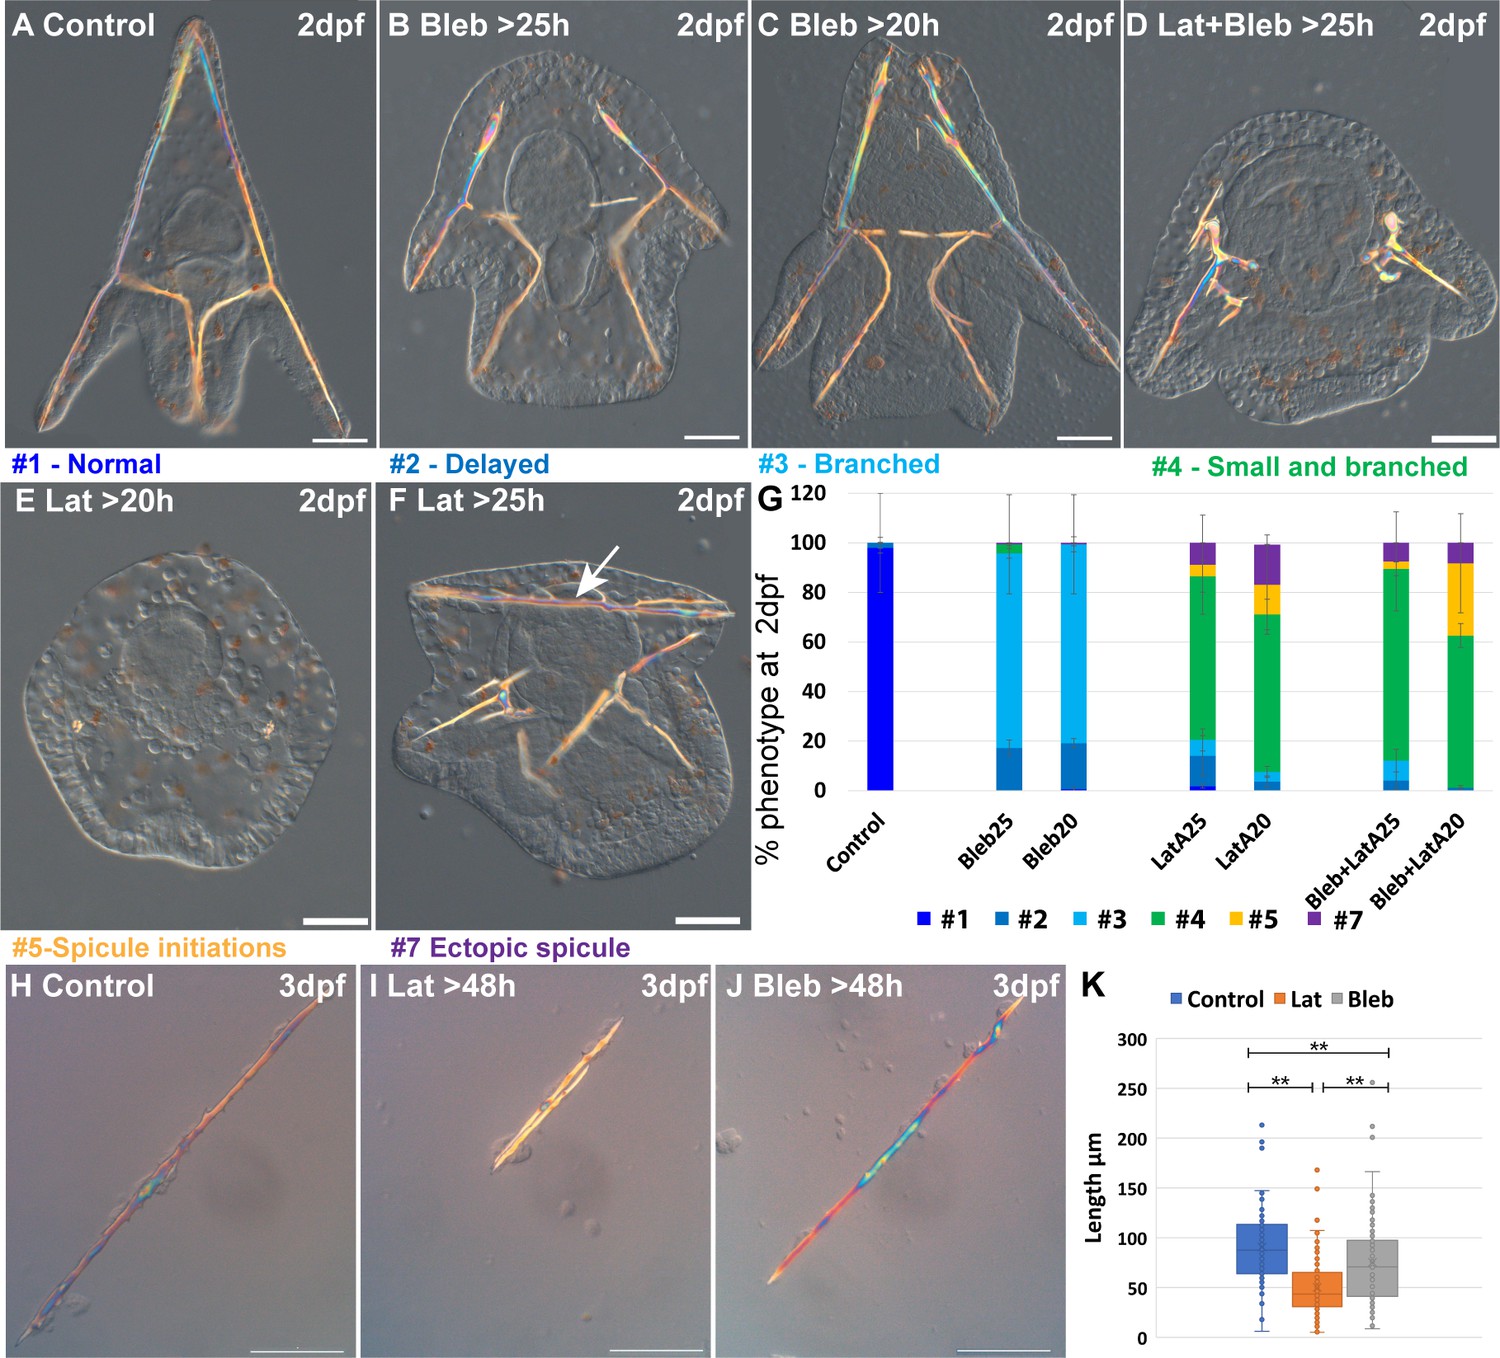
Actin polymerization and myosin activation affect skeletal growth and branching.
(A–F) representative embryos showing the effect of actomyosin perturbations at 2df. (A) Control embryo (B) embryo treated with 2 μM Blebbistatin >25 hpf, (C) embryo treated with 2 μM Blebbistatin >20 hpf, (D) embryo treated with 2 nM Latrunculin-A and 1.5 μM Blebbistatin >25 hpf, (E) embryo treated with 2 nM Latrunculin-A >20 hpf, (F) embryo treated with 2 nM Latrunculin-A >25 hpf, arrow pointing to the additional spicule rod. (G) Statistics of Latrunculin-A and Blebbistatin phenotypes, color code of phenotype is indicated in the representative images. Error bars indicate standard deviation. All treatments were conducted in at least three biological replicates and the exact number of replicates and scored embryos are provided in Supplementary file 1d. (H–J) Representative spicules recorded at 72hpf from (H) control skeletogenic cell culture, (I) skeletogenic cell culture were 2 nM Latrunculin-A was added at 48hpf and (J) skeletogenic cell culture were 2 μM Blebbistatin was added at 48hpf. (K) Quantification of spicule length in the different treatments at 72hpf **p<0.001, Kruskal-Wallis non-parametric test. Results are based on three biological repeats for each treatment. Scale bars are 50 μm.
-
Figure 4—source data 1
Phenotypes of Blebbistatin and Latrunculin-A (Lat-A) experiments in whole embryos presented in Figure 4G.
- https://cdn.elifesciences.org/articles/89080/elife-89080-fig4-data1-v1.xlsx
-
Figure 4—source data 2
Measurements of spicule length in skeletogenic cell cultures in control, of Blebbistatin and Latrunculin-A (Lat-A), presented in Figure 4K.
- https://cdn.elifesciences.org/articles/89080/elife-89080-fig4-data2-v1.xlsx
Figure 5
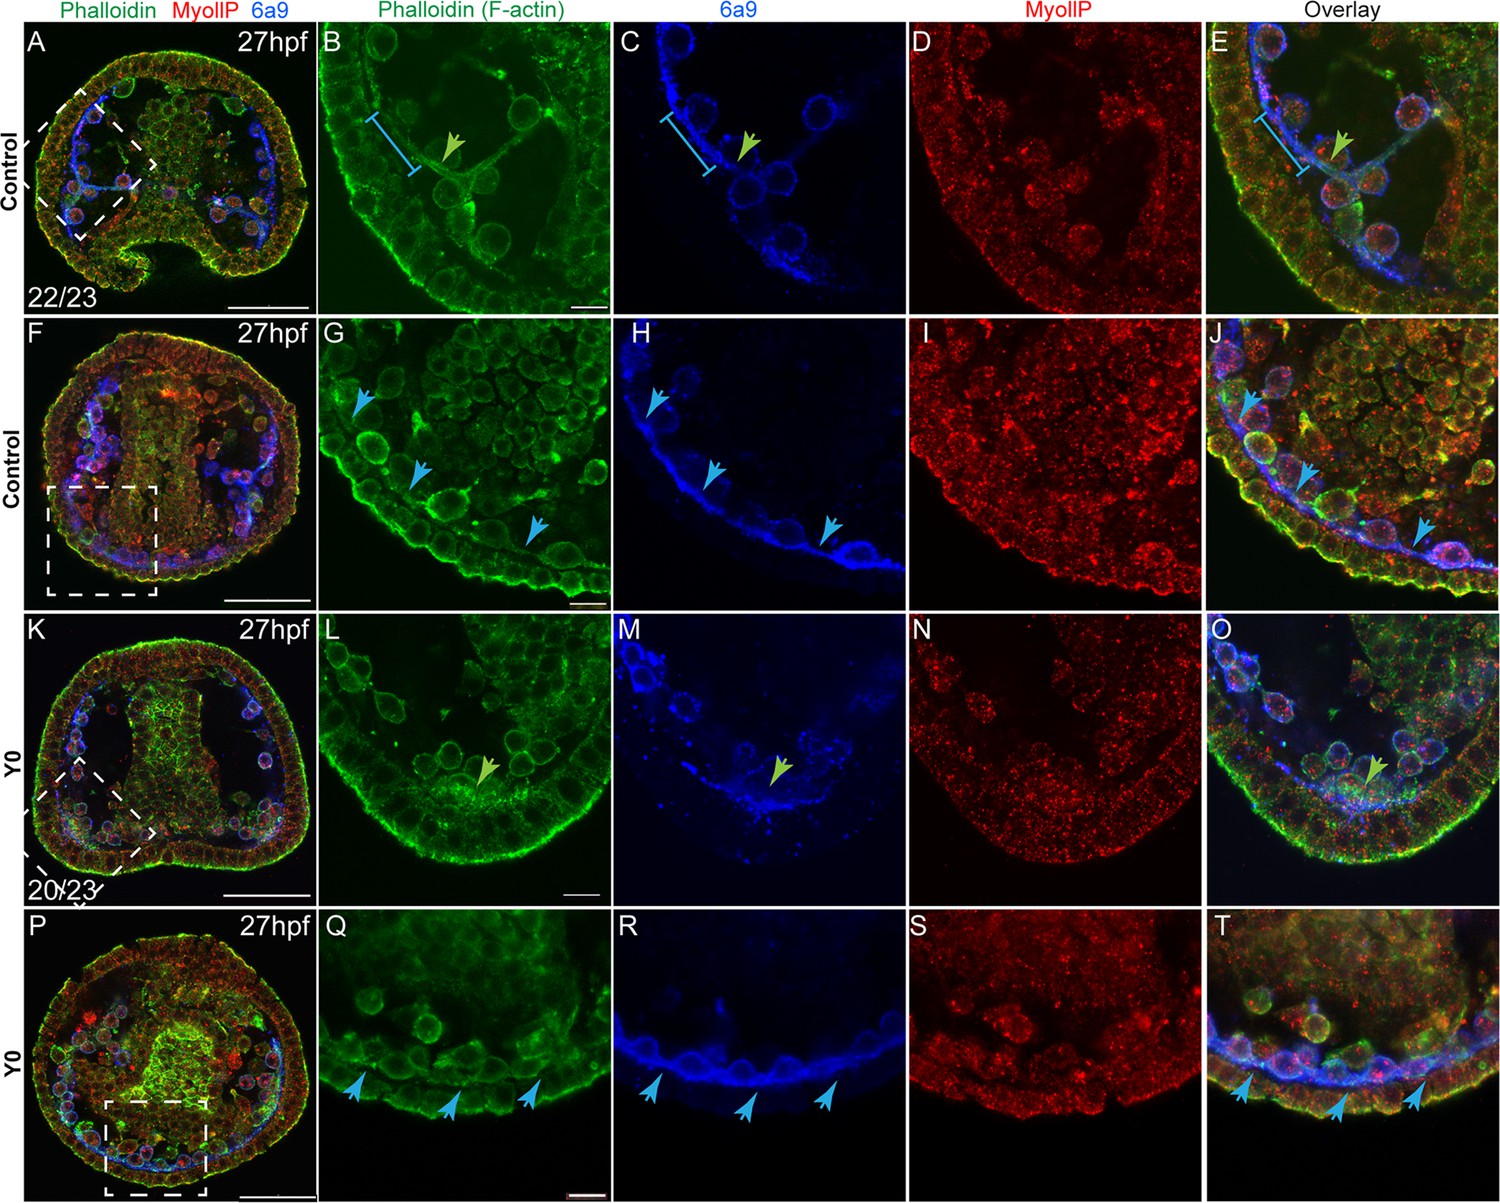
Rho-associated coiled-coil kinase (ROCK) inhibition effect on F-actin organization and MyoII activity at 27hpf.
Representative images showing normal embryos (A–J) and embryos treated with ROCK inhibitor from fertilization (K-T, 80 µM), at 27hpf. Phalloidin (green) was used to stain F-actin, MyollP (red) was used to stain phosphorylated myosinII and 6a9 (blue) was used to mark the skeletogenic cells. Right panels show enlargements of the rectangle sections marked in the left most panels. Green arrows point to regions that show enriched F-actin signal, blue arrows point to the pseudopodia cable. The blue line in B, C, and E marks a region of the pseudopodia cable that is stained by 6a9 but has a low F-actin signal. The experiments were done in three biological replicates, the numbers at the bottom left of (A, K) indicate the number of embryos that show this phenotype out of all embryos scored. Scale bar in A, F, K, and P is 50 μm, and in B, I, N, and S is 10 μm.
Figure 6
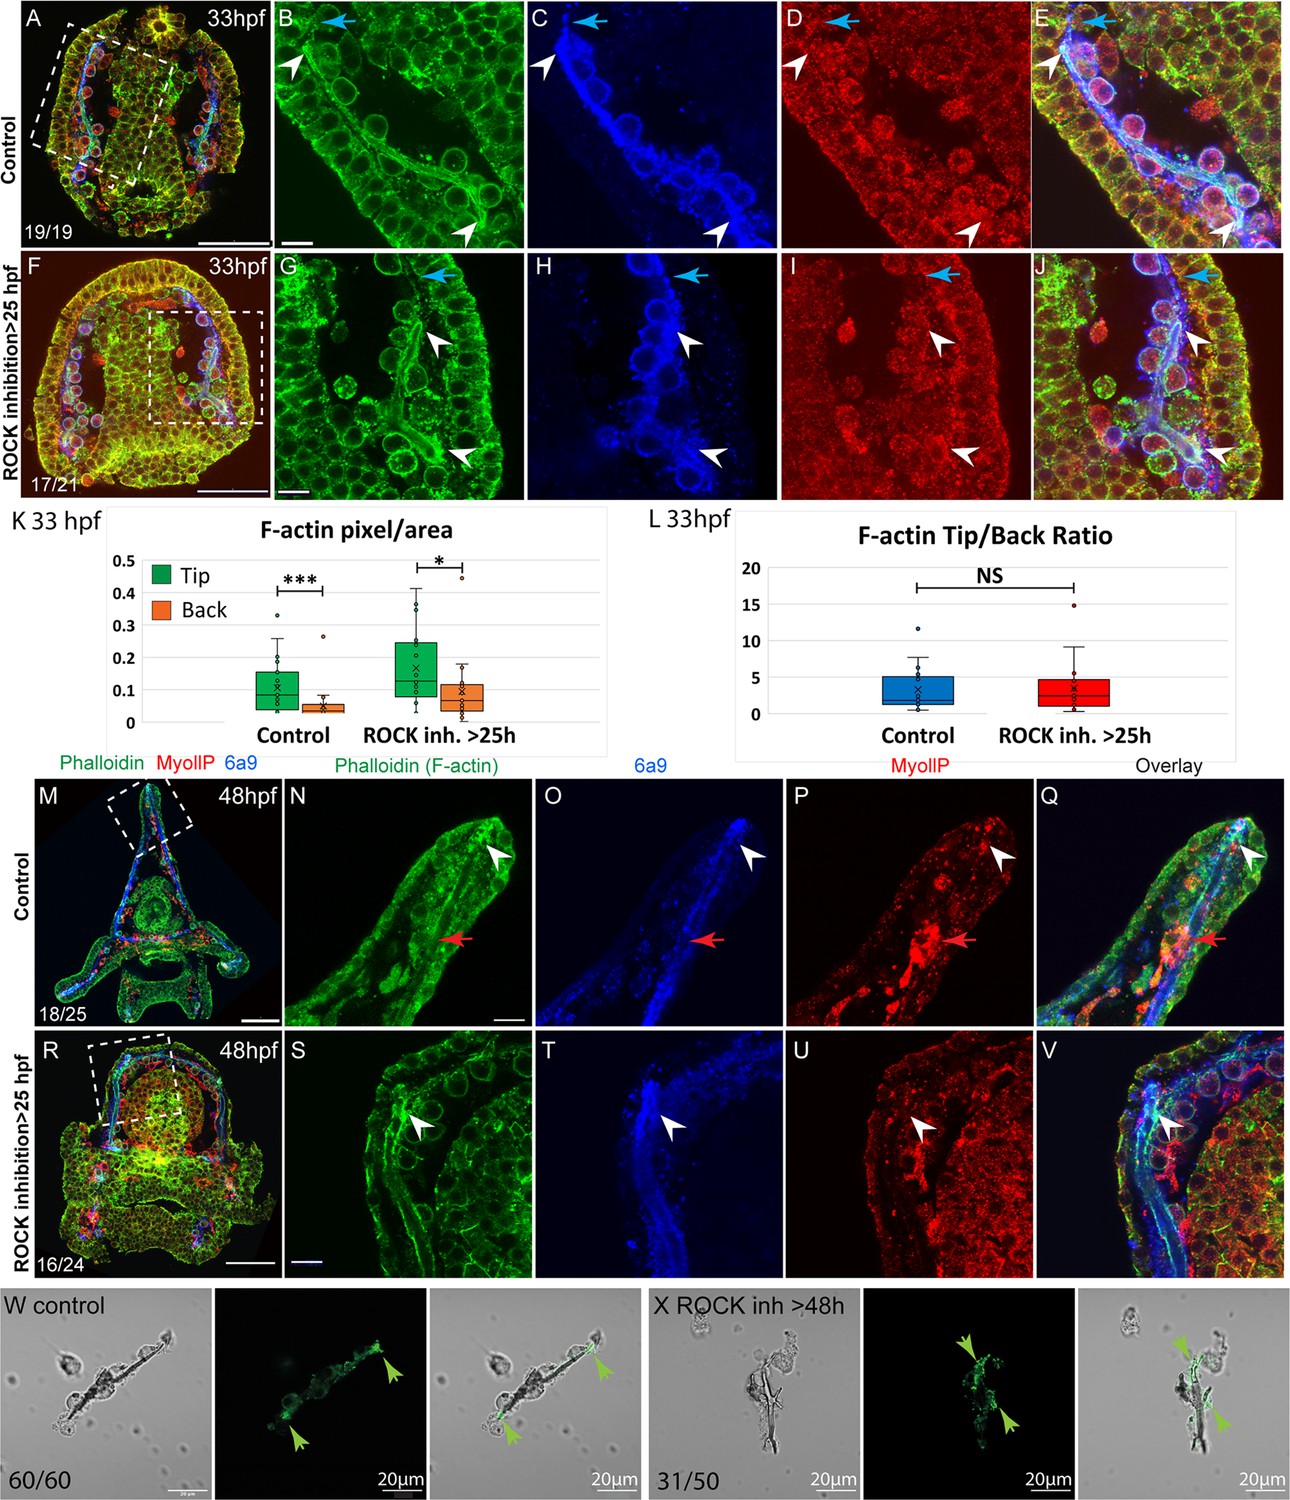
F-actin filaments are enriched at the tips of the spicules and the tip-to-back ratio is unaffected by ROCK inhibition.
(A–J) Representative images at 33hpf, showing normal embryo (A–E) and embryos treated with 30 µM Rho-associated coiled-coil kinase (ROCK) inhibitor from the gastrula stage >25 hpf, (F–J). Embryos are stained with Phalloidin (green), MyollP antibody (red), and 6a9 (blue). (B–E, G–J) enlargement sections of the spicule area marked with rectangle in A and F. White arrowheads point to the enriched F-actin signal at the tips. Blue arrows point to the region of the pseudopodia cable that is not filled with the spicule cavity. (K, L) quantification of the tip-to-back F-actin signal (number of green pixels per area) at 33hpf in control embryos and ROCK inhibition >25 hpf. Each box plot shows the average (x), median (middle line), the first and the third quartiles, and all the points measured. Asterisks indicate statistical significance in paired t-test, where * is p<0.05 and *** is p<0.0005, NS- not significant. (M–V) similar experiments to (A–J), at 48hpf, 40 µM of ROCK inhibitor added at 25hpf. Red arrows point to non-skeletogenic cells enriched with MyoIIP. The experiments were repeated in three biological replicates and the numbers at the bottom left of (A, F, M, R) indicate the number of embryos that show this phenotype out of all embryos scored. Scale bar in A, F, M, R is 50 µm and in B, G, N, S, is 10 µm. (W, X) representative spicules out of three biological replicates from control skeletogenic cell culture (W, n=60), and skeletogenic cell treated with 30 µM ROCK inhibitor added at 48hpf and recorded at 72hpf (X, n=52). Left panel is phase image, middle panel is phalloidin staining and right panel shows the overlay. Green arrows point to the enhanced F-actin signal at the tips. Scale bar is 20 μm.
-
Figure 6—source data 1
Measurements of F-actin signal in the tips vs. the back of the spicules in control and under Rho-associated coiled-coil kinase (ROCK) inhibition, presented in Figure 6K and L.
- https://cdn.elifesciences.org/articles/89080/elife-89080-fig6-data1-v1.xlsx
Figure 7 with 1 supplement
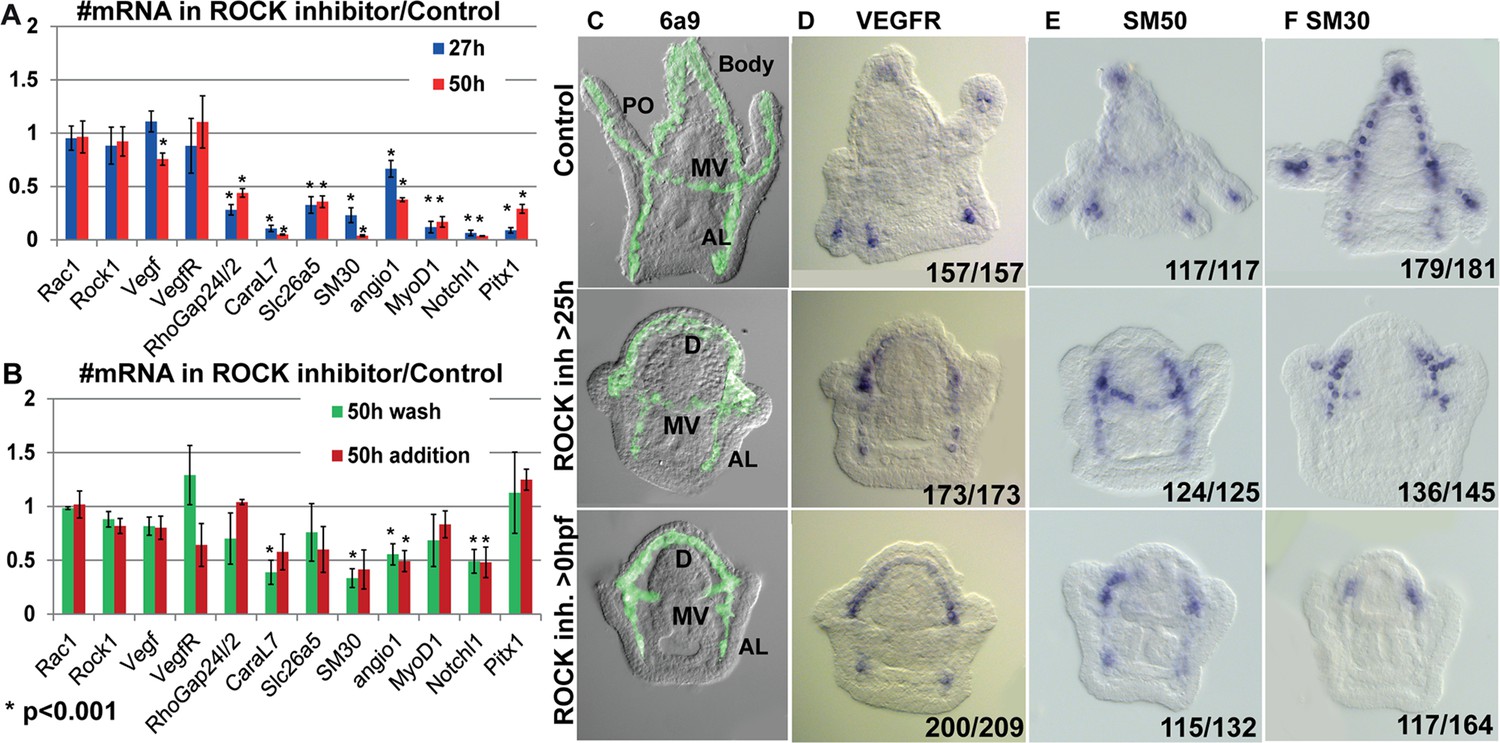
Rho-associated coiled-coil kinase (ROCK) activity is essential for normal gene expression in the skeletogenic cells.
(A, B) The effect of 80 µM ROCK inhibition on gene expression. (A) Continuous ROCK inhibition at 27hpf and 50 hpf (n=4). (B) Addition of ROCK inhibitor at 25hpf and the wash of ROCK inhibitor at 25hpf, measured at 50hpf (n=3). Asterisks indicate p<0.001, one-tailed z-test. Error bars show standard deviation. (C–F) Representative images of control embryos (top panels), embryos where ROCK inhibitor was added at 25hpf (middle panels), and embryos that were exposed to continuous ROCK inhibition (bottom panels), at the pluteus stage (~48 hpf). (C) skeletogenic cell marker, 6a9. MV, midventral; AL, anterolateral, and PO, Post-oral rods, D, dorsal skeletogenic chain. (D–F) spatial expression of skeletogenic genes. Gene names are indicated at the top of each panel. Numbers at the bottom of each image indicate the number of embryos that show this phenotype (left) out of all embryos scored (right), conducted in at least three independent biological replicates.
-
Figure 7—source data 1
Quantitative polymerase chain reaction (QPCR) measurements of gene expression in control and under ROCK inhibition presented in Figure 7A and B.
- https://cdn.elifesciences.org/articles/89080/elife-89080-fig7-data1-v1.xlsx
Figure 7—figure supplement 1
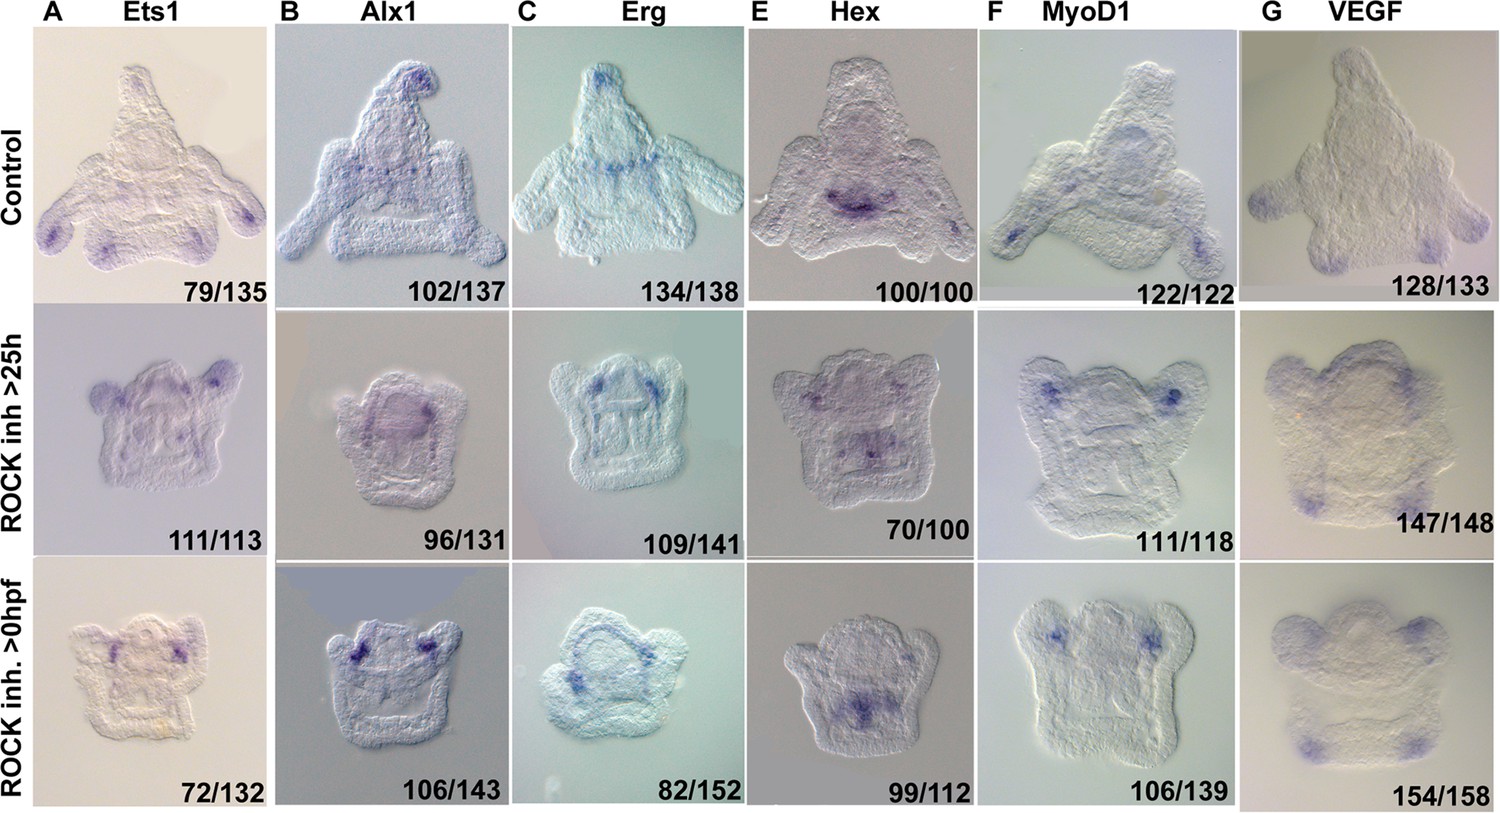
Rho-associated coiled-coil kinase (ROCK) activity is essential for normal gene expression in the skeletogenic cells.
Representative images of control embryos (top panels), embryos where ROCK inhibitor was added at 25hpf (middle panels), and embryos that were exposed to continuous ROCK inhibition (bottom panels), at the pluteus stage (~48 hpf). Gene names are indicated at the top of each panel. Numbers at the bottom of each image indicate the number of embryos that show this phenotype (left) out of all embryos scored (right), conducted in at least three independent biological replicates.
Figure 8
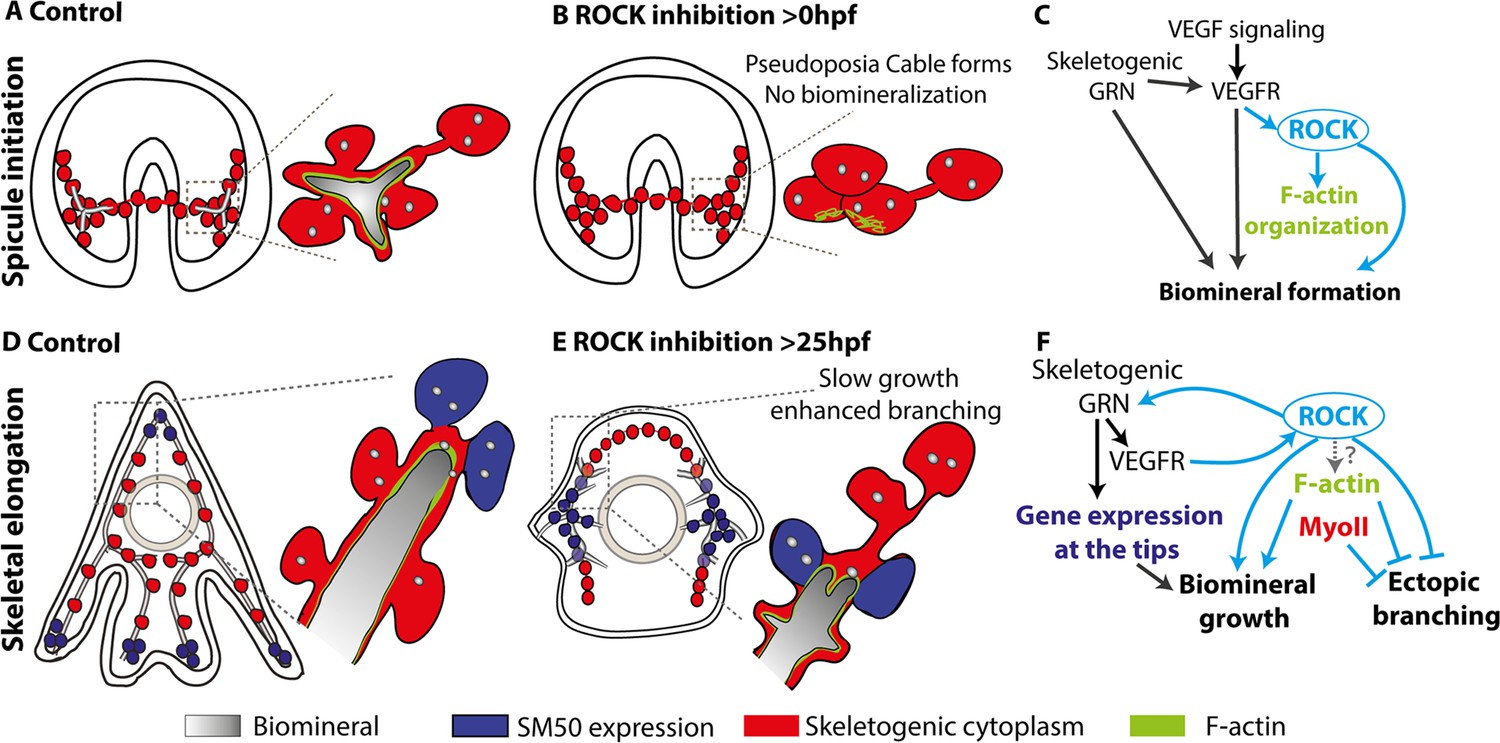
The role of Rho-associated coiled-coil kinase (ROCK) and the actomyosin network in sea urchin skeletogenesis, summary.
(A) The spicule forms at about 24hpf in P. lividus and at 27hpf, the triradiate spicule is coated with F-actin. (B) ROCK activity is required for spicule initiation and for F-actin organization around the spicule. (C) model of the functional links between the skeletogenic gene regulatory network (GRN), ROCK, F-actin, and their skeletogenic outcomes, during spicule initiation (~24–27 hpf in P. lividus). Cian arrows indicate links discovered in this work. (D) During skeletal elongation, F-actin is detected around the spicule cavity and is enriched at the tips of the rods. The expression of SM50 and some other skeletogenic genes, is localized to the tips of the rods. (E) under the addition of ROCK inhibitor, skeletal growth rate is reduced, and ectopic spicule branching is observed. The expression of skeletogenic genes is localized to the vicinity of the growing rods. (F) the functional links between the skeletogenic GRN, ROCK, F-actin, and MyoII and their skeletogenic outcomes during skeletal elongation. Cian arrows indicate links discovered in this work.
Tables
Key resources table
| Reagent type (species) or resource | Designation | Source or reference | Identifiers | Additional information |
|---|---|---|---|---|
| Antibody | ROCK2 +ROCK1 antibody | Abcam | AB-ab45171 | IF (1:70) WB (1:300) |
| Sequence-based reagent | MASO | This paper | ROCK MASO1 | AGACATATTTGGAGCCGA[CAT]CCTG |
| Sequence-based reagent | MASO | This paper | ROCK MASO2 | TCTCTTGCGTTATATTCCACTAAGT |
| Chemical compound, drug | Y27632 | Cayman chemical | 10005583 CAS Registry No. 129830-38-2 | 10–120 µM |
| Chemical compound, drug | Axitinib | Selleckchem, Houston, TX, USA | AG013736 | 150 nM |
| Chemical compound, drug | Latrunculin-A | Thermo Fisher Scientific | L12370 | 2 nM |
| Chemical compound, drug | Blebbistatin | Enco | 13013–5 | 1.5–2 µM |
Additional files
-
Supplementary file 1
Additional statistical information for ROCK inhibition and micro-CT experiments.
(a) Rho-associated coiled-coil kinase (ROCK) inhibition experimental details. The table provides the number of biological replicates and embryos scored for each experiment with ROCK inhibitor. (b) µCT statistics of control and ROCK inhibited spicules. The table provides the details of the number of spicules measured, average and standard deviation of measured length, thickness, volume, and surface area. (c) µCT statistical significance. The table provides the statistical significance between µCT measurements of control and ROCK-inhibited spicules at 2dpf and 3dpf, based on the parametric student’s T-test. (d) Lantrunculin-A and Blebbistatin experimental details. The table provides the number of biological replicates and embryos scored for each experiment with Lantrunculin-A and Blebbistatin.
- https://cdn.elifesciences.org/articles/89080/elife-89080-supp1-v1.docx
-
MDAR checklist
- https://cdn.elifesciences.org/articles/89080/elife-89080-mdarchecklist1-v1.docx
Download links
A two-part list of links to download the article, or parts of the article, in various formats.
Downloads (link to download the article as PDF)
Open citations (links to open the citations from this article in various online reference manager services)
Cite this article (links to download the citations from this article in formats compatible with various reference manager tools)
ROCK and the actomyosin network control biomineral growth and morphology during sea urchin skeletogenesis
eLife 12:RP89080.
https://doi.org/10.7554/eLife.89080.4


