Disease modeling and pharmacological rescue of autosomal dominant retinitis pigmentosa associated with RHO copy number variation
- Department of Ophthalmology, University of California, San Francisco, United States
- Eli and Edythe Broad Center of Regeneration Medicine & Stem Cell Research University of California, San Francisco, United States
- Blueprint Genetics, United States
- Section on Cellular Differentiation, Division of Translational Medicine, Eunice Kennedy Shriver National Institute of Child Health and Human Development, National Institutes of Health, United States
- Immunology and Regenerative Medicine, Genentech, United States
Figures
Figure 1 with 1 supplement
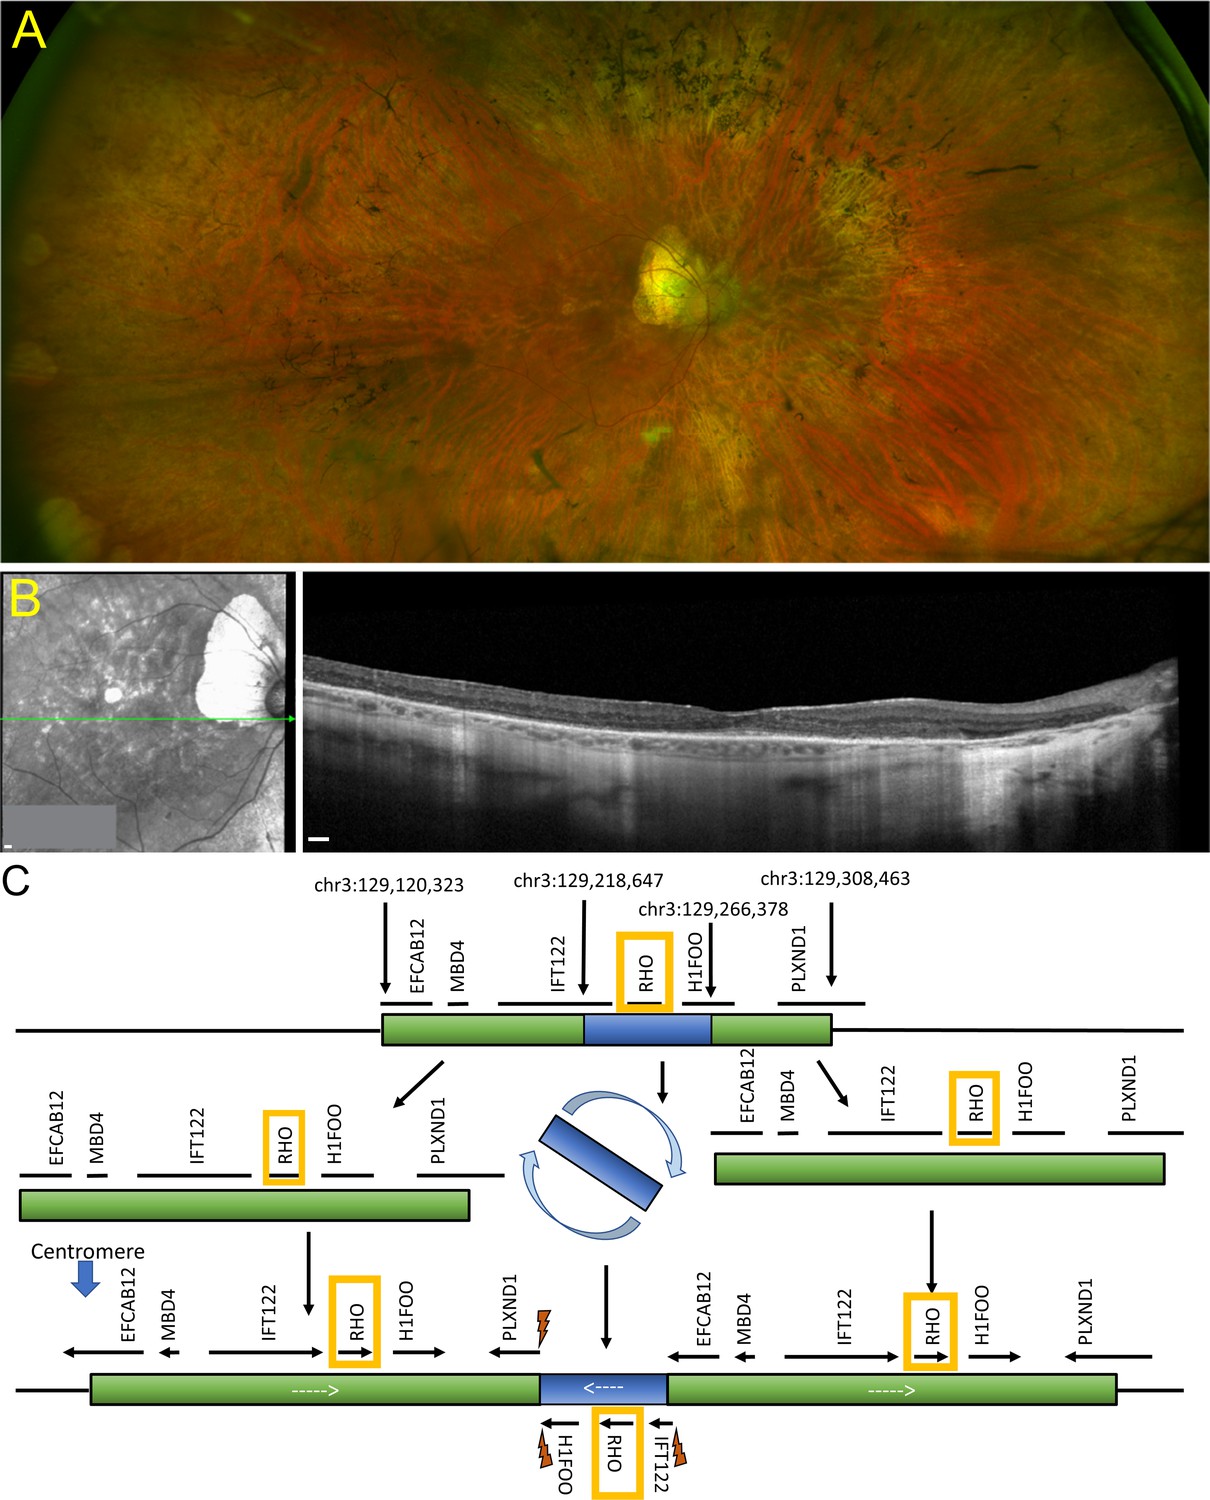
Retinal imaging and next-generation sequencing.
(A) Ophthalmological color fundus examination of a patient clinically diagnosed of RHO-CNV displaying bone spicule pigmentary changes. (B) SD-OCT image showing extensive loss of the outer retinal layers leaving a small intact island at the fovea. (C) Schematic illustration of NGS using a 266-gene retinal dystrophy panel showing a complex chromosome 3q22 duplication rearrangement resulting in an inverted 48 kb triplicated region embedded within a 188 kb duplication forming three apparently intact RHO genes on one allele and a fourth, unaltered RHO on the homologous allele. Lightning bolts represent genomic breakpoints of triplication insertion. RHO was the only gene that is fully triplicated. NGS = next-generation sequencing; SD-OCT=spectral domain optical coherence tomography. CNV = copy number variation. Scale bar = 200 µm in A and B.
Figure 1—figure supplement 1

RHO-CNV identification.
(A) Pedigree analysis chart of four generations showing multiple family members affected for autosomal dominant retinitis pigmentosa (adRP), including a male-male transmission, indicating for autosomal dominant inheritance pattern. (B) Fundus photography showing the retina of control (RC) and irregular pigmentation pattern in a patient (RM). All the clinical hallmarks of RP including black-spicule pigmentation, attenuated blood vessel, and optic disc pallor seen in patient are indicative of RP. CNV = copy number variation.
Figure 2 with 1 supplement
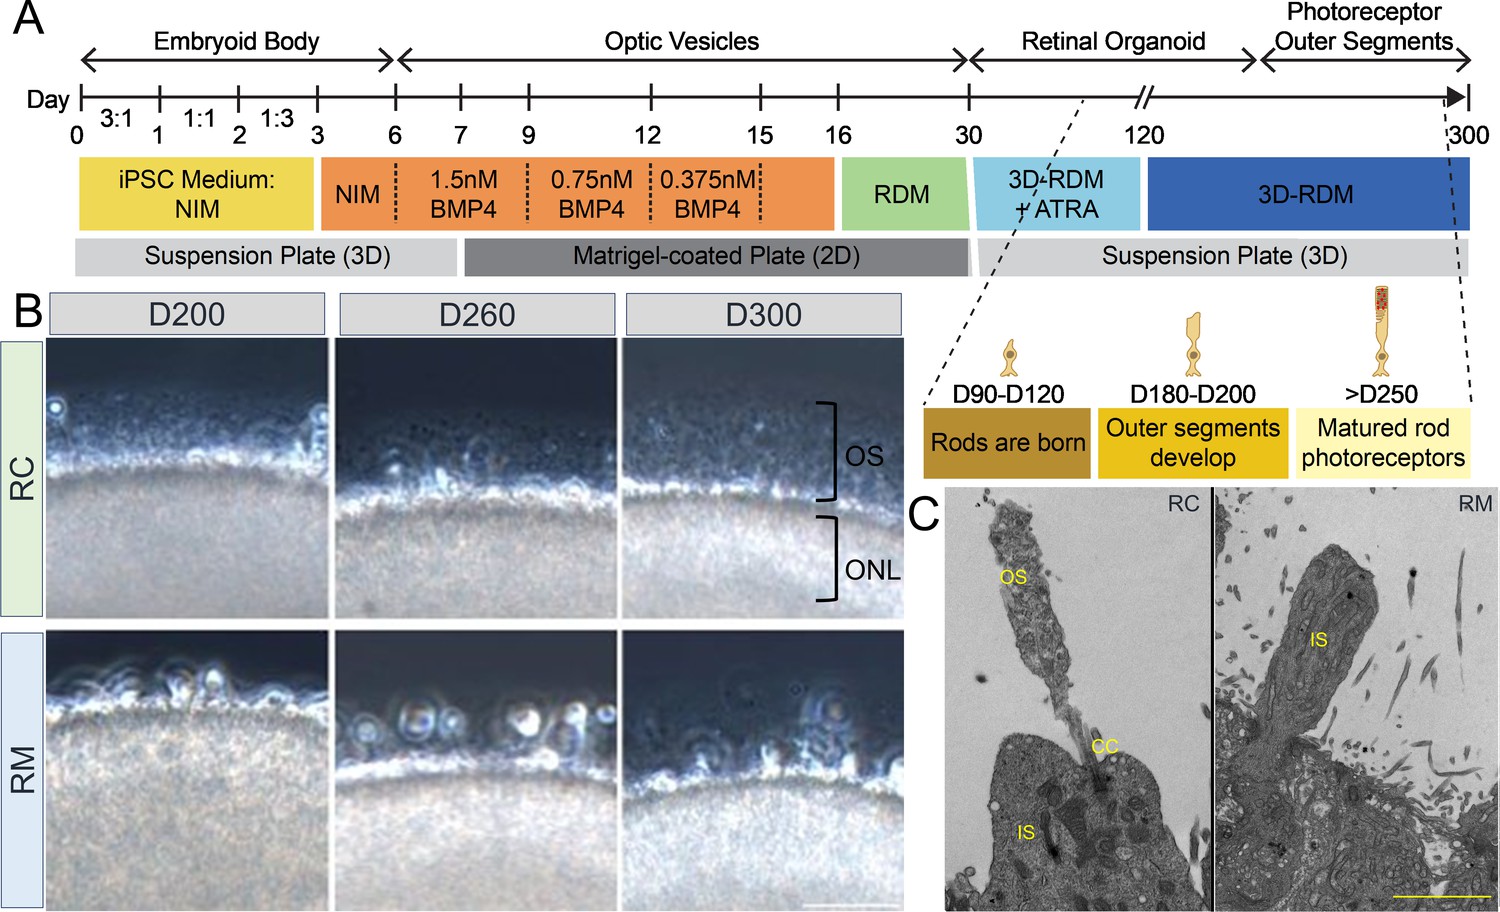
RHO-CNV disease modeling using induced pluripotent stem cell (iPSC)-derived retinal organoids showed morphological defects.
(A) Schematic representation showing the timeline of human retinal differentiation and maturation including the birth and development of rod photoreceptors. (B) Phase contrast microscopy images showing OS, long hair-like protrusions from ONL of the differentiated photoreceptors present at the apical surface of control (RC) retinal organoids at day 200, 260, and 300 (top). Conversely, retinal organoids from patient (RM) showing shorter protrusions which do not extend progressively over long-term culturing indicating maturation defects (bottom). (C) Electron microscopy images showing ultra-magnification of distinct OS, IS, and CC structures of rod photoreceptors in control organoids and the absence of OS in patient organoids. CC = connecting cilium; IS = inner segments; ONL = outer nuclear layer; OS = outer segments. CNV = copy number variation. Scale bar = 50 µm. Raw EM files in attached Figure 2—source data 1.
-
Figure 2—source data 1
Raw EM files.
- https://cdn.elifesciences.org/articles/90575/elife-90575-fig2-data1-v1.zip
Figure 2—figure supplement 1
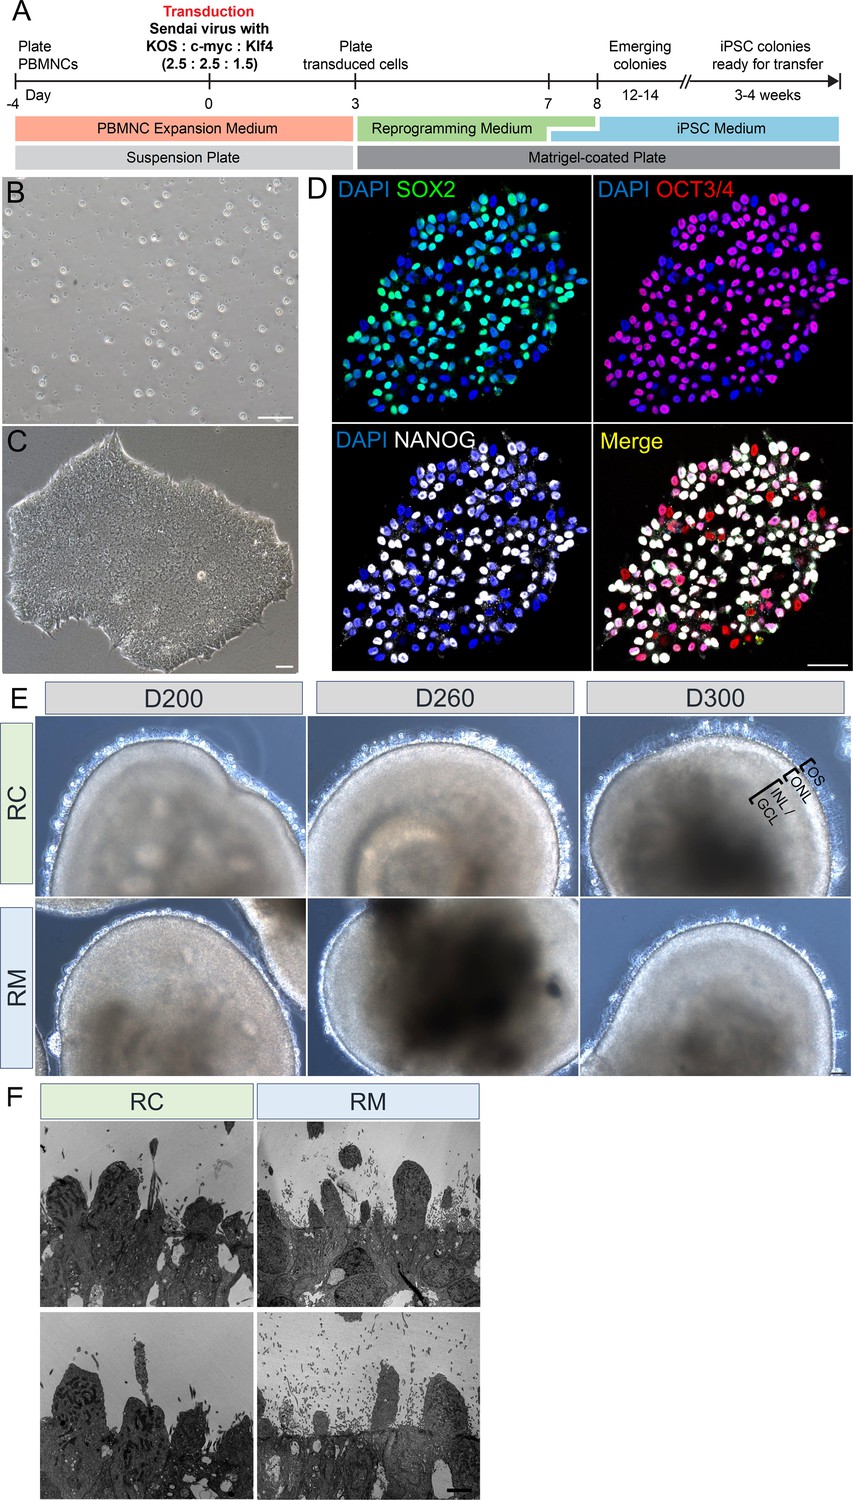
Patient-specific iPSC reprogramming and retinal organoids.
(A) Timeline depicting the sequence of events for reprogramming the PBMNCs to iPSCs via Cytotune iPS 2.0 Sendai Reprogramming kit. (B, C) Representative phase contrast microscopy image of PBMNCs and a stably generated iPSC colony. (D) Confocal microscopic images of an iPSC colony expressing pluripotent markers, SOX2, OCT3/4, NANOG, and a co-localized image of all three pluripotent markers. DAPI labels nuclei. Scale bar = 25 µm. (E) Low-power bright-field microscopic images showing full view of a retinal organoid from control (RC) and patient (RM) at different time-points of photoreceptor maturation. Patient (RM) organoids showed much shorter and less dense protrusions in comparison to control (RC). Scale bar = 50 µm. (F) Representative images of TEM analysis of multiple organoids from different batches. Scale bar = 5 µm. iPSCs = induced pluripotent stem cells; OS = outer segment; ONL = outer nuclear layer; INL = inner nuclear layer; GCL = ganglion cell layer; PBMNCs = peripheral blood mononuclear cells.
Figure 3
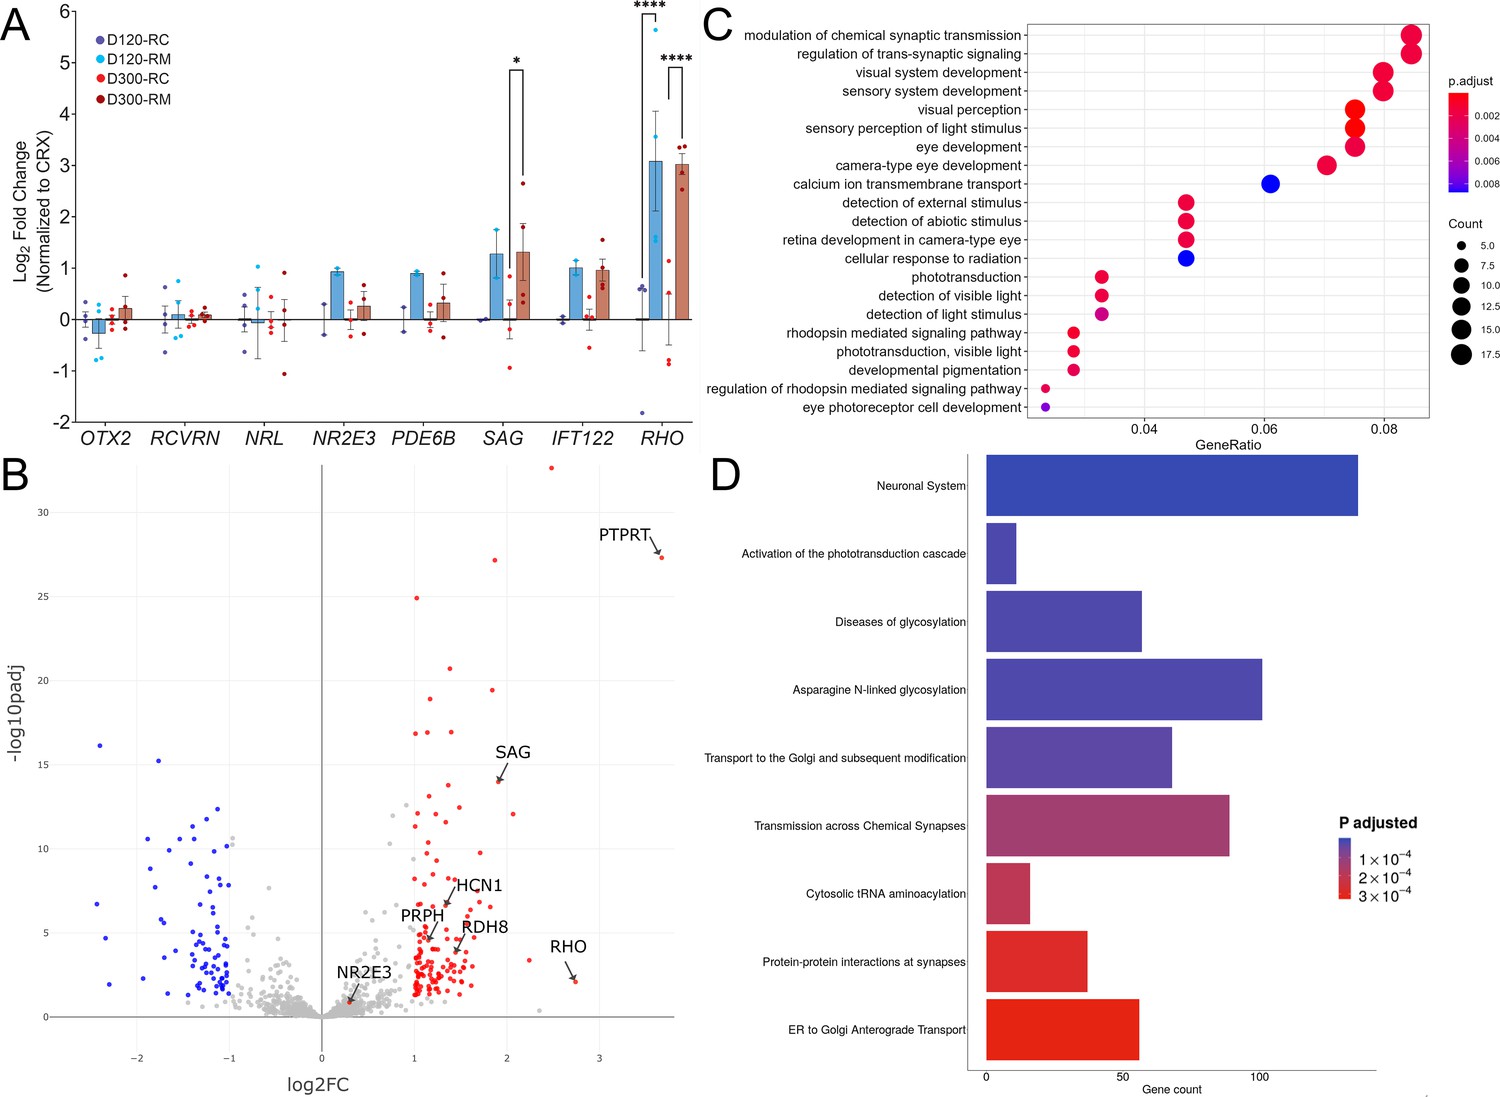
Transcriptomic analysis of RHO-CNV retinal organoids presented elevated RHO expression.
(A) Quantitative real-time PCR (qRT-PCR) analysis shows eightfold increase in RHO mRNA levels in patient (RM) organoids compared to control (RC) at D120 and D300 of rod differentiation and maturation. No significant change was observed in other photoreceptor genes except for a small twofold increase in rod arrestin (SAG) at D300 time-point. Log2FC = Log2Foldchange. Statistical two-way ANOVA with Fisher’s LSD test and 95% confidence interval. *=p<0.05, and ****=p<0.0001. Blue bars, D120; Maroon bars, D300. Error bars represent SEM. (B) Volcano plot showing significant differentially expressed genes following bulk RNA sequencing analysis comparing patient to control organoids (>D300). Significantly upregulated genes are highlighted in red and significantly downregulated genes are highlighted in blue (adjusted p<0.01). (C) Dot plot showing EnrichGO analysis of biological process on the differentially expressed genes in the bulk RNA sequencing analysis. The size of the dot represents number of differentially expressed genes in the pathway and the X-axis represent the ratio over all genes associated with the pathway. Plot shows a defect in rods and phototransduction-associated pathways as well as synaptic transmission suggesting rod dysfunction. (D) Box plot showing the data from pathway enrichment analysis of cellular component category predominantly highlighting the defect in glycosylation and Golgi/endoplasmic reticulum (ER) modification/transport. Colors in the dot and blot plots represent relative significance (calculated p-values in scale). N=3 (RNA sequencing) and N=4 (qRT-PCR) independent experiments and 12–15 organoids per experiment. CNV = copy number variation.
Figure 4 with 1 supplement
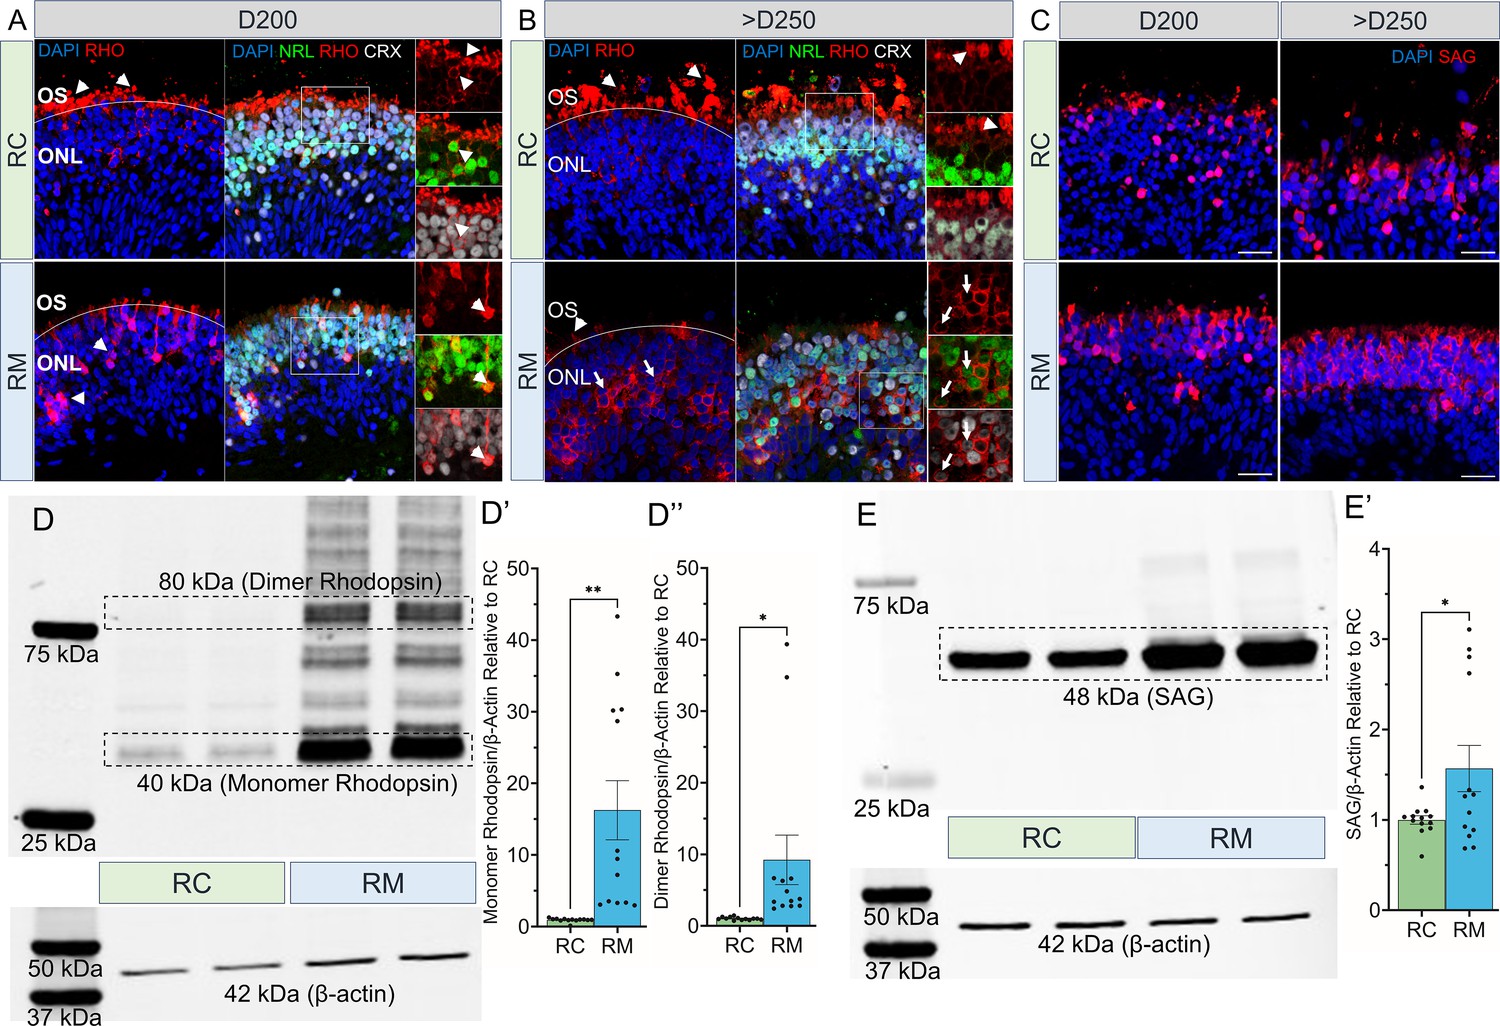
Rhodopsin protein mislocalization and increased levels in RHO-CNV retinal organoids.
(A, B) Immunofluorescence staining of RHO, NRL, and CRX displaying the proper RHO localization (arrowheads) in the outer segments of control (RC, top panel) organoids and RHO mislocalization (arrows) in the cell body of photoreceptors within the patient (RM; bottom) organoids at two time-points, D200 and >D250. Occasional inner/outer segments with appropriate RHO localization in the patient (RM) organoids were seen at >D250 time-point (arrowhead). (C) SAG expression (red) was also increased in the cell soma of patient organoids (bottom) compared to control organoids (top). DAPI (blue) labels nuclei. OS = outer segment; ONL = outer nuclear layer. Scale bar = 25 µm for A-C. (D, E) Western blot probed for RHO and SAG showing increased levels of 40 kDa monomer and 80 kDa dimer, RHO (D), and 48 kDa, SAG (E) in patient retinal organoids compared to controls. β-Actin was used as a loading control. Densitometric analysis quantifying the relative intensity of monomeric RHO (D’), dimeric RHO (D’’), and SAG (E’) in comparisons to the control. Statistical two-tailed unpaired t-test analysis with 95% confidence level. *=p<0.05, and **=p<0.01. N=5 independent experiment and 12–15 organoids per experiment. Error bars represent SEM. Raw blots in Figure 4—source data 1. CNV = copy number variation.
-
Figure 4—source data 1
Western blot files.
- https://cdn.elifesciences.org/articles/90575/elife-90575-fig4-data1-v1.zip
Figure 4—figure supplement 1
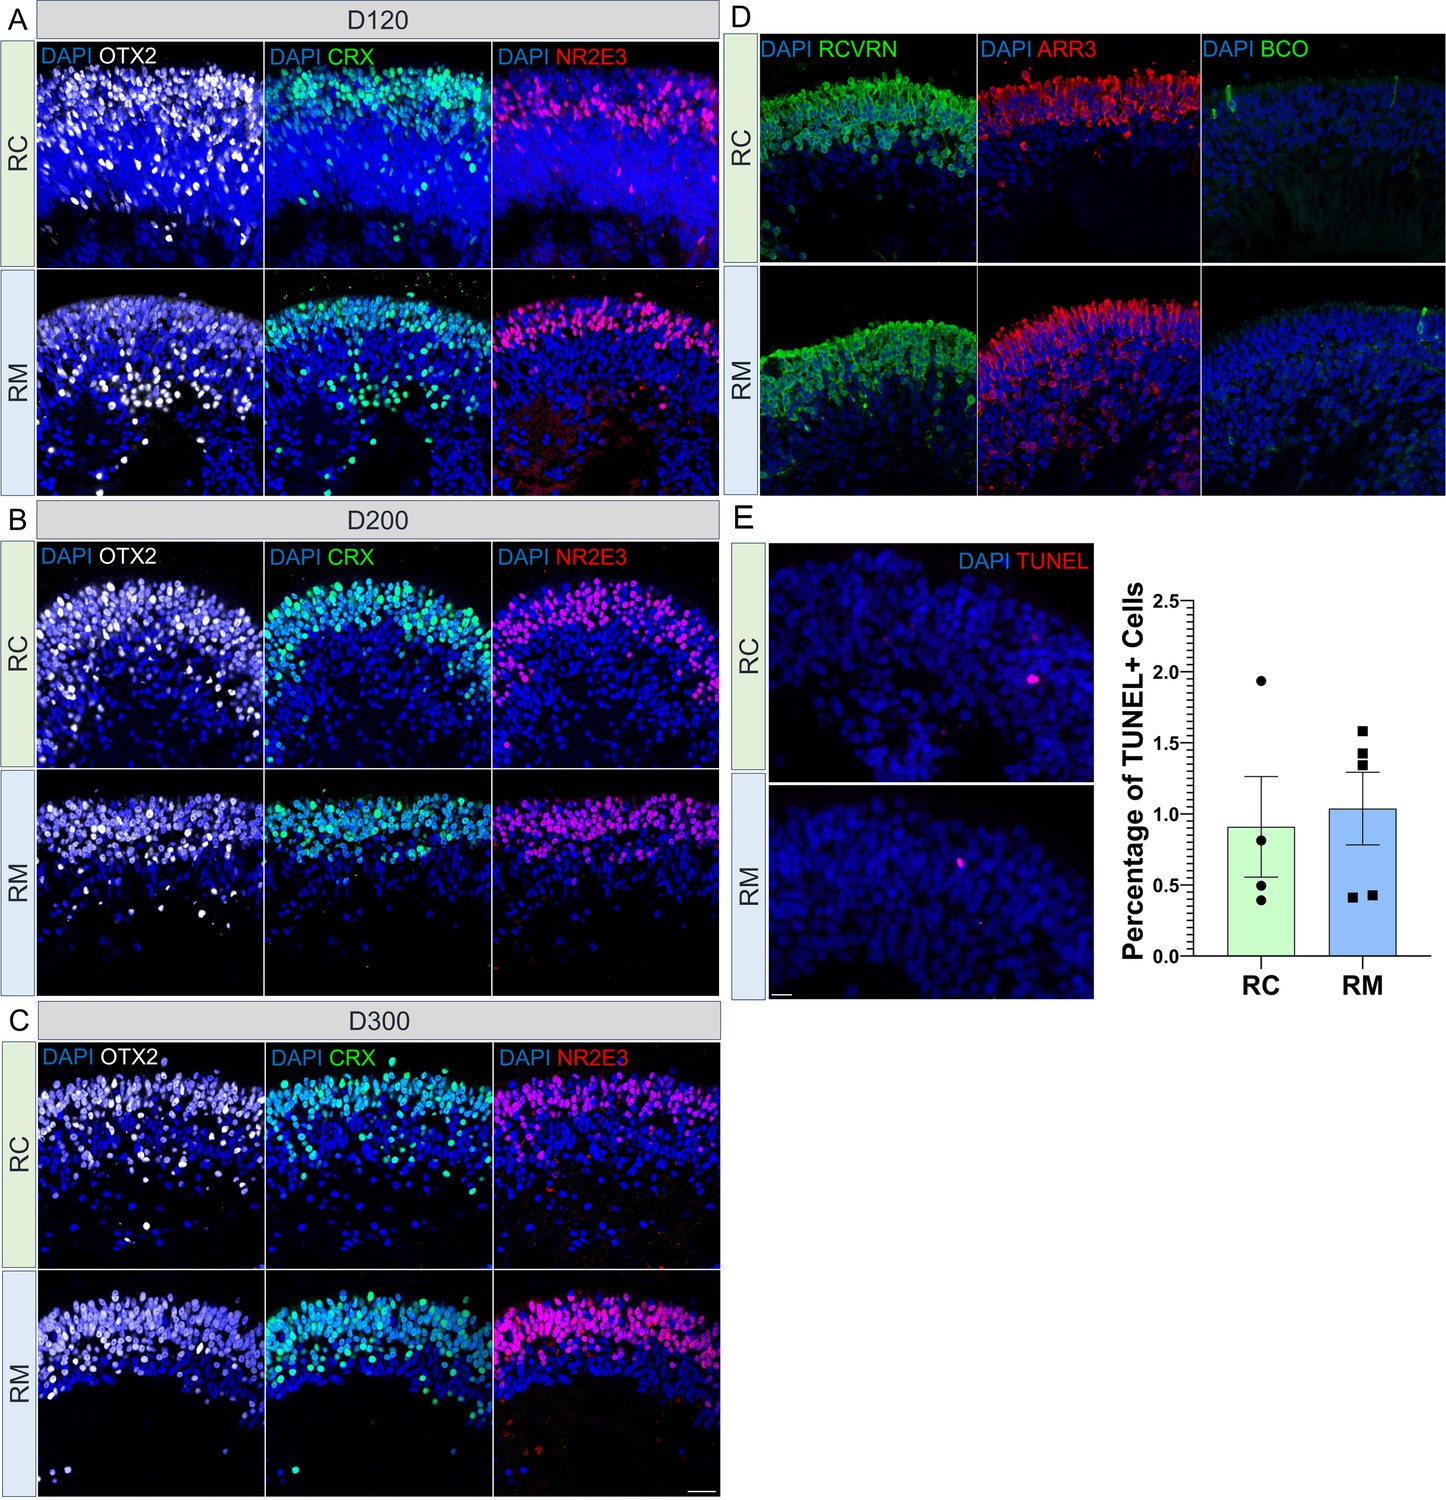
Rod biogenesis and development in RHO-CNV retinal organoids did not differ from control.
Confocal microscopic images of control (RC) and patient (RM) organoids labeling the early pan-photoreceptor markers, OTX2 and CRX; and early rod-specific post-mitotic photoreceptor marker, NR2E3, showing no difference in expression during (A) rod biogenesis at D120, (B) early rod maturation at D200, and (C) late rod maturation at D300. DAPI (blue) labels nuclei. (D) Representative images showing equivalent expression of pan-photoreceptor marker, RCVRN, pan cone-marker, ARR3, and blue cone opsin (BCO). DAPI (blue) labels nuclei. (E) TUNEL analysis and quantification comparing patient (RM) organoid to control (RC) organoids. N=4–5 organoids per condition. No significant difference observed on two-tailed t-test. CNV, copy number variation. Scale bar = 25 µm for A-E. Error bars represent SEM.
Figure 5 with 1 supplement
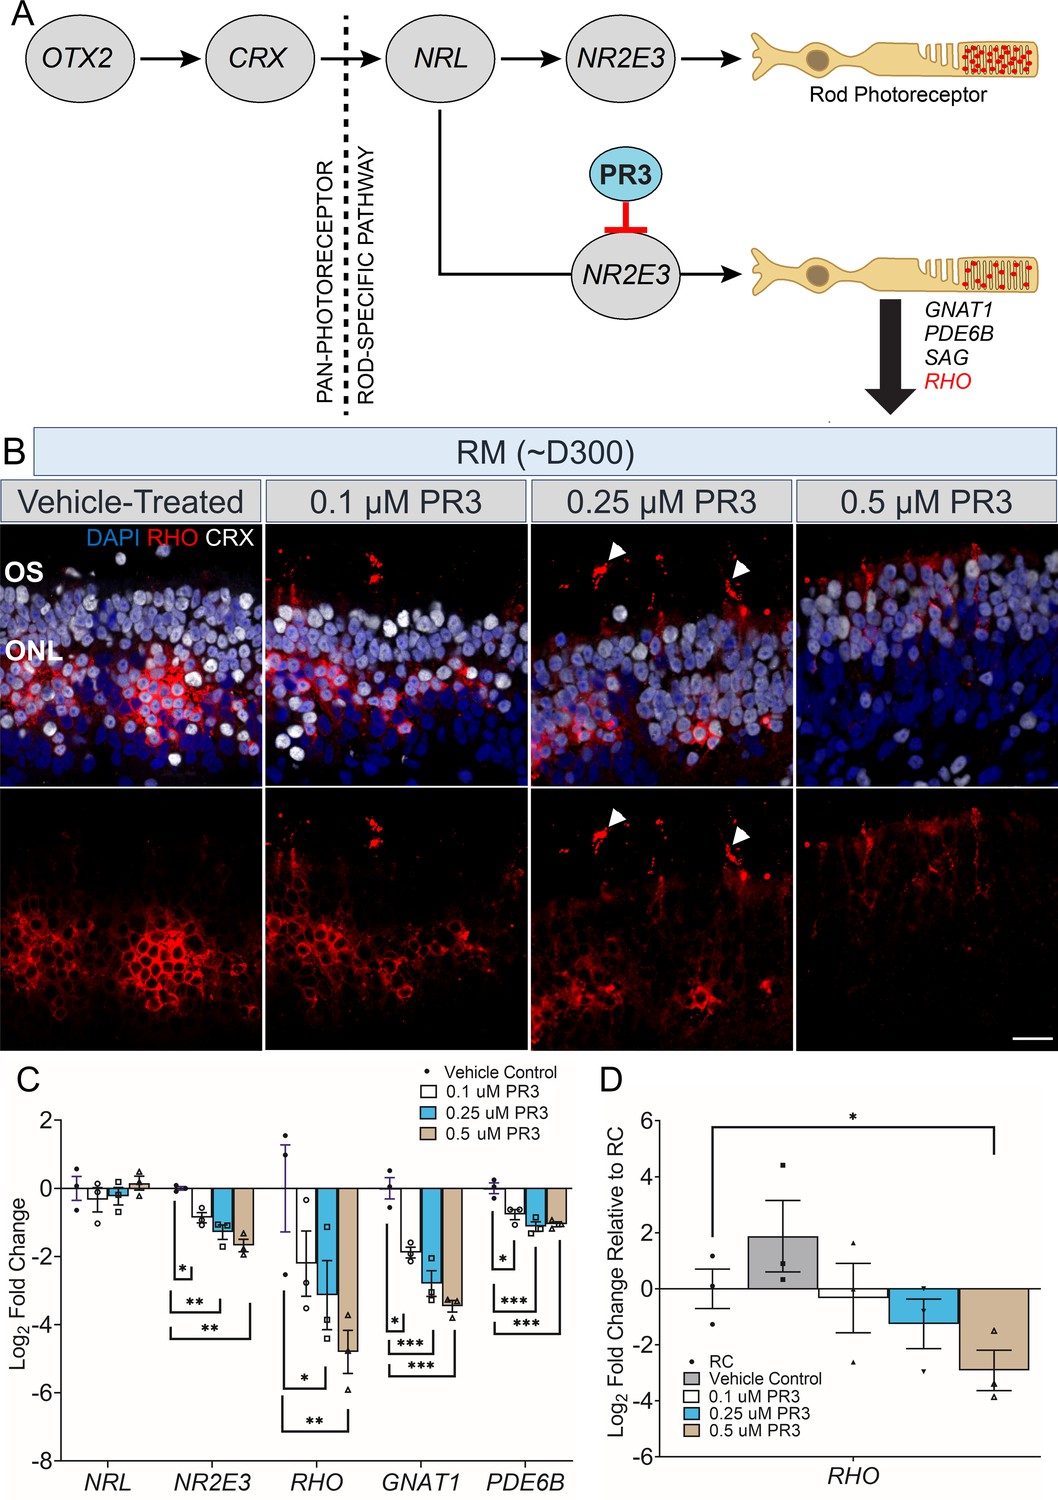
Partial rescue of rhodopsin localization and expression levels in Photoregulin3 (PR3)-treated RHO-CNV retinal organoids.
(A) Cartoon illustration showing gene expression during the stepwise development and maturation of rod photoreceptors. Small molecule PR3 is predicted to act on NR2E3 downregulating the expression of GNAT1, PDE6B, SAG, and RHO. (B) Immunostaining of ~300-day-old PR3-treated retinal organoid sections from patient (RM) showing the trafficking of RHO protein (arrowheads) toward outer segments at all three doses of PR3, 0.1, 0.25, and 0.5 µM. Retinas co-stained for CRX to mark photoreceptors. The most appropriate RHO localization to OS is seen at 0.25 µM PR3 (arrowheads) and much lower overall RHO expression in 0.5 µM PR3. DAPI (blue) labels nuclei. OS = outer segment; ONL = outer nuclear layer. Scale bar = 25 µm. (C) Quantitative real-time PCR (qRT-PCR) analysis shows 8- to 30-fold decrease in RHO mRNA levels in a dose-dependent manner for PR3-treated patient (RM) organoids. No significant change was observed in NRL, but a small decrease was observable in GNAT1, PDE6B, and NR2E3 (one-way ANOVA with Sidak test and 95% confidence interval). (D) qRT-PCR analysis showing a comparison of RHO mRNA levels in PR3-treated patient organoids to control (RC) organoids (unpaired t-test). Log2FC = Log2Fold change. Error bars represent SEM. *=p<0.05, **=p<0.01 and ***=p<0.001. N=3–4 independent experiments and 12–15 organoids per experiment. CNV, copy number variation.
Figure 5—figure supplement 1
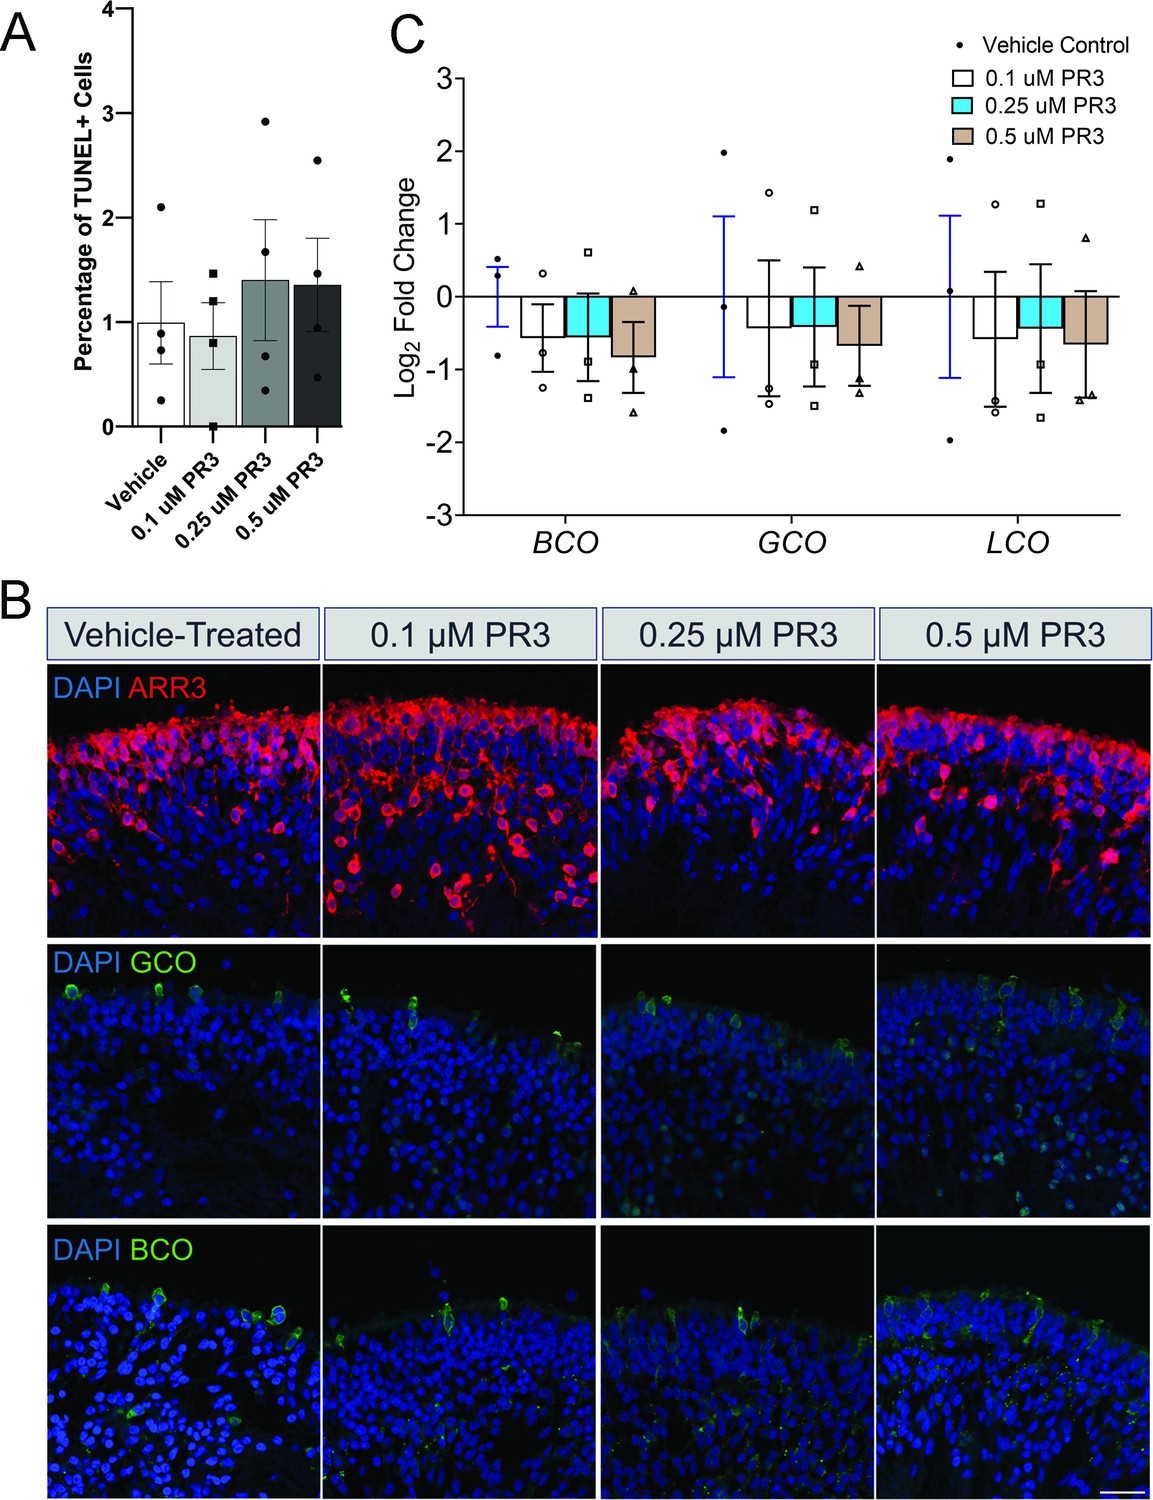
Photoregulin3 (PR3)-treated RHO-CNV retinal organoids do not affect cone opsin expression.
(A) TUNEL quantification comparing vehicle-treated RM organoid to different concentrations of PR3. N=4 organoids per condition. No significant difference observed on one-way ANOVA. (B) Representative images of vehicle and PR3-treated RM organoids at the three tested concentrations stained for cone markers, ARR3, blue cone opsin (BCO) and green cone opsin (GCO). Scale bar = 25 µm. (C) Quantitative real-time PCR (qRT-PCR) analysis shows no effect on cone opsin (BCO, GCO, LCO) mRNA levels at all the doses of PR3-treated patient (RM) retinal organoids compared to vehicle-treated RM organoids. Statistical analysis (ANOVA) revealed no significant differences. N=3 independent experiments and 12–15 organoids per experiment CNV, copy number variation. Error bars represent SEM.
Figure 6 with 1 supplement
RNA sequencing analysis of RHO-CNV organoids following Photoregulin3 (PR3) treatment.
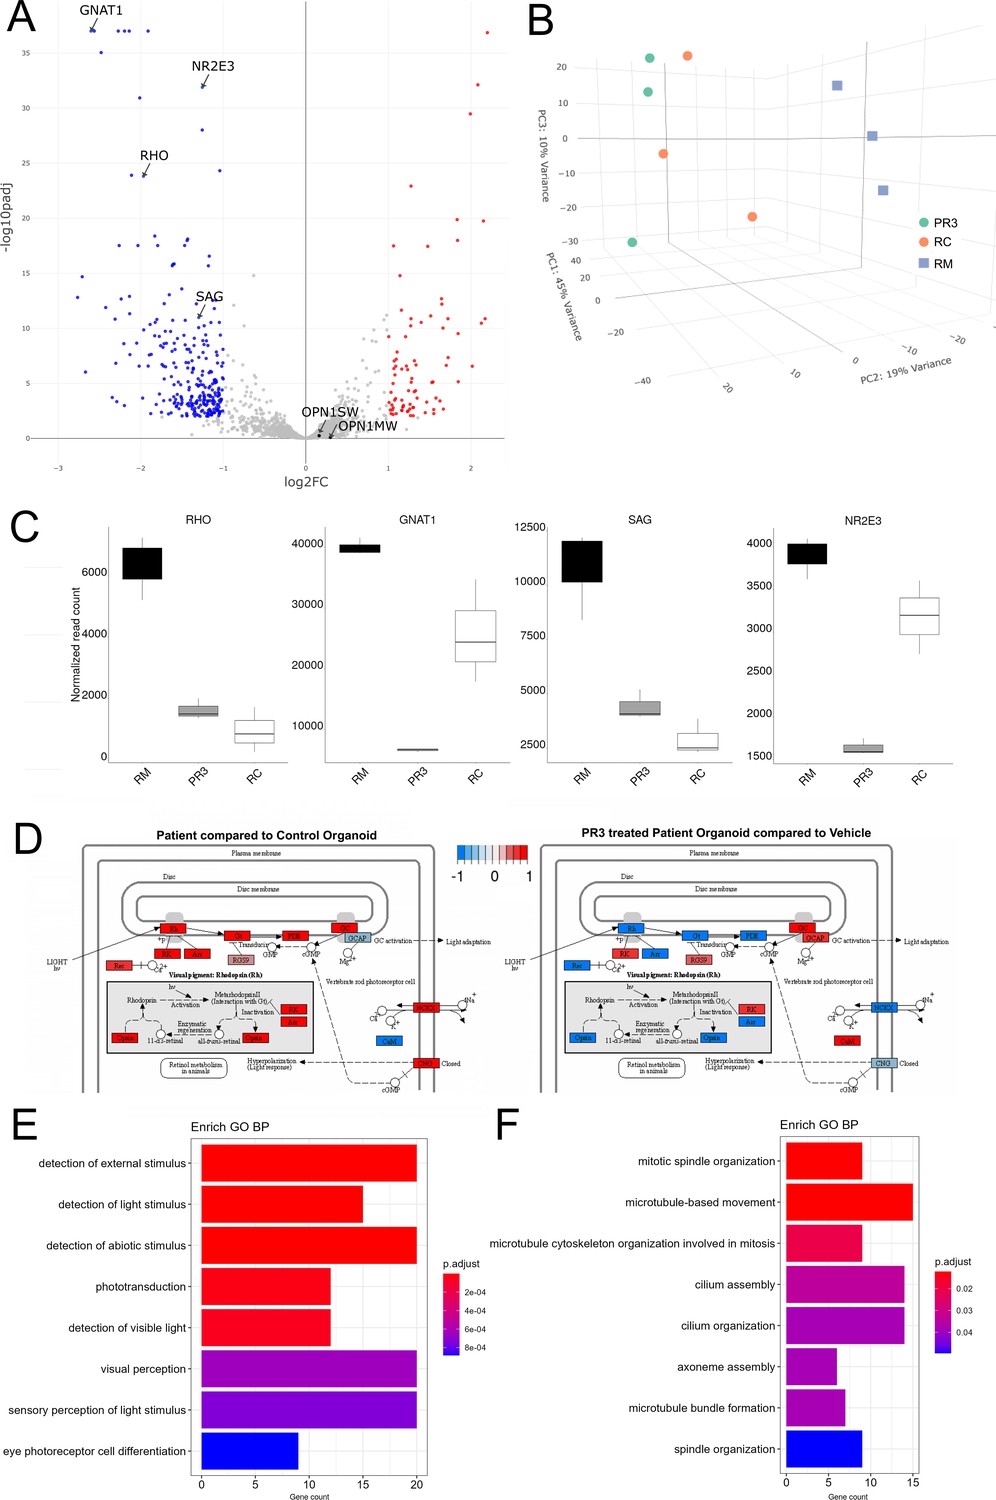
(A) Volcano plot showing significant differentially expressed genes following 1 week of 0.25 µM PR3 treatment in D300+ patient organoids compared to vehicle treated with cutoffs at p<0.01 and ~1Log2FC. (B) 3D principal component analysis (PCA) plot showing the tightly clustered independent biological replicates from the control (RC) organoids, vehicle-treated patient (RM) organoids, and PR3-treated patient organoids (PR3). PR3-treated patient organoids were spatially closer to control (RC) compared to patient (RM) organoids. (C) Normalized read count plots showing relative expression of RHO, GNAT1, SAG, and NR2E3 in the three conditions. (D) KEGG analysis of differentially expressed genes showing dysregulation of key phototransduction pathway comparing RC with RM organoids and the recovery following PR3 treatment in RM organoids. Down- and upregulated genes are indicated in blue and red respectively. (E, F) Box plots showing EnrichGO analysis of differentially expressed genes that are either downregulated (E) or upregulated (F) by comparing PR3 treated to vehicle-treated RM organoids. N=3 independent experiments and 12–15 organoids per experiment. Log2FC = Log2Fold change. CNV = copy number variation.
Figure 6—figure supplement 1
Recovery of glycosylation and endoplasmic reticulum (ER)-Golgi transport pathways in Photoregulin3 (PR3)-treated RHO-CNV organoids in the RNA sequencing analysis.
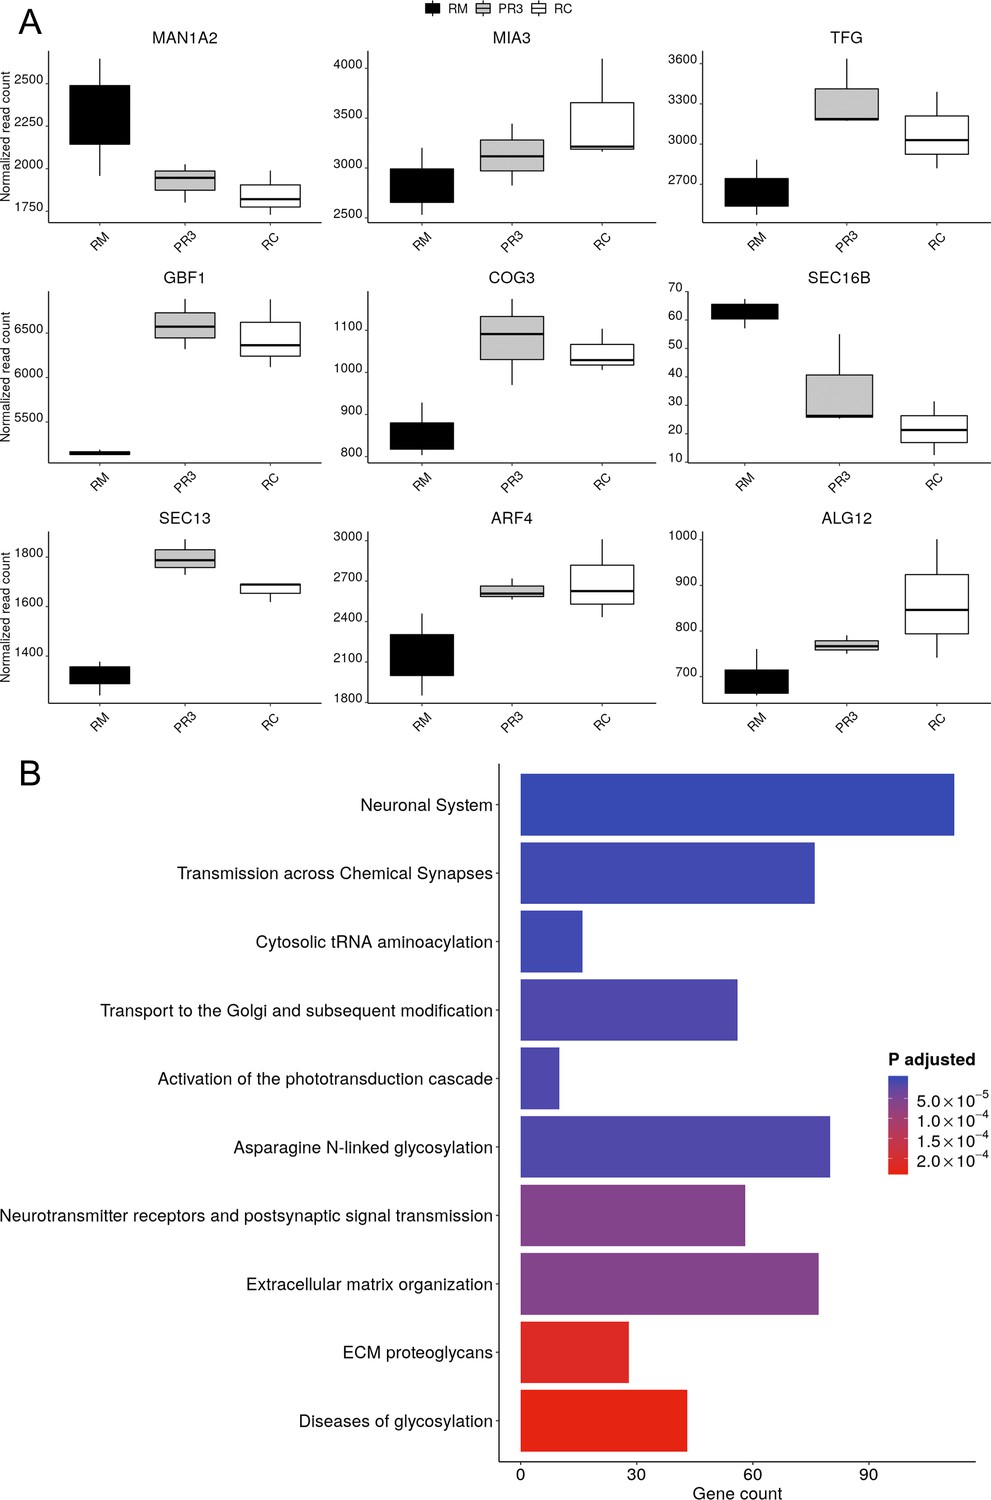
(A) Box plot showing the data from pathway enrichment analysis of cellular component category of differentially expressed genes following PR3 treatment compared to vehicle-treated organoids. The plot shows the recovery in the dysregulated glycosylation as well as ER pathways. Error bars represent SEM. (B) Normalized read count plots showing relative expression of MAN1A2, MIA3, TFG, GBF1, COG3, SEC16B, SEC13, ARF4, and ALG12 in RC, vehicle-treated RM and PR3-treated RM organoids. N=3 independent experiments and 12–15 organoids per experiment. CNV = copy number variation.
Figure 7
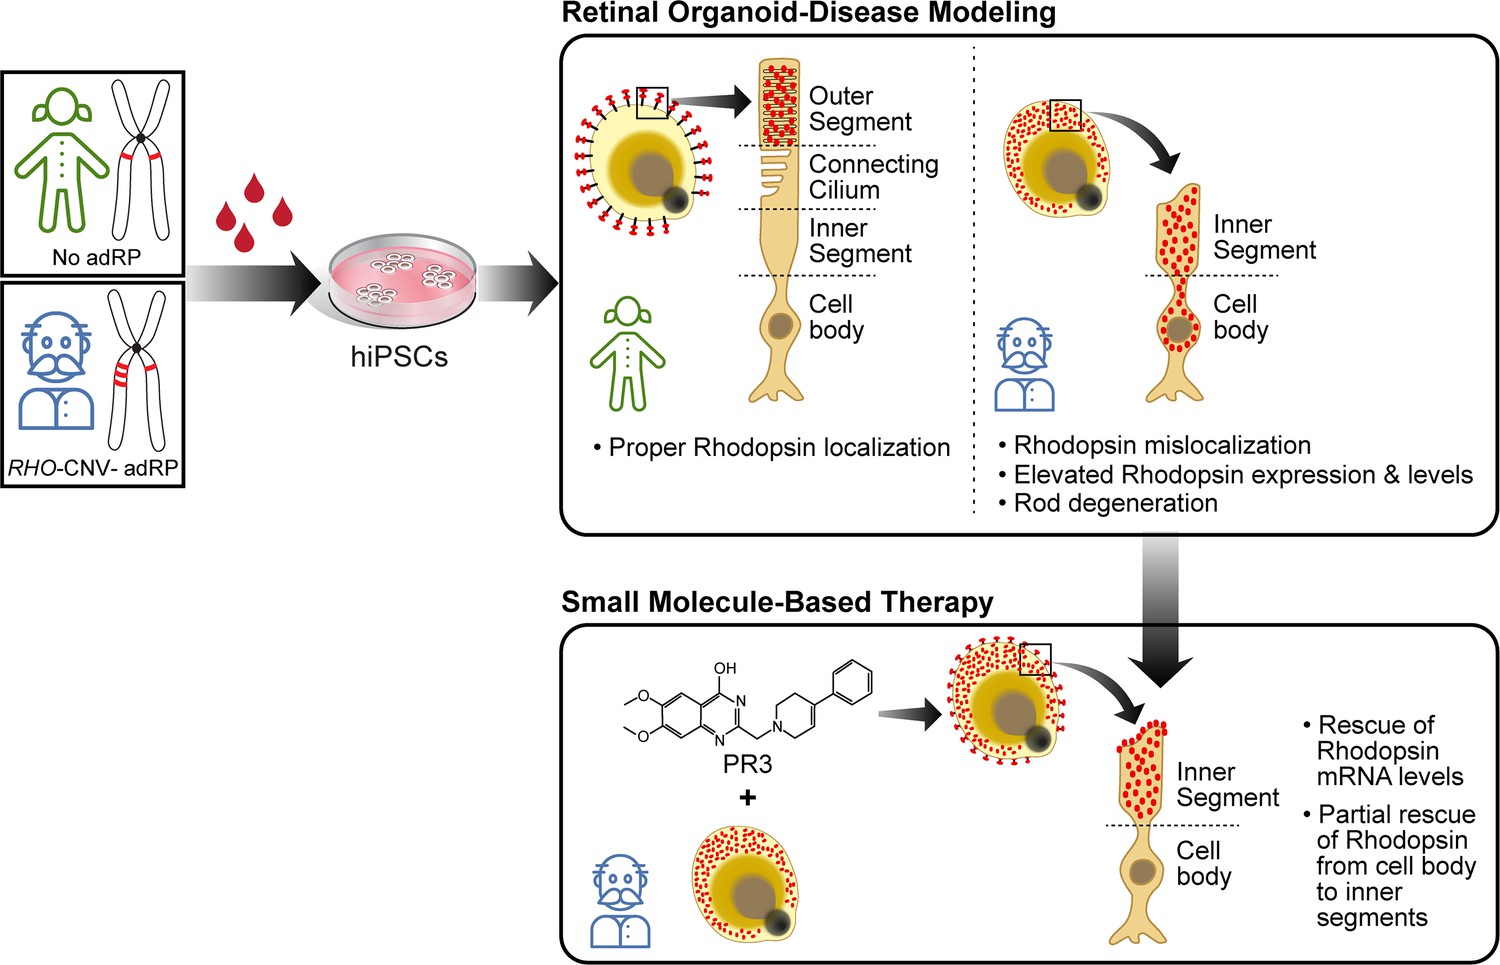
Cartoon showing key highlights of our study.
We utilized the potential of using patient blood derived induced pluripotent stem cells (iPSCs) for generating retinal organoids for disease modeling studies and screening therapeutics to modulate disease pathogenesis.
Tables
Table 1
Clinical characteristics.
| Subject ID (gender) | Age (years) | Age at first Sx (years) | VAOD, OS | Slit-lamp exam | Dilated fundus exam | Genetics |
|---|---|---|---|---|---|---|
| RM (male) | 68 | 48 | 20/40 20/70-1 | Pseudophakic OU |
| Chromosome 3q22 duplication rearrangement
|
| RC (female) | 33 | N/A | 20/20 20/20 | OU: Normal | OU: Normal | No chromosome 3q22 duplication rearrangement |
-
N/A, not applicable; OD, right eye; OS, left eye; OU, both eyes; RPE, retinal pigmented epithelium; Sx, symptoms; VA, visual acuity.
Additional files
-
Supplementary file 1
Formulations of media (1a) and buffers (1b).
Details of primary (1c) and secondary (1d) antibodies used in the manuscript. Primers used for the RT-PCR analysis (1e).
- https://cdn.elifesciences.org/articles/90575/elife-90575-supp1-v1.docx
-
Supplementary file 2
Excel file of differentially expressed genes from bulk RNA sequencing analysis.
- https://cdn.elifesciences.org/articles/90575/elife-90575-supp2-v1.xlsx
-
MDAR checklist
- https://cdn.elifesciences.org/articles/90575/elife-90575-mdarchecklist1-v1.docx
Download links
A two-part list of links to download the article, or parts of the article, in various formats.
Downloads (link to download the article as PDF)
Open citations (links to open the citations from this article in various online reference manager services)
Cite this article (links to download the citations from this article in formats compatible with various reference manager tools)
Disease modeling and pharmacological rescue of autosomal dominant retinitis pigmentosa associated with RHO copy number variation
eLife 12:RP90575.
https://doi.org/10.7554/eLife.90575.3


