Plasma growth hormone pulses induce male-biased pulsatile chromatin opening and epigenetic regulation in adult mouse liver
- Department of Biology and Bioinformatics Program, Boston University, United States
Figures
Figure 1
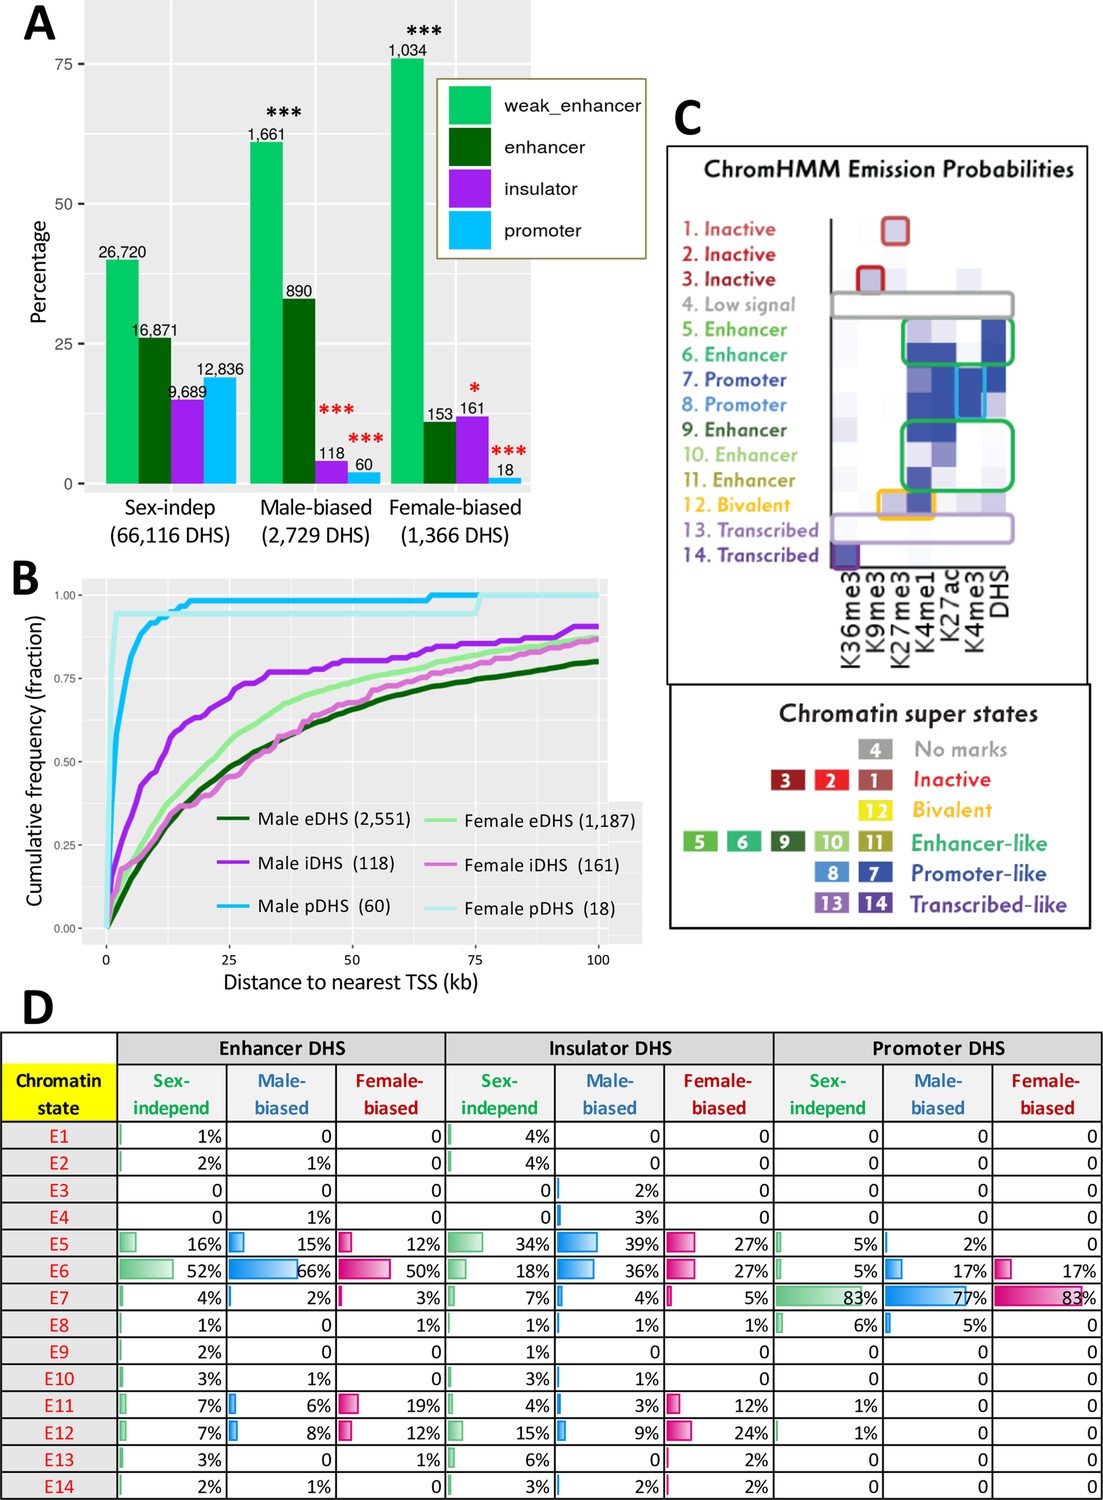
Liver DNase-I hypersensitivity site (DHS) classification and mapping to liver-expressed genes.
(A) Distributions of DHS classified as weak enhancer, enhancer, insulator, or promoter (Matthews and Waxman, 2018) for the indicated three DHS sets. Values above bars, number of DHS. Enrichments of sex-biased DHS for being an enhancer or weak enhancer, an insulator, or a promoter DHS were determined by comparing to a background set of sex-independent DHS (66,116 sites); significance was determined by Fisher’s exact test with Benjamini–Hochberg p-value adjustment: *p<0.01; **p<1E-10; ***p<1E-50. Black asterisks, enrichment; red asterisks, depletion as compared to background DHS set. (B) Cumulative frequency distribution of the distance to the nearest transcription start site in the same topologically associating domain (TAD) for male-biased and female-biased enhancer (e), insulator (i), and promoter (p) DHS. (C) ChromHMM emission probabilities for each of the 14 chromatin states developed for male and female mouse liver (Sugathan and Waxman, 2013), which serves as a reference for data shown in panel (D) and in Figure 7. Summary descriptions of the characteristics of each state are shown at the left and below. (D) Chromatin state distributions for each sex-biased or sex-independent DHS set. Chromatin state data for male and female liver (Supplementary file 3) was used for male-biased and female-biased DHS, respectively (Supplementary file 1D).
Figure 2 with 2 supplements

Discovery and characterization of dynamic and static male-biased DNase-I hypersensitivity site (DHS).
(A) Model showing pulsatile male plasma growth hormone (GH) pattern, with mice sampled between GH pulses, when STAT5 is inactive and cytoplasmic (STAT5-low, blue), or at a peak of plasma GH, when liver STAT5 is activated to its homodimeric, nuclear DNA-binding form, which enables STAT5 to open chromatin and bind to its consensus motif, TTCNNNGAA (STAT5-high, red). This intermittent (pulsatile) activation STAT5 leads to chromatin opening and closing at dynamic DHS (top). Static DHS also bind STAT5 intermittently (Zhang et al., 2012) but remain open between plasma GH pulses (bottom). (B) Electrophoretic mobility shift analysis (EMSA) of STAT5 DNA-binding activity in liver extracts prepared from individual male mice. These data represent liver extracts from one of three separate cohorts of mice; the other two cohorts are shown in Figure 2—figure supplement 1. Labels at the top indicate the DNase-seq library ID for each liver sample (Supplementary file 4). Red labels at the top indicate STAT5-high activity based on the EMSA patterns displayed, and blue labels indicate STAT5-low-activity livers. Numbers at the bottom: mouse ID #. Samples were all run on the same gel. (C) Principal component (PC) analysis of the distributions of DNase-seq reads per kilobase per million mapped reads for the top 600 or top 200 diffReps-identified sites that are more open in STAT5-high compared to STAT5-low livers. Eigenvector values for principal component 1 are shown for the individual STAT5-high and STAT5-low liver samples. Dotted red line: empirical cutoff separating STAT5-high from STAT5-low DNase-seq samples; dotted black circles: outlier samples in each dataset. (D) Boxplots of DNase-seq activity, in log2(reads per kilobase per million mapped reads), across the top 200 diffReps differential sites that open (as in C) for the STAT5-high DNase-seq libraries (red bars), for the STAT5-low DNase-seq libraries (blue bars), and for DNase-seq libraries for nine individual male mouse liver ENCODE consortium samples (green bars, replicates 5–13, marked on x-axis). Thick dashed black line: empirical cutoff used to separate STAT5-high and STAT5-low liver samples. Liver samples that did not pass the cutoff (red asterisks at the bottom) are the same outliers circled in panel (C). (E) Normalized DNase-I cut site aggregate plots for STAT5-high (red) and STAT5-low male livers (blue), and for female livers (black). Peak cut site y-axis values are shown to the right of each peak. Cut sites were aggregated across the sets of diffReps-identified DHS that show greater diffReps normalized DNase-seq signal intensity in STAT5-high compared to STAT5-low male livers (left), or vice versa (right), that is, that open or close, respectively, in response to endogenous STAT5 pulses in male liver. (F) Venn diagram indicating overlap between endogenous STAT5 pulse-opened DHS sets identified by diffReps (2832 sites that respond to liver STAT5 activity in a dynamic manner, which map to a total of 2373 of the 70,211 standard reference DHS) and the indicated sets of sex-biased and sex-independent DHS that do not respond to a change in liver STAT5 activity, that is, are static DHS. See Supplementary file 1A, column I for full listing.
Figure 2—figure supplement 1
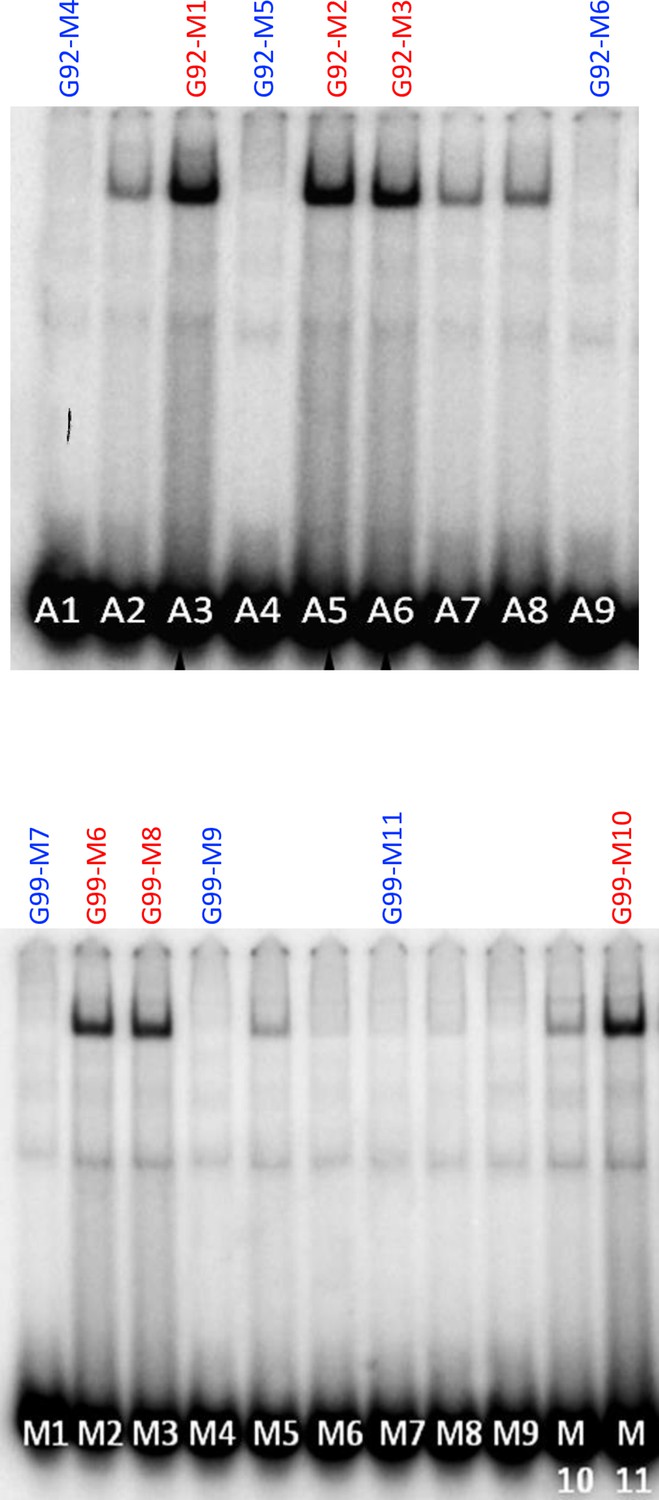
Electrophoretic mobility shift analysis (EMSA) of STAT5 DNA-binding activity in liver extracts prepared from individual male mice.
Shown here are EMSA data for two of three separate cohorts of mice; the third cohort is shown in Figure 2B. Livers whose nuclei were used for DNase-seq analysis are marked at the top (Supplementary file 4); red labels at the top indicate STAT5-high activity based on the EMSA patterns displayed, and blue labels indicate STAT5-low-activity livers. Also shown here are EMSA activity for eight other livers, which have low-to-intermediate STAT5 EMSA activity and were not included in downstream analysis. Numbers at the bottom: liver sample numbers from each mouse cohort.
Figure 2—figure supplement 2

Top enriched Gene Ontology (GO) terms identified by GREAT analysis of the predicted gene targets of each of the indicated four DNase-I hypersensitivity site (DHS) sets, shown in panels A–D.
Mouse mm9 genomic coordinates for each DHS set were entered into the web-based tool GREAT (v.4.0.4) (http://great.stanford.edu/public/html/) and target genes were then identified using default parameters (Association rule: Basal + extension: 5000 bp upstream, 1000 bp downstream, 1 million bp max extension). Shown are the top enriched GO Biological Process terms for each DHS set using the whole-genome background setting, with –log10 Binomial p-values shown. Complete data output from GREAT, including listings of gene targets and the DHS associated with each DHS, are shown in Supplementary file 8.
Figure 3 with 3 supplements
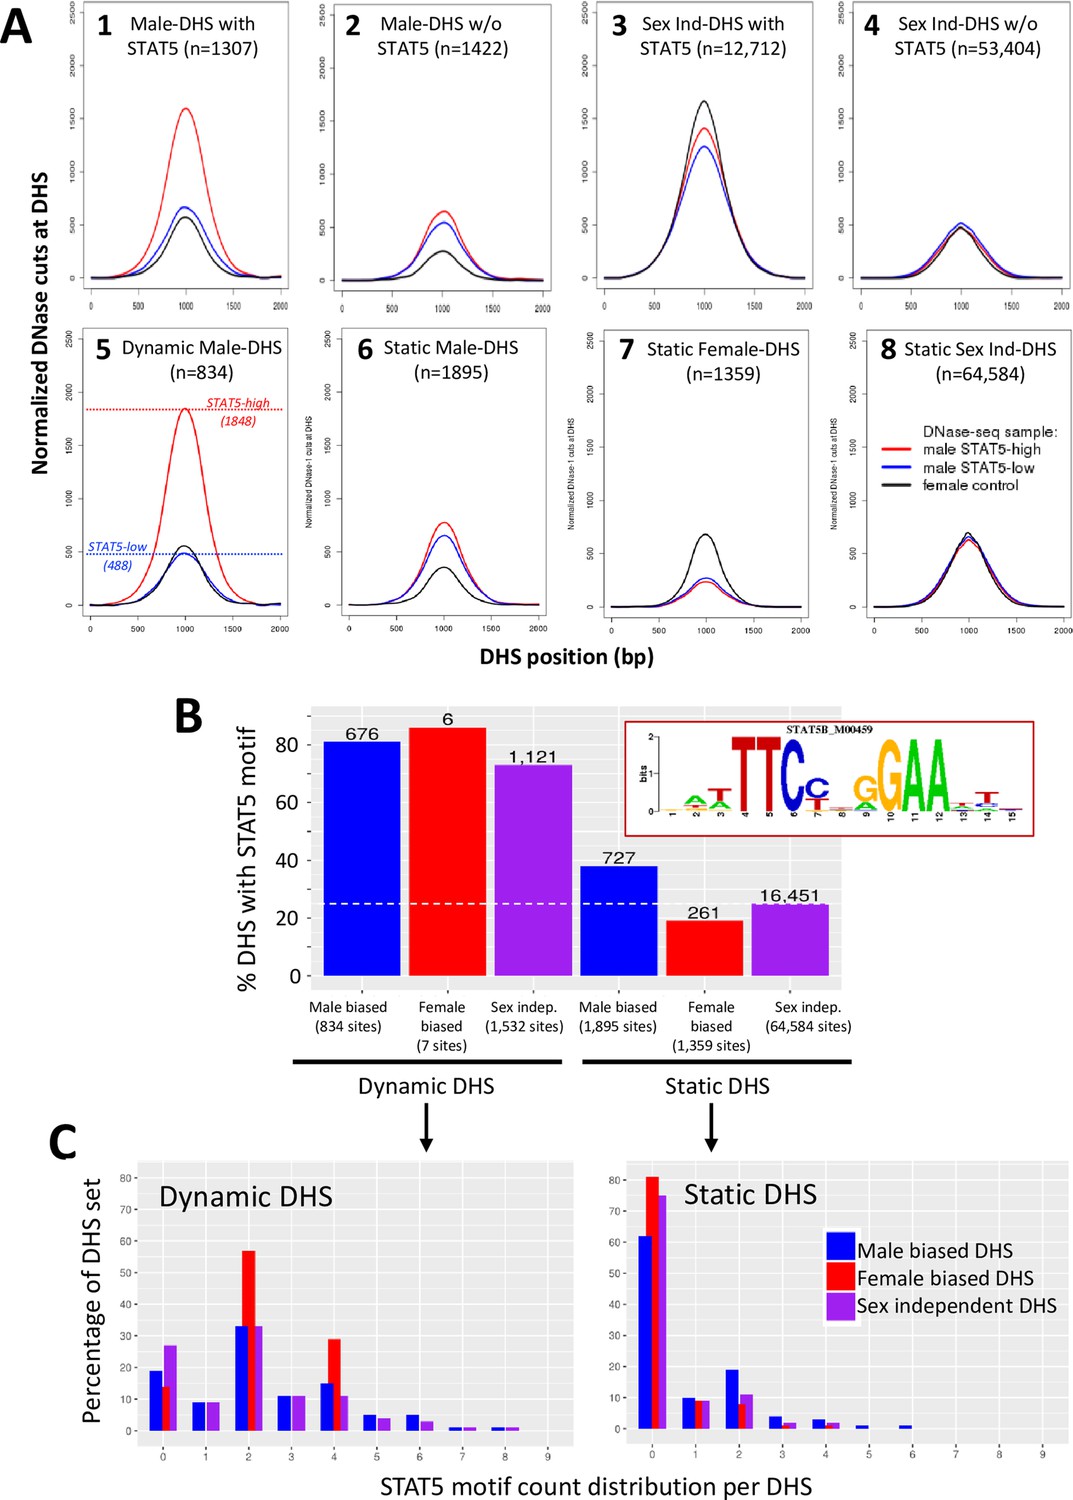
Dynamic and static male-biased DNase-I hypersensitivity sites (DHS).
(A) Normalized DNase-I cut site aggregate plots for STAT5-high (red) and STAT5-low male livers (blue) and female livers (black) across the genomic regions included in the sets of male-biased DHS (plots 1 and 2) and sex-independent DHS (plots 3 and 4), separated into subsets of DHS that either do (plots 1 and 3) or do not bind STAT5 by ChIP-seq analysis (plots 2 and 4). Plots 5–8 show corresponding plots for each of the indicated dynamic and static DHS sets. See Supplementary file 6 for normalized peak DNase-I site values. (B) Bar plots showing number (values above bars) and percent of static and dynamic DHS with one or more occurrences of the indicated STAT5 motif (box), based on FIMO scan of the 70,211 standard reference DHS sequences. Dashed horizontal line: background, genome-wide occurrence of STAT5 motifs at static sex-independent DHS. (C) Percentage of dynamic (left) and static (right) DHS sets with zero or more occurrences of a STAT5 motif. x-axis: number of motif occurrences in each individual DHS (n = 0–9); y-axis: percentage of full DHS set with the corresponding number of STAT5 motifs. Distribution pattern for dynamic female-biased DHS is not reliable, as it represents a total of only seven DHS.
Figure 3—figure supplement 1
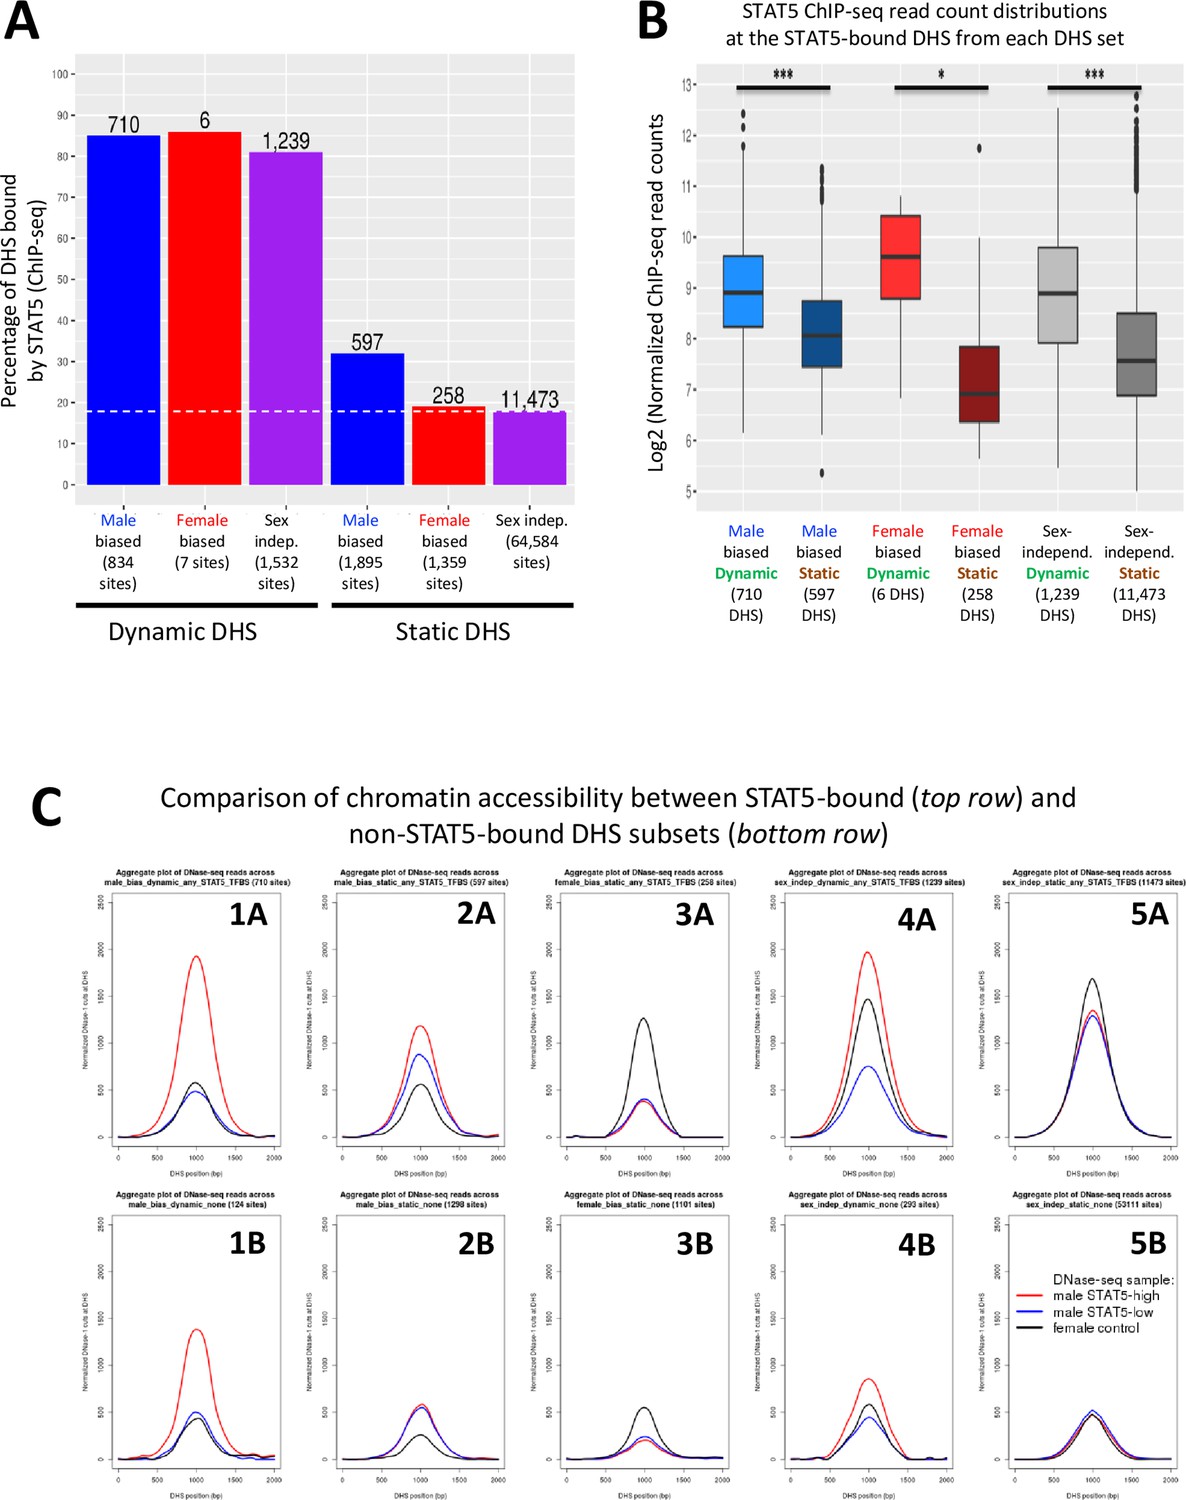
STAT5 binding is associated with chromatin opening.
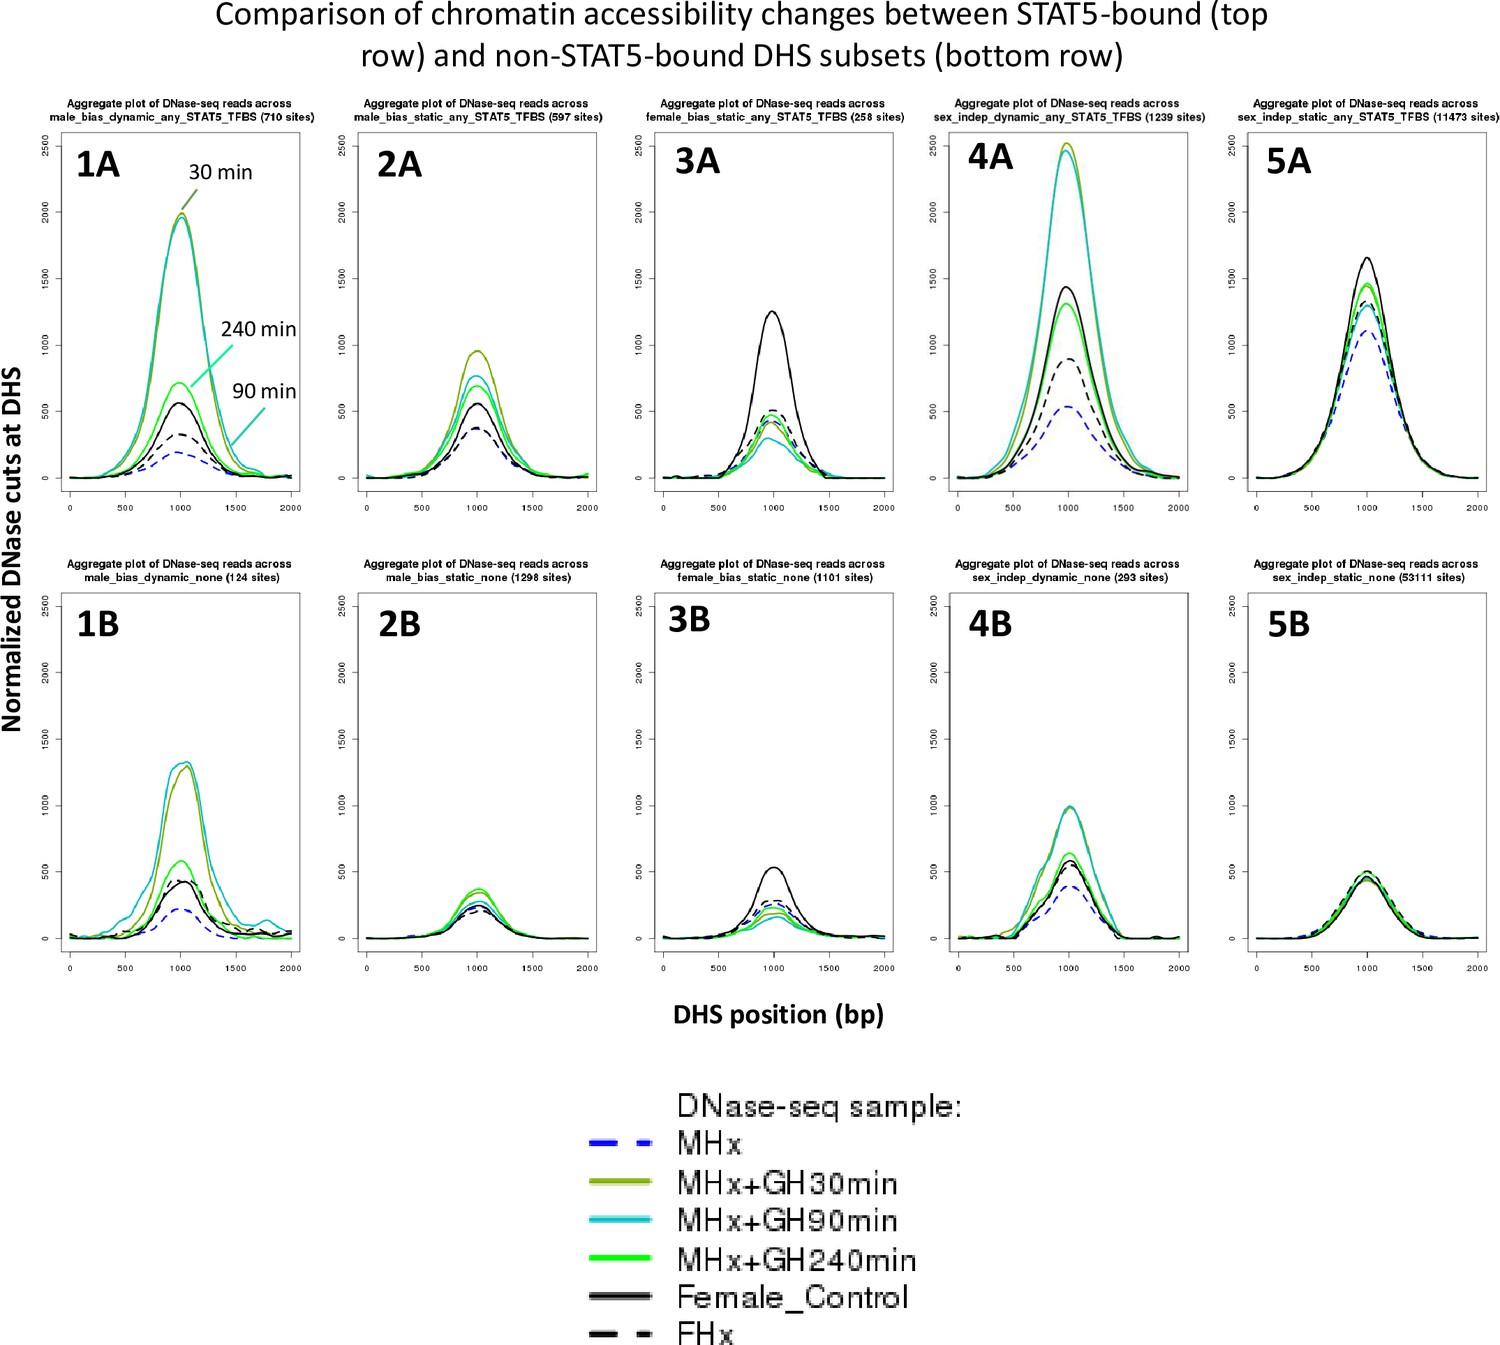
(A) Bar graph of the number and percentage of dynamic and static DNase-I hypersensitivity site (DHS) that have one or more STAT5 binding sites, based on STAT5 ChIP-seq data for mouse liver. BEDTools was used to determine the overlap between the merged list of 15,094 STAT5 binding sites (Zhang et al., 2012) and the standard reference set of 70,211 liver DHS used in this study. Dashed horizontal line: background, genome-wide level of STAT5 binding at static sex-independent DHS. (B) Distribution of STAT5 ChIP-seq signal intensity values for the sets of dynamic and static DHS. For each DHS that contains a STAT5 binding site (numbers shown in A), the corresponding normalized STAT5 ChIP-seq read count (based on average of STAT5 male-high samples and STAT5 female-high liver samples; Zhang et al., 2012) was obtained and used to calculate the indicated distributions. (C) Normalized DNase-I cut site aggregate plots for male livers at STAT5-high, STAT5-low, and female liver for the indicated sets of male-biased, female-biased, and sex-independent DHS, analyzed separately for dynamic DHS subsets (plots 1A, 1B, 4A, 4B) and static DHS subsets (plots 2A, 2B, 3A, 3B, 5A, 5B). Top row: STAT5-bound subsets; bottom row: non-STAT5-bound subsets. See Supplementary file 6 for DNase-seq aggregate plot peak values.
Figure 3—figure supplement 2
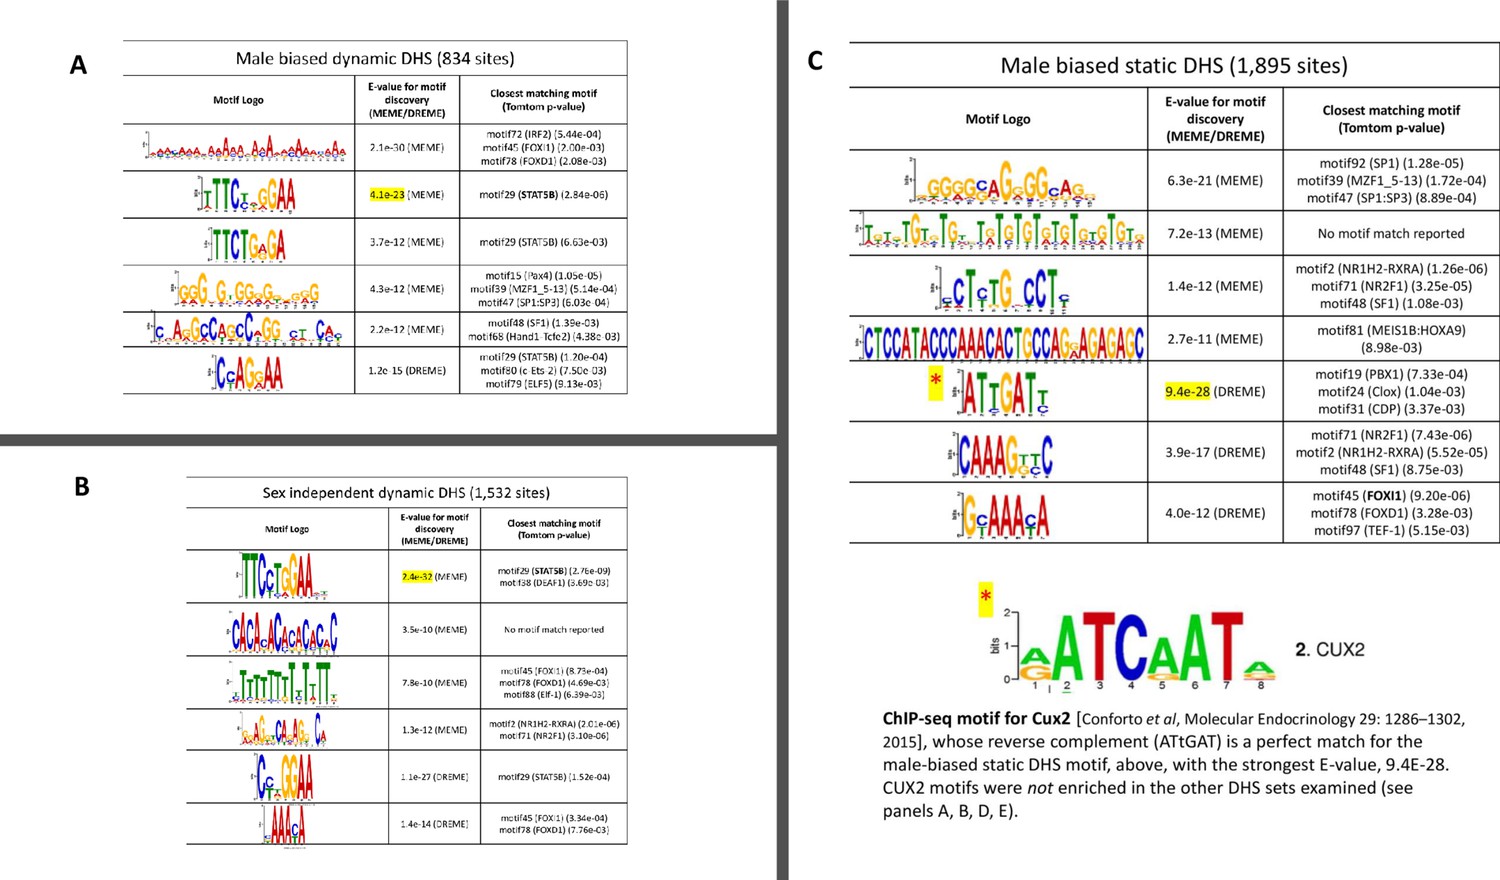
TF motifs discovered de novo from sets of DNase-I hypersensitivity site (DHS) sequences, part 1.
De novo motif discovery was carried out on the indicated sets of dynamic and static DHS sequences using the MEME and DREME algorithms of MEME-ChIP (Ma et al., 2014). Listed are the top (most significant) de novo discovered motifs and their associated p-values for (A) dynamic male-biased DHS (834 sites); (B) dynamic sex-independent DHS (1532 sites); and (C) static male-biased DHS (1895 sites), where the top motif (by E-value) matches that of CUX2 (Conforto et al., 2015), as shown at the bottom. The presence of the STAT5B motif (bold text) is a distinguishing characteristic that separates the dynamic from static DHS, which supports our hypothesis that direct binding of STAT5 plays a key role in chromatin opening in response to growth hormone (GH) pulses at these dynamic DHS.
Figure 3—figure supplement 3
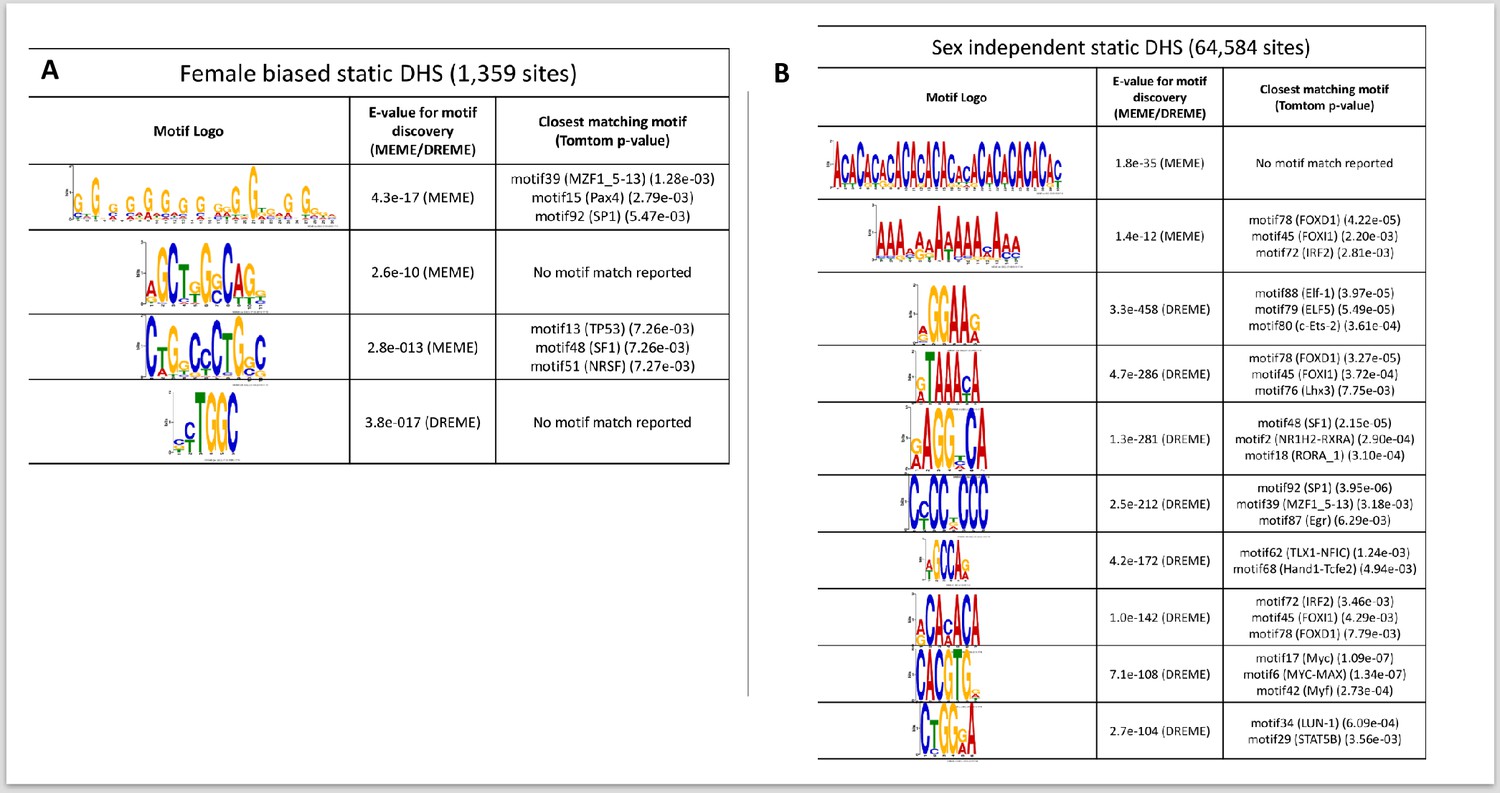
TF motifs discovered de novo from sets of DNase-I hypersensitivity site (DHS) sequences, part 2.
(A) Static female-biased DHS (1359 sites); and (B) static sex-independent DHS (64,584 sites). Shown are the top most significant motifs. No motifs were discovered from the very small number of dynamic female-biased DHS (seven sites).
Figure 4 with 3 supplements
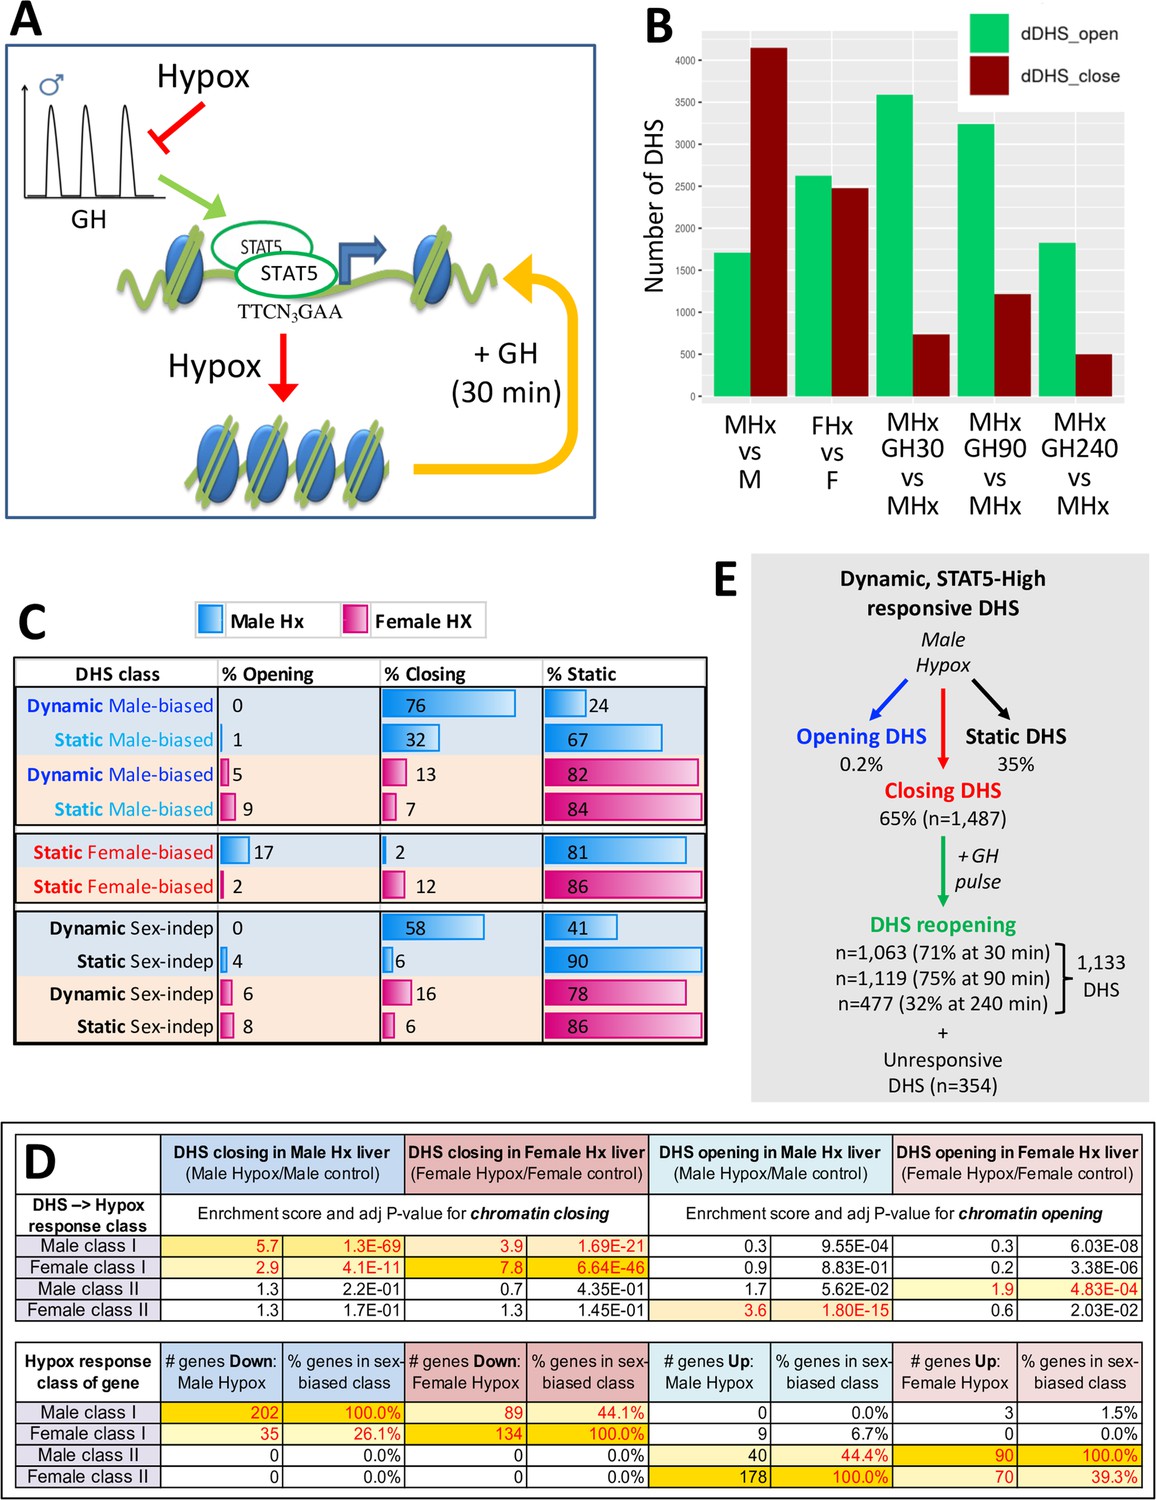
DNase-I hypersensitivity sites (DHS) responsive to hypophysectomy, their enrichment for class I and II sex-biased gene targets, and their responses to growth hormone (GH) pulse replacement.
(A) Model for the impact of pulsatile GH secretion ablation by hypophysectomy on STAT5-induced chromatin opening. DHS that close following hypophysectomy due to the loss of active, DNA-binding STAT5 reopen within 30 min of exogenous GH treatment, which rapidly reactivates STAT5 and induces its nuclear translocation (Connerney et al., 2017). (B) Numbers of liver DHS that open or close following hypophysectomy (Hx) and in response to a single injection of GH given to hypox male (M) or female (F) mice and euthanized 30, 90, or 240 min later. DHS opening and closing was calculated as compared to the indicated controls. (C) Distributions of sex-biased and sex-independent DHS that open, close, or are unchanged (static) following hypophysectomy (Hx) in male and female mouse liver. See Supplementary file 5H for full details. (D) Enrichment of hypophysectomy-responsive DHS for mapping to the four indicated classes of sex-biased genes when compared to a background set of DHS whose accessibility is unchanged by hypophysectomy (see Figure 4—figure supplement 1). Class I and II sex-biased genes were identified from RNA-seq gene expression data collected from intact and hypox male and female liver samples (Supplementary file 2). The bottom section shows the total number and percentage of sex-biased genes in each of the four indicated sex-biased gene classes that respond to hypophysectomy, as marked (Supplementary file 5A and I). (E) Subset of all dynamic DHS (Figure 2F) that close following hypophysectomy in male mouse liver (n = 1487) and then respond to GH pulse replacement at the three indicated time points. Total number of dynamic DHS shown here is lower than the full set of 2373 dynamic DHS (Figure 2F) as 70 of these DHS were not identified as DHS in the hypophysectomy study (Supplementary file 5H).
Figure 4—figure supplement 1
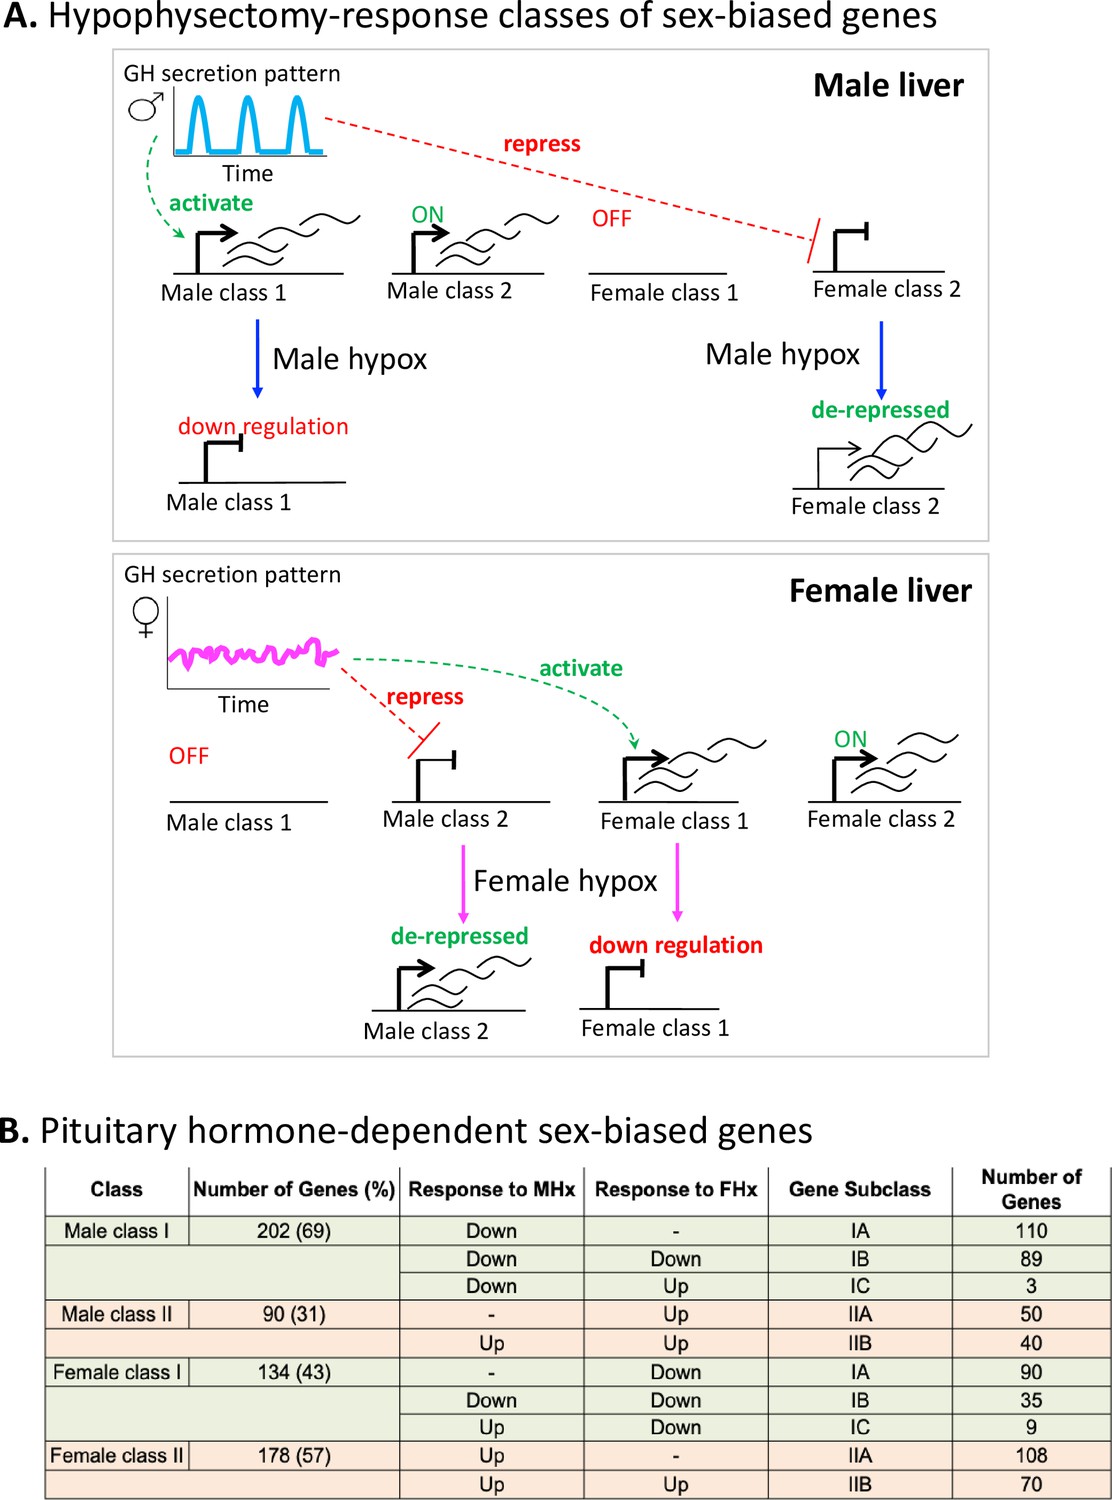
Sex-biased genes can be classified based on their pituitary hormone dependence.
(A) Model for plasma growth hormone (GH) profile dependence and responses of class I and II male-biased and female-biased genes to pituitary hormone ablation in each sex by hypophysectomy (‘hypox’). Figure from Melia and Waxman, 2019. (B) Sex-specific genes were identified from RNA-seq data from intact male and female mouse liver based on a gene list comprised of 24,197 RefSeq and 3152 multi-exonic lncRNA genes. First, sex-specific genes were identified with |fold-change| > 1.5, adjusted p-value<0.05 (for RefSeq genes), and |fold-change| > 2.0, adjusted p-value<0.05 (for lncRNA genes), with FPKM > 0.25 for the sex with greater signal intensity for both RefSeq and lncRNA gene sets (see ‘Methods’). Sex-specific genes that were responsive to hypophysectomy (|fold-change| > 2 and an adjusted p-value<0.05) were further classified into class I, II and corresponding subclasses (IA, IB, IC, IIA, and IIB) based on RNA-seq data from intact and hypox male and female liver samples. See Supplementary file 2 for full gene listings.
Figure 4—figure supplement 2

Impact of hypophysectomy and growth hormone (GH) pulse replacement on a set of 2373 dynamic DNase-I hypersensitivity sites (DHS), part 1.
(A) Four-oval Venn diagram showing the number of STAT5-high DHS that were close following hypophysectomy and/or open in response to a single exogenous GH pulse given to hypophysectomized male mice. The set of STAT5-high (dynamic) DHS (n = 2373 sites; Figure 2F) was analyzed to determine their overlap with the set of DHS that close following hypophysectomy (n = 1487 sites) or DHS that open when a single exogenous GH pulse is given to hypophysectomized male mice and liver tissue collected after 30 min (n = 1475 sites), 90 min (n = 1393 sites), or 240 min (n = 547 sites) (see Figure 4 and Supplementary file 1: column I = ‘dynamic’ combined with columns AK-AM = ‘dDHS_open’). These data show that a dynamic DHS subset, comprised of 399 DHS, was unresponsive to hypophysectomy and to GH pulse replacement. These 399 DHS showed weaker mean chromatin accessibility and lower differential accessibility between STAT5-high and STAT5-low livers than the hypophysectomy and exogenous GH-responsive sites (Figure 4—figure supplement 3). Of the STAT5-high DHS (n = 2373 sites), the subset that responded to hypox and/or a single exogenous GH pulse (set 3, n = 1974) showed significantly greater chromatin opening induced by an endogenous GH/STAT5 pulse than the nonresponsive subset (n = 399) in pituitary-intact male livers (set 3 vs. set 2). (B) Flowchart of STAT5-high DHS (i.e., n = 2373 dynamic DHS) identifying hypox-responsive and exogenous GH pulse-responsive DHS in male mouse liver. Subsections of the four-oval Venn diagram (shown in A) are used to illustrate the DHS subsets defined by the flowchart (seven subsets), including a set comprised of 399 DHS that do not undergo chromatin closing following hypophysectomy and also do not undergo chromatin opening following an exogenous GH pulse.
Figure 4—figure supplement 3
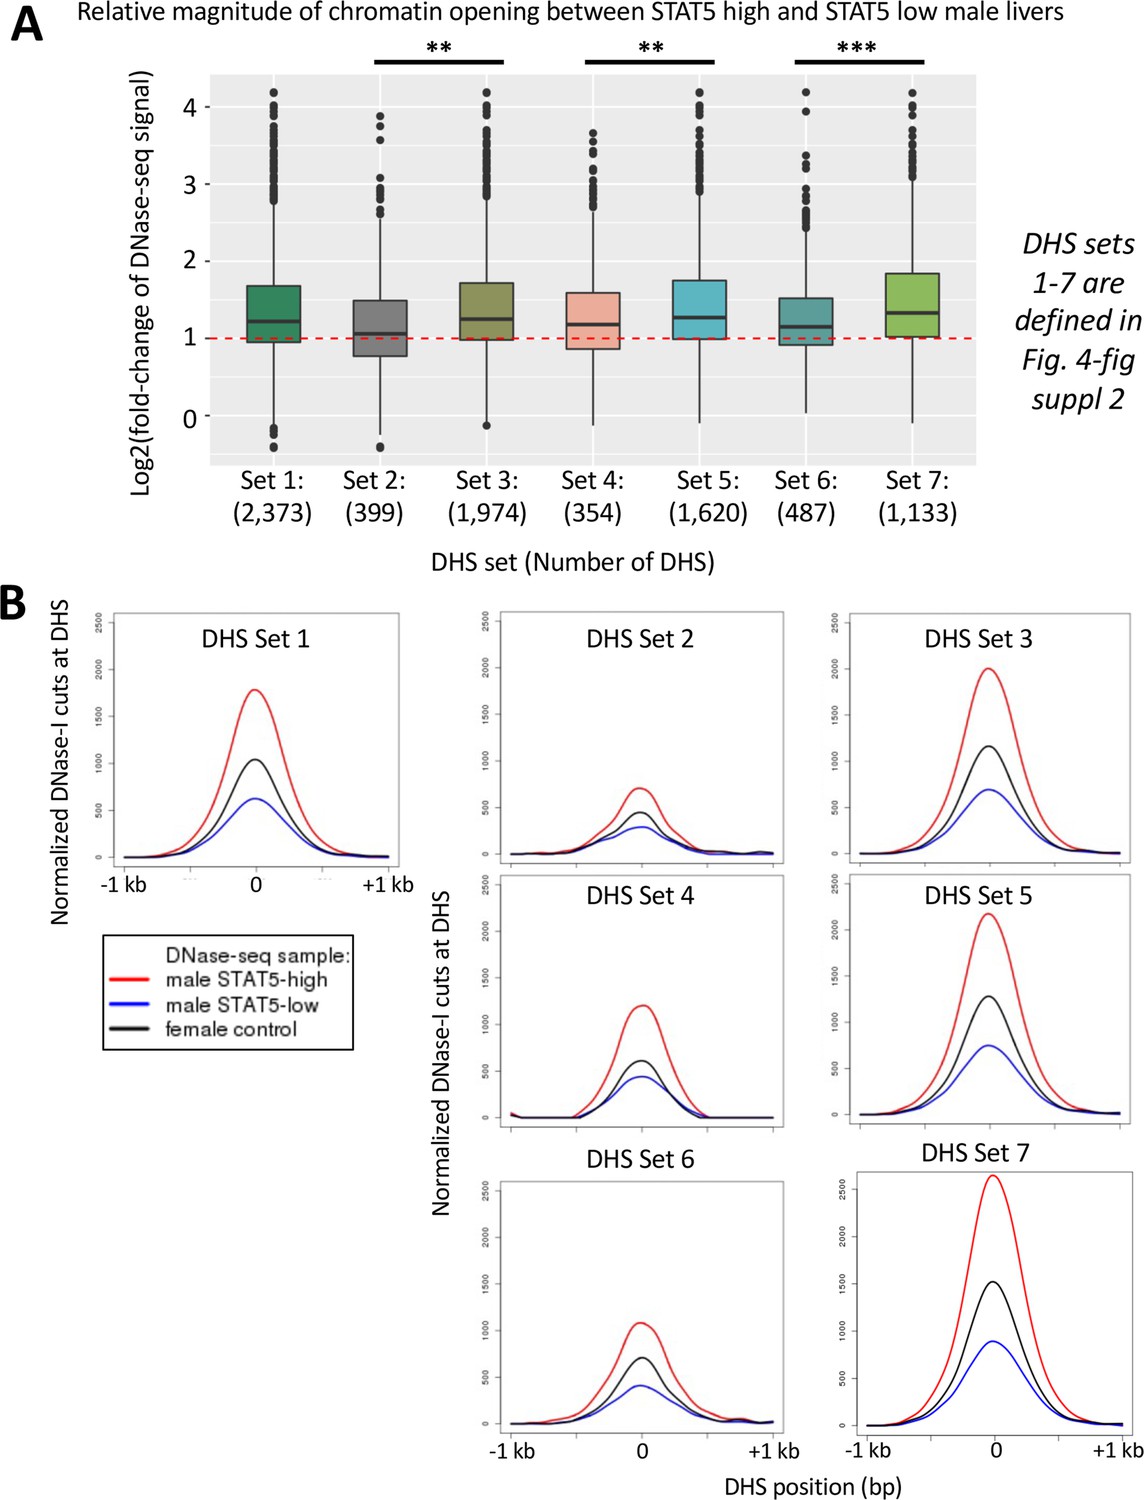
Impact of hypophysectomy and growth hormone (GH) pulse replacement on a set of 2373 dynamic DNase-I hypersensitivity sites (DHS), part 2.
(A) Boxplot analysis showing the distributions of the extent of differential chromatin opening between STAT5-high and STAT5-low male livers for the seven DHS subsets shown. The x-axis shows the DHS subsets numbered 1–7 and indicates the number of DHS in each set, with the DHS sets defined in Figure 4—figure supplement 2. RiPPM normalized DNase-seq read counts from the STAT5-high and STAT5-low male liver samples for the standard reference set of 70,211 DHS (Supplementary file 1A, columns AT-AU) were used to calculate STAT5-high/STAT5-low RiPPM-normalized DNase-seq read counts ratios for each DHS region, and which are displayed in boxplots. A Wilcoxon rank-sum test with Benjamini–Hochberg p-value adjustment was used to determine significant differences between distributions of fold-change values (*p<0.05, **p<1e-03, ***p<1e-10). (B). DNase-I cut site aggregate plots for the seven DHS subsets shown in (A). See Supplementary file 6 for DNase-seq aggregate plot peak values. These data validate the large increase in chromatin accessibility in the set of responsive DHS compared to non-responsive DHS (set 3 vs. set 2). Of the responsive DHS (n = 1974 sites), the subset that was opened by an exogenous GH pulse (set 5, n = 1620 DHS) showed greater chromatin opening induced by an endogenous GH/STAT5 pulse than the DHS subset not showing significant opening by a single exogenous GH pulse (n = 354) (set 4), a finding that was confirmed by the DNase-I aggregate cutting profiles shown in (B). Of the GH pulse opened DHS (n = 1620 sites), the subset that was closed following hypophysectomy (n = 1133 sites) showed greater chromatin opening due to an endogenous GH/STAT5 pulse than the subset that was not closed following hypophysectomy (n = 487 sites) (set 7 vs. set 6). The DHS that closed after hypophysectomy and then reopen following an exogenous GH pulse at any of the three time points (30, 90, or 240 min; set 7) showed the highest levels of chromatin opening by an endogenous GH/STAT5 pulse when compared to the other six DHS subsets.
Figure 5 with 1 supplement
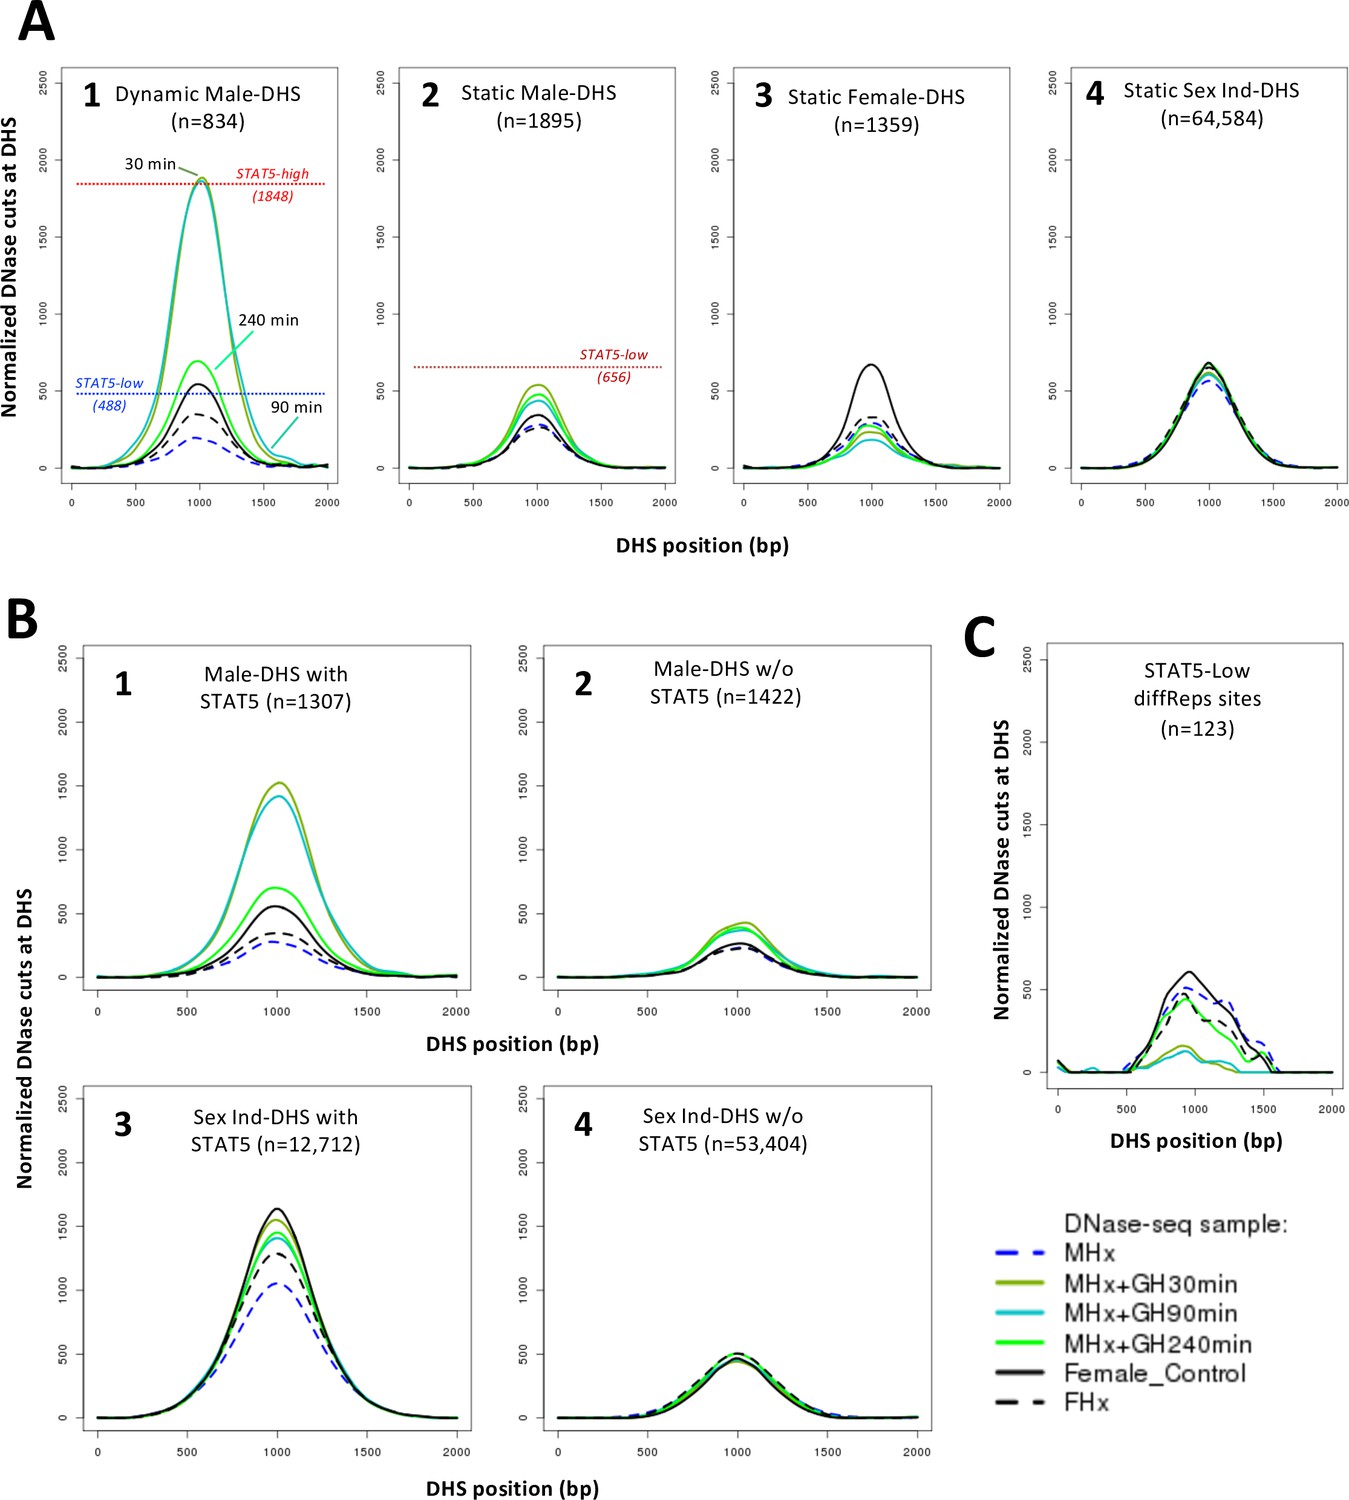
DNase-I hypersensitivity site (DHS) activity aggregate plots for hypophysectomy and time course of growth hormone (GH) pulse replacement.
(A) Normalized DNase-I cut site aggregate plots for each of the indicated sets of static and dynamic DHS showing the effects of hypophysectomy of male (MHx) and female mice (FHx) and of GH pulse treatment (MHx + GH) for 30, 90, and 240 min compared to intact females (c.f., Figure 3A). Reference values for normalized DNase-I cut site activity in intact male liver shown in plots 1 and 2 are from Figure 3 and Supplementary file 6. (B, C) Plots as in (A) are shown for the indicated subsets of 2729 male-biased DHS (plots 1 and 2) and for the indicated subsets of the set of 66,116 sex-independent DHS (plots 3 and 4), that is, DHS subsets with STAT5 bound (plots 1 and 3) or without STAT5 bound (plots 2 and 4), based on ChIP-seq data for STAT5 binding in intact male mouse liver (Zhang et al., 2012), and for the set of 123 STAT5-low sites (see Figure 2E).
Figure 5—figure supplement 1
DNase cut site aggregate plots for the growth hormone (GH) time-course DNase-I hypersensitivity site (DHS) data.
Shown are normalized DNase-I cut site aggregate plots for livers from hypophysectomized male mice (MHx), hypophysectomized male mice treated with GH (MHx + GH) then euthanized after 30, 90, or 240 min, and intact female and hypophysectomized female mice (FHx) across various sets of dynamic and static male-biased DHS, static female-biased DHS, and static sex-independent DHS. Each DHS set was separated into subsets based on STAT5 binding, as determined by ChIP-seq (top row: STAT5-bound DHS subsets; bottom row: corresponding non-STAT5-bound DHS subsets). Thus, MHx mice treated with GH for either 30 or 90 min show the largest degree of chromatin opening in the set of 710 dynamic male-biased DHS that bind STAT5. Chromatin opening decreased substantially after 240 min (plot 1A), at which time the activation of liver STAT5 DNA-binding activity is fully reversed (Connerney et al., 2017). Smaller increases in chromatin opening were observed with GH pulse treatment at the subset of 124 dynamic male-biased DHS that did not bind STAT5 (plot 1B), consistent with their dynamic responses to endogenous GH pulsation, and suggesting that chromatin opening at these sites proceeds by a distinct mechanism than at the STAT5-bound dynamic male-biased sites. Static male-biased DHS with STAT5 bound (597 sites) showed a more modest increase in chromatin opening with GH pulse treatment (c.f., higher basal level in MHx control and lower induced level with GH pulse; plot 2A), while static male-biased DHS without STAT5 binding (1298 sites) showed little or no GH pulse responsiveness (plot 2B). Importantly, the increase in chromatin opening at the STAT5-bound static male-biased DHS largely persists at 240 min (plot 2A), in contrast to the more substantial decline in chromatin opening seen for at STAT5-bound dynamic male-biased DHS (plot 1A). This suggests that, while STAT5 can open chromatin at the static male-biased DHS, it is not required to maintain chromatin accessibility between the naturally occurring endogenous plasma GH pulses. Chromatin opening at female-biased DHS was decreased by hypophysectomy, both at the 258 sites bound by STAT5 and at the 1101 sites that did not show STAT5 binding (plots 3A and 3B). Further, GH pulse treatment of MHx mice stimulated a modest decrease in liver chromatin accessibility at both sets of female-biased DHS. Finally, the dynamic, but not the static, sex-independent DHS showed large increases in chromatin opening following GH pulse treatment (plots 4A and 5A), similar to the dynamic male-biased DHS. Overall, DHS that bind STAT5 showed higher levels of chromatin opening than DHS that do not bind STAT5 (top row vs. bottom row). Notably, this difference in chromatin accessibility is preserved in hypophysectomized male and female liver, even though liver STAT5 is inactive and cannot bind DHS under these conditions due to the absence of GH stimulation, indicating a role for other pituitary-determined factors in chromatin opening.
Figure 6 with 1 supplement

Enrichment scores (ES) for sex-biased histone marks at dynamic and static DNase-I hypersensitivity site (DHS) sets.
(A) Enrichments of male-biased histone marks and (B) enrichments of female-biased histone marks. Data is presented as bar graphs showing significant enrichments and significant depletions (negative y-axis values) for the six indicated liver histone marks for each of four DHS sets (see Figure 2F). ES are graphed as six sets of four bars each, separated by vertical blue lines and ordered from 1 to 4 (see inset in A) and as marked above select bars. The set of 64,584 static sex-independent DHS was used as the background for the enrichment calculations. Fisher’s exact test significance values (log p-values, indicated by bar color; see inset in B) are shown for all values that are significant at p<E-03. Values that did not meet this significance threshold are graphed at ES = 1 (horizontal dashed green line); thus, all bars shown, except those graphed at ES = 1.0, represent statistically significant enrichment or depletion. Full details of the number of sites, the source publications used to identify these genomic regions, and corresponding BED files are shown in Supplementary file 7. (C) Proposed model for chromatin states adopted by dynamic male-biased DHS, static male-biased DHS, and static female-biased DHS in male liver (left) and in female liver (right) in response to the stimulatory and/or repressive actions of plasma GH pulses (in male liver) and persistent GH exposure (in female liver). Histone H3 marks are shown by small colored ovals attached to histone tails (see legend in box). H3K27me3 is specifically used to repress chromatin at female-biased DHS in male liver, and H3K9me3 is specifically used to repress chromatin at both classes of male-biased DHS in female liver. Sex-biased H3K36me3 marks are uniquely associated with static male-biased DHS in male liver and with static female-biased DHS in female liver. They may serve to keep these DHS constitutively open by inhibiting the introduction of H3K27me3 repressive marks (Yuan et al., 2011; Hoetker et al., 2023) at static female marks in female liver, and perhaps also the introduction of H3K9me3 repressive marks at static male-biased DHS in male liver. Continuous GH infusion in males mimics the female plasma GH pattern and overrides the stimulatory, chromatin opening effects of GH/STAT5 pulses on dynamic male-biased DHS; this, in turn, results in the widespread (95%) closing of dynamic male-biased DHS (Supplementary file 1E). DHS with a combination of activating and repressive histone marks in one but not both sexes (i.e., sex-dependent bivalent character) are indicated. The degree of chromatin accessibility is indicated by the relative distance between nucleosomes. Black arrows indicate DHS stimulation of gene transcription upon interaction of these enhancer DHS with a nearby or distal gene promoter. We speculate, but have not tested experimentally, that GH pulses induce an increase in activating histone marks at dynamic male-biased DHS, as indicated by the increase in H3K27ac marks shown here when the dynamic male biased DHS are opened.
Figure 6—figure supplement 1
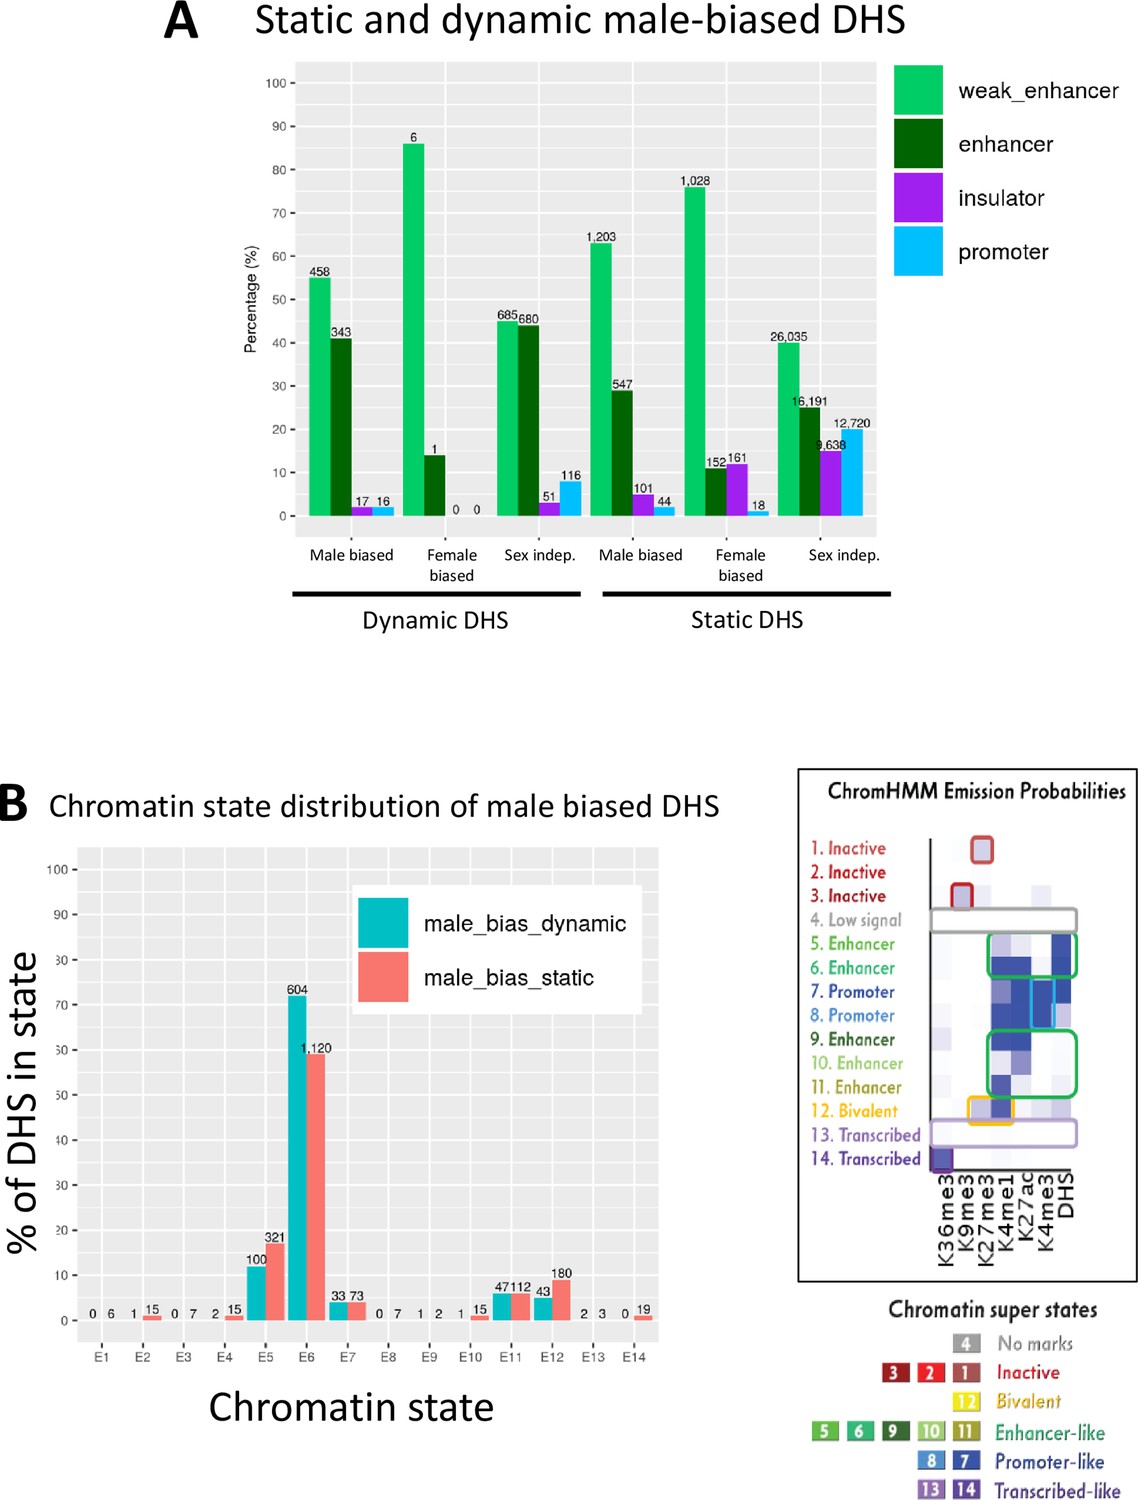
Chromatin state analysis of static and dynamic male-biased DNase-I hypersensitivity site (DHS).
(A) Distribution of static and dynamic DHS in the defined classes of enhancer DHS, weak enhancer DHS, insulator DHS, and promoter DHS, based on histone mark patterns (Matthews and Waxman, 2018). (B) Chromatin state distributions in male mouse liver of dynamic and static male-biased DHS, based on the 14 chromatin state model developed from the combination of six active and repressive histone marks and DHS, which segment the mouse genome into inactive, bivalent, enhancer-like, promoter-like, or transcribed-like states (Sugathan and Waxman, 2013). Chromatin state data are shown in Supplementary file 3. Right side of figure shows the emission probabilities for the six histone marks and DHS for each of the 14 chromatin states (reproduced from Figure 1C). The data in (A) show that, overall, 92–96% of dynamic and static male-biased DHS were classified as enhancers, with a larger fraction being weak enhancers (Matthews and Waxman, 2018) in the case of static male-biased DHS. Promoter DHS and insulator DHS comprised the balance of each male-biased DHS set (2–5% each). Similarly, 86% of female-biased DHS and 90% of dynamic sex-independent DHS were classified as enhancers or weak enhancers, unlike static sex-independent DHS, where insulator and promoter DHS designations were much more common (15–20% each vs. 3–8% for dynamic sex-independent DHS; also see Figure 1A). The data in (B) show that there are not large differences in chromatin state distributions between dynamic and static male-biased DHS. Thus, dynamic and static male-biased DHS both showed a high frequency (59–72%) of chromatin state E6, whose emission parameters indicate a high frequency of DHS and of the activating chromatin marks H3K27ac and H3K4me1. Much smaller percentages of both male-biased DHS subsets were in other chromatin states, primarily enhancer states E5 and E11, promoter state E7, and bivalent state E12, which is characterized by the presence of both activating marks (H3K4me1) and repressive marks (H2K27me3).
Figure 7
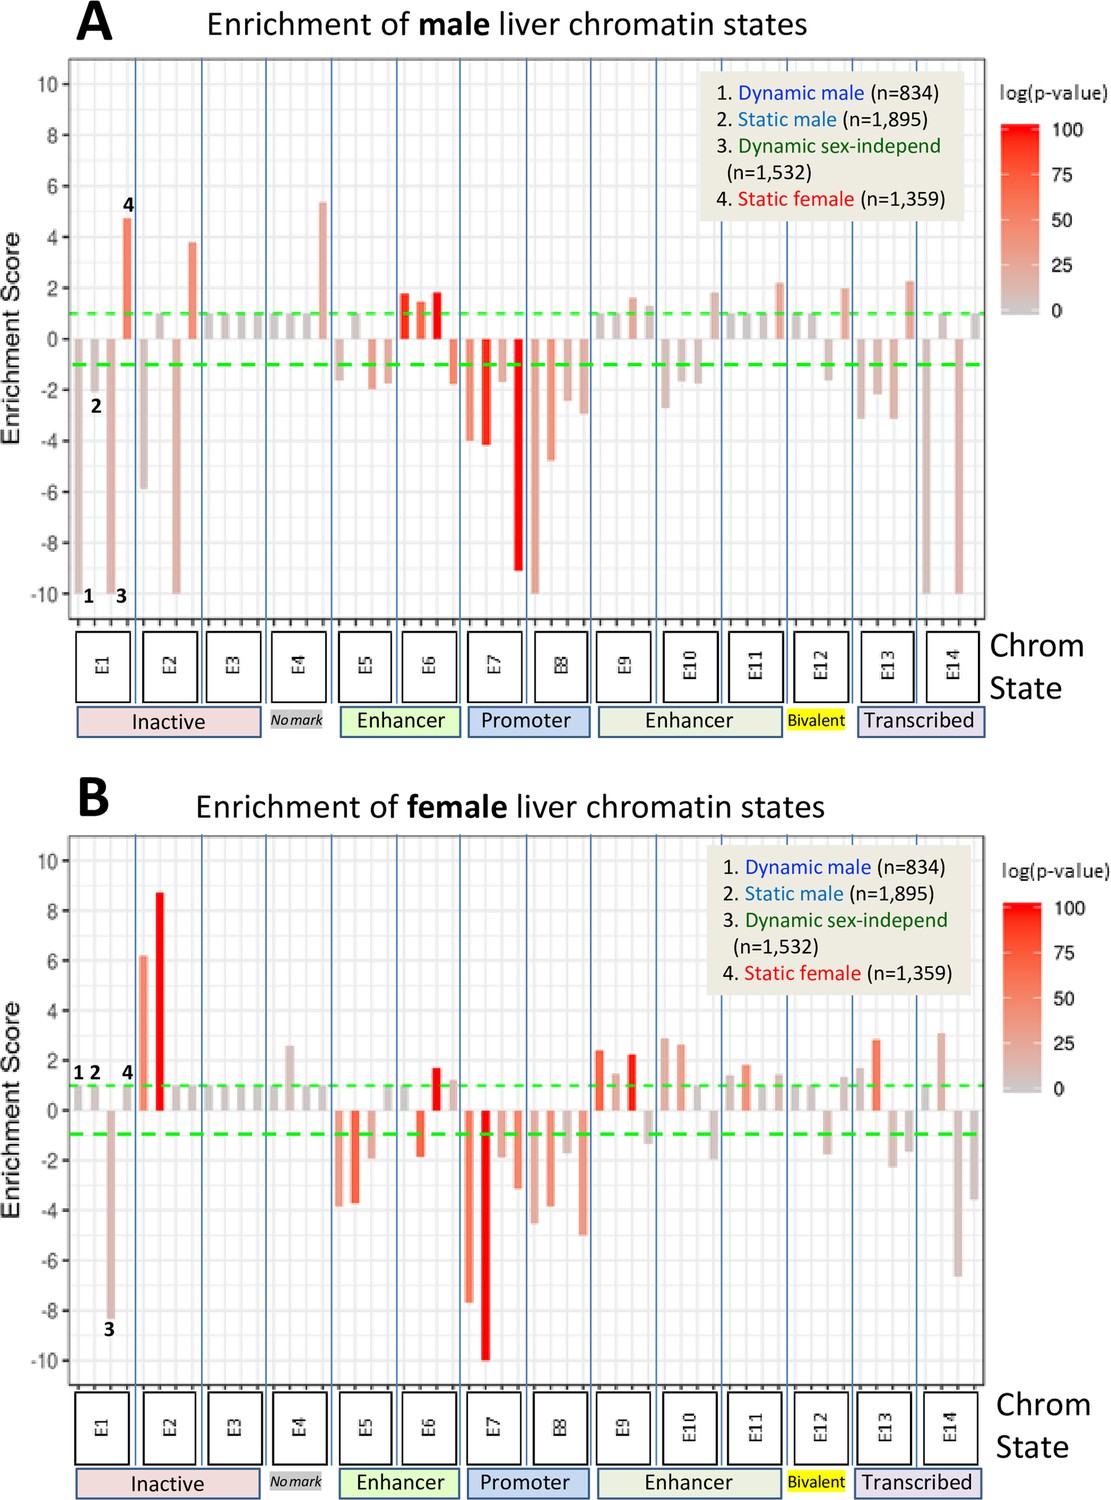
Enrichment scores for chromatin states at sex-biased and sex-independent dynamic and static DNase-I hypersensitivity sites (DHS).
Shown are the enrichments of male liver chromatin states (A) and of female liver chromatin states (B) at each of the four indicated DHS sets. Data are presented as described in Figure 6, with the set of 64,584 static sex-independent DHS used as background for the enrichment calculations. As many of the background set of DHS are active regulatory regions replete with enhancer marks, it is to be expected that the dynamic and static sex-biased DHS sets would show low, albeit significant enrichments for enhancer states E5, E6, and E9–E11. Full details of these analyses, including DHS chromatin states and source publications used to identify these genomic regions, are provided in Supplementary file 7.
Figure 8

STAT5 regulates sex-dependent hepatocyte gene expression at three distinct steps.
(1) Sex-biased chromatin opening: growth hormone (GH) pulse-induced chromatin opening at dynamic male-biased DNase-I hypersensitivity sites (DHS) is driven by pulsatile GH activation of STAT5 in male liver, whereas persistent activation of STAT5 in female liver is associated with static female-biased chromatin opening. (2) Sex-biased transcriptional activation: sex differences in open chromatin regions and their accessibility enable GH-activated STAT5, and other transcription factors, to bind chromatin in a sex-biased manner and induce the transcriptional activation of sex-biased genes. (3) Sex-based transcriptional repression: the sex-biased regulatory genes regulated in step (2) include the GH/STAT5-dependent repressor proteins BCL6 (male-biased) and CUX2 (female-specific), which reinforce sex differences in transcription by preferentially suppressing the expression of female-biased and male-biased genes, respectively, as indicated.
Tables
Table 1
Sex-biased DNase-I hypersensitivity sites (DHS).
| Dynamic male-biased DHS (n = 834, 31%) | Static male-biased DHS (n = 1895, 69%) | Static female-biased DHS (n = 1359, 99%) | |
|---|---|---|---|
| A. DHS activity (extent of chromatin opening) | |||
| STAT5-high male liver | +++ | + | - |
| STAT5-low male liver | + | + | - |
| Female liver | + | - | + |
| B. Sex-biased TF binding sites (enrichment) | |||
| STAT5 (binding in male liver) | +++ | + | - |
| CUX2 (binding in female liver) | + | ++ | - |
| FOXA1 (male-biased sites) | + | ++ | - |
| FOXA2 (male-biased sites) | +++ | +++++ | - |
| FOXA2 (female-biased sites) | - | - | +++ |
| C. Enriched H3 histone marks and chromatin states (enrichment) | |||
| K27ac, K4me1, with DHS (male liver) [State E6] | ++ | ++ | - |
| K27ac and/or K4me1 (male-liver) [States E10, E11] | - | - | ++ |
| K36me3 (male-biased) | - | ++ | - |
| K36me3 (female-biased) | - | - | ++ |
| K27me3 (male-biased) | - | - | +++ |
| K9me3 (female-biased) | ++ | ++ | - |
-
+++, high; ++, medium; +, low; -, very low or absent.
Additional files
-
Supplementary file 1
Liver DHS.
(A) Standard reference set of 70,211 liver DHS regions and associated datasets. (B) Enrichments of sex-biased DHS for corresponding sex-biased vs. sex-opposite gene targets (sections 1–3) and enrichments for hypox-responsive class I and II sex-biased genes (section 4). (C) Summary of sex-biased gene targets of sex-biased DHS, from sheet A. Columns A and B indicate that multiple sex-biased DHS map to many sex-biased genes. The overall set of sex-biased DHS mapped to a total of 192 male-biased genes and 174 female-biased genes, corresponding to 32.5% of all sex-biased genes considered. (D) Calculation of chromatin state distributions shown in Figure 1D, based on data in sheet A, columns AN–AQ. (E) DHS closing and opening following continuous GH infusion in male mice for 7 d, based on data in sheet A, column BC.
- https://cdn.elifesciences.org/articles/91367/elife-91367-supp1-v1.xlsx
-
Supplementary file 2
Sex-biased genes.
Shown are mouse liver gene expression for RefSeq and multi-exonic lncRNA genes, their sex-bias classification, and hypophysectomy response classes. Data shown are normalized differential expression ratios, calculated as intact-male/intact-female, corresponding fold-change (FC) values, normalized read counts (FPKM; fragments per kilobase of region of interest per million mapped reads) for male and female liver, and FDR (adjusted p-values) for the comparison.
- https://cdn.elifesciences.org/articles/91367/elife-91367-supp2-v1.xlsx
-
Supplementary file 3
Chromatin states in male (A) and in female (B) mouse liver.
Chromatin state maps (14 state model) were previously developed for male mouse liver, and separately for female mouse liver, using a panel of six histone marks and DHS data, and used to identify sex differences in chromatin state and chromatin structure and their relationships to sex-biased gene expression (Sugathan and Waxman, 2013). BEDTools was used to determine the overlap between the 14 chromatin states identified in male liver and the reference set of 70,211 DHS used in this study. The genomic position of the chromatin state assignment is listed in columns A–C, corresponding name (column D), a unique ID (CS Number, column E), and its overlapping DHS region (columns F–I). The number of overlapping base pairs is provided in column J; values of zero indicate lack of DHS overlap for that chromatin state region.
- https://cdn.elifesciences.org/articles/91367/elife-91367-supp3-v1.xlsx
-
Supplementary file 4
Summary of DNase-seq analysis.
Shown are the total and mapped read counts for the DNase-seq samples prepared and analyzed in this study, the number of DHS peaks discovered in each sample by MACS2, and the fraction of sequence reads found in the sample’s respective peak list. The data for the pituitary-intact male liver (STAT5-high and STAT5-low) samples and the GH time-course mouse liver (hypophysectomized [hypox] and GH treated) samples are shown separately.
- https://cdn.elifesciences.org/articles/91367/elife-91367-supp4-v1.xlsx
-
Supplementary file 5
Hypophysectomy-responsive DHS.
(A) DHS peak summary and enrichment calculations summary for the sets of DNase-seq peaks discovered for the pituitary-intact male liver (STAT5-high and STAT5-low) samples and for the GH time-course mouse liver (hypophysectomized [hypox] and GH treated) samples. Each sheet (B–G) contains the peak union list generated from the respective data set and indicates a single overlapping DHS for each peak union site. Also shown is a summary of the enrichments shown in sheet I and presented in Figure 4D. (B–G) Shown for each indicated DHS set is the DHS overlap with the reference set of 70,211 DHS. Merged list of 70,767 DHS regions was generated based on the MACS2 peaks called for each DNase-seq replicate sample and assigned a unique name (DHS Peak Number, column E). The genomic position of the DHS region is listed in columns A–C, its DHS response in column D, and its overlap with the reference set of 70,211 DHS is shown in columns (F–I). The number of overlapping base pairs is provided in column J; values of zero indicate lack of overlap between DHS regions. (H) Responsiveness of sex-biased DHS classes to hypox in male and in female mouse liver. DHS counts are based on sex-biased DHS classifications in Supplementary file 1A, column I, and hypophysectomy response data summarized in columns AI–AJ of that sheet. No DHS overlap indicates that the indicated male or female hypox dataset does not contain the indicated number of DHS from the standard reference set of 70,211 liver DHS listed in Supplementary file 1A. For example, 19 of 834 dynamic male-biased DHS and 454 of 1895 static male-biased DHS are absent from the male hypox DHS dataset used for these analyses. Those DHS were excluded when calculating the percentage values shown in columns C, E, G, etc. (I) Hypophysectomy enrichments of DHS regions.
- https://cdn.elifesciences.org/articles/91367/elife-91367-supp5-v1.xlsx
-
Supplementary file 6
Summary of DNase-seq aggregate plots.
Shown is the maximum value for each DNase-I cut site aggregate plot for each of the DNase-seq samples indicated, organized by manuscript figure number. Briefly, normalized DNase-I cut site aggregate plots were generated using input DNase-seq datasets (columns C–H) and the set of input genomic regions (DHS sequences) (columns A–B) used for sequence read counting. A single replicate combined sample was generated for each of the following groups: male STAT5-high, male STAT5-low, female control, hypophysectomized male (MHx) and female (FHx), and MHx treated with GH (MHx + GH) at the following time points: 30, 90, and 240 min. These replicate combined samples were then used to determine the number of DNase-I cuts at each nucleotide position of the 2 kb midpoint-centered regions of the DHS region. The maximum value of the smoothed cumulative DNase-I cutting profile in each of the figures is shown below. All the numbers shown in columns C–H are directly comparable to each other: the data for aggregate profiles and also the RiPPM read counts shown in Supplementary file 1 are normalized by the number of DNase-seq reads in the reference set of 70, 211 DHS (i.e., normalization by reads in peaks).
- https://cdn.elifesciences.org/articles/91367/elife-91367-supp6-v1.xlsx
-
Supplementary file 7
Transcription factor and histone marks enrichments.
(A) Summary of genomic regions with transcription factor binding or with histone marks used for DHS enrichment calculations. (B) Summary of DHS enrichment calculations for the biologically relevant regions defined in sheet A. (C) Full listing of DHS enrichment calculations shown in sheet B. Shown is the calculated enrichment score (ES), the number and percent of overlapping DHS, the number and percent of overlapping background DHS, and Fisher’s exact test p-value for the overlap between the DHS and each set of biologically relevant regions. (D–F) Coordinates for each of the sex-biased transcription factor binding sites (D) and chromatin mark regions in male liver (E) and in female liver (F), as defined in sheet A.
- https://cdn.elifesciences.org/articles/91367/elife-91367-supp7-v1.xlsx
-
Supplementary file 8
MAnorm comparative analysis of FoxA1 (A) and FoxA2 (B) ChIP-seq peaks between male and female mouse liver.
Raw data from Li et al., 2012 was processed and reanalyzed with MAnorm to identify sex-specific FoxA1 and FoxA2 binding sites in mouse liver. FoxA ChIP-seq samples in male and female liver were defined as samples 1 and 2, respectively. Shown is the MAnorm output which lists the peak coordinates, raw reads, M and A values, and MA-norm p-value for the set of common peaks in each sample and for the peaks unique to each sample. M-values are defined as the log2 fold change and A-values are defined as the average signal strength of the of normalized read densities under comparison.
- https://cdn.elifesciences.org/articles/91367/elife-91367-supp8-v1.xlsx
-
Supplementary file 9
Gene to DHS associations determined by GREAT analysis.
(A–E) Gene-centric presentation of DHS regions that map to each gene; (F–I) DHS-centric presentation of genes that map to each DHS region.
- https://cdn.elifesciences.org/articles/91367/elife-91367-supp9-v1.xlsx
-
Supplementary file 10
GREAT analysis of four DHS sets of interest.
(A–D) Full output from GREAT analysis of each of the four indicated DHS sets using a whole-genome background. Analysis was performed using GREAT version 4.0.4. (E) Mouse mm9 coordinates of each DHS set input to GREAT for the analyses shown in A–D.
- https://cdn.elifesciences.org/articles/91367/elife-91367-supp10-v1.xlsx
-
MDAR checklist
- https://cdn.elifesciences.org/articles/91367/elife-91367-mdarchecklist1-v1.pdf
Download links
A two-part list of links to download the article, or parts of the article, in various formats.
Downloads (link to download the article as PDF)
Open citations (links to open the citations from this article in various online reference manager services)
Cite this article (links to download the citations from this article in formats compatible with various reference manager tools)
Plasma growth hormone pulses induce male-biased pulsatile chromatin opening and epigenetic regulation in adult mouse liver
eLife 12:RP91367.
https://doi.org/10.7554/eLife.91367.3


