Ex vivo expansion potential of murine hematopoietic stem cells is a rare property only partially predicted by phenotype
- Division of Molecular Hematology, Department of Laboratory Medicine, Lund Stem Cell Center, Faculty of Medical, Lund University, Sweden
Figures
Figure 1 with 1 supplement
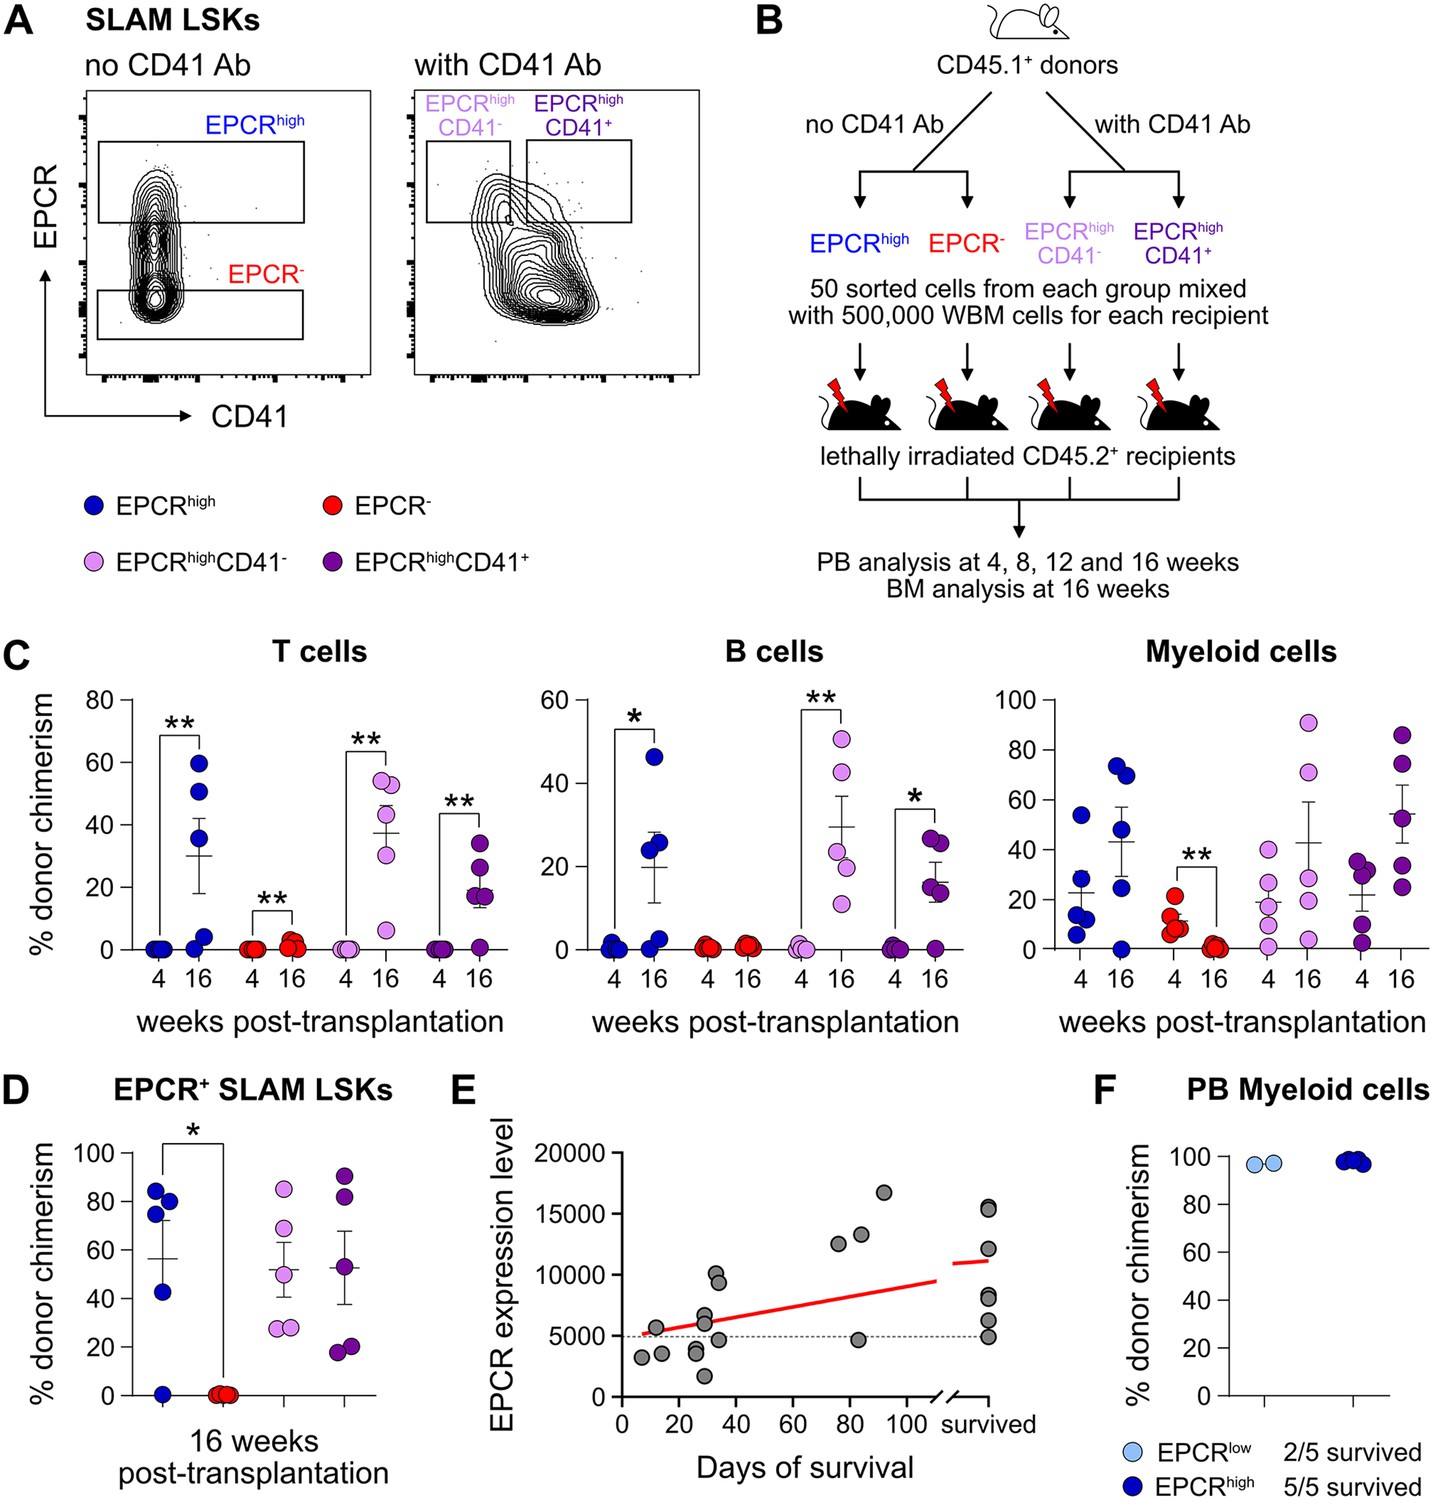
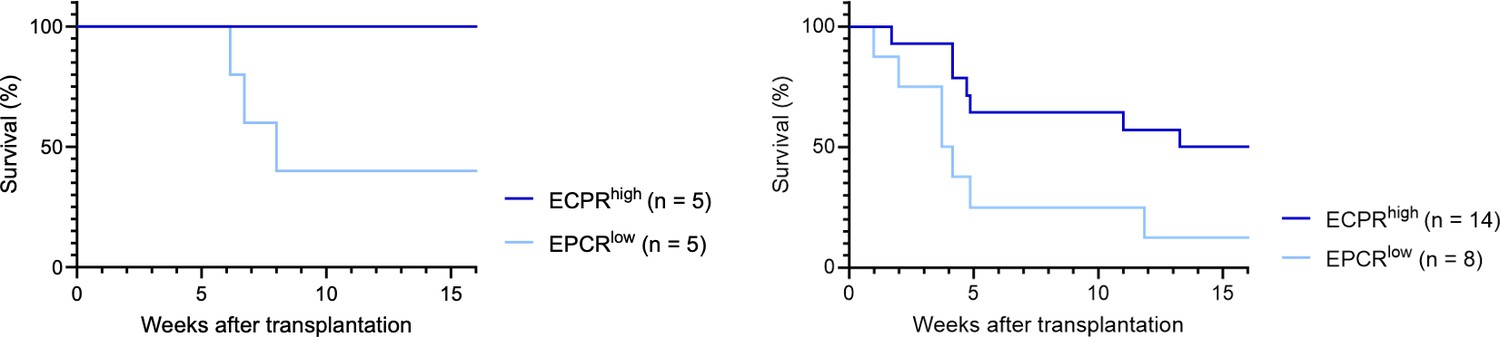
Endothelial protein C receptor (EPCR) expression within the bone marrow (BM) SLAM LSK fraction is a high-confidence predictor of transplantation-associated hematopoietic stem cell (HSC) activity.
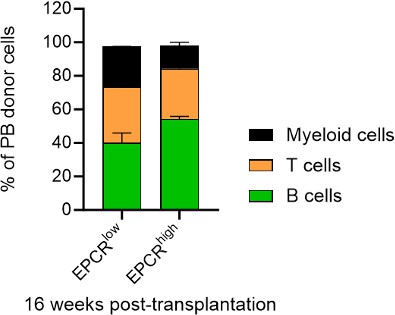
(A) Expression patterns of EPCR and CD41 within the BM LSK SLAM fraction. Gates depict the assessed cell fractions. (B) Strategy used to assess the correlation of EPCR and CD41 expression to the in vivo HSC activity. (C) Test cell-derived chimerism in peripheral blood (PB) 4 and 16 weeks post-transplantation. n=5 per group. (D) Test cell-derived chimerism in BM EPCR+ SLAM LSKs 16 weeks post-transplantation. n=5 per group. (E) Correlation between duration of radioprotection and EPCR expression levels. BM LSK SLAM cells were co-stained with EPCR and index-sorted at one cell per well, cultured for 21 days, and the content of each well transplanted to individual recipients (n=22). Correlation to mortality of individual mice was made by assessing which well was transplanted into which mouse and coupling this to the index-sorting information. The gray dash line indicated the separation of EPCR higher (>4900) or lower expression (<4900) cHSCs. (F) Donor contribution in PB myeloid cells. Mice were transplanted with ex vivo expanded cells from either 50 SLAM LSK EPCRlow (n=5) or 50 SLAM LSK EPCRhigh cells (n=5) and assessments made 16 weeks after transplantation. All data points depict values in individual recipients. Error bars denote SEM. The asterisks indicate significant differences. *, p<0.05; **, p<0.01. In (E) a regression line was generated based on an endpoint survival of 150 days (the time at which the experiment was terminated).
-
Figure 1—source data 1
Raw data for Figure 1C: Donor chimerism in peripheral blood (PB) 4 and 16 weeks post-transplantation.
- https://cdn.elifesciences.org/articles/91826/elife-91826-fig1-data1-v1.xlsx
-
Figure 1—source data 2
Raw data for Figure 1D: Donor chimerism in bone marrow (BM) EPCR+ SLAM LSKs 16 weeks post-transplantation.
- https://cdn.elifesciences.org/articles/91826/elife-91826-fig1-data2-v1.xlsx
-
Figure 1—source data 3
Raw data for Figure 1E: Correlation between endothelial protein C receptor (EPCR) expression level and animal survival.
- https://cdn.elifesciences.org/articles/91826/elife-91826-fig1-data3-v1.xlsx
-
Figure 1—source data 4
Raw data for Figure 1F: Donor chimerism in peripheral blood (PB) myeloid cells 16 weeks post-transplantation.
- https://cdn.elifesciences.org/articles/91826/elife-91826-fig1-data4-v1.xlsx
Figure 1—figure supplement 1
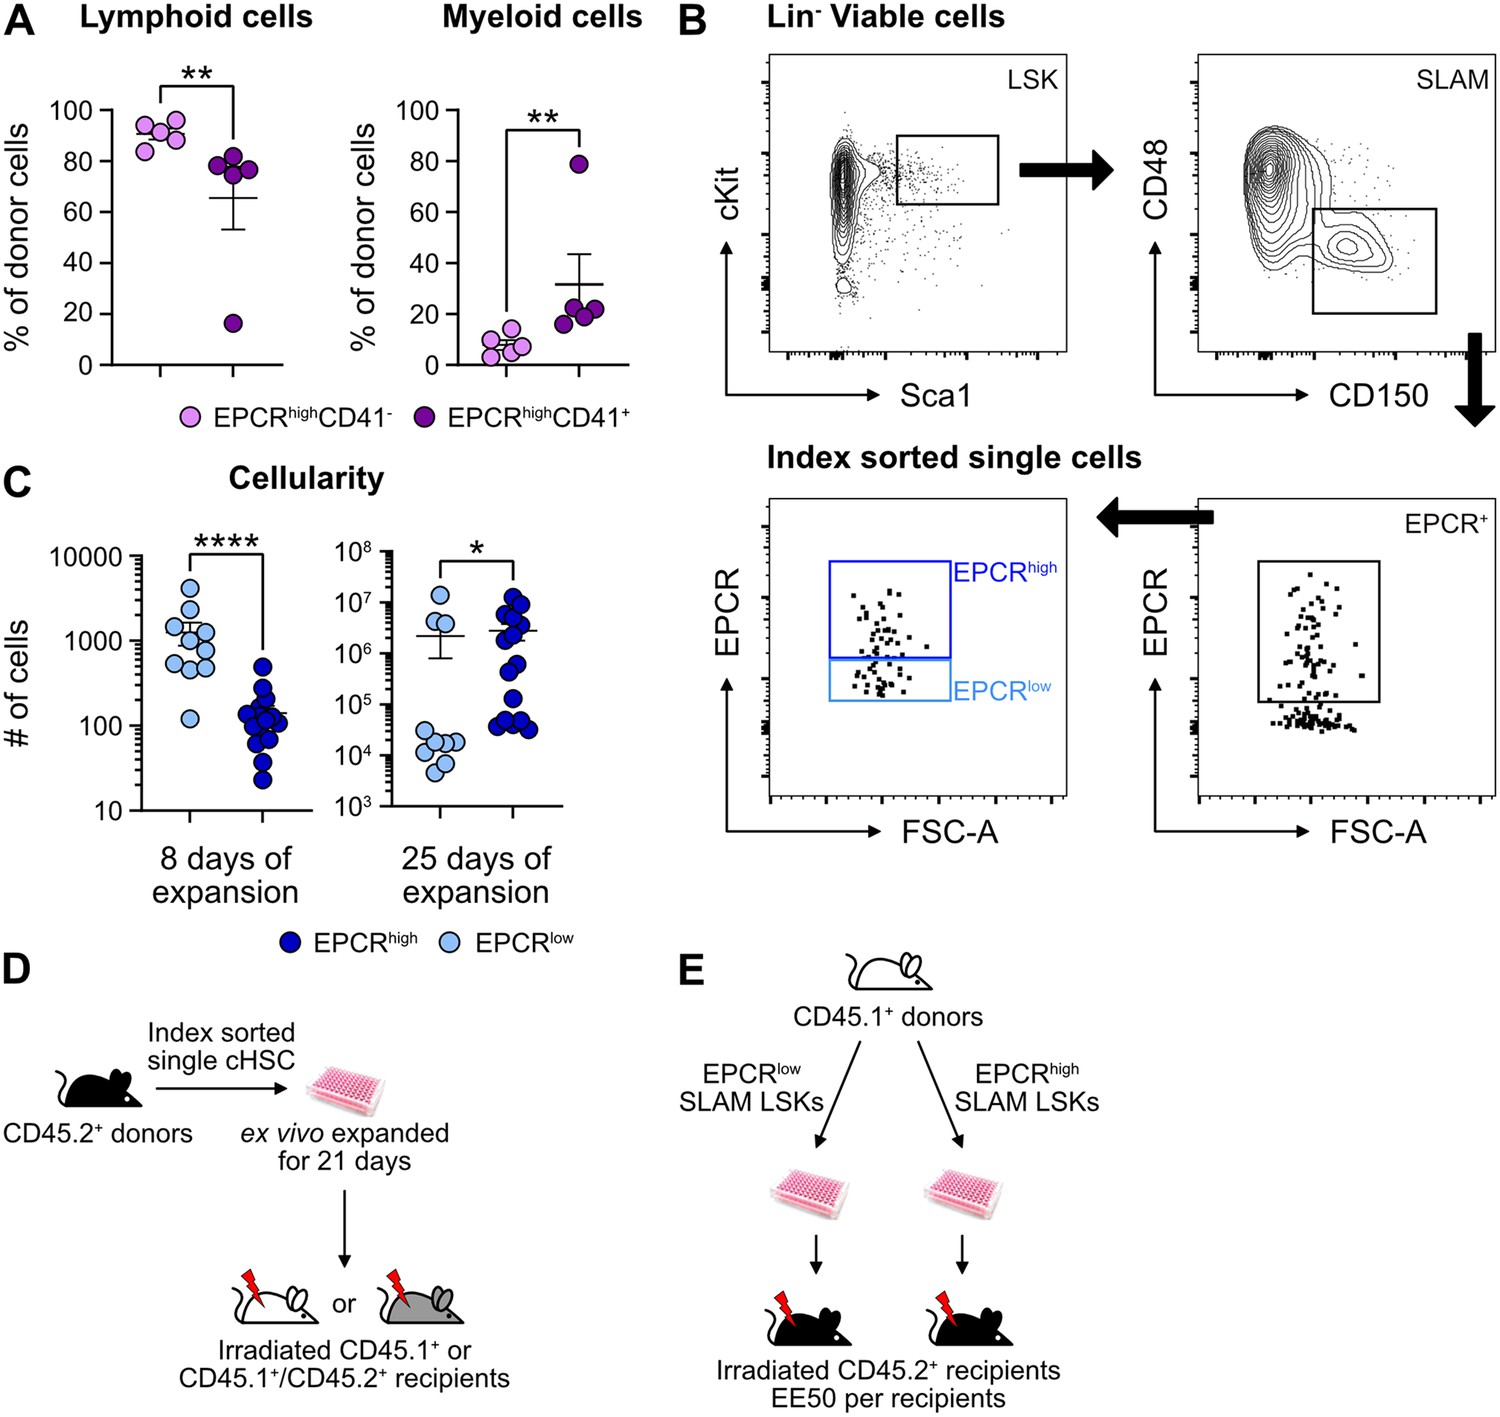
The peripheral blood (PB) lineage output from EPCRhighCD41- and EPCRhighCD41+ cells after transplantation.
(A) The distribution of lymphoid (pooled B and T cells) and myeloid cells out of the test cell-derived reconstitution 16 weeks post-transplantation. n=5 for each group. (B) Index-sorting strategy for single-cell cultures. (C) Overall cell expansion from one index-sorted SLAM LSKs after 8 (EPCRlow, n=10; EPCRhigh, n=14) or 25 days (EPCRlow, n=10; EPCRhigh, n=15) of ex vivo culture. Cultures were separated into two groups based on endothelial protein C receptor (EPCR) expression level. (D) Strategy to assess repopulating and radioprotection ability of ex vivo expanded cells from index-sorted single SLAM LSKs. (E) Strategy to assess repopulating and radioprotection ability of cells ex vivo expanded from 50 EPCRhigh or EPCRlow SLAM LSKs. Data points depict values in individual recipients or individual cultures. Error bars denote SEM. The asterisks indicate significant differences. *, p<0.05; **, p<0.01; ****, p<0.0001.
-
Figure 1—figure supplement 1—source data 1
Raw data for Figure 1—figure supplement 1A: Donor chimerism in peripheral blood (PB) B and T cells 16 weeks post-transplantation.
- https://cdn.elifesciences.org/articles/91826/elife-91826-fig1-figsupp1-data1-v1.xlsx
-
Figure 1—figure supplement 1—source data 2
Raw data for Figure 1—figure supplement 1C: Cellularity of whole culture expanded ex vivo from EPCRlow or EPCRhigh SLAM LSKs.
- https://cdn.elifesciences.org/articles/91826/elife-91826-fig1-figsupp1-data2-v1.xlsx
Figure 2 with 1 supplement
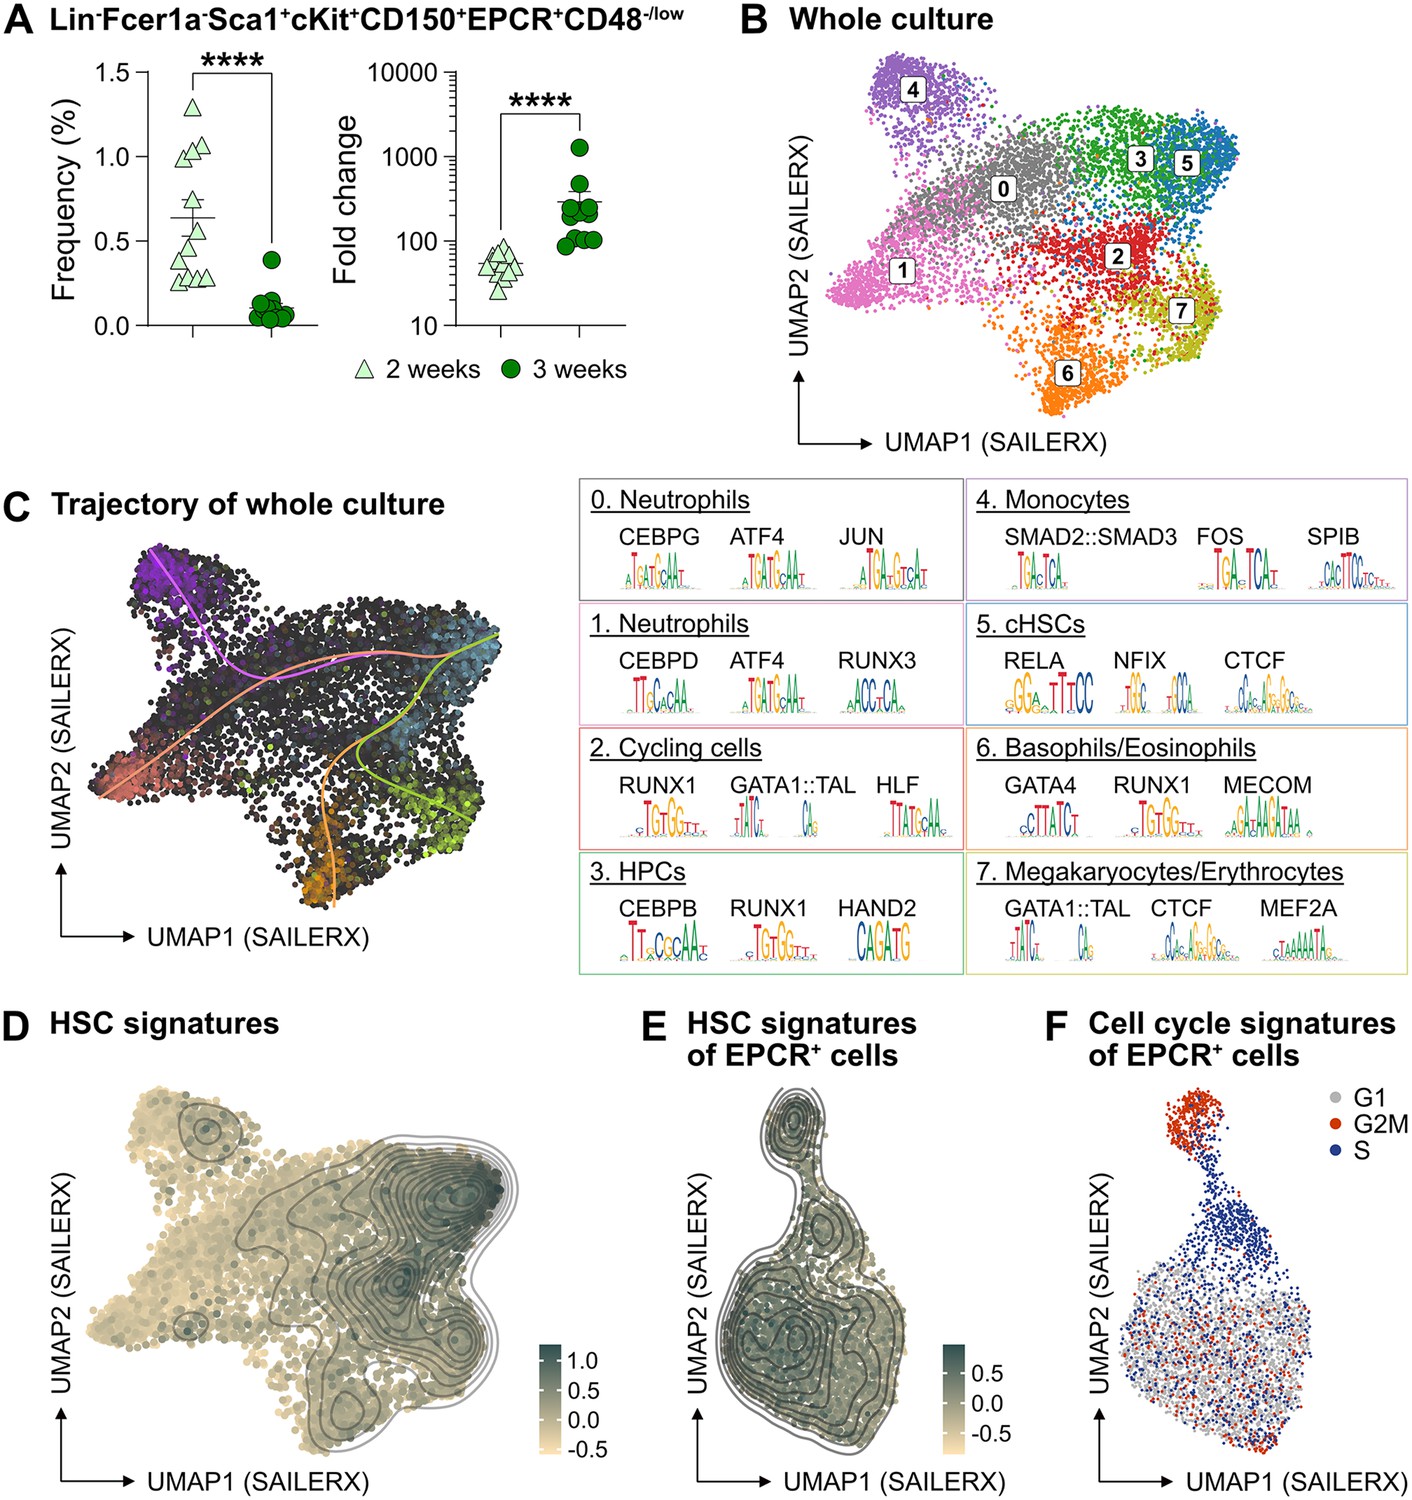
The phenotypic properties of hematopoietic stem cell (HSC) expansion cultures.
(A) Frequency and fold change of phenotypic candidate HSCs (cHSCs) (EPCRhigh SLAM LSKs) in ex vivo cultures after 14 or 21 days of culture (n=12 per group). Data points depict values from individual cultures initiated from 50 cHSCs. Error bars denote SEM. The asterisks indicate significant differences. ****, p<0.0001. (B) UMAP (based on SAILERX dimensionality reduction) of single-cell multiome profiling of cells expanded ex vivo for 21 days. Cell-type annotations were derived using marker gene signatures and distal motif identities. (C) Trajectory analysis of lineage differentiation for cells expanded ex vivo (left), with the top 3 scoring TF motifs of each cluster (right). (D) Expression of HSC signature on whole culture. (E) Expression of HSC signature of EPCR+ cells sorted from ex vivo cultures. (F) Cell cycle phase classification of EPCR+ cells sorted from ex vivo cultures.
-
Figure 2—source data 1
Raw data for Figure 2A: Frequency and fold change of phenotypic candidate hematopoietic stem cells (cHSCs) expanded ex vivo.
- https://cdn.elifesciences.org/articles/91826/elife-91826-fig2-data1-v1.xlsx
Figure 2—figure supplement 1
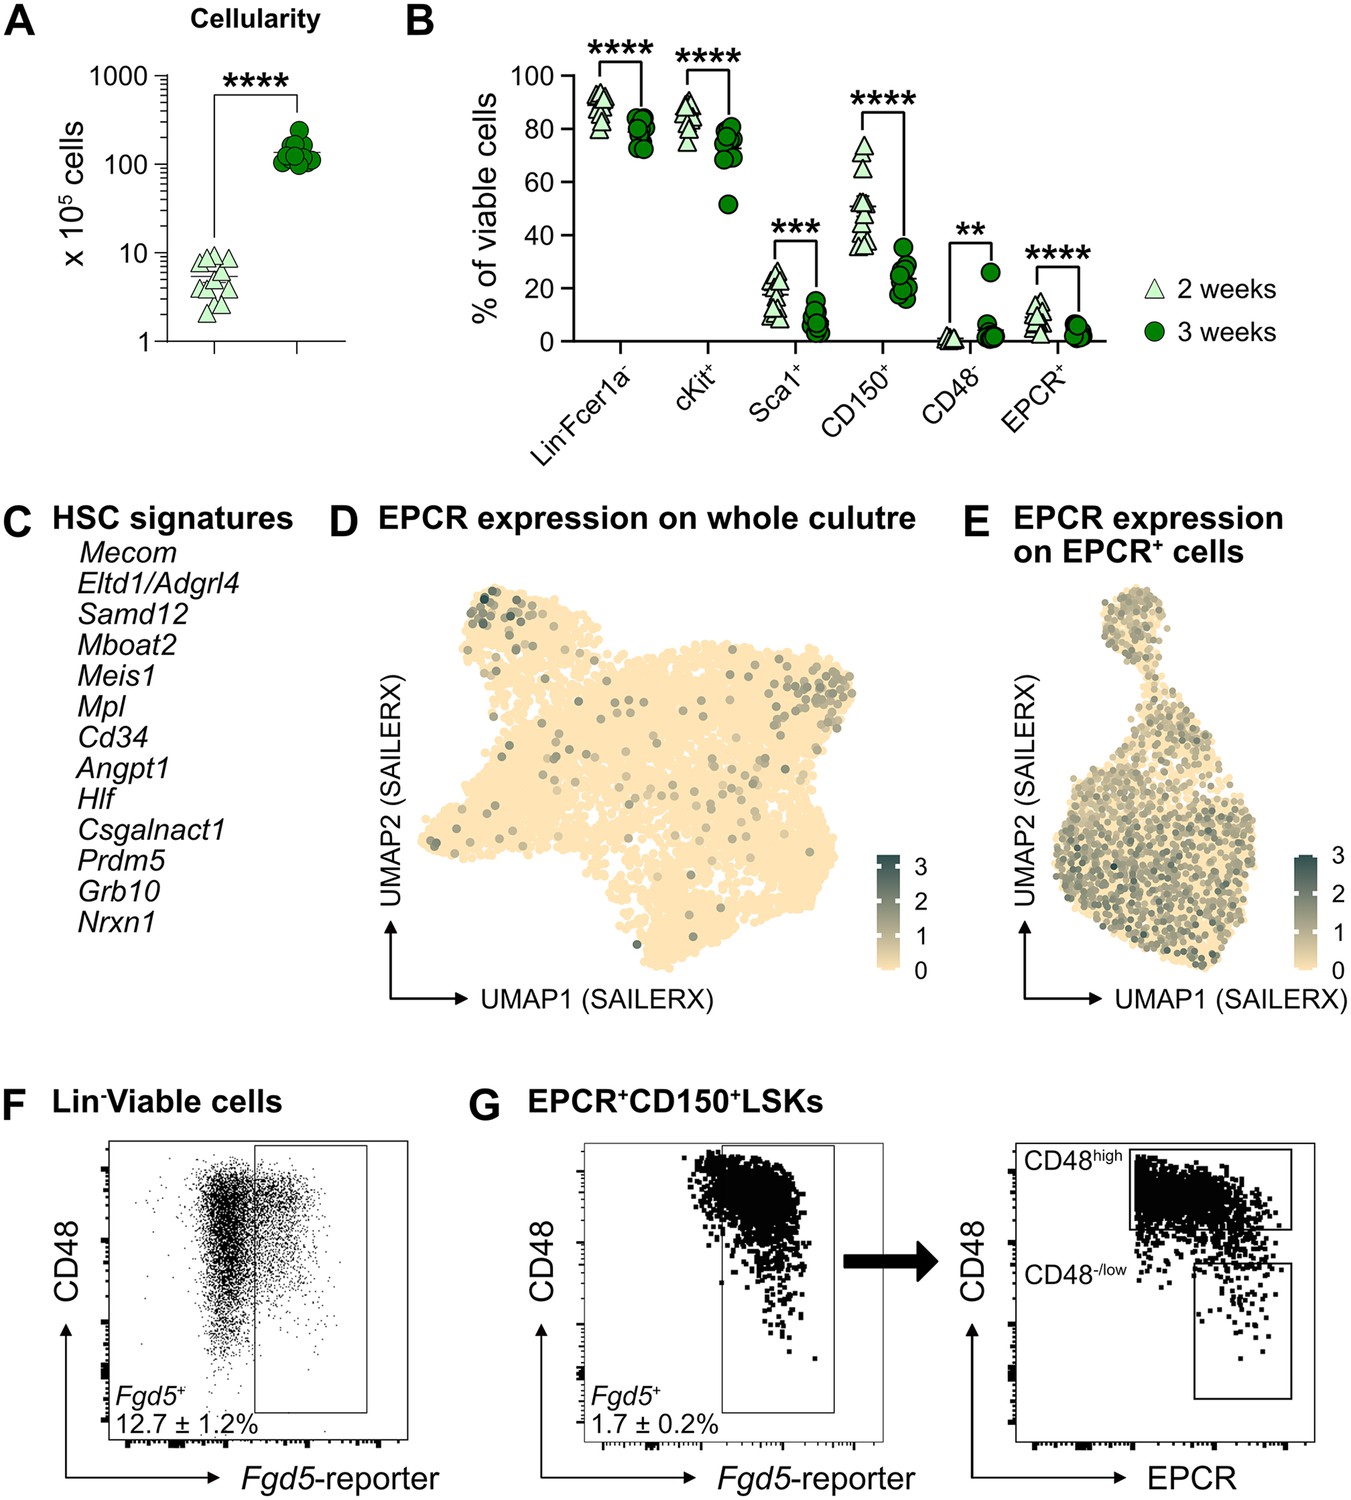
Heterogeneity of ex vivo expanded candidate hematopoietic stem cells (cHSCs).
(A) Overall cell expansion from 50 EPCRhigh SLAM LSKs after 14 or 21 days of ex vivo culture (n=12 per group). (B) Frequency of cells expressing different stem cell markers in ex vivo cultures following 14 or 21 days of culture (n=12 per group). Data points depict values from individual cultures initiated from 50 cHSCs. (C) List of signatures used to define cHSCs. (D) and (E) Expression of endothelial protein C receptor (EPCR) on whole culture and EPCR+ cells. (F) and (G) Representative FACS plots of cells expanded 14 or 21 days in ex vivo cultures using Fgd5-ZsGreen reporter cells, respectively. Mean values demonstrate the frequency of Fgd5+Lin-Fcer1a- or Fgd5+EPCR+CD150+Fcer1a-LSK cells, respectively. Mean ± SEM value was calculated from 15 individual cultures initiated from 50 cHSCs. Error bars denote SEM. The asterisks indicate significant differences. **, p<0.01; ***, p<0.001; ****, p<0.0001.
-
Figure 2—figure supplement 1—source data 1
Raw data for Figure 2—figure supplement 1A: Cellularity of whole culture expanded ex vivo for 2 or 3 weeks.
- https://cdn.elifesciences.org/articles/91826/elife-91826-fig2-figsupp1-data1-v1.xlsx
-
Figure 2—figure supplement 1—source data 2
Raw data for Figure 2—figure supplement 1B: Frequency of cells with different surface marker expression patterns.
- https://cdn.elifesciences.org/articles/91826/elife-91826-fig2-figsupp1-data2-v1.xlsx
Figure 3 with 1 supplement
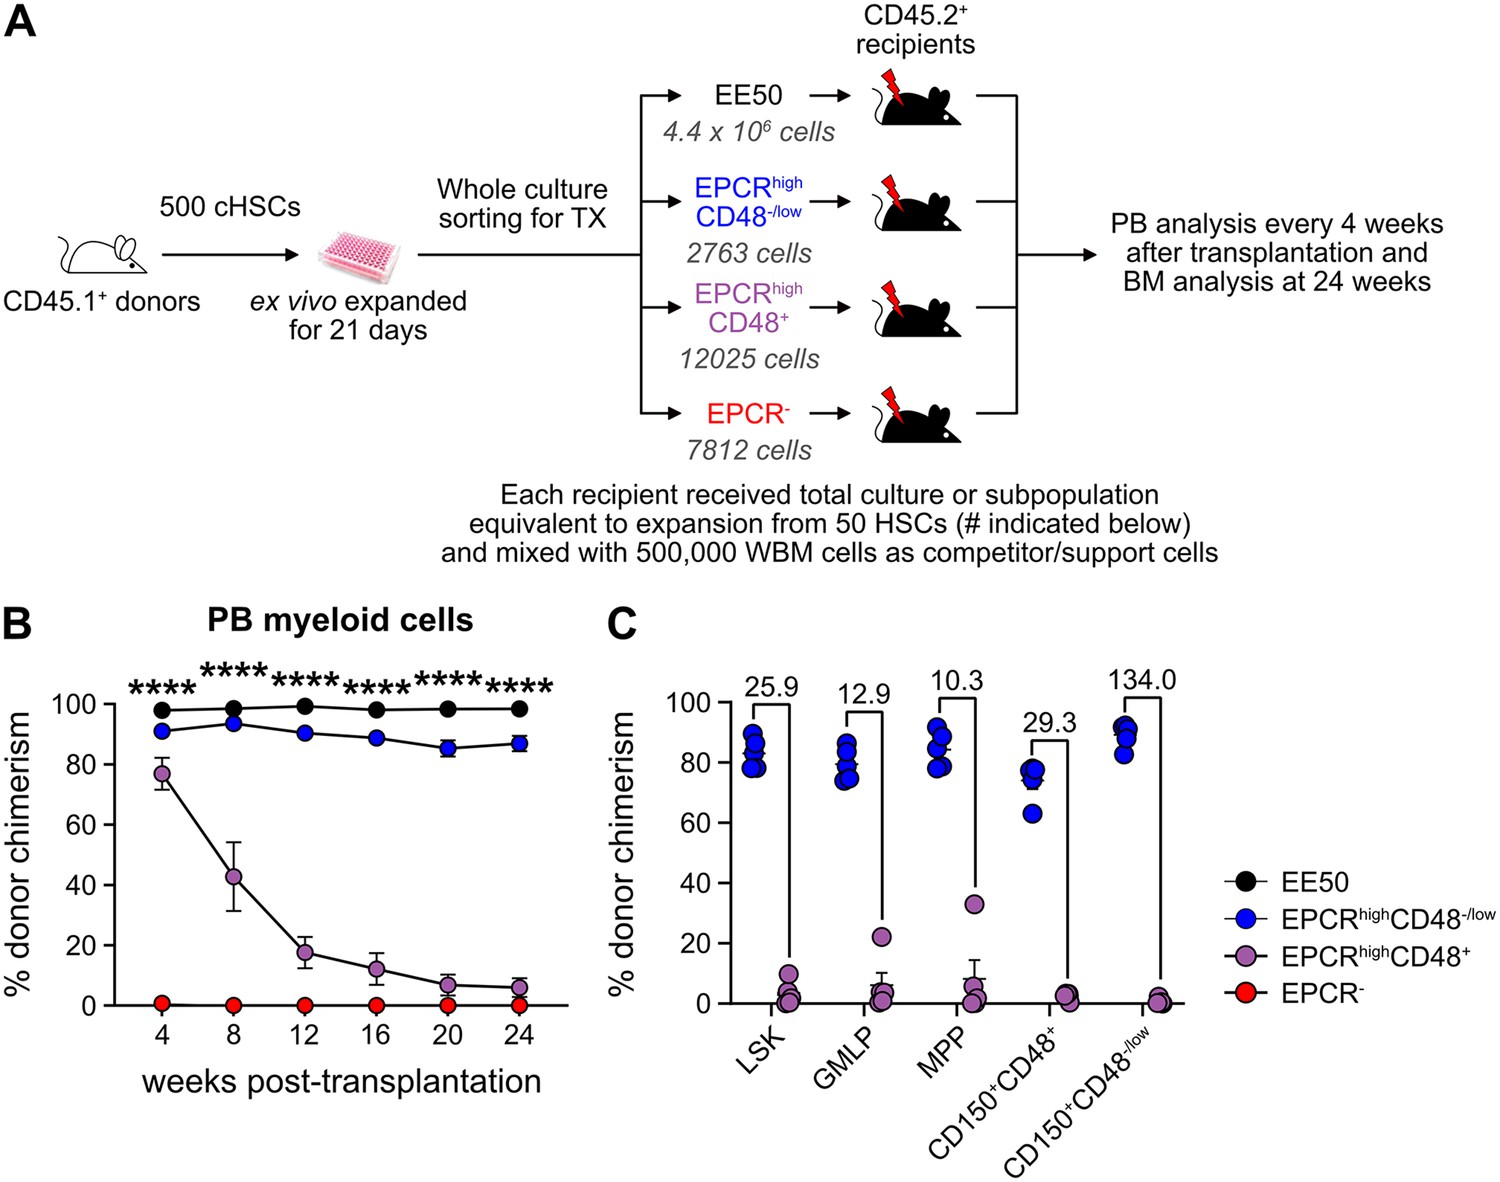
Hematopoietic stem cell (HSC) activity can be prospectively isolated from candidate HSC (cHSC) cultures and associates to a minor EPCR+ SLAM LSK fraction.
(A) Strategy to assess the in vivo HSC activity of subfractions from ex vivo cultures. (B) Test cell-derived chimerism in peripheral blood (PB) myeloid lineages over 24 weeks post-transplantation. Data represent mean values ± SEM (n=5 per group). A one-way ANOVA test was applied, with the asterisks indicating significant differences among the four groups. ****, p<0.0001. (C) Test cell-derived chimerism in bone marrow (BM) progenitor subsets 24 weeks post-transplantation (n=5 per group). Numbers indicate fold differences between the EPCR+ CD48-/low and EPCR+CD48+ fractions, and data points depict chimerism levels in individual recipients.
-
Figure 3—source data 1
Raw data for Figure 3B: Donor chimerism in peripheral blood (PB) myeloid cells over 24 weeks post-transplantation.
- https://cdn.elifesciences.org/articles/91826/elife-91826-fig3-data1-v1.xlsx
-
Figure 3—source data 2
Raw data for Figure 3C: Donor chimerism in bone marrow (BM) progenitors 24 weeks post-transplantation.
- https://cdn.elifesciences.org/articles/91826/elife-91826-fig3-data2-v1.xlsx
Figure 3—figure supplement 1
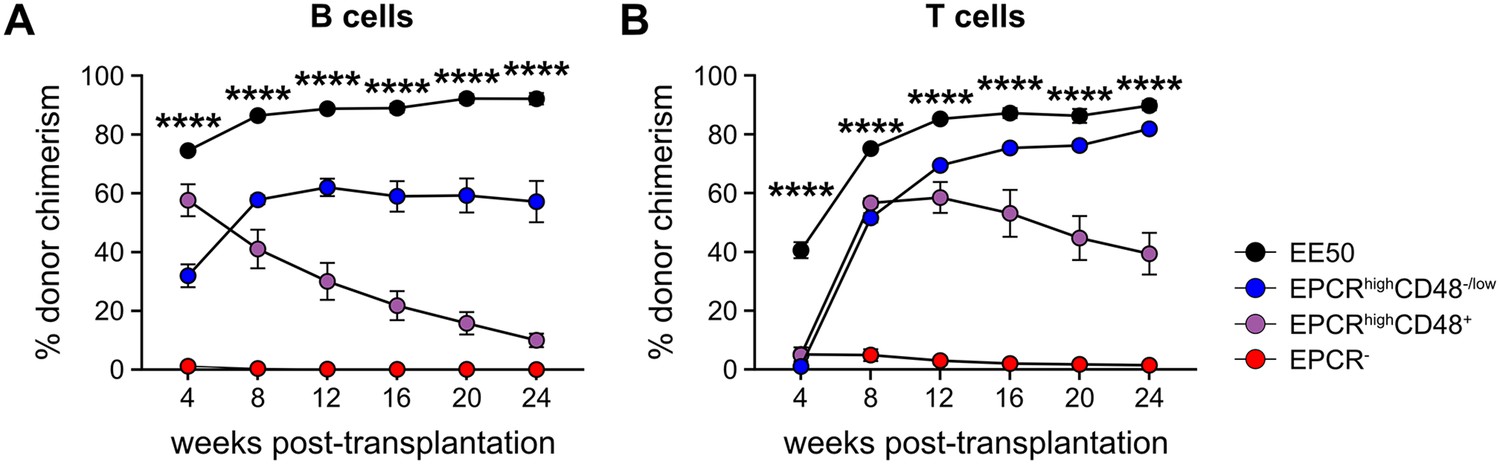
B and T cell chimerism in peripheral blood (PB) after transplantation.
(A) Test cell-derived chimerism in PB B cells over 24 weeks post-transplantation (n=5 per group). (B) Test cell-derived chimerism in PB T cells over 24 weeks post-transplantation. Data represent mean values (n=5 per group). Error bars denote SEM. A one-way ANOVA test was applied, with the asterisks indicating significant differences among the four groups. ****, p<0.0001.
-
Figure 3—figure supplement 1—source data 1
Raw data for Figure 3—figure supplement 1A: Donor chimerism in peripheral blood (PB) B cells over 24 weeks post-transplantation.
- https://cdn.elifesciences.org/articles/91826/elife-91826-fig3-figsupp1-data1-v1.xlsx
-
Figure 3—figure supplement 1—source data 2
Raw data for Figure 3—figure supplement 1B: Donor chimerism in peripheral blood (PB) T cells over 24 weeks post-transplantation.
- https://cdn.elifesciences.org/articles/91826/elife-91826-fig3-figsupp1-data2-v1.xlsx
Figure 4 with 1 supplement
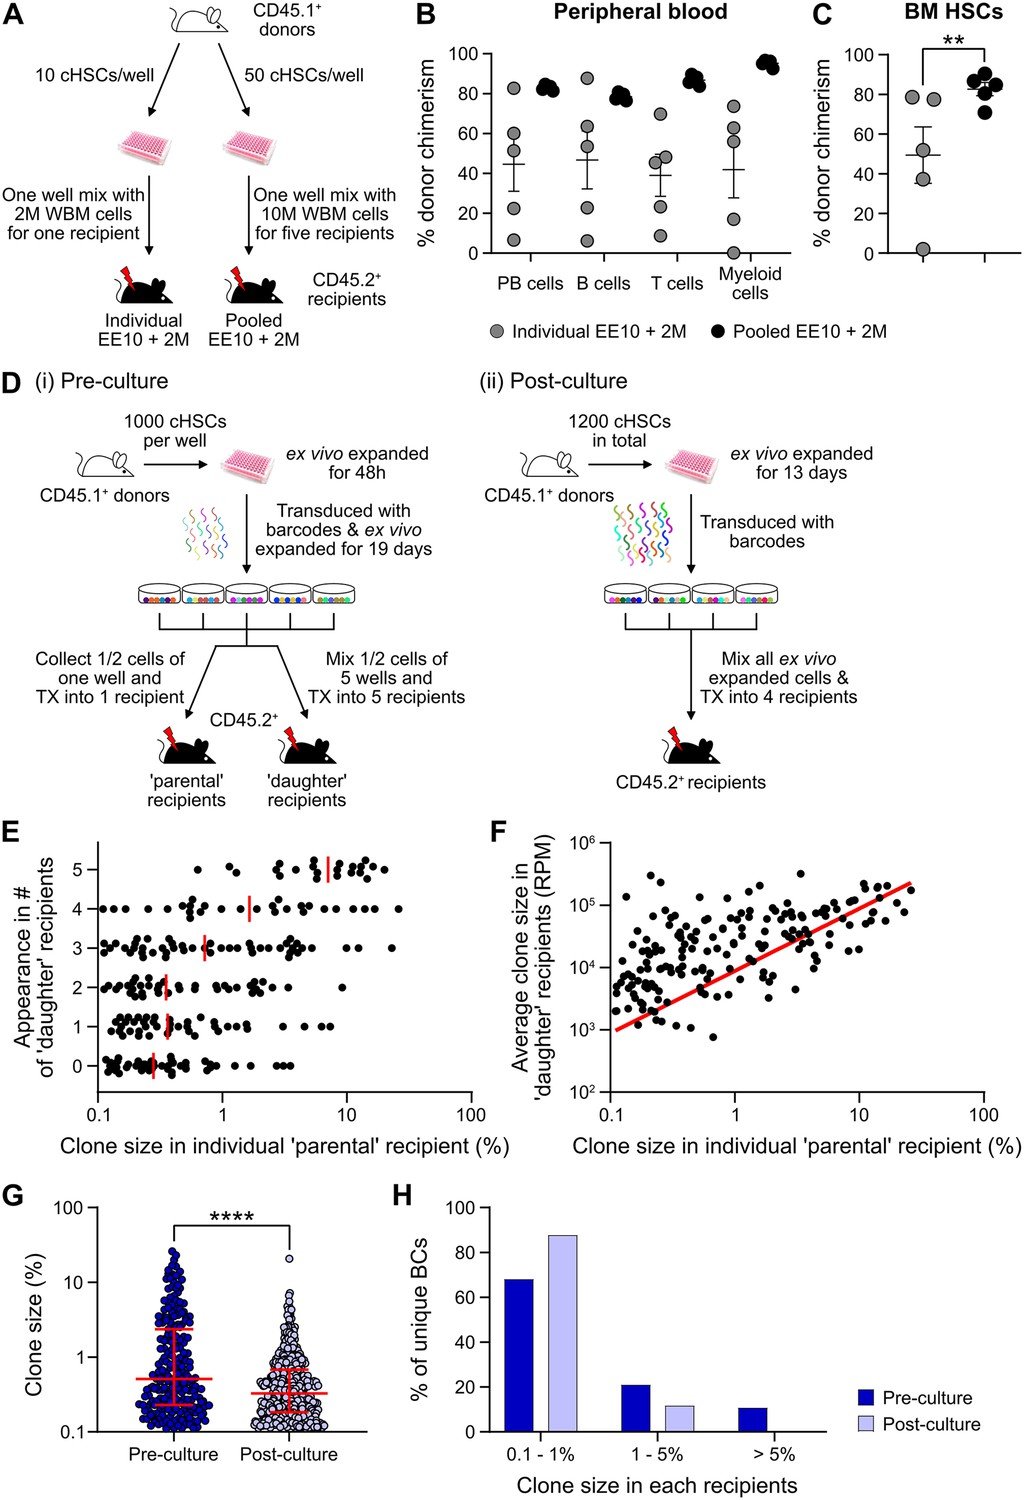
Quantification of repopulating activity from expanded candidate hematopoietic stem cells (cHSCs).
(A) Competitive transplantation strategies used to assess the repopulation of ex vivo expanded cHSCs. (B) Test cell-derived peripheral blood (PB) reconstitution 16 weeks post-transplantation (n=5 per group). Symbols denote individual mice and means ± SEM. (C) Bone marrow (BM) cHSCs chimerism 16 weeks post-transplantation (n=5 per group). Symbols denote individual mice, and means ± SEM. (D) Barcode approaches used to assess the clonal HSC contribution of ex vivo expanded HSCs before (i) or after (ii) ex vivo expansion. (E) Clone sizes of unique barcodes in ‘parental’ recipients and their appearance in ‘daughter’ recipients, demonstrating extensive variation in expansion capacity among individual HSCs. Red lines indicate the median clone size in ‘parental’ recipients. (F) Clone sizes of unique barcodes detected in BM myeloid cells of ‘parental’ recipients and their corresponding contribution in ‘daughter’ recipients. The red line denotes the correlation/linear regression. (G) Clone sizes in ‘parental’ recipients transplanted with ‘pre-culture’ barcoded cells, or in recipients of ‘post-culture’ barcoded cells. Median clone sizes are shown with interquartile ranges. (H) Frequency of barcodes and their clone sizes in recipients of pre- or post-cultured barcoded HSCs. BCs, barcodes. All data points depict values in individual recipients or barcodes. Asterisks indicate significant differences. *, p<0.05; ****, p<0.0001.
-
Figure 4—source data 1
Raw data for Figure 4B: Donor chimerism in peripheral blood (PB) lineages 16 weeks post-transplantation.
- https://cdn.elifesciences.org/articles/91826/elife-91826-fig4-data1-v1.xlsx
-
Figure 4—source data 2
Raw data for Figure 4C: Donor chimerism in bone marrow (BM) hematopoietic stem cells (HSCs) 16 weeks post-transplantation.
- https://cdn.elifesciences.org/articles/91826/elife-91826-fig4-data2-v1.xlsx
-
Figure 4—source data 3
Raw data for Figure 4E: Clone sizes of unique barcodes in ‘parental’ recipients and their appearance in ‘daughter’ recipients.
- https://cdn.elifesciences.org/articles/91826/elife-91826-fig4-data3-v1.xlsx
-
Figure 4—source data 4
Raw data for Figure 4F: Clone sizes of unique barcodes detected in bone marrow (BM) myeloid cells of ‘parental’ recipients and their corresponding contribution in ‘daughter’ recipients.
- https://cdn.elifesciences.org/articles/91826/elife-91826-fig4-data4-v1.xlsx
-
Figure 4—source data 5
Raw data for Figure 4G: Clone size distribution of pre- and post-culture barcodes.
- https://cdn.elifesciences.org/articles/91826/elife-91826-fig4-data5-v1.xlsx
-
Figure 4—source data 6
Raw data for Figure 4H: Frequency distribution of pre- and post-culture barcodes.
- https://cdn.elifesciences.org/articles/91826/elife-91826-fig4-data6-v1.xlsx
Figure 4—figure supplement 1
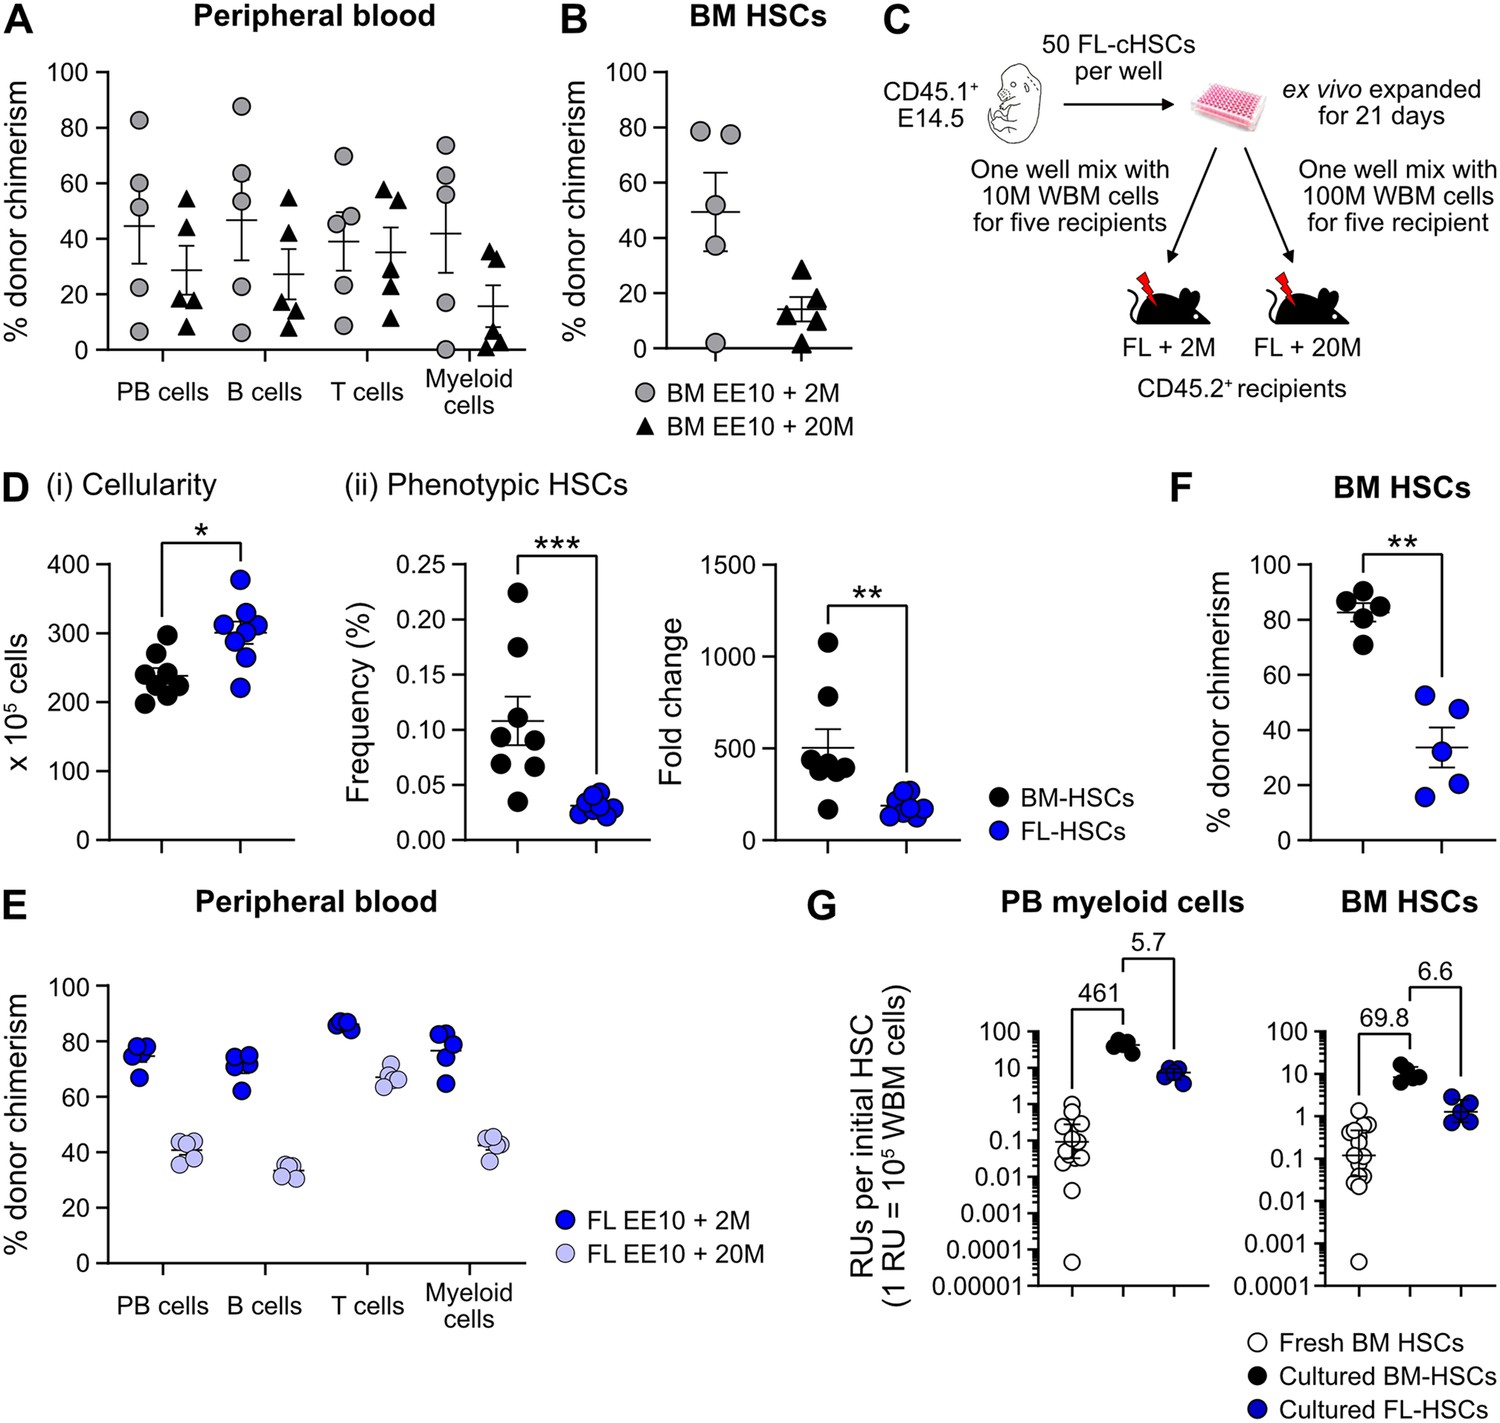
Quantification of hematopoietic stem cell (HSC) activity from cultured bone marrow (BM) or fetal liver (FL)-HSCs.
(A) Percentage of test cell-derived cells in peripheral blood (PB) to each of the assessed lineages 16 weeks post-transplantation (n=5 per group). Mice were transplanted with CD45.2+ EE10 BM-cHSCs together with 2 or 20 million CD45.1+ WBM cells. (B) Test cell-derived chimerism in BM-cHSCs 16 weeks post-transplantation (n=5 per group). Mice were transplanted with CD45.2+ EE10 BM-cHSCs together with 2 or 20 million CD45.1+ WBM cells. (C) Outline of the competitive transplantation strategy to assess the repopulation ability of ex vivo expanded FL-cHSCs. (D) Phenotypic analysis of ex vivo expanded BM-HSCs and FL-HSCs (n=8 per group). (i) Overall cell expansion from 50 BM- or FL-EPCRhigh SLAM LSKs after 21 days of ex vivo culture. (ii) Frequency and fold change of phenotypic cHSCs (EPCRhigh SLAM LSKs) in ex vivo cultures after 21 days of culture from BM- or FL-cHSCs. (E) Test cell-derived chimerism in PB myeloid cells 16 weeks post-transplantation (n=5 per group). (F) Test-derived HSCs chimerism in the BM of the recipients received ex vivo expanded cells from BM- or FL-cHSCs 16 weeks post transplantation (n=5 per group). (G) Repopulating units (RUs) equivalent to one initial cHSC within PB myeloid cells and BM-cHSCs in the recipients of 50 BM-cHSCs (n=15) or ex vivo expanded cells from 10 BM- (n=5) or FL-cHSCs (n=5) 16 weeks post-transplantation. Fold changes of EE10 BM-cHSCs versus 50 fresh BM-cHSCs or EE10 FL-cHSCs are indicated. Median values are shown with interquartile ranges. All data points depict values in individual recipients or culture wells. Error bars denote SEM. The asterisks indicate significant differences. *, p<0.05; **, p<0.01; ***, p<0.001.
-
Figure 4—figure supplement 1—source data 1
Raw data for Figure 4—figure supplement 1A: Donor chimerism in peripheral blood (PB) lineages 16 weeks post-transplantation.
- https://cdn.elifesciences.org/articles/91826/elife-91826-fig4-figsupp1-data1-v1.xlsx
-
Figure 4—figure supplement 1—source data 2
Raw data for Figure 4—figure supplement 1B: Donor chimerism in bone marrow (BM) hematopoietic stem cells (HSCs) 16 weeks post-transplantation.
- https://cdn.elifesciences.org/articles/91826/elife-91826-fig4-figsupp1-data2-v1.xlsx
-
Figure 4—figure supplement 1—source data 3
Raw data for Figure 4—figure supplement 1D: Whole culture cellularity and frequency and fold change of phenotypic candidate hematopoietic stem cells (cHSCs) expanded ex vivo from bone marrow (BM)- or fetal liver (FL)-HSCs.
- https://cdn.elifesciences.org/articles/91826/elife-91826-fig4-figsupp1-data3-v1.xlsx
-
Figure 4—figure supplement 1—source data 4
Raw data for Figure 4—figure supplement 1E: Donor chimerism in peripheral blood (PB) lineages 16 weeks post-transplantation.
- https://cdn.elifesciences.org/articles/91826/elife-91826-fig4-figsupp1-data4-v1.xlsx
-
Figure 4—figure supplement 1—source data 5
Raw data for Figure 4—figure supplement 1F: Donor chimerism in bone marrow (BM) hematopoietic stem cells (HSCs) 16 weeks post-transplantation.
- https://cdn.elifesciences.org/articles/91826/elife-91826-fig4-figsupp1-data5-v1.xlsx
-
Figure 4—figure supplement 1—source data 6
Raw data for Figure 4—figure supplement 1G: Repopulating units (RUs) per initial hematopoietic stem cells (HSCs) in peripheral blood (PB) myeloid cells and bone marrow (BM) HSCs.
- https://cdn.elifesciences.org/articles/91826/elife-91826-fig4-figsupp1-data6-v1.xlsx
Figure 5 with 1 supplement
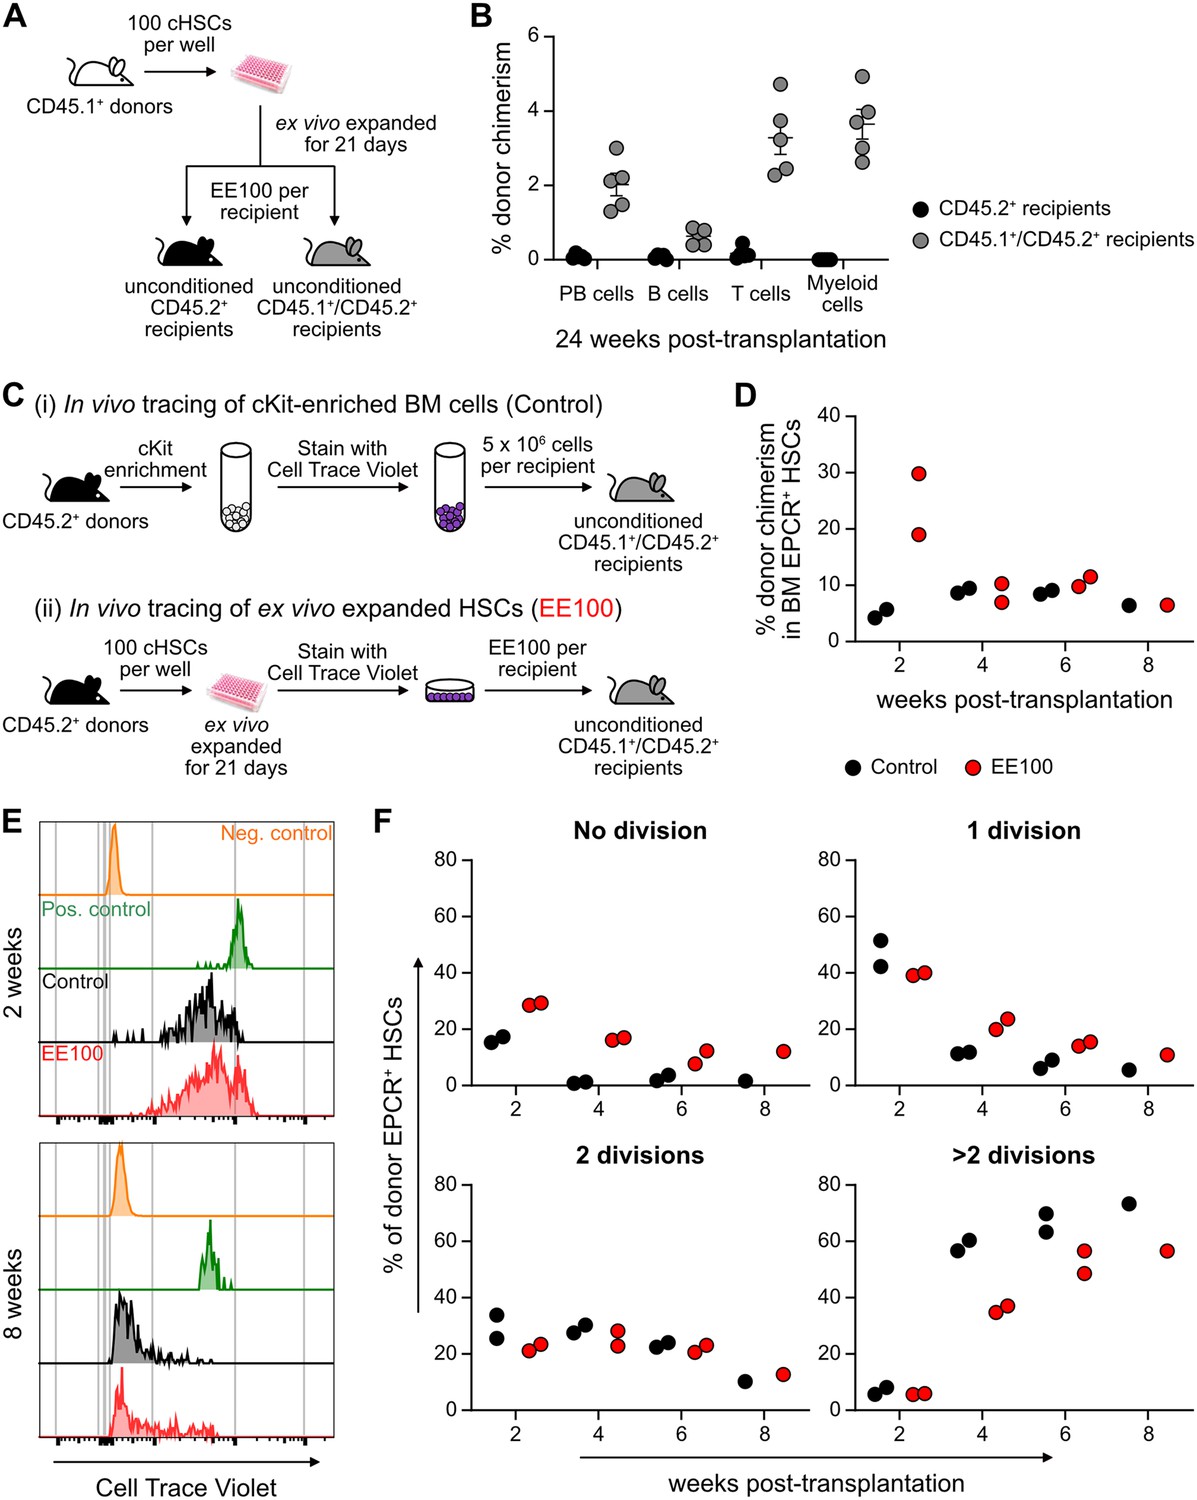
Cultured candidate hematopoietic stem cells (cHSCs) allow for transplantation into non-conditioned syngeneic recipients.
(A) Strategy to assess the ability of ex vivo expanded cHSCs to engraft unconditioned recipients. (B) Test cell-derived peripheral blood (PB) reconstitution 24 weeks post-transplantation (n=5 per group). Symbols denote individual mice and means ± SEM. (C) Strategy used to assess the in vivo proliferation of ex vivo expanded cHSCs. (D) Bone marrow (BM) cHSC chimerism 2–8 weeks post-transplantation. n=2 per group for 2, 4 or 6 weeks post-transplantation. n=1 per group for 8 weeks post-transplantation. (E) Representative CellTrace Violet (CTV) label profiles of donor EPCR+ cHSCs compared to negative control signal (host EPCR+ cHSCs) and positive signal (donor CD4+ spleen cells) at 2 or 8 weeks post-transplantation. (F) Donor EPCR+ cHSCs were evaluated for the number of cell divisions they had undergone through 8 weeks post-transplantation. n=2 per group for 2, 4 or 6 weeks post-transplantation. n=1 per group for 8 weeks post-transplantation. All data points depict values in individual recipients.
-
Figure 5—source data 1
Raw data for Figure 5B: Donor chimerism in peripheral blood (PB) lineages 24 weeks post-transplantation.
- https://cdn.elifesciences.org/articles/91826/elife-91826-fig5-data1-v1.xlsx
-
Figure 5—source data 2
Raw data for Figure 5D: Donor chimerism in bone marrow (BM) EPCR+ hematopoietic stem cells (HSCs) over 8 weeks post-transplantation.
- https://cdn.elifesciences.org/articles/91826/elife-91826-fig5-data2-v1.xlsx
-
Figure 5—source data 3
Raw data for Figure 5F: Cell divisions of donor bone marrow (BM) EPCR+ hematopoietic stem cells (HSCs).
- https://cdn.elifesciences.org/articles/91826/elife-91826-fig5-data3-v1.xlsx
Figure 5—figure supplement 1
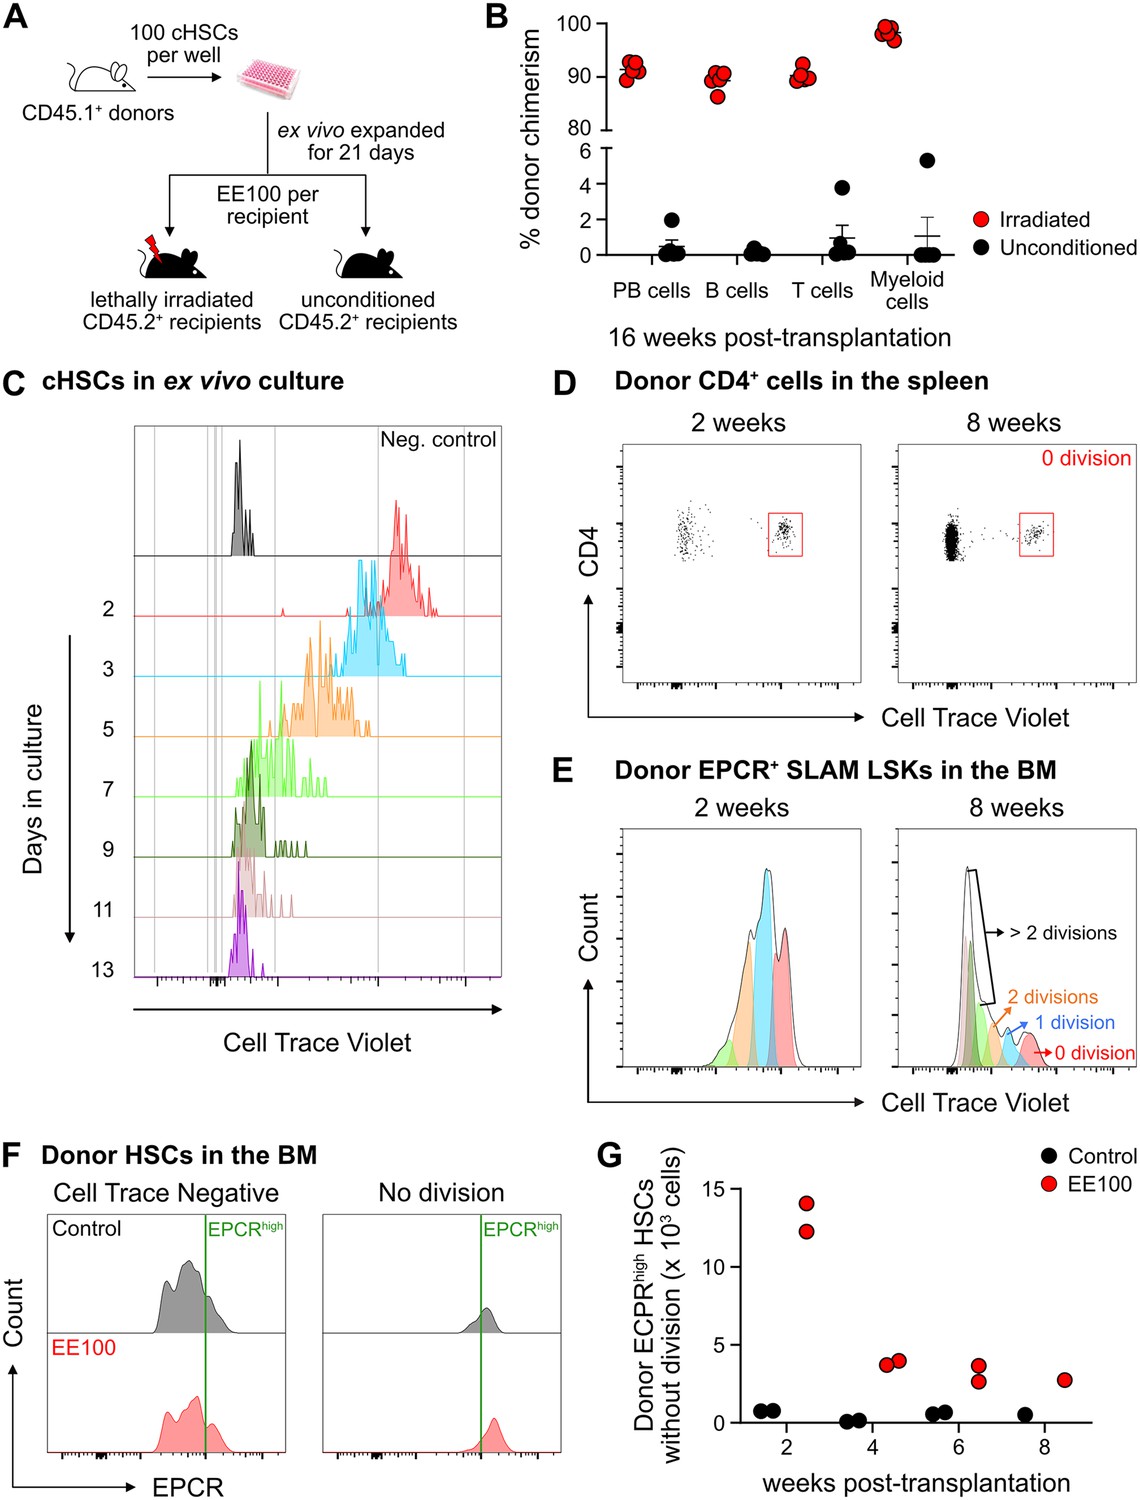
The fate of ex vivo cultured candidate hematopoietic stem cells (cHSCs) following transplantation into unconditioned hosts.
(A) Strategy to assess the repopulation of ex vivo expanded cHSCs into lethally irradiated or unconditioned recipients. (B) Test cell-derived peripheral blood (PB) reconstitution 16 weeks post-transplantation (n=5 per group). All data points depict values in individual recipients. Error bars denote SEM. (C) CellTrace Violet (CTV) signal from cHSCs in ex vivo cultures. The cultures were initiated with 100,000 CTV-labeled cKit-enriched cells per well (n=5). Unstained cKit-enriched cultures were used as negative control. CTV signal was traced by analyzing half of the expanded cells after each split until 13 days after culture. (D) CTV signal from transplanted CD4+ spleen cells, used to define undivided cells. (E) Investigation of cell divisions based on CTV signals. (F) Correlation of endothelial protein C receptor (EPCR) expression levels and the proliferative activity of cHSCs. (G) Number of undivided donor EPCRhigh HSCs. n=2 per group for 2, 4 or 6 weeks post-transplantation. n=1 per group for 8 weeks post-transplantation. All data points depict values in individual recipients.
-
Figure 5—figure supplement 1—source data 1
Raw data for Figure 5—figure supplement 1B: Donor chimerism in peripheral blood (PB) lineages 16 weeks post-transplantation.
- https://cdn.elifesciences.org/articles/91826/elife-91826-fig5-figsupp1-data1-v1.xlsx
-
Figure 5—figure supplement 1—source data 2
Raw data for Figure 5—figure supplement 1G Number of undivided donor EPCRhigh hematopoietic stem cells (HSCs) without division.
- https://cdn.elifesciences.org/articles/91826/elife-91826-fig5-figsupp1-data2-v1.xlsx
Author response image 1
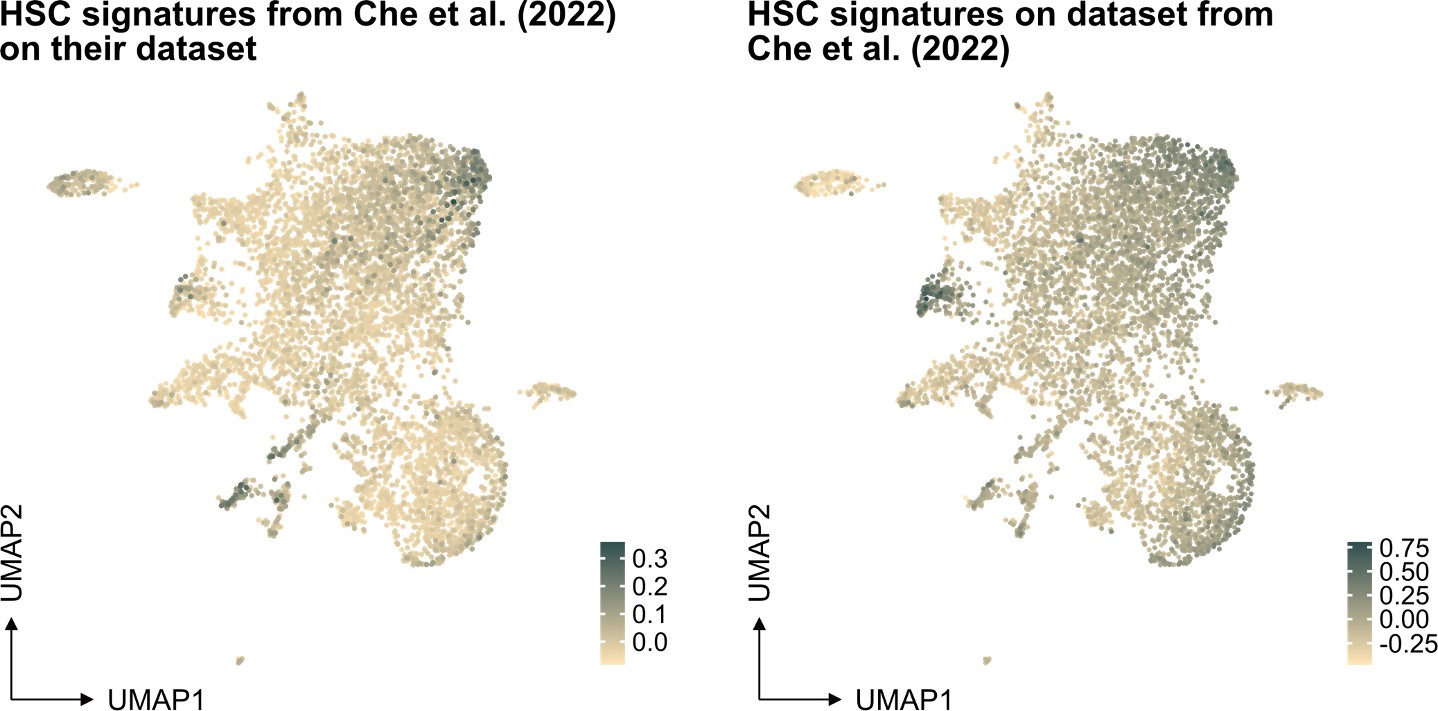
Projection of "our" HSC signature on scRNAseq data from independent work.
Author response image 2
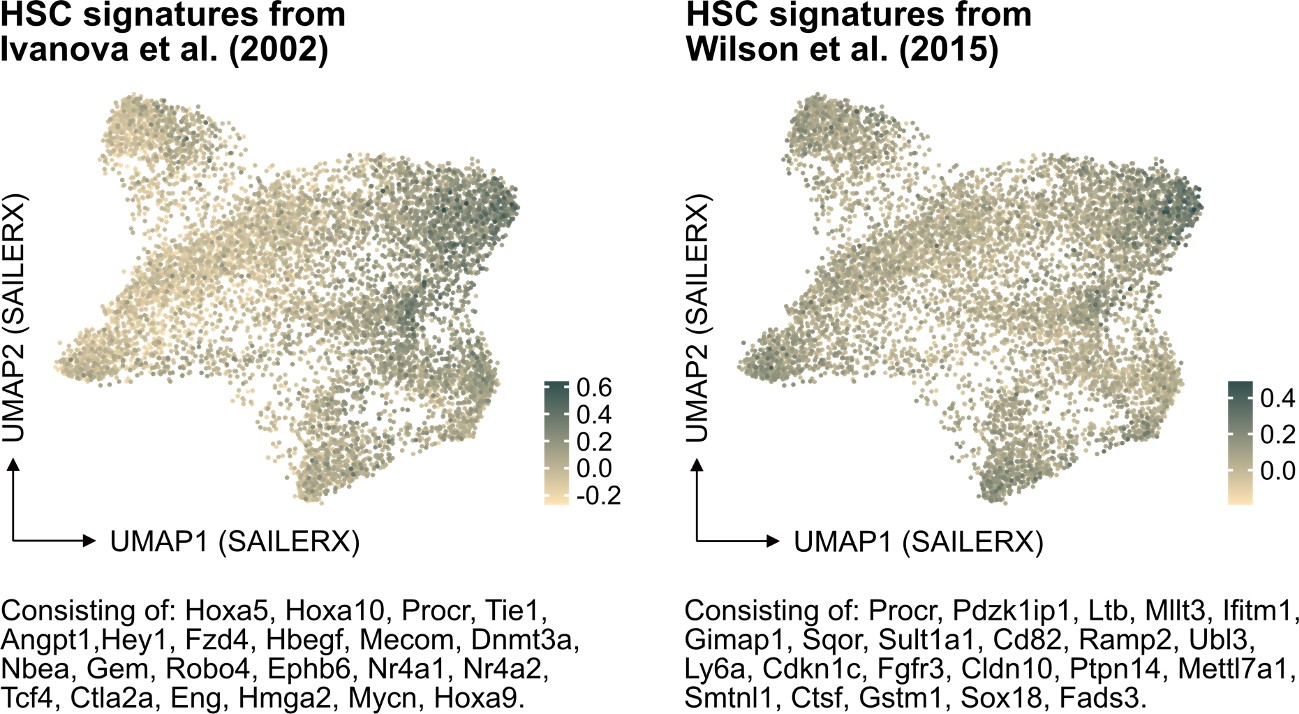
Projection of alternative HSC signatures onto the SAILERX UMAP.
Author response image 3
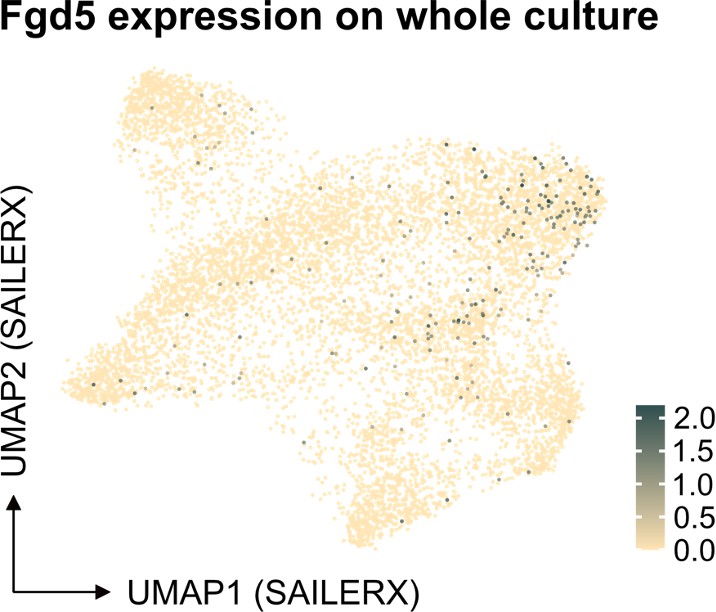
Feature plot depicting Fgd5 expression in the SAILERX UMAP.
Author response image 4
Serial transplantation behavior of ex vivo expanded HSCs.
5 million whole BM cells from primary transplantation were transplanted together with 5 million competitor whole BM cells. The control group was transplanted with 100 cHSCs freshly isolated from BM for the primary transplantation. Mann-Whitney test was applied and the asterisks indicate significant differences. *, p < 0.05; **, p < 0.01; ****, p < 0.0001. Error bars denote SEM.
Author response image 5
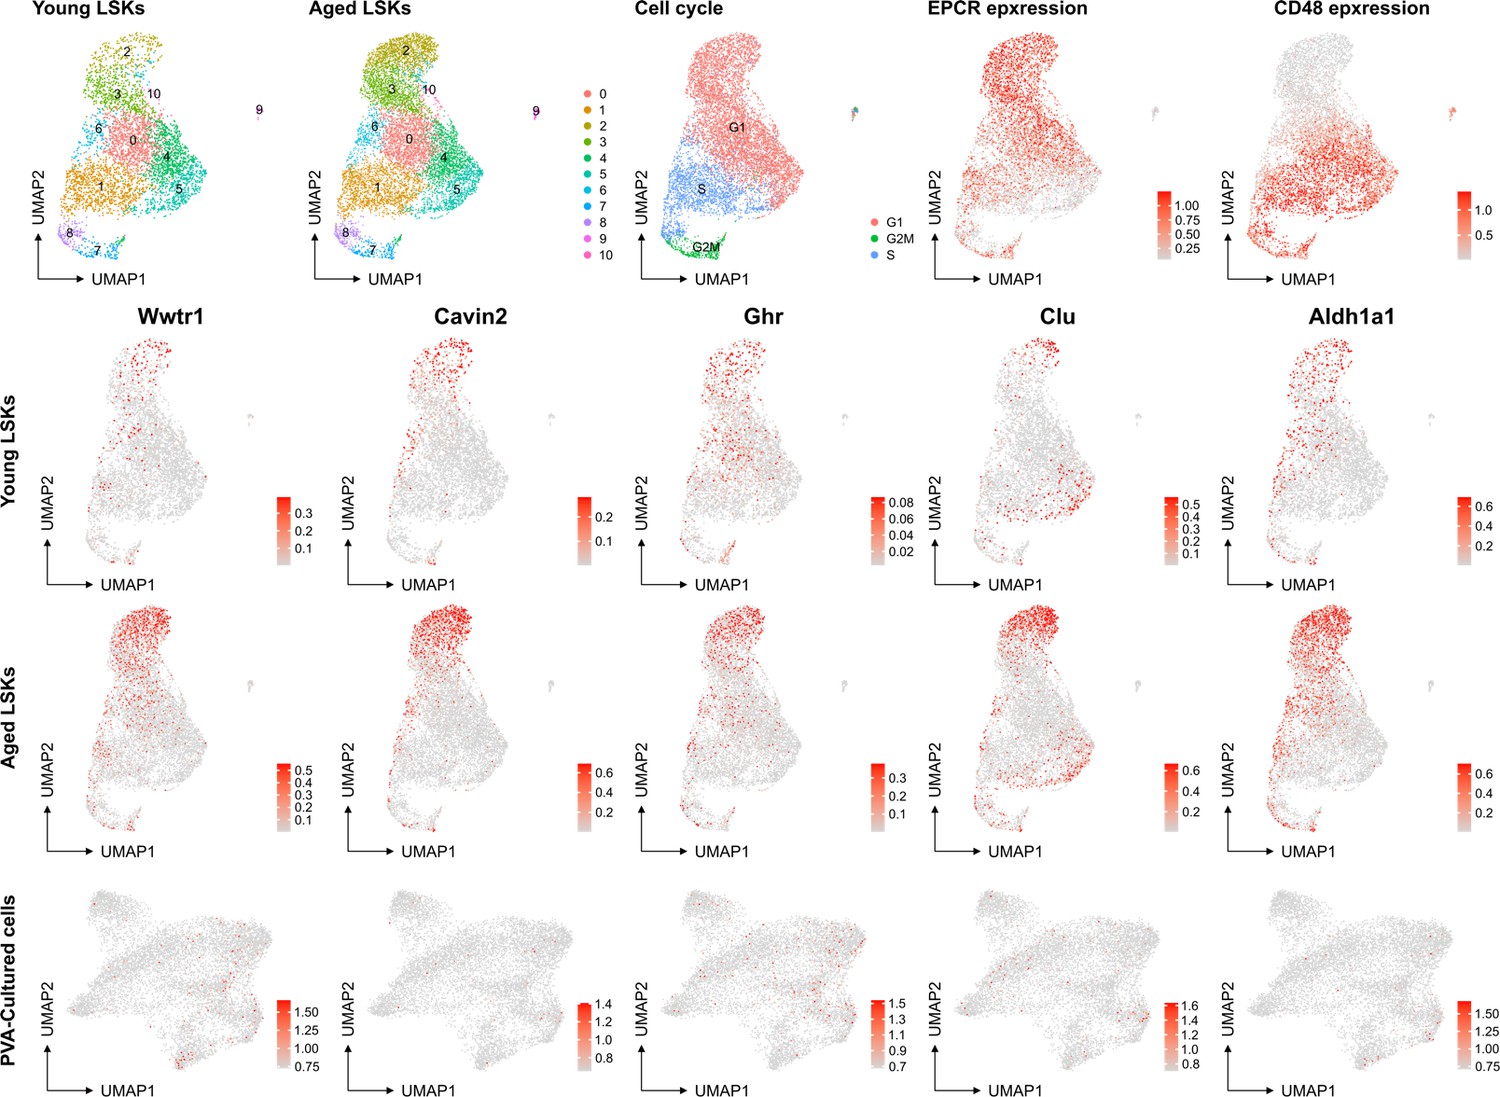
No evident signs of "molecular aging" following ex vivo expansion of HSCs.
Young and aged scRNAseq data from PMID: 36581635 were integrated and explored from the perspective of known genes associating to HSC aging. The top row depicts contribution to UMAPs from young and aged cells (two left plots), cell cycle scores of the cells, and the expression of EPCR and CD48 as examples markers for primitive and more differentiated cells, respectively. The expression of the HSC aging-associated genes Wwtr1, Cavin2, Ghr, Clu and Aldh1a1 was then assessed in the data as well as in the SAILERX UMAP of cultured HSCs (bottom row).
Author response image 6
Author response image 7
Tables
Table 1
Repopulating units (RUs) for each lineage in peripheral blood (PB) and for bone marrow (BM) candidate hematopoietic stem cells (cHSCs) of each recipient.
| Recipients | PB | B cells | T cells | Myeloid cells | BM-cHSCs | |
|---|---|---|---|---|---|---|
| Individual BM EE10+2M | #1 | 6 | 6 | 6 | 4 | 12 |
| #2 | 31 | 35 | 19 | 27 | 75 | |
| #3 | 21 | 23 | 17 | 35 | 70 | |
| #4 | 98 | 144 | 46 | 57 | 21 | |
| #5 | 1 | 1 | 2 | 0.03 | 0.4 | |
| Pooled BM EE10+2M | #1 | 101 | 78 | 173 | 583 | 49 |
| #2 | 110 | 84 | 120 | 516 | 82 | |
| #3 | 87 | 68 | 103 | 248 | 130 | |
| #4 | 101 | 70 | 149 | 384 | 187 | |
| #5 | 65 | 127 | 186 | 331 | 112 | |
-
1 RU equals to the average reconstitution activity of 1×10⁵ WBM cells.
Additional files
-
Supplementary file 1
Tables for (a) contents of murine hematopoietic stem cell (HSC) media for in vitro culture, (b–j) antibodies used in the study, and (k) primers used in the study.
- https://cdn.elifesciences.org/articles/91826/elife-91826-supp1-v1.docx
-
MDAR checklist
- https://cdn.elifesciences.org/articles/91826/elife-91826-mdarchecklist1-v1.docx
Download links
A two-part list of links to download the article, or parts of the article, in various formats.
Downloads (link to download the article as PDF)
Open citations (links to open the citations from this article in various online reference manager services)
Cite this article (links to download the citations from this article in formats compatible with various reference manager tools)
Ex vivo expansion potential of murine hematopoietic stem cells is a rare property only partially predicted by phenotype
eLife 12:RP91826.
https://doi.org/10.7554/eLife.91826.3


