Caveolin-1 protects endothelial cells from extensive expansion of transcellular tunnel by stiffening the plasma membrane
- Institut Pasteur, Université Paris Cité, CNRS UMR6047, Inserm U1306, Unité des Toxines Bactériennes, Département de Microbiologie, France
- Sorbonne Université, INSERM UMR974, Institut de Myologie, Centre de Recherche en Myologie, France
- Institut Curie, PSL Research University, CNRS UMR168, Physics of Cells and Cancer Laboratory, France
- Institut Pasteur, Université Paris Cité, Bioinformatics and Biostatistics Hub, France
- Institut Pasteur, Université Paris Cité, G5 Infectious Diseases Epidemiology and Analytics, France
- Institut Curie and Institut Pierre Gilles de Gennes, PSL Research University, Sorbonne University, France
- Institut Pasteur, Université Paris Cité, Photonic Bio-Imaging, Centre de Ressources et Recherches Technologiques (UTechS-PBI, C2RT), France
- Institut Pasteur, Université Paris Cité, Image Analysis Hub, France
- Benaroya Research Institute at Virginia Mason, Department of Immunology, United States
- Centre National de Référence des Staphylocoques, Hospices Civiles de Lyon, France
- CIRI, Centre International de Recherche en Infectiologie, Université de Lyon, Inserm U1111, Université Claude Bernard Lyon 1, CNRS UMR5308, ENS de Lyon, Lyon, France, France
- Institut Curie, PSL Research University, INSERM U1143, CNRS UMR3666, Membrane Mechanics and Dynamics of Intracellular Signaling Laboratory, France
- Université de Lorraine, LCP-A2MC, France
- Université Paris Cité, Institut Jacques Monod, CNRS UMR7592, France
Figures
Figure 1 with 3 supplements
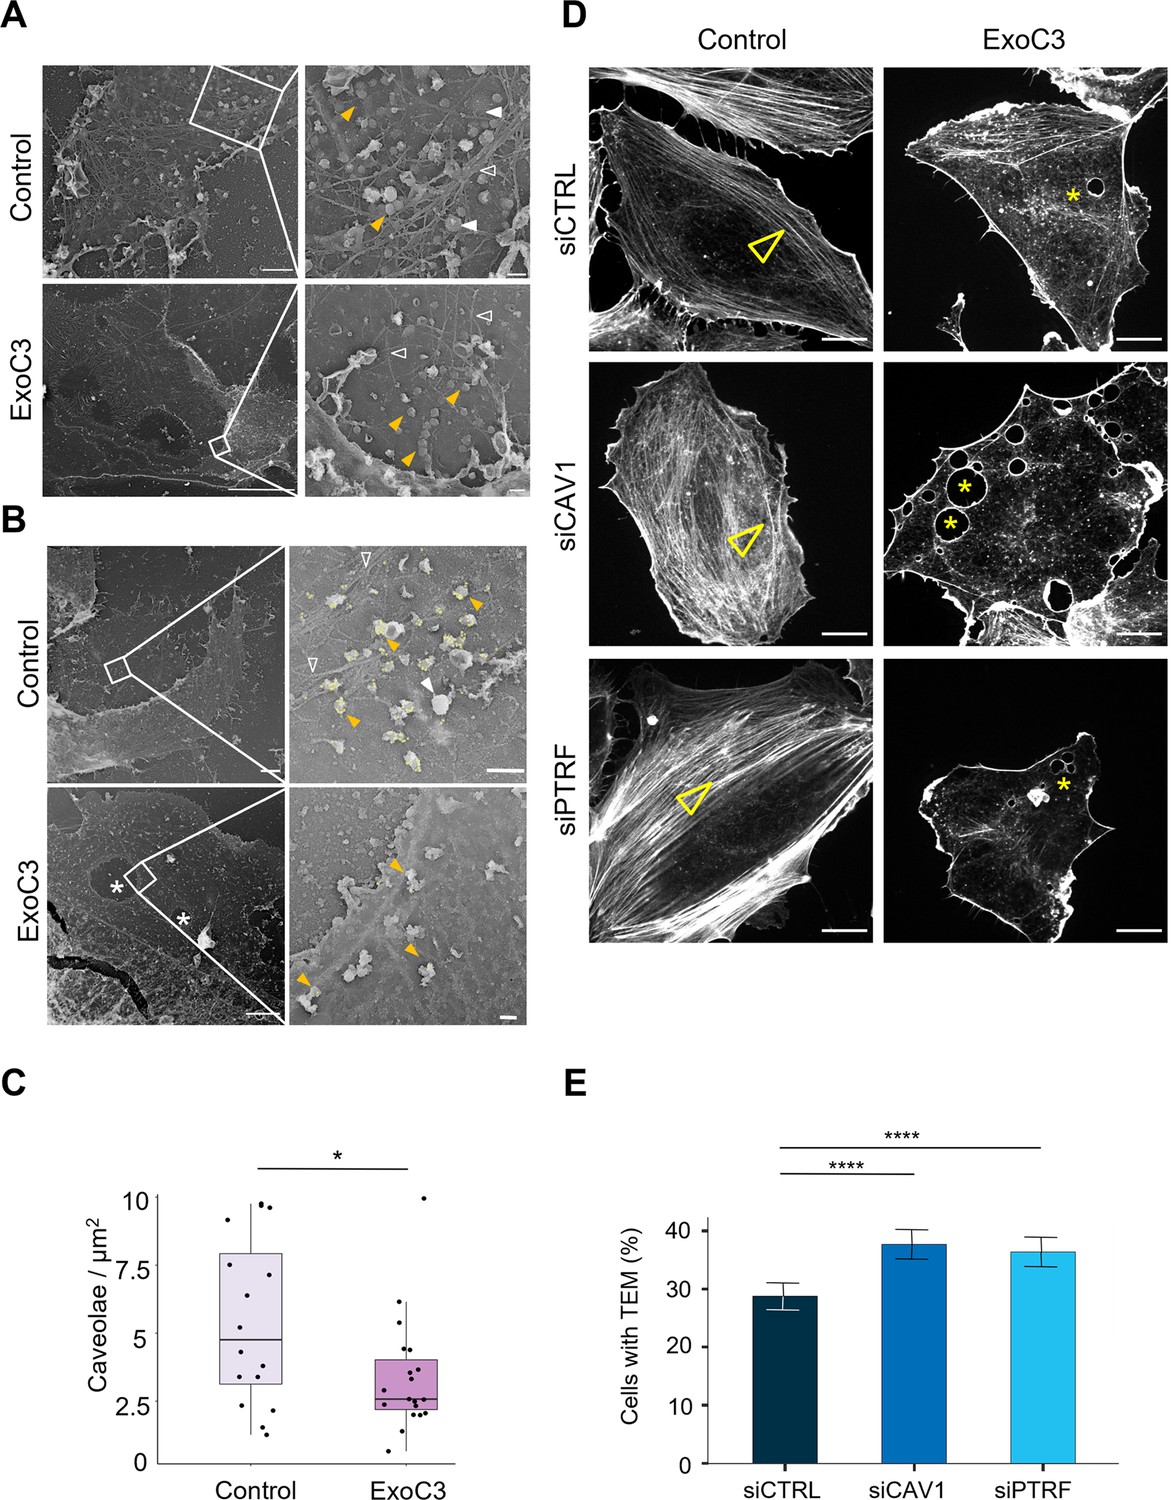
RhoA inhibition decreases the density of caveolae and actin stress fibers.
(A, B) Transmission electron micrographs show unroofed human umbilical vein endothelial cells (HUVECs) that were either left untreated (control) or treated with 100 μg/ml of ExoC3 (ExoC3) for 24 hr. Right panels show membrane areas at higher magnification with (i) invaginated caveolae (yellow arrowhead), (ii) clathrin-coated pits and patches (plain white arrowhead), (iii) actin filaments (empty white arrowhead), and (iv) transendothelial cell macroaperture (TEM) tunnels in ExoC3-treated cells (white star). Scale bars left panels: 1 µm for control and 5 µm for ExoC3 condition with 200 nm higher magnifications on right panels. (B) Yellow dots show immunogold-labeled GFP-CAV1. (C) Boxplot shows the density of caveolae per µm2 of plasma determined on electron micrographs. Values analyzed with a mixed-effects linear model with random intercept and Tukey’s correction for pairwise comparison. *p=0.027 (n = 16 cells from three technical replicates). (D) Confocal spinning disk images show F-actin cytoskeleton of HUVECs left untreated (control) or treated with 100 μg/ml ExoC3 (ExoC3) overnight after 24 hr of transfection with siRNA control (siCTRL), targeting caveolin-1 (siCAV1) or cavin-1 (siPTRF). Cells were stained with phalloidin-TRITC. Arrowheads show stress fibers and stars show transcellular tunnels bounded by F-actin. Scale bars, 20 µm. (E) Histograms show the percentages of ExoC3-treated cells displaying at least one TEM (n = 1400 cells, eight independent experiments). Error bars show normal asymptotic 95% confidence intervals (CI). Data analysis with mixed-effect logistic regression model with correction for multiple comparisons using Tukey’s honestly significant difference (HSD) test. ****p<0.0001, for both siCTRL vs. siCAV1 and siCTRL vs. siPTRF conditions with no difference between siCAV1 and siPTRF conditions.
-
Figure 1—source data 1
Data for Figure 1C and E.
- https://cdn.elifesciences.org/articles/92078/elife-92078-fig1-data1-v1.xlsx
Figure 1—figure supplement 1
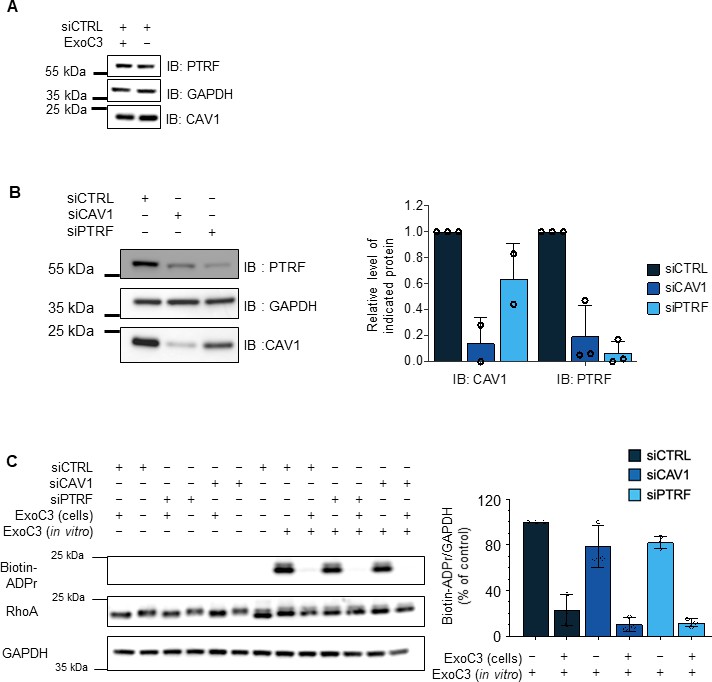
Controls of siRNAs and RhoA ADP-ribosylation efficacies.
(A) Immunoblots show caveolin-1 (IB: CAV1) and cavin-1/PTRF (IB: PTRF) in total cellular extracts of human umbilical vein endothelial cells (HUVECs) transfected with siCTRL and then treated for 24 hr with ExoC3. Immunoblot GAPDH (IB: GAPDH) was used as the loading control. Immunoblots are representative of three independent experiments. (B) Immunoblots of caveolin-1 (IB: CAV1) and cavin-1/PTRF (IB: PTRF) show the specific and cross-depletion effects of siCAV1 and siPTRF. Immunoblot anti-GAPDH antibody (IB: GAPDH) shows equal loading. The graph shows caveolin-1 and cavin-1/PTRF levels normalized to the level of GAPDH (three independent experiments). (C) Western blots show the fraction of ADP-ribosylated RhoA in cells that were resistant to a second round of in vitro ADP-ribosylation with biotin-NAD+. Western blot shows the fraction of ADP-ribosylated RhoA in vitro as detected with streptavidin–peroxidase (IB: Biotin-ADPr), that is, not modified during cell intoxication. Immunoblotting with an anti-RhoA antibody (IB: RhoA) revealed equal RhoA protein levels. Immunoblotting with an anti-GAPDH antibody revealed equal protein loading. Blots are representative of n = 3 independent experiments. The graph shows the mean values of the blot signal intensities ± SDs. from n = 3 independent experiments. Values correspond to the signal intensities of biotin-tagged ADP-ribosylated RhoA (Biotin-ADPr) normalized to those of RhoA and GAPDH IB signals. Values are expressed as a percentage compared with the intensity of the siCTRL-transfected untreated cells, which was set to 100%.
-
Figure 1—figure supplement 1—source data 1
Files with western blots.
- https://cdn.elifesciences.org/articles/92078/elife-92078-fig1-figsupp1-data1-v1.zip
-
Figure 1—figure supplement 1—source data 2
Data for western blot quantification in Figure 1—figure supplement 1B and C.
- https://cdn.elifesciences.org/articles/92078/elife-92078-fig1-figsupp1-data2-v1.xlsx
Figure 1—figure supplement 2
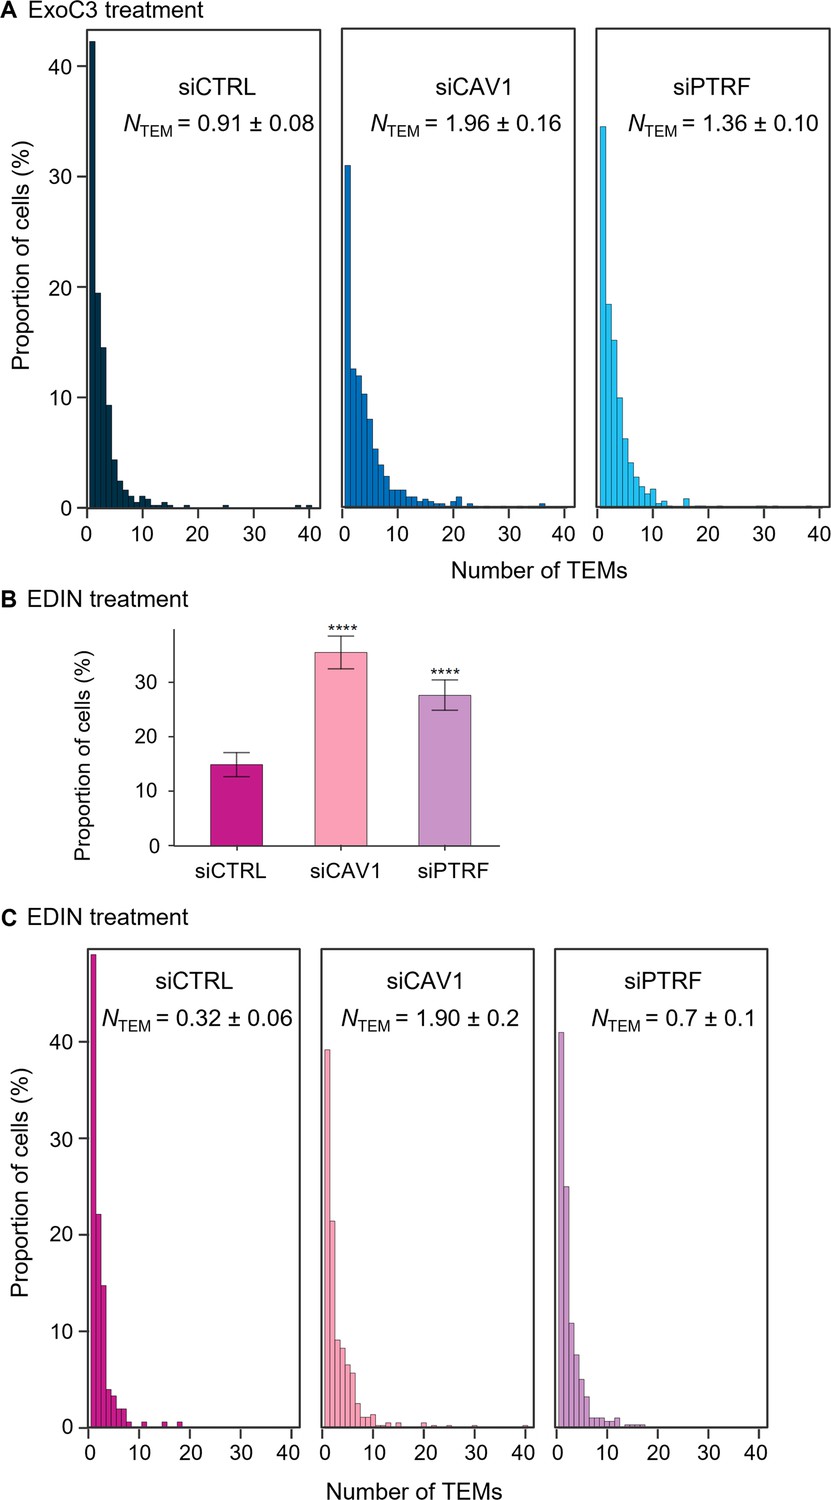
Caveolin-1 and cavin-1/PTRF depletion increases transendothelial cell macroaperture (TEM) formation in both ExoC3- and epidermal differentiation inhibitor (EDIN)-treated cells.
(A) The graph shows the distribution of human umbilical vein endothelial cells (HUVECs) between classes defined by TEM tunnel density ranging from a group of cells displaying only 1 TEM and those for which the density increased by a factor of 1 through those cells with 40 TEMs (y-axis). HUVECs were transfected with siCTRL, siCAV1, or siPTRF before treatment with ExoC3. The graph includes the geometric means (NTEM) of the density of TEMs per cell within the whole-cell population ± SD. Graph shows technical replicates pooled together. Statistical data analysis using a mixed-effect linear model, with random intercept showing significant differences between values of NTEM, ****p<0.0001. Data from n = 1400 cells per condition from seven independent experiments. (B) Histograms show the percentages of EDIN-treated cells with at least one TEM (n = 986 cells per condition from five independent experiments). Error bars show 95% confidence intervals (CIs). Data analysis with a logistic regression model adjusted for multiple comparisons using Tukey’s honestly significant difference (HSD) test, ****p<0.0001; the siCTRL vs. siCAV1 groups and the siCTRL vs. siPTRF groups. No difference was recorded between the siCAV1 and siPTRF groups. (C) The graph shows the distribution of HUVECs between classes as defined by TEM density with ranging from a group of cells displaying only 1 TEM and those for which the density increased by a factor of 1 through those cells with 40 TEMs (y-axis). HUVECs were transfected with siCTRL, siCAV1, or siPTRF before treatment with ExoC3. The graph includes values of the geometric means (NTEM) of the density of TEMs per cell within the whole-cell population ± SD. Statistical data analysis was based on a mixed linear model with a random intercept and fixed effects and revealed significant differences between NTEM values, ****p<0.0001 (n > 986 cells per condition from five independent experiments).
-
Figure 1—figure supplement 2—source data 1
Data for Figure 1—figure supplement 2A–C.
- https://cdn.elifesciences.org/articles/92078/elife-92078-fig1-figsupp2-data1-v1.xlsx
Figure 1—figure supplement 3
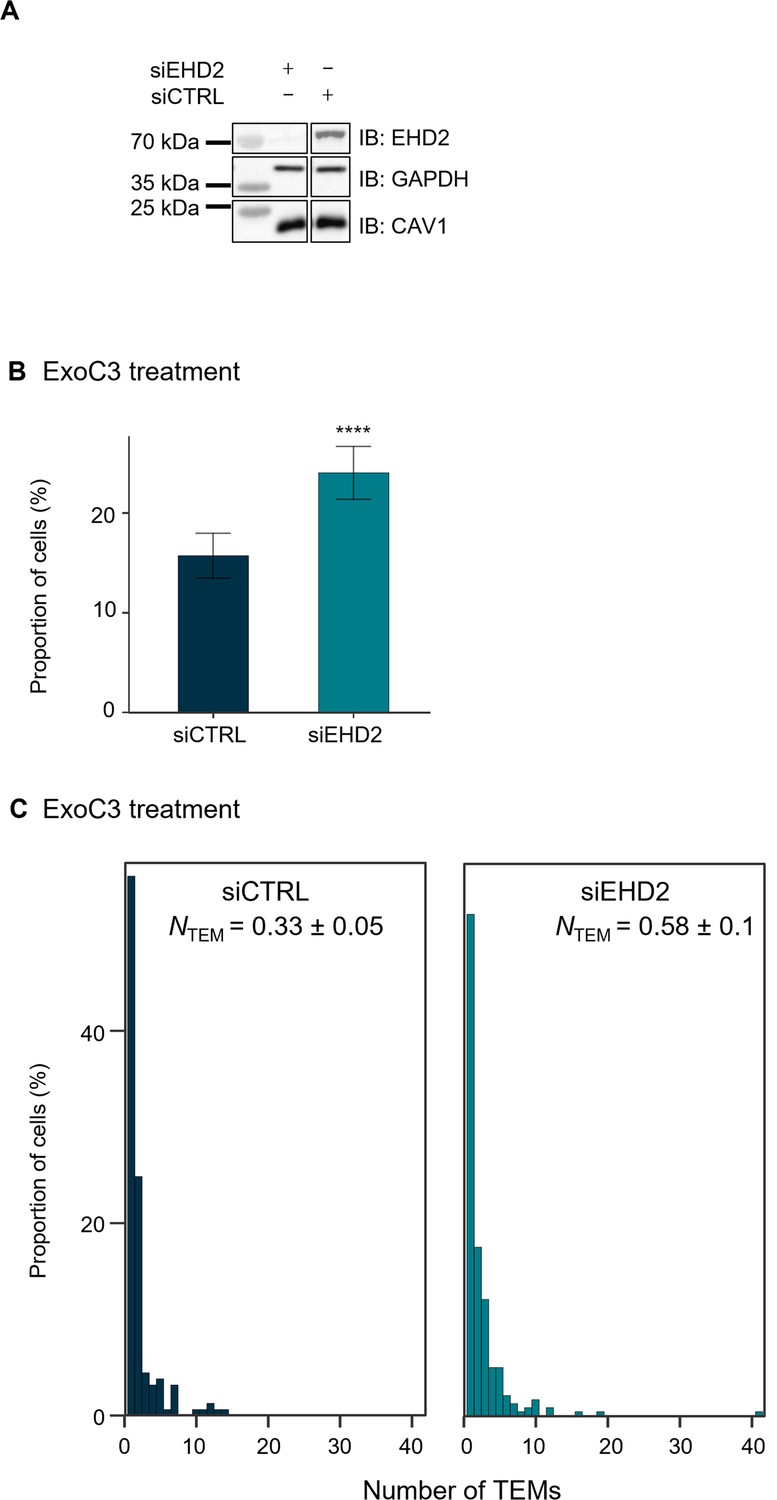
Depletion of the caveolar accessory component EHD2 increases transendothelial cell macroaperture (TEM) formation.
(A) Immunoblots show EHD2 cellular levels (IB: EHD2) in total cellular extracts of human umbilical vein endothelial cells (HUVECs) transfected with siCTRL or siEHD2 and then treated for 24 hr with ExoC3. Immunoblot GAPDH (IB: GAPDH) was used as the loading control. Immunoblots are representative of n = 3 independent experiments. (B) Histograms show the percentages of C3-treated cells displaying at least one TEM (n = 1000 cells per condition from five independent experiments). Error bars show 95% confidence intervals (CIs). Data analysis with a logistic regression model adjusted for multiple comparisons using Tukey’s honestly significant difference (HSD) test, ****p<0.0001 for the siCTRL vs. siEHD2 groups. (C) The graph shows the distribution of HUVECs between classes as defined by TEM density ranging from a group of cells displaying only 1 TEM and those for which the density increased by a factor of 1 through those cells with 40 TEMs/cell (y-axis). HUVECs were transfected with siCTRL or siEHD2 before treatment with ExoC3. The graph includes values of the geometric means (NTEM) of the density of TEMs per cell within the whole-cell population ± SD. Statistical data analysis was based on a mixed linear model with a random intercept and fixed effects and revealed significant differences between NTEM values, ****p<0.0001 (n = 1000 cells per condition from five independent experiments).
-
Figure 1—figure supplement 3—source data 1
Files with western blots.
- https://cdn.elifesciences.org/articles/92078/elife-92078-fig1-figsupp3-data1-v1.zip
-
Figure 1—figure supplement 3—source data 2
Data for Figure 1—figure supplement 3B and C.
- https://cdn.elifesciences.org/articles/92078/elife-92078-fig1-figsupp3-data2-v1.xlsx
Figure 2
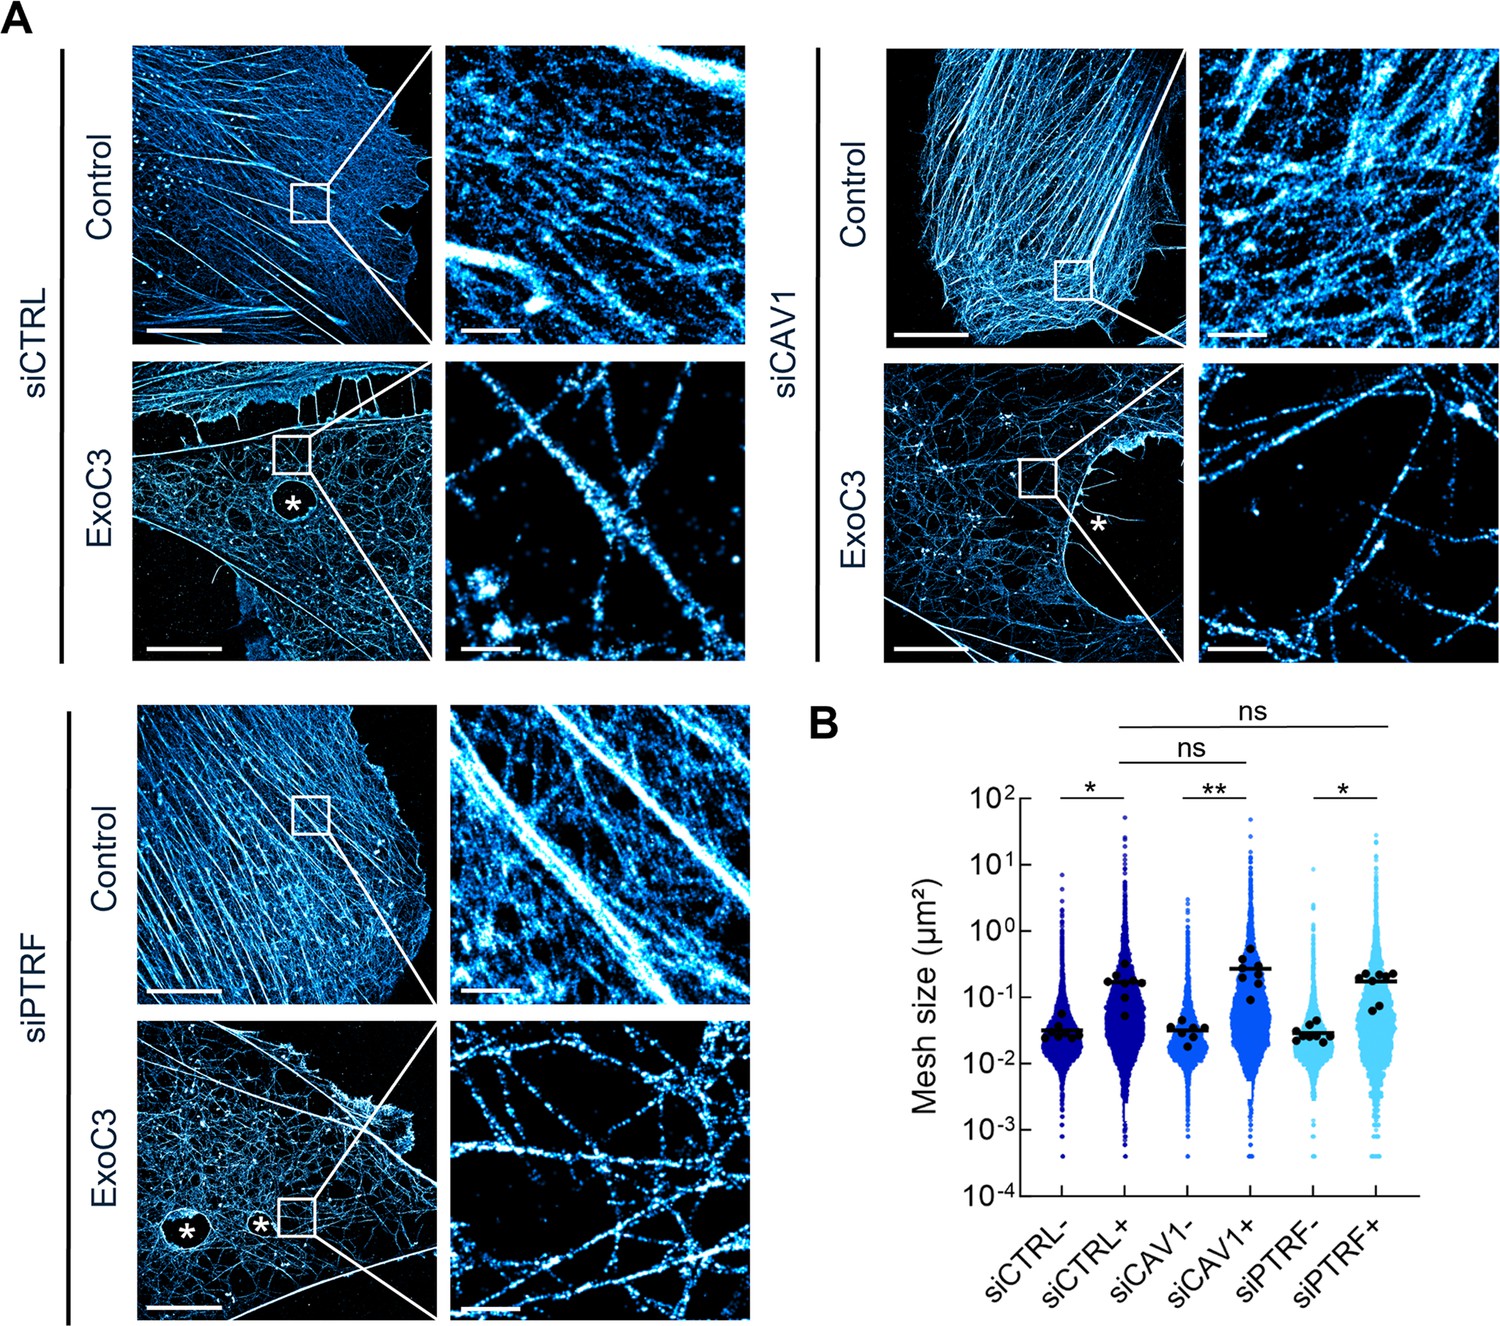
RhoA inhibition decreases F-actin mesh size with no significant effect of caveolae components.
(A) 2D stochastic optical reconstruction microscopy (STORM) images show the disruption of actin bundles and intertwined F-actin in cells intoxicated with ExoC3 at 100 μg/ml for 24 hr. Human umbilical vein endothelial cells (HUVECs) either left untreated or treated with ExoC3 before F-actin staining with phalloidin-AF647. Scale bar, 10 µm. High-magnification images are shown in the right panels. Scale bar, 1 µm. (B) Scatter dot plot shows the average mesh size per cell (µm²) of the F-actin network (black dots) overlaid with all individual values of mesh size (blue dots) shown in logarithmic scale. Quantification was performed with 2D STORM images of control (-) and ExoC3-treated cells (+) that were first treated with siCTRL (dark blue), siCAV1 (blue), and siPTRF (light blue). **p<0.01, *p<0.05 calculated with a nested t-test (n = 8–9 cells per group, three independent replicates).
-
Figure 2—source data 1
Data for Figure 2.
- https://cdn.elifesciences.org/articles/92078/elife-92078-fig2-data1-v1.xlsx
Figure 3
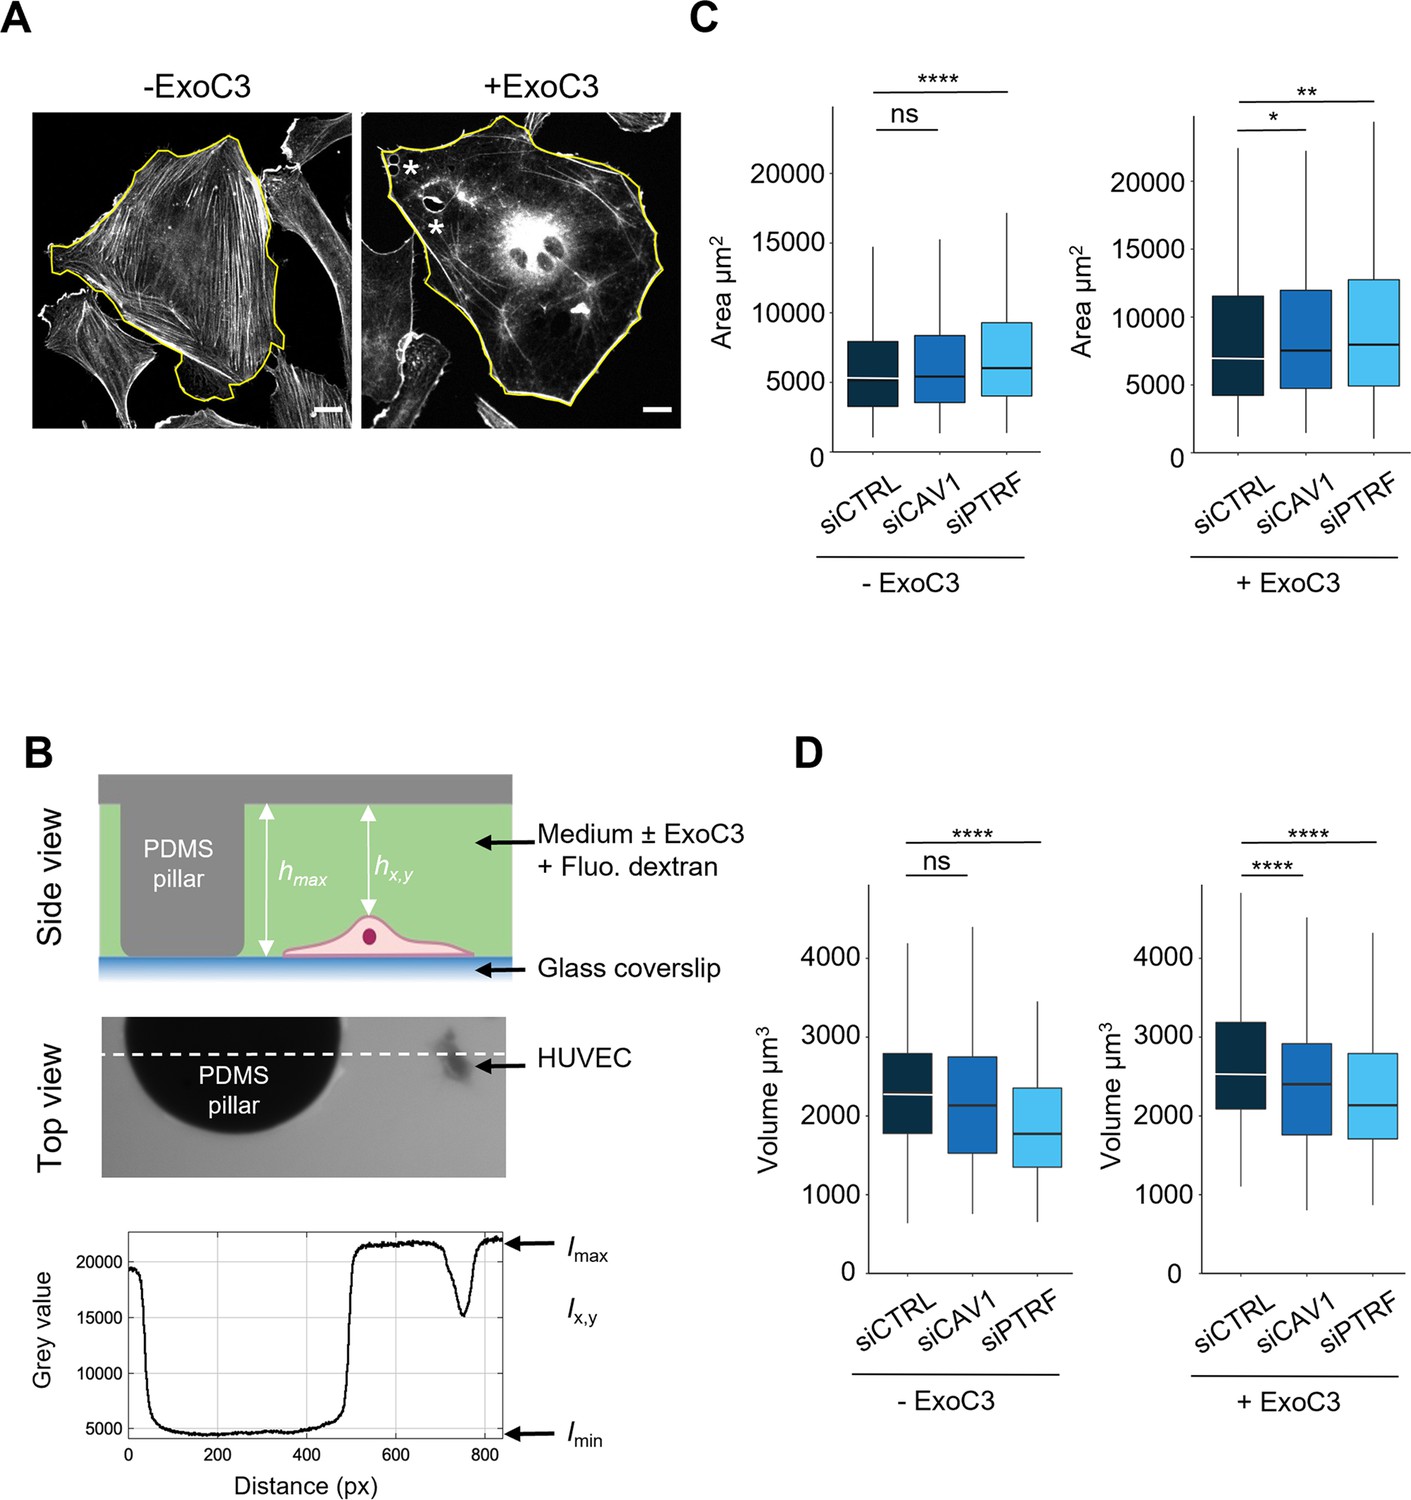
Regulation of human umbilical vein endothelial cell (HUVEC) area and volume by cavin-1/PTRF, caveolin-1, and RhoA.
(A) Confocal spinning disk images of HUVECs stained with phalloidin-FITC and selected perimeters (yellow line) in the absence (- ExoC3) or presence of ExoC3 (+ExoC3). Stars show the presence of transendothelial cell macroaperture (TEM) in ExoC3-treated cells. Scale bar, 20 µm. (B) Schematic representation of the microfluidic chamber used to measure cell volume by fluorescence exclusion. Briefly, from the top (i) side view of the chamber in which a cell adheres to a coverslip. The PDMS pillar sustains the ceiling (gray), and the maximal height of the chamber hmax (background) is known. The siCTRL, siCAV1, or siPTRF-transfected HUVECs were seeded in the chamber and remained either untreated or treated with ExoC3. High molecular weight dextran-FITC (green) was added to the chamber and is nonpermeant to cells (values hx,y); (ii) raw epifluorescence image showing a typical field of HUVEC; and (iii) the graph of fluorescence intensities (in grayscale) shows the function of distance along the dotted line. Parameters Imax and Imin yield values of maximum and minimum fluorescence intensities. Values for cell volume (Vcell) were obtained by integrating the fluorescence intensities hmax – hx,y over the cell area. (C) Boxplots show the distribution of TEM area values estimated from measures of their perimeters, which is shown in (A). Measurements were performed with HUVEC transfected with siCTRL (dark blue), siCAV1 (blue), or siPTRF (light blue) and then treated with ExoC3 (+ExoC3) or untreated (- ExoC3). Measurements were performed with n > 698 untreated cells and n > 595 treated cells, five independent experiments. (D) Boxplots show the distribution of cell volumes, as described in (B). Measurements were performed on HUVEC transfected with siCTRL, siCAV1, or siPTRF and then treated with ExoC3 (+ExoC3) or untreated (-ExoC3). Data are from n = 216 and n = 308 cells after siCTRL ± ExoC3 treatment (dark blue), n = 197 and n = 266 cells after siCAV1 ± ExoC3 treatment (blue) and n = 152 and n = 157 cells after siPTRF 10 ± ExoC3 treatment (light blue); three independent experiments. The graphs show technical replicates pooled together. The data were analyzed with a mixed-effect generalized linear model with Gamma log-link function, random intercept accounting for technical variability, and Tukey’s correction for pairwise comparisons between control and each siRNA treatment, ****p<0.0001, **p<0.01, *p<0.05 and ns, not significant.
-
Figure 3—source data 1
Data for Figure 3C and D.
- https://cdn.elifesciences.org/articles/92078/elife-92078-fig3-data1-v1.xlsx
Figure 4
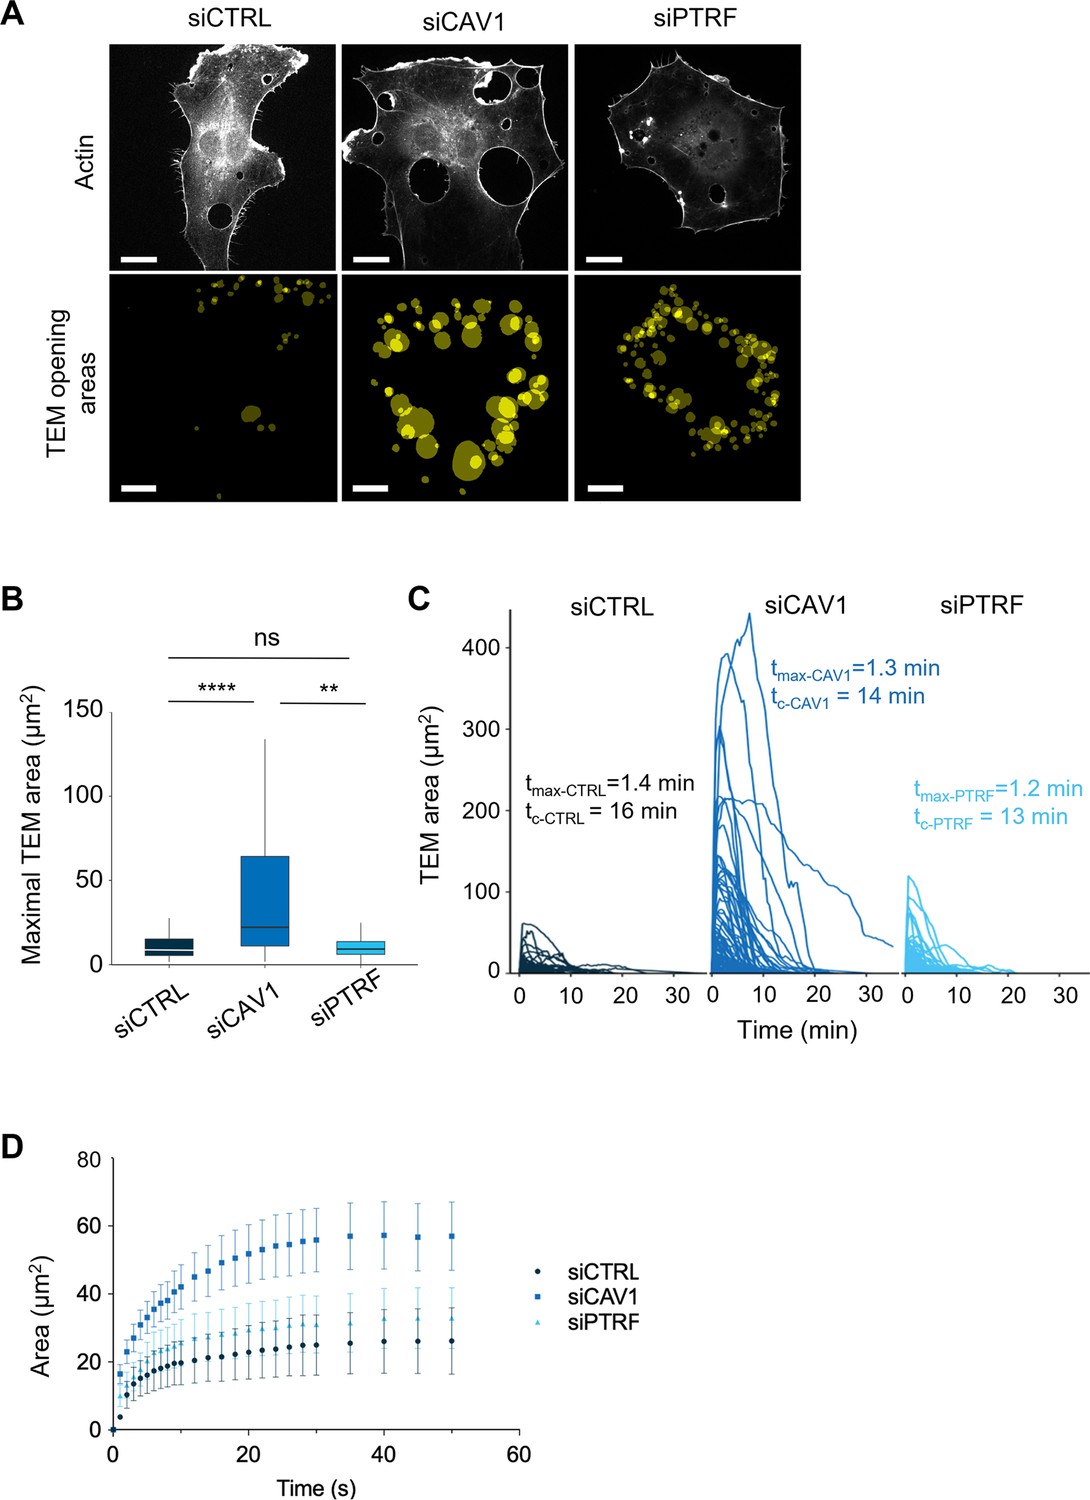
Caveolin-1 controls the transendothelial cell macroaperture (TEM) opening speed and maximum size.
(A) Images show examples of projections of all tunnels upon TEM initial opening (lower panel) in human umbilical vein endothelial cells (HUVECs) transfected with LifeAct-GFP expression plasmid and siCTRL, siCAV1, or siPTRF captured during 1 hr of live imaging. LifeAct-GFP HUVECs transfected with different siRNAs were treated with ExoC3 and recorded by live imaging for 1 hr. All initial TEM opening was based on the first frame in which TEM tunnels formed using ICY. The lower panel shows the projection of cumulative areas of initial TEM opening identified during 1 hr of live imaging. Scale bars, 20 µm. (B) Boxplot shows the distribution of TEMs, the maximal and median area values in HUVECs cotransfected with LifeAct-GFP-expressing plasmid and siCTRL, siCAV1, or siPTRF prior ExoC3 treatment. Maximal areas were determined based on each kinetic parameter of TEM dynamics, as shown in (C). The data represent n > 105 TEMs in seven cells of each treatment group from >3 independent experiments. Graph shows technical replicates pooled together. Statistical data analysis using a mixed-effect generalized linear model with Gamma log-link function, random intercept, and Tukey’s correction for multiple comparisons. ****p<0.0001, **p<0.01, and ns, nonsignificant. (C) The graph shows variations in TEM areas as a function of time expressed in minutes. HUVECs transfected with siCTRL, siCAV1, or siPTRF were treated with ExoC3 for 24 hr. The calculated values of tmax that corresponded to the time of opening to the time when the maximal areas were observed and the values of tc corresponded to the time frame of a complete cycle of opening and closing are indicated on the graph for each condition. The data are from n > 105 TEMs of seven cells per treatment from >3 independent experiments. (D) Graph shows variations in mean values, expressed in seconds, in the TEM areas of cells treated with ExoC3. The curves were plotted with data obtained from time-lapse video recorded at one frame per second for 30 min. LifeAct-GFP-expressing cells transfected with siCTRL, siCAV1, and siPTRF. The data correspond to n > 22 TEMs per condition from four independent experiments.
-
Figure 4—source data 1
Data for Figure 4B–D.
- https://cdn.elifesciences.org/articles/92078/elife-92078-fig4-data1-v1.xlsx
Figure 5 with 1 supplement
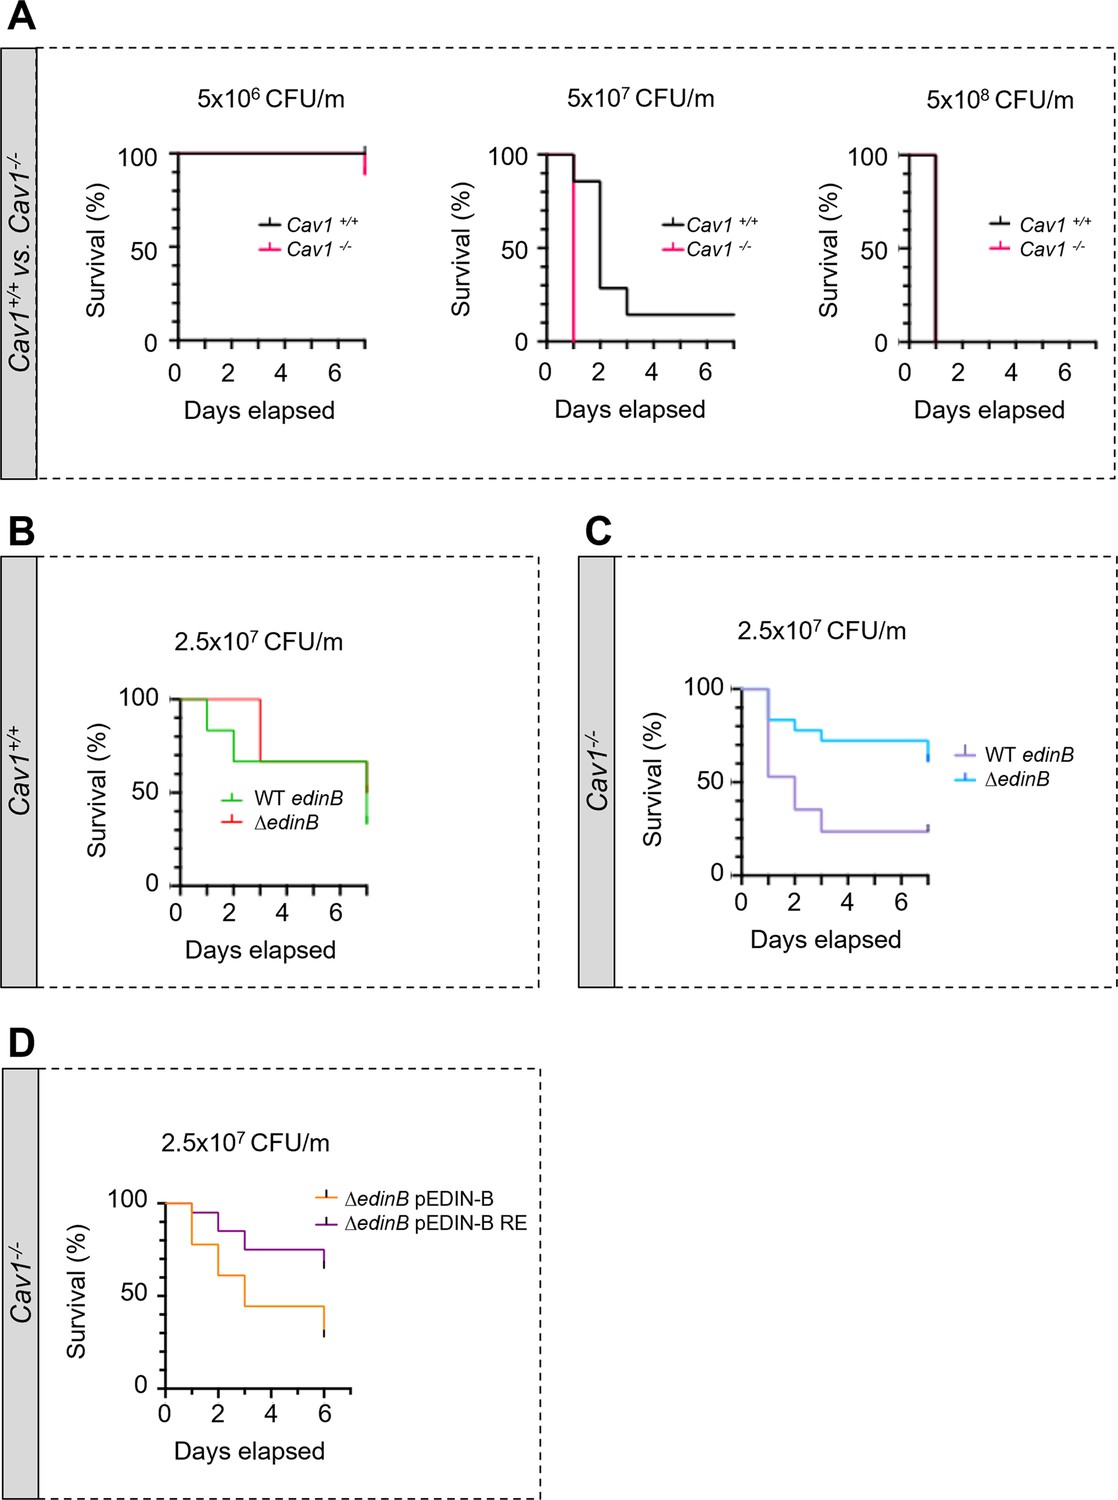
Hyper-susceptibility of Cav1-deficient mice to EDIN-B mART activity on RhoA.
(A–D) Kaplan‒Meier survival curves over 7 d for Cav1-/- mice and/or Cav1+/+ littermates infected intravenously (i.v.) at day 0 with isogenic strains of Staphylococcus aureus and doses, expressed as colony-forming units per mouse (CFU/m). (A) Mice were challenged by intravenous injection of 5 × 10⁶ CFU/mouse (group of 10 Cav1+/+ mice vs. group of 9 Cav1-/- mice), 5 × 10⁷ CFU/mouse (group of 7 Cav1+/+ mice vs. group of 9 Cav1-/- mice) or 5 × 10⁸ CFU/mouse (group of 7 Cav1+/+ mice vs. group of 8 Cav1-/- mice). Data show a significant increase in Cav1-/- lethality when challenged with 5 × 10⁷ CFU/mouse. Log-rank test (Mantel‒Cox), p<0.0011 at 5 × 10⁷ CFU/mouse (n = 1 experiment). (B, C) Mouse lethal doses 50 (LD50) of WT edinB or ΔedinB strains established in Cav1+/+ mice (B) and Cav1-/- mice (C). (B) Cav1+/+ mice injected i.v. with 2.5 × 10⁷ CFU/mouse (group of 12 mice for WT edinB and ΔedinB strains, n = 2 independent experiments). Log-rank test (Mantel‒Cox) shows no significant difference. (C) Cav1-/- mice were injected i.v. with 2.5 × 10⁷ CFU/mouse (groups of 17 or 18 mice for WT edinB or ΔedinB strains, n = 2 independent experiments). Log-rank test (Mantel‒Cox) shows significant increase in susceptibility of Cav1-/- mice to WT edinB compared with ΔedinB (p=0.0123). (D) Comparative analysis of the susceptibility of Cav1-/- mice to bloodstream infection triggered by S. aureus ΔedinB complemented with a plasmid encoding wildtype EDIN-B (pEDIN-B) or the catalytically inactive EDIN-B mutant (pEDIN-B RE). Mice were injected with 2.5 × 10⁷ CFU/mouse (groups of 20 CAV1-/- mice for ΔedinB pEDIN-B and for ΔedinB pEDIN-B RE strains, n = 2 independent experiments). Log-rank test (Mantel‒Cox) shows a higher susceptibility of Cav1-/- mice infected with S. aureus expressing catalytically active EDIN-B (p=0.0083).
-
Figure 5—source data 1
Data for Figure 5.
- https://cdn.elifesciences.org/articles/92078/elife-92078-fig5-data1-v1.xlsx
Figure 5—figure supplement 1
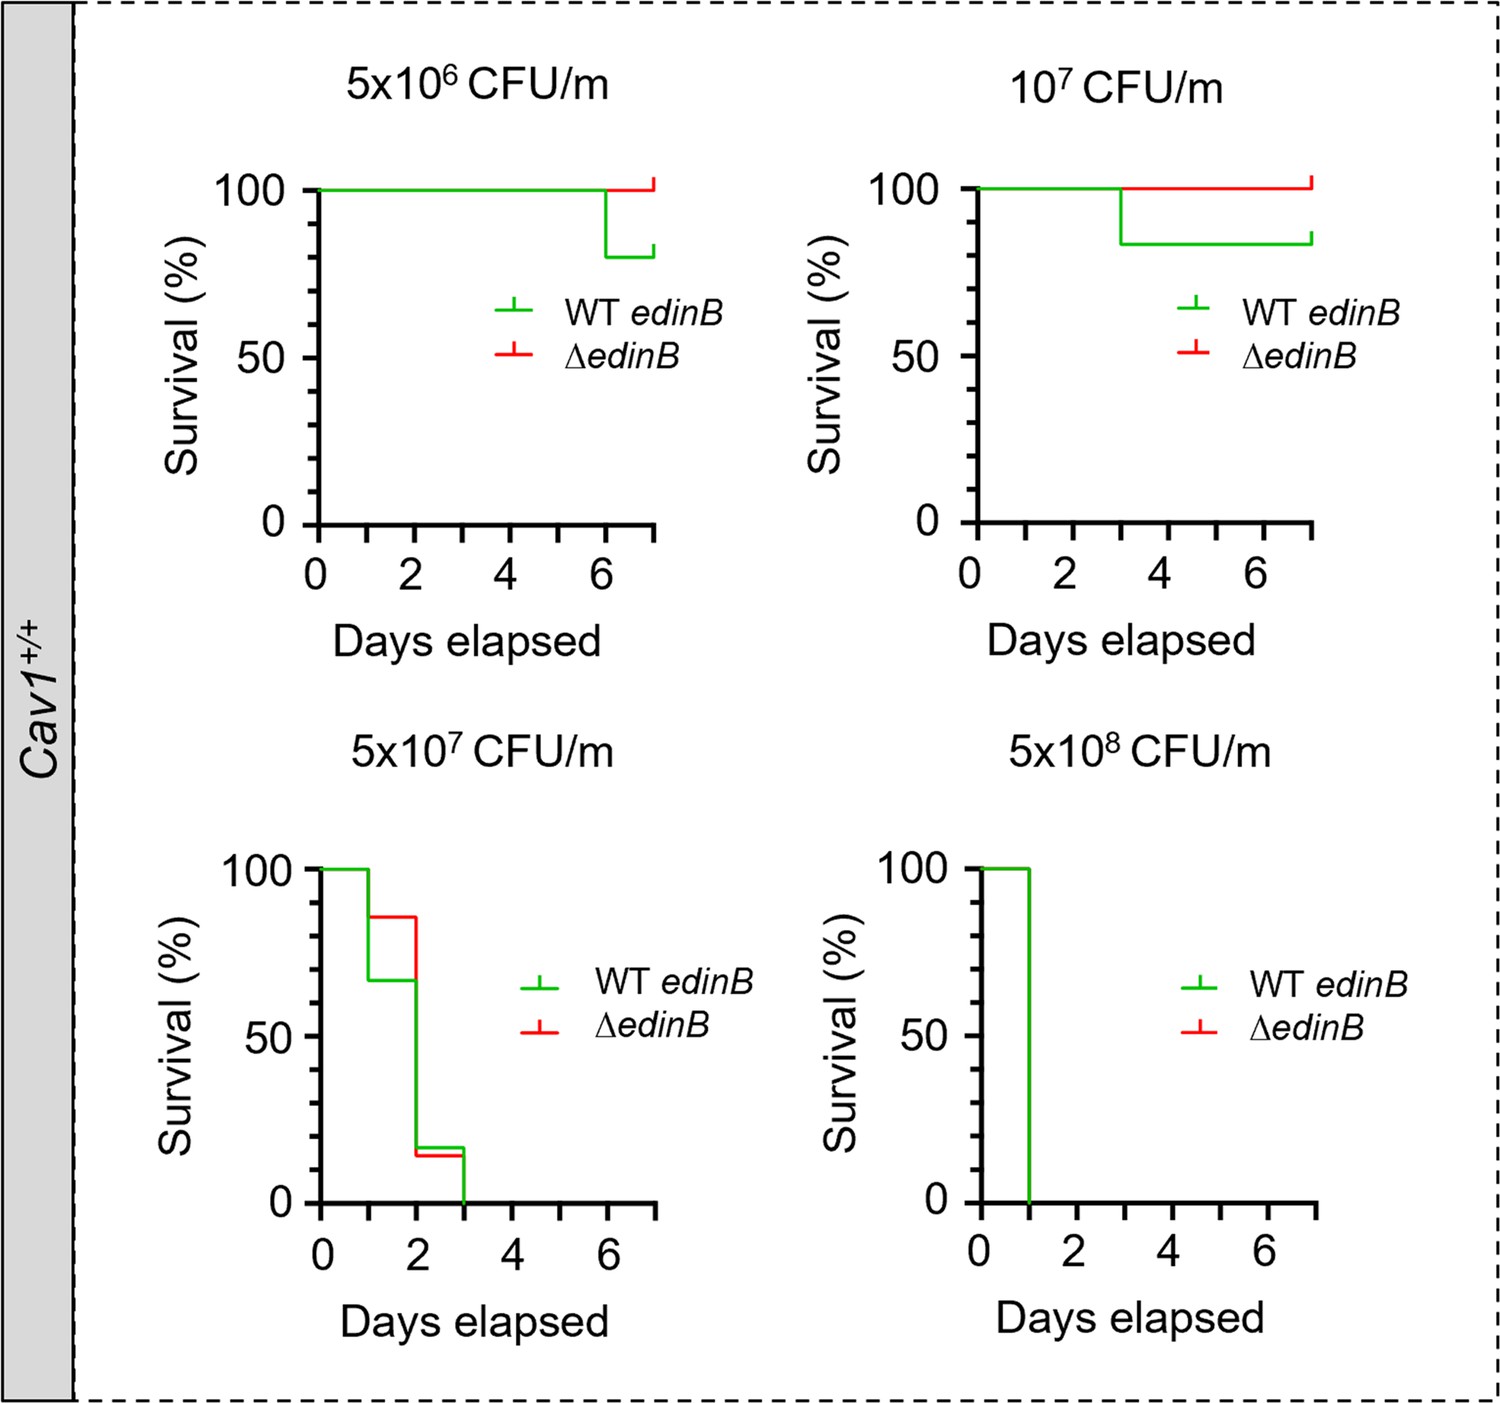
Cav1+/+ mice susceptibility to EDIN-B in staphylococcal septicemia.
Kaplan‒Meier survival curves with data obtained through 7 d from groups of Cav1+/+ infected intravenously at day 0 with different doses of LUG1799 wildtype S. aureus, expressed as colony-forming units per mouse (CFU/m). Comparative analysis of Cav1+/+ mouse susceptibility to bloodstream infection with either the WT edinB or ΔedinB strain. Mice were injected with 5 × 10⁶ CFU/m (n = 5 mice infected with the WT edinB or ΔedinB strain; one experiment), 107 CFU/m (n = 17 and n = 19 mice infected with the WT edinB or ΔedinB strain, respectively; three experiments), 5 × 10⁷ CFU/m (n = 19 or n = 18 mice infected with the WT edinB or ΔedinB strain; three experiments), and 5 × 10⁸ CFU/m (n = 4 or n = 5 mice infected with either the WT or ΔedinB strain, respectively; one experiment). There were no significant differences in the kinetics of survival between the WT and ΔedinB-infected animals, as determined by log-rank test (Mantel‒Cox).
-
Figure 5—figure supplement 1—source data 1
Data for Figure 5—figure supplement 1.
- https://cdn.elifesciences.org/articles/92078/elife-92078-fig5-figsupp1-data1-v1.xlsx
Figure 6 with 1 supplement
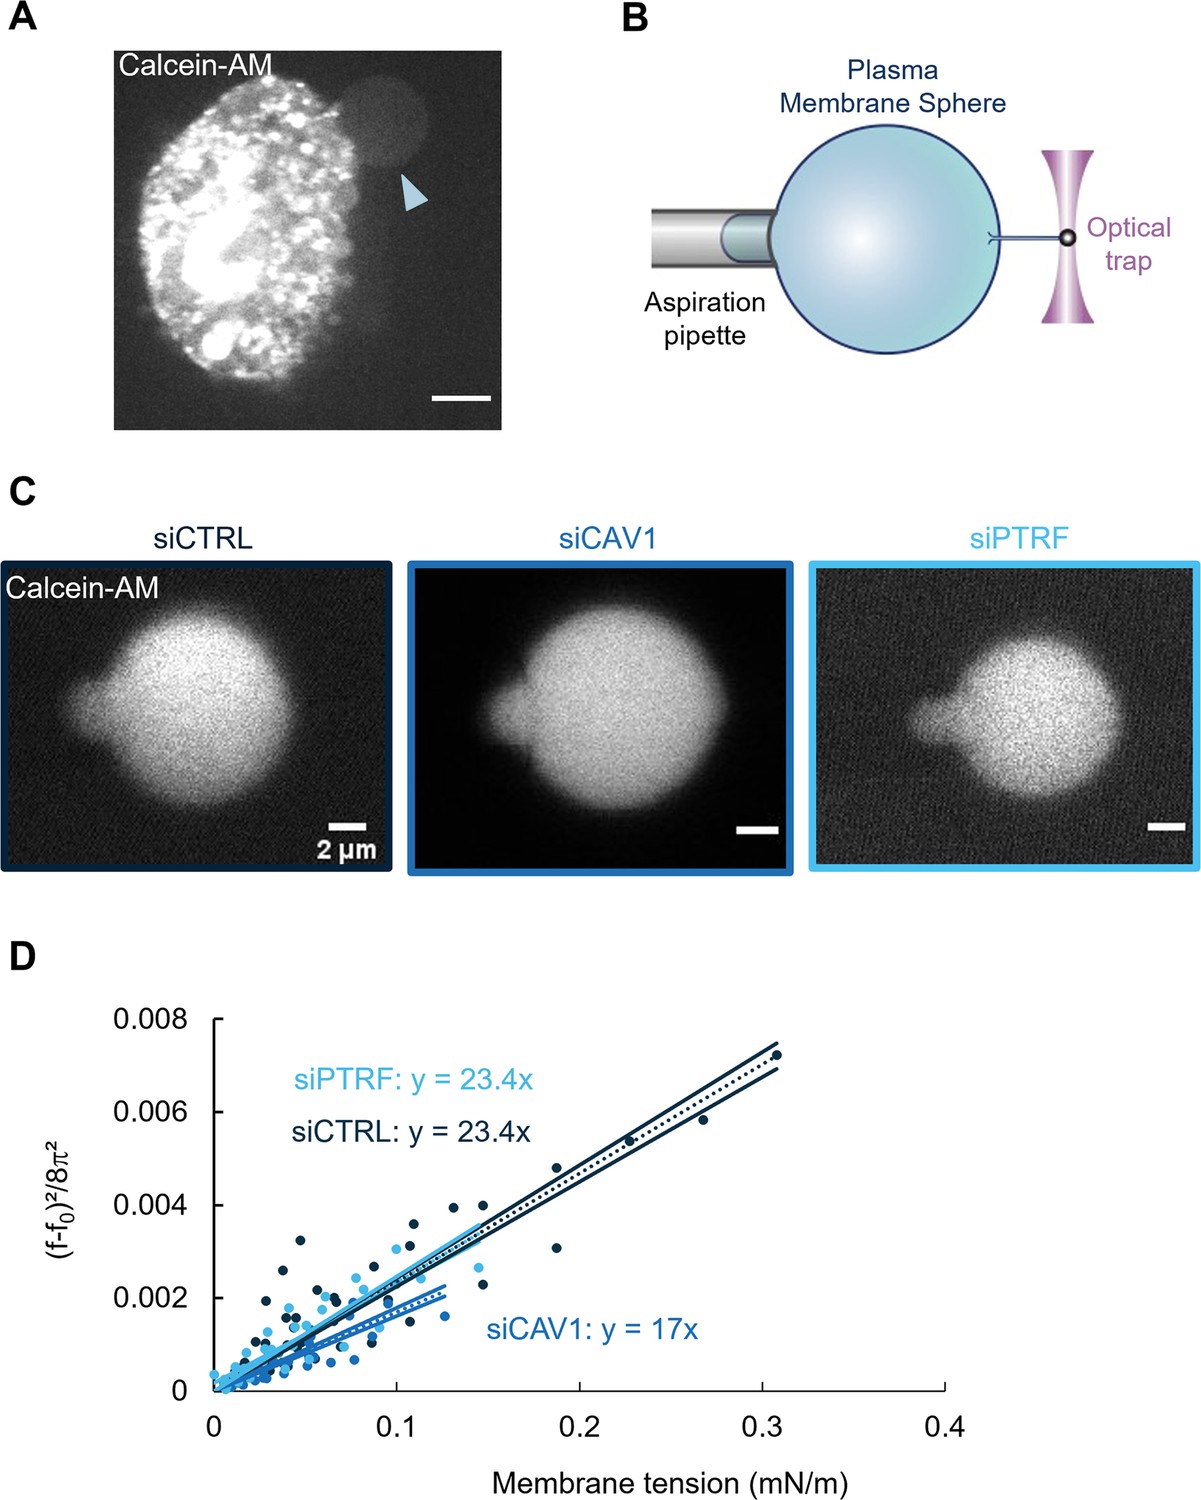
Caveolin-1 expression is a key determinant of membrane bending rigidity.
(A) Confocal spinning disk image of a human umbilical vein endothelial cell (HUVEC) displaying a calcein-AM-positive attached plasma membrane sphere (PMS) (arrowhead). Scale bar, 10 µm. (B) Schematic representation of the device used for measuring membrane mechanical parameters. It shows micropipette aspiration (gray) of a PMS (blue) and a tube pulled from the PMS through a bead bound to the PMS and trapped with an optical tweezer (purple). Increasing the aspiration pressure in the pipette allowed a progressive increase in the PMS membrane tension. (C) Confocal images show examples of calcein-AM-positive PMSs prepared from siCTRL-, siCAV1-, or siPTRF-transfected cells during micropipette aspiration. Scale bars, 2 µm. (D) The force required to pull membrane tubes rescaled to ((f–f0)2/8π2) (in pN2), which is a function of the membrane tension (mN/m) for different siCTRL (dark blue), siCAV1 (blue), and siPTRF (light blue) treatments. The force f0 was measured for each tube as the force when the membrane tension vanishes. The bending rigidity κ (in kBT) was determined via the slope of the linear regression. The data were calculated from n = 5 to n = 10 tubes per condition (>4 independent experiments). Linear regression data are shown as dashed lines, and 95% confidence intervals are shown as solid lines (slope ± SD). Data recorded between siCTRL and siCAV1 are significant showing no overlap between respective 95% confidence intervals.
-
Figure 6—source data 1
Data for Figure 6D.
- https://cdn.elifesciences.org/articles/92078/elife-92078-fig6-data1-v1.xlsx
Figure 6—figure supplement 1
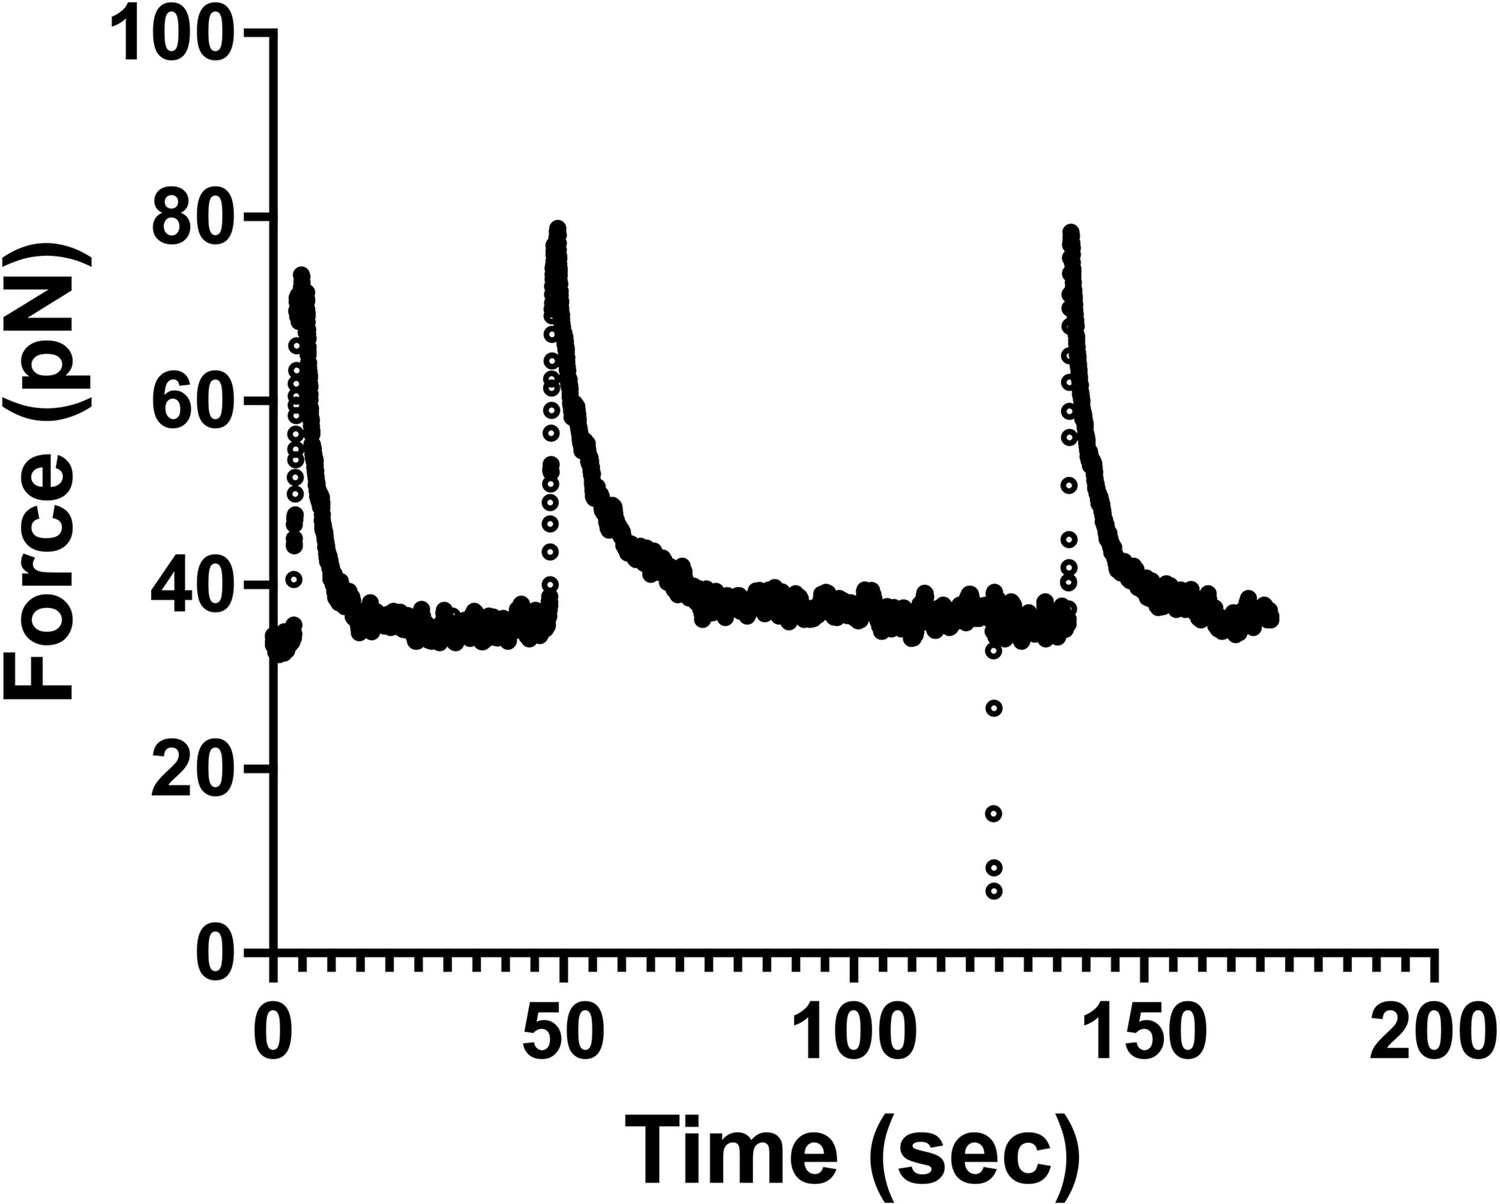
Force measurements were done at equilibrium.
Graph shows an example of a force versus time curve during three consecutive tube-pulling experiments from the same plasma membrane sphere (PMS) (Figure 6). We observe that the force reaches equilibrium (plateau value) at about 10 s after the tube is pulled. After 30 s, the force remains constant, which means that we performed the tube-pulling experiments from the PMS under technical conditions of equilibrium, ensuring that lipids and membrane proteins had enough time to reach the tether by convective or diffusive movement.
-
Figure 6—figure supplement 1—source data 1
Data for Figure 5—figure supplement 1.
- https://cdn.elifesciences.org/articles/92078/elife-92078-fig6-figsupp1-data1-v1.xlsx
Videos
Video 1
Cycles of transendothelial cell macroaperture (TEM) tunnel opening and closure in GFP-LifeAct-expressing human umbilical vein endothelial cell (HUVEC) transfected with a control siRNA prior to intoxication with ExoC3 at 100 μg/ml for 24 hr.
Video recorded at one frame every 15 s and played at seven images per second. Scale bar, 10 μm.
Video 2
Cycles of transendothelial cell macroaperture (TEM) tunnel opening and closure in GFP-LifeAct-expressing human umbilical vein endothelial cell (HUVEC) transfected with siRNA targeting caveolin-1 prior to intoxication with ExoC3 at 100 μg/ml for 24 hr.
Video recorded at one frame every 23 s and played at seven images per second. Scale bar, 10 μm.
Video 3
Cycles of transendothelial cell macroaperture (TEM) tunnel opening and closure in GFP-LifeAct-expressing human umbilical vein endothelial cell (HUVEC) transfected with siRNA targeting cavin-1 prior to intoxication with ExoC3 at 100 μg/ml for 24 hr.
Video recorded at one frame every 20.5 s and played at seven images per second. Scale bar, 10 μm.
Tables
Table 1
Cell spreading area, volume, and height.
| Conditions | Mean cell areaA (µm²) | SD of the cell area (µm²) | Mean cell volumeV (µm3) | SD of the cell volume (µm3) | Cell heighth (µm) | SD of the height (µm) |
|---|---|---|---|---|---|---|
| siCTRL- | 6583 | 5168 | 2320 | 3147 | 0.35 | 0.75 |
| siCTRL+ | 9025 | 7258 | 2710 | 4326 | 0.30 | 0.72 |
| siCAV1- | 7048 | 5583 | 2146 | 3214 | 0.30 | 0.70 |
| siCAV1+ | 9831 | 7984 | 2357 | 3010 | 0.24 | 0.50 |
| siPTRF- | 7539 | 5450 | 1914 | 2234 | 0.25 | 0.48 |
| siPTRF+ | 10,139 | 7873 | 2282 | 2628 | 0.23 | 0.43 |
Table 2
Estimate of the variation of mechanical cell parameters between different experimental conditions.
The value of the effective membrane tension σ0 for the control case is obtained from earlier estimates (Doye et al., 2002). The increase in σ0 for siCAV1 and siPTRF cell membranes is deduced from our experimental data using Equation 9. The transendothelial cell macroaperture (TEM) maximum area, Amax, is the median not the average value because the median is a more robust estimator in the presence of a few extremely large values. As discussed in the text, the variations in the bending rigidity are roughly proportional to variations in (N · Amax)–1, where N is the average number of TEMs opening simultaneously and Amax is the TEM maximum area.
| Condition | σ0 (μN/m) | Amax (μm2) | N (average) | (N · Amax)–1 (μm–2) |
|---|---|---|---|---|
| Control | 25 ± 10 | 8.1 ± 0.5 | 0.90 ± 0.09 | 0.137 ± 0.022 |
| siCAV1 | 50 ± 7 | 23 ± 4 | 1.92 ± 0.15 | 0.023 ± 0.006 |
| siPTRF | 29 ± 7 | 9.3 ± 0.7 | 1.34 ± 0.11 | 0.080 ± 0.012 |
Additional files
Download links
A two-part list of links to download the article, or parts of the article, in various formats.
Downloads (link to download the article as PDF)
Open citations (links to open the citations from this article in various online reference manager services)
Cite this article (links to download the citations from this article in formats compatible with various reference manager tools)
Caveolin-1 protects endothelial cells from extensive expansion of transcellular tunnel by stiffening the plasma membrane
eLife 12:RP92078.
https://doi.org/10.7554/eLife.92078.3


