Dynamic modes of Notch transcription hubs conferring memory and stochastic activation revealed by live imaging the co-activator Mastermind
- Department of Physiology Development and Neuroscience, University of Cambridge, United Kingdom
- Instituto de Biomedicina de Sevilla (IBiS), Hospital Universitario Virgen del Rocıo/CSIC/Universidad de Sevilla, Departamento de Biologıa Celular, Spain
Figures
Figure 1 with 1 supplement
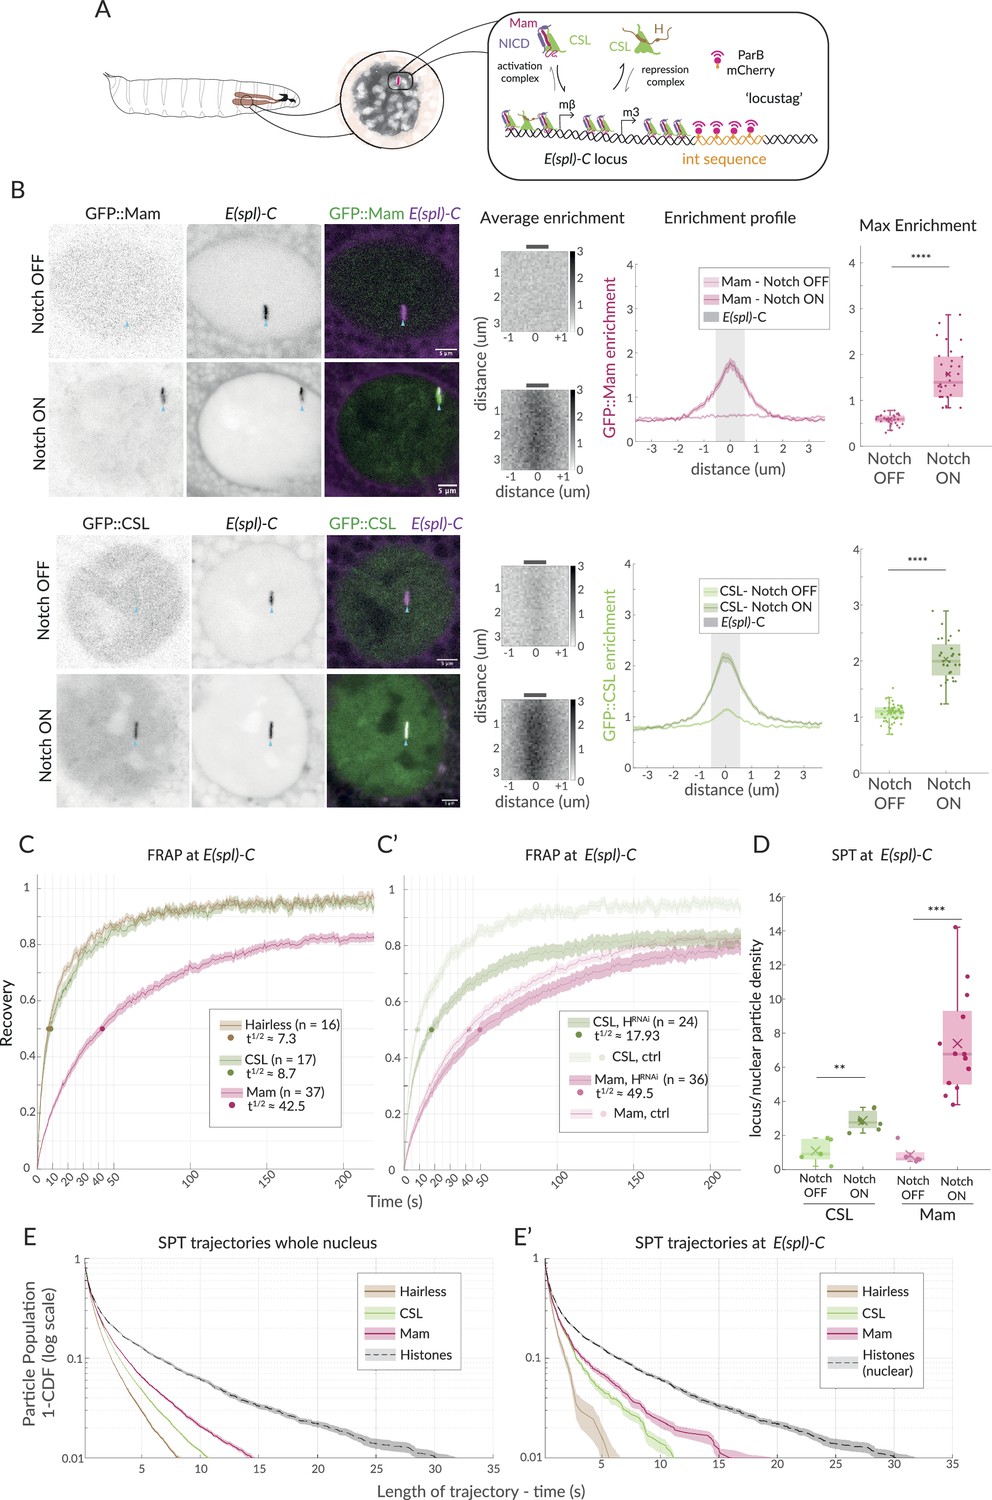
Enrichment and dynamics of Mastermind at E(spl)-C.
(A) Schematic overview of live imaging system used. Salivary glands from Drosophila larvae (left) have large nuclei with polytene chromosomes (centre, grey shading) in which E(spl)-C locus is detected as a band (centre, red) by live imaging when labelled using Int (orange)/ParB (red) system (right and Figure 1—figure supplement 1A). Recruitment of activation complexes, (CSL [green], NICD [purple], and Mastermind [magenta]) and of co-repression complexes (CSL and Hairless [brown]) is measured by their colocalisation with E(spl)-C. (B) Live imaging of GFP::Mam and GFP::CSL as indicated in relation to E(spl)-C marked by Int-ParB (magenta) in nuclei from Notch OFF (1151Gal4; UAS-LacZ) and Notch ON (1151Gal4; UAS-N∆ECD) salivary glands. CSL and Mam are enriched at E(spl)-C in Notch ON but not Notch OFF cells. Average enrichment: each pixel represents average enrichment of all aligned images, centred on E(spl)-C locus (0, grey bar). Enrichment profile: mean enrichment, with SEM, plotted on x-axis relative to position, y axis, centred on E(spl)-C (0). Grey area indicates region used for max enrichment. Max enrichment: mean of 10 pixels centred on E(spl)-C (Figure 1—figure supplement 1B) (Mam OFF, n = 32, Mam OFF, n = 30; CSL OFF, n = 45, CSL ON, n = 28; for p-values, see Supplementary file 1—Table 4). Box encompasses range between 0.25 and 0.75 quantile, whiskers extend to furthest points not considered outliers, bar marks median, cross marks mean, and each dot is the value for one nucleus. Scale bars represent 5 µm. Genetic combinations for all figures are provided in Supplementary file 1—Table 3. (C, C’) Dynamics of CSL::GFP (green), GFP::Mam (magenta), and Hairless::GFP (brown) at E(spl)-C in Notch ON cells measured by fluorescence recovery after photobleaching (FRAP). Recovery of the indicated proteins was measured in a point bleached region-of-interest centred on E(spl)-C and normalised by using another region and efficiency of bleaching. Dots indicate 50% recovery. Legend summarises numbers of nuclei (n) and time to 50% recovery (t1/2). Error represents the standard error of the mean (SEM). (C’) FRAP analysis of CSL and Mam in cells depleted for Hairless (1151Gal4; UAS-Hairless RNAi) controls from (C) are included for comparison. (D) Trajectory density at E(spl)-C relative to whole nucleus from SPT of CSL::Halo (green) and Halo::Mam (pink) in Notch OFF and Notch ON cells. Both CSL and Mam are significantly enriched in Notch ON. Box plots as in (B). CSL-OFF, n = 5, CSL-OFF, n = 7; Mam-OFF, n = 5, Mam-ON, n = 13; for number of trajectories, see Figure 1—figure supplement 1F and for p-values see Supplementary file 1—Table 4. (E, E’) Survival curves depicting duration of trajectories in SPT of the indicated Halo fusion proteins in whole nuclei (E) and at E(spl)-C (E'), in Notch ON cells. Whole nuclei H2B::Halo trajectories are included for comparison in both graphs. For number of trajectories, see Figure 1—figure supplement 1F. Error bars represent 95% confidence intervals, obtained from bootstrapping with 100 resampled datasets (Efron and Tibshirani, 1994).
Figure 1—figure supplement 1
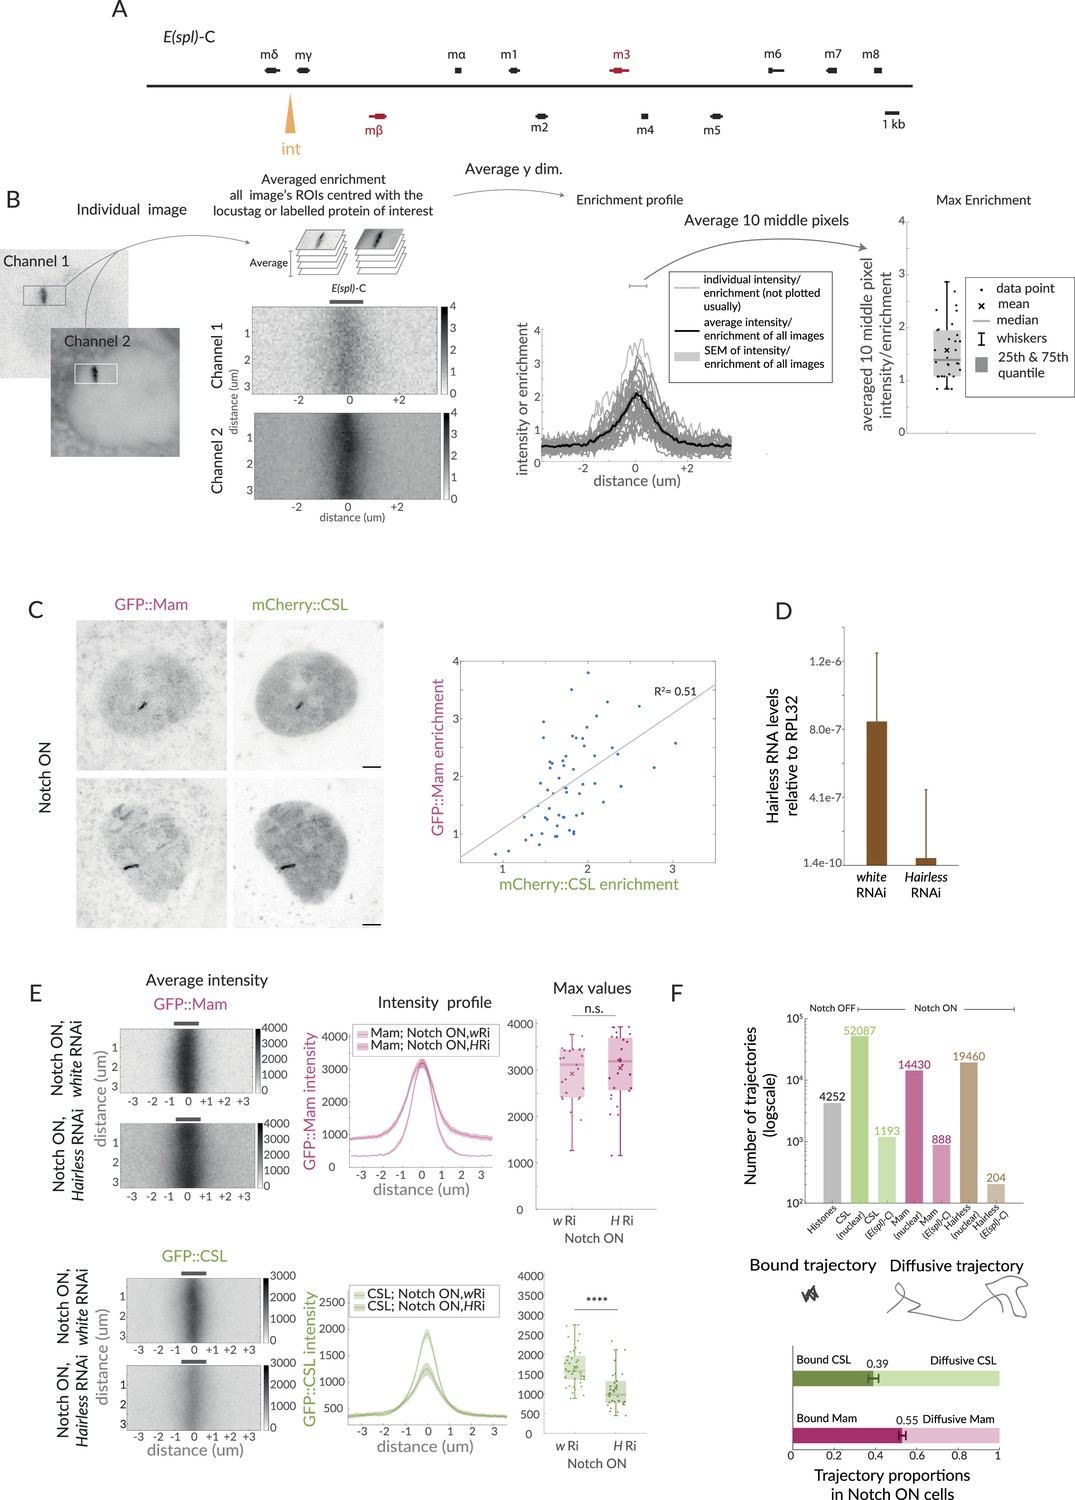
Image analysis and effect of Hairless depletion on CSL and Mam.
(A) Scheme of the E(spl)-C in the Drosophila genome. Orange arrow indicates the insertion site of the IntB sequence that recruits ParB, E(spl)-mβ and E(spl)-m3 are shaded in magenta. (B) Schematic overview of image analysis. Images were rotated and a region of interest (ROI) was selected centred at the E(spl)-C. ROIs from images were averaged to produce an average enrichment image. 2D images extracted with the ROI were averaged in the y-dimension to generate an intensity profile enrichment plot, where the mean intensity and SEM were represented. For max values, the 10 middle values of the profile enrichment were averaged and plotted. Box encompasses range between 0.25 and 0.75 quantile, whiskers extend to furthest points not considered outliers, bar marks median, cross marks the mean, and each dot is the value for one nucleus. (C) Two colour images of Mam and CSL (labelled with GFP and mCherry, respectively) in Notch ON cells. Graph depicts correlation of the enrichment levels. (D) mRNA levels of Hairless in control (white RNAi) and Hairless RNAi conditions measured by RT-qPCR and normalised to RPL32. (E) Average enrichment, intensity profile and max values for Mam (n = 25, 27) and CSL (n = 37, 31) in Hairless RNAi (H Ri) in comparison to control, white RNAi (w Ri). For p-values, see Supplementary file 1—Table 4. (F) Graph shows the number of trajectories for each molecule, all but histones are Notch ON and separated into nuclear and at E(spl)-C. Trajectories were segregated into bound and diffusive, as depicted by the cartoon. Percentages of each population for CSL and Mam were calculated per nuclei, error represents SEM (percentage CSL vs. Mam p=0.003, n = 7, 13 nuclei). Diffusion coefficients were calculated per nucleus as well. Diffusion coefficient bound CSL vs. bound Mam (0.27 ± 0.04 µm2/s, 0.25 ± 0.01 µm2/s, p=0.63), diffusion coefficient diffusive CSL vs. bound Mam (0.01 ± 0.001 µm2/s, 0.01 ± 0.001 µm2/s, p=0.34).
Figure 2 with 1 supplement
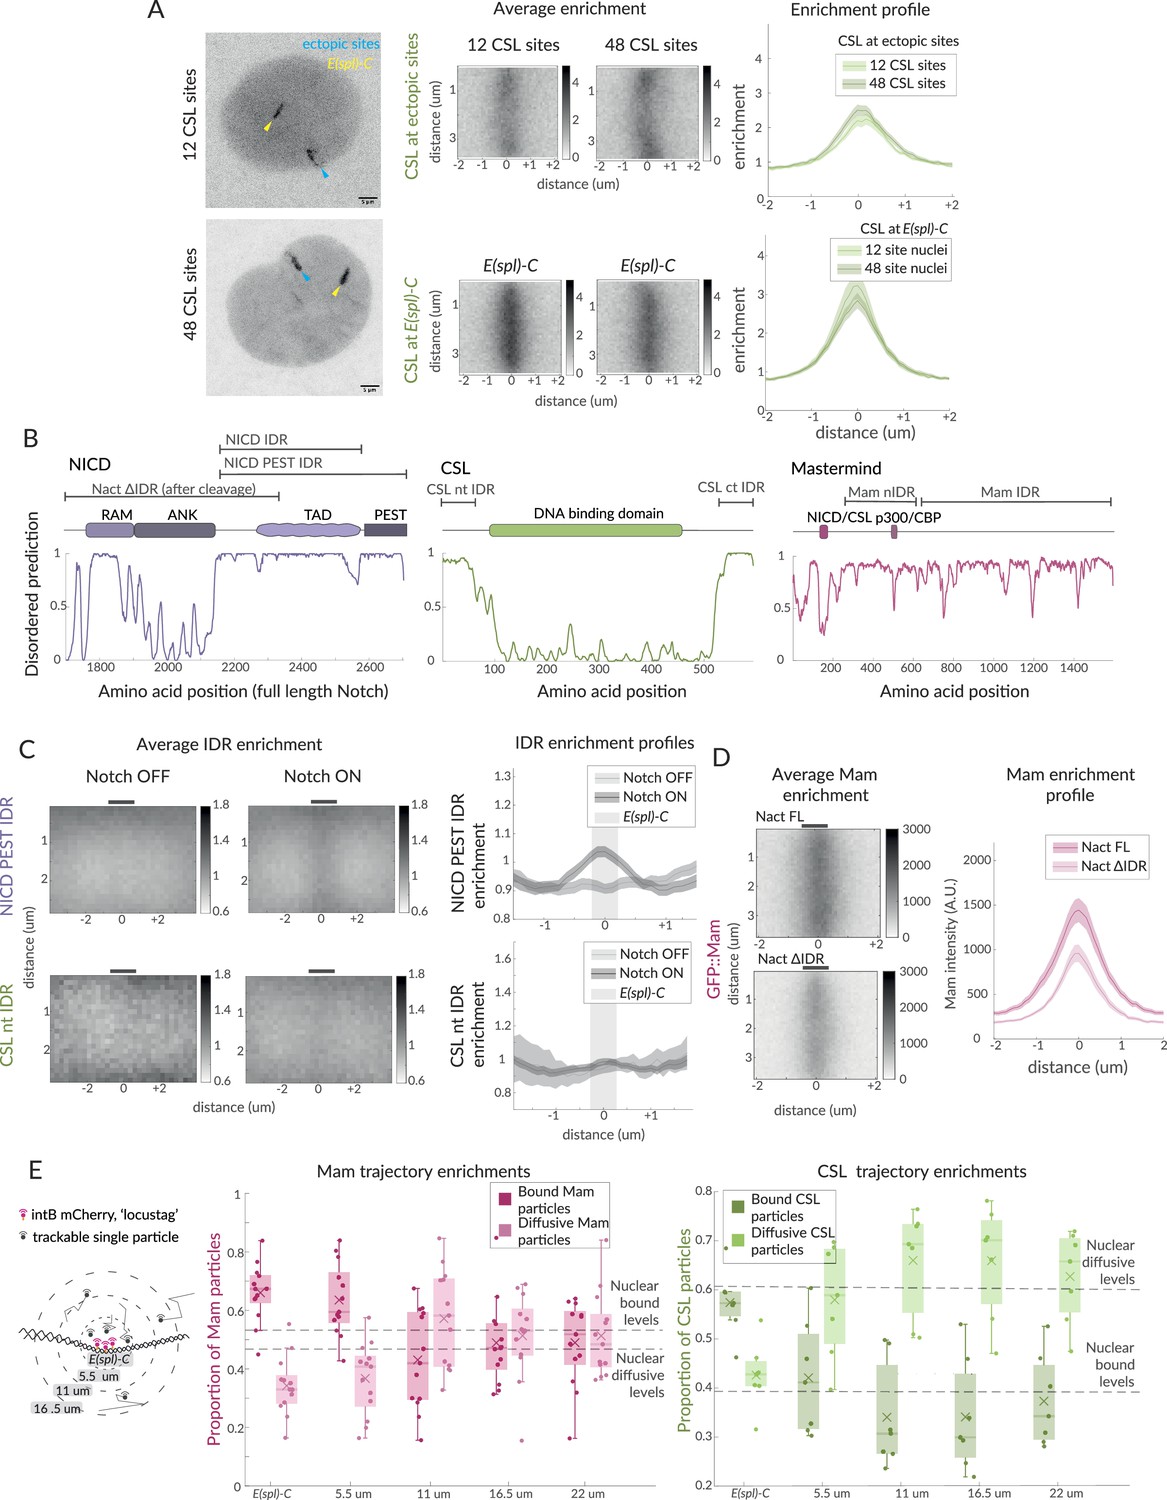
Hub-like properties of recruited complexes in Notch ON nuclei.
(A) Representative images of GFP::CSL in Notch ON nuclei containing an ectopic array of 12 or 48 CSL binding sites. GFP::CSL is recruited to E(spl)-C (yellow) and the ectopic array (blue). Average enrichment, enrichment profile as in Figure 1B (ectopic array 12, n = 45, ectopic array 48, n = 40; E(spl)-C 12, n = 45, E(spl)-C 48, n = 40). (B) Domain organisation of the indicated proteins is diagrammed above the prediction scores (Metapredict V2) of protein disorder for each. Regions tested as intrinsically disordered regions (IDRs) are indicated. (C) Average enrichments and enrichment profiles of NICD-PEST IDR (Notch OFF, n = 62, Notch ON, n = 67) and CSL-nt IDR (Wilcoxon rank sum test: Notch OFF, n = 8, Notch ON, n = 40) at E(spl)-C in Notch OFF and Notch ON cells. (D) Average enrichments and enrichment profiles (as in Figure 1B) of GFP::Mam at E(spl)-C in nuclei expressing intact (Nact) and IDR deleted (Nact ΔIDR) Notch constructs (Nact, n = 58, Nact ΔIDR, n = 55). p-Values in Supplementary file 1—Table 4. (E) Diagram illustrates concentric ring analysis of single-particle trajectories at increasing distances from E(spl)-C. Graphs plot proportions of bound (dark shading) and diffusive (light shading) particles of Halo::Mam or Halo::CSL within each ring. Dashed lines indicate nuclear proportions of each population as indicated. For the number of trajectories, see Figure 1—figure supplement 1F.
Figure 2—figure supplement 1
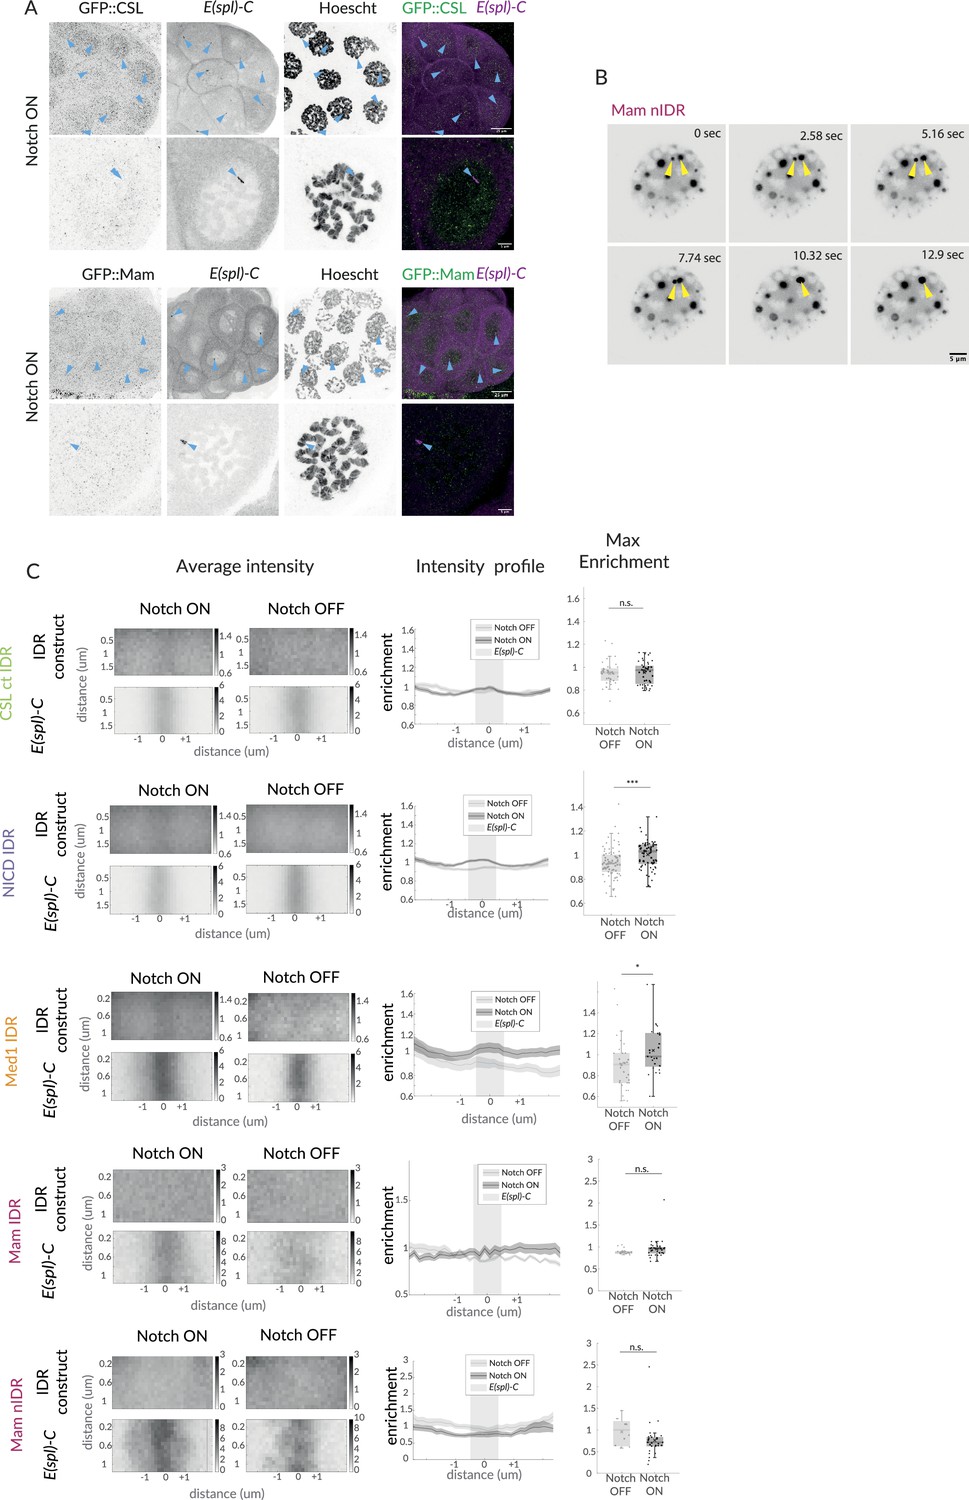
Notch activation complexes exhibit hub-like properties.
(A) Fixed Notch ON whole glands and nuclei of GFP::CSL and GFP::Mam (first channel), co-stained to detect E(spl)-C locus and DNA (Hoechst). Top row, whole gland, and lower row, individual example nuclei, with 25 µm and 5 µm scale bars, respectively. (A) An example of a nucleus expressing GFP::Mam[nIDR], imaged over time. Yellow arrows mark two droplets that fuse (10 s frame). Scale bar indicates 5 µm. (B) Average, profile and max enrichment of IDR constructs: CSL[ctIDR], NICD[IDR], Med1[IDR], Mam, Mam[nIDR] in Notch OFF and Notch ON cells (upper and lower rows). For p-values, see Supplementary file 1—Table 4.
Figure 3 with 1 supplement
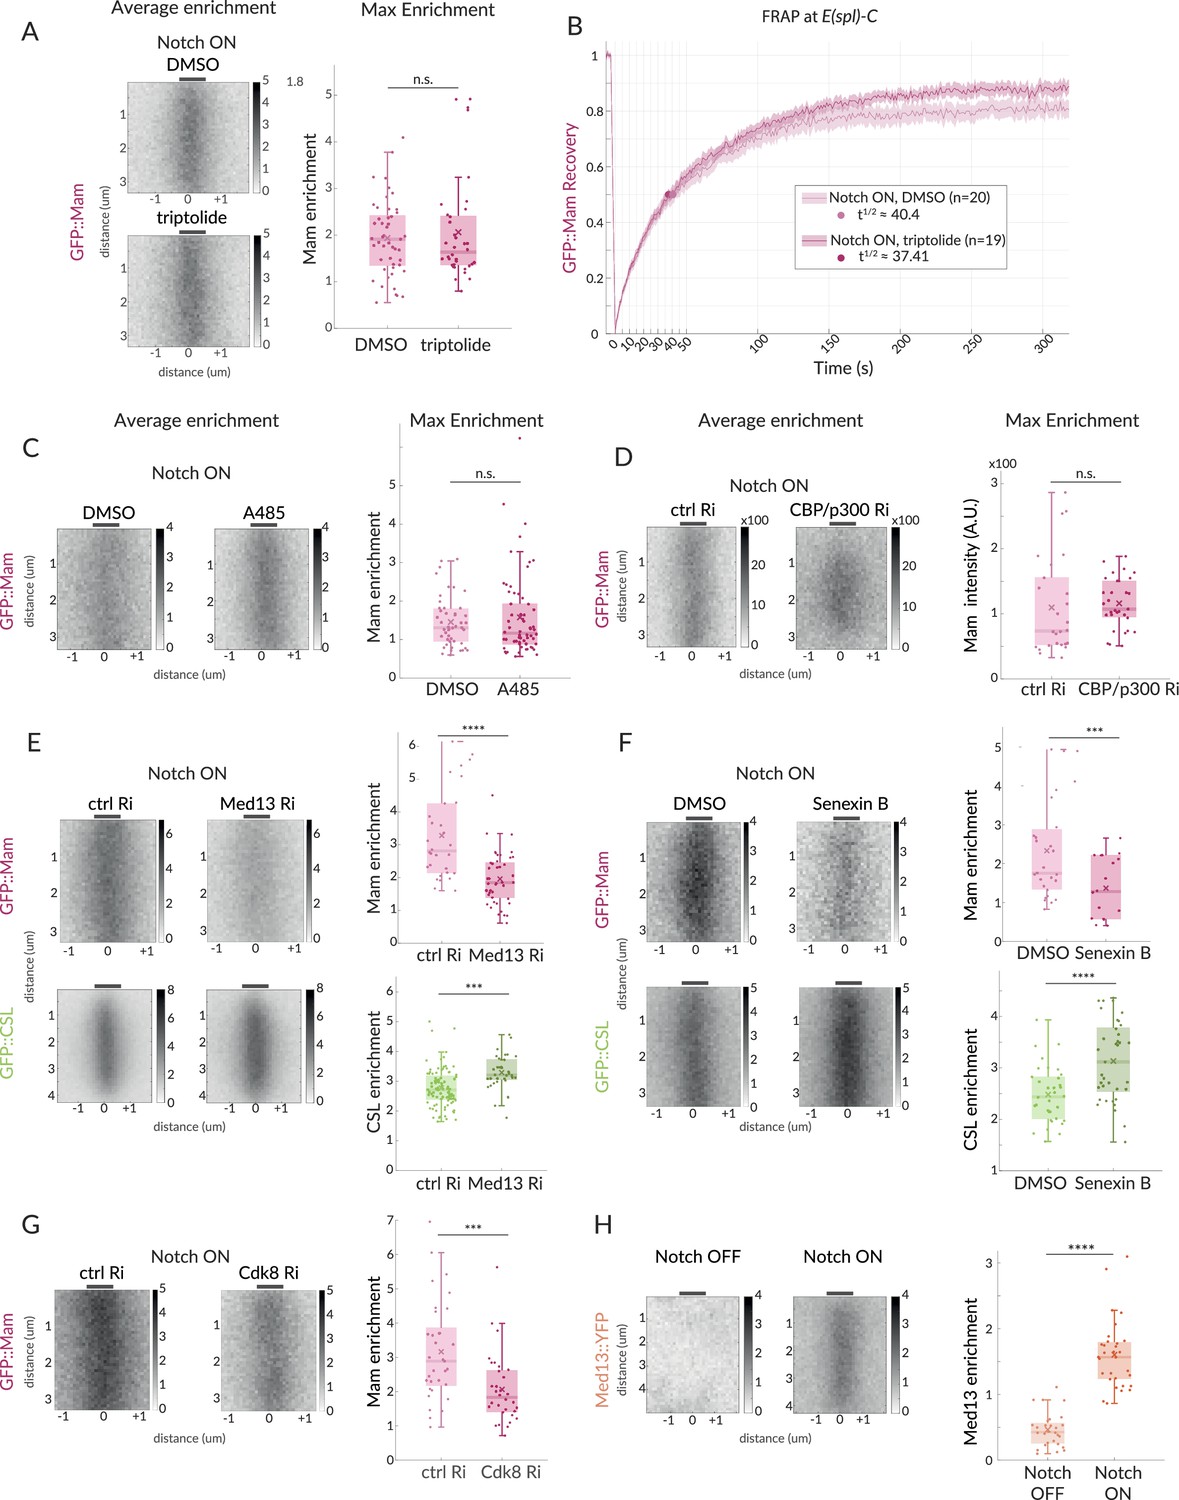
Mam enrichment requires Mediator CDK module but is independent of transcription and CBP/p300.
(A, B) GFP::Mam recruitment levels and dynamics at E(spl)-C in Notch ON tissues treated with triptolide or DMSO as a control. (A) Average and Max enrichment as in Figure 1B (DMSO n = 49, triptolide, n = 36). (B) FRAP recovery curves, plotted as in Figure 1C. (C–F) Average enrichment and Max enrichment of GFP::Mam and GFP::CSL, as indicated, at E(spl)-C in Notch ON control and treated tissues. (C, D) No change in recruitment following inhibition (C, A485) or genetic knockdown (D, RNAi) of CBP/p300 compared to control, DMSO and yellow RNAi (yRi), respectively (DMSO, n = 47, A485, n = 62; y RNAi, n = 26, CBP/p300 RNAi, n = 31). (E, F) Reduced recruitment of GFP::Mam (magenta) but not CSL::GFP (green) following (E) genetic knockdown of Med13 and (F) inhibition of CDK8 with Senexin B (E: Mam control, n = 30, Mam Med13Ri, n = 45; CSL control, n = 92, CSL Med13Ri, n = 36); (F: Mam ctrl n = 27, Mam Senexin, n = 43; CSL ctrl, n = 34, CSL Senexin, n = 37). (G) Genetic knockdown of Cdk8 results in decreased Mam recruitment compared to controls (ctrl, n = 33, Cdk8 Ri, n = 32). Box plots in (A–F) as in Figure 1B. For p-values, see Supplementary file 1—Table 4. (H) Average enrichment and max enrichment of Med13::YFP at E(spl)-C in Notch OFF, n = 28 and Notch ON, n = 31; for p-values, see Supplementary file 1—Table 4.
Figure 3—figure supplement 1
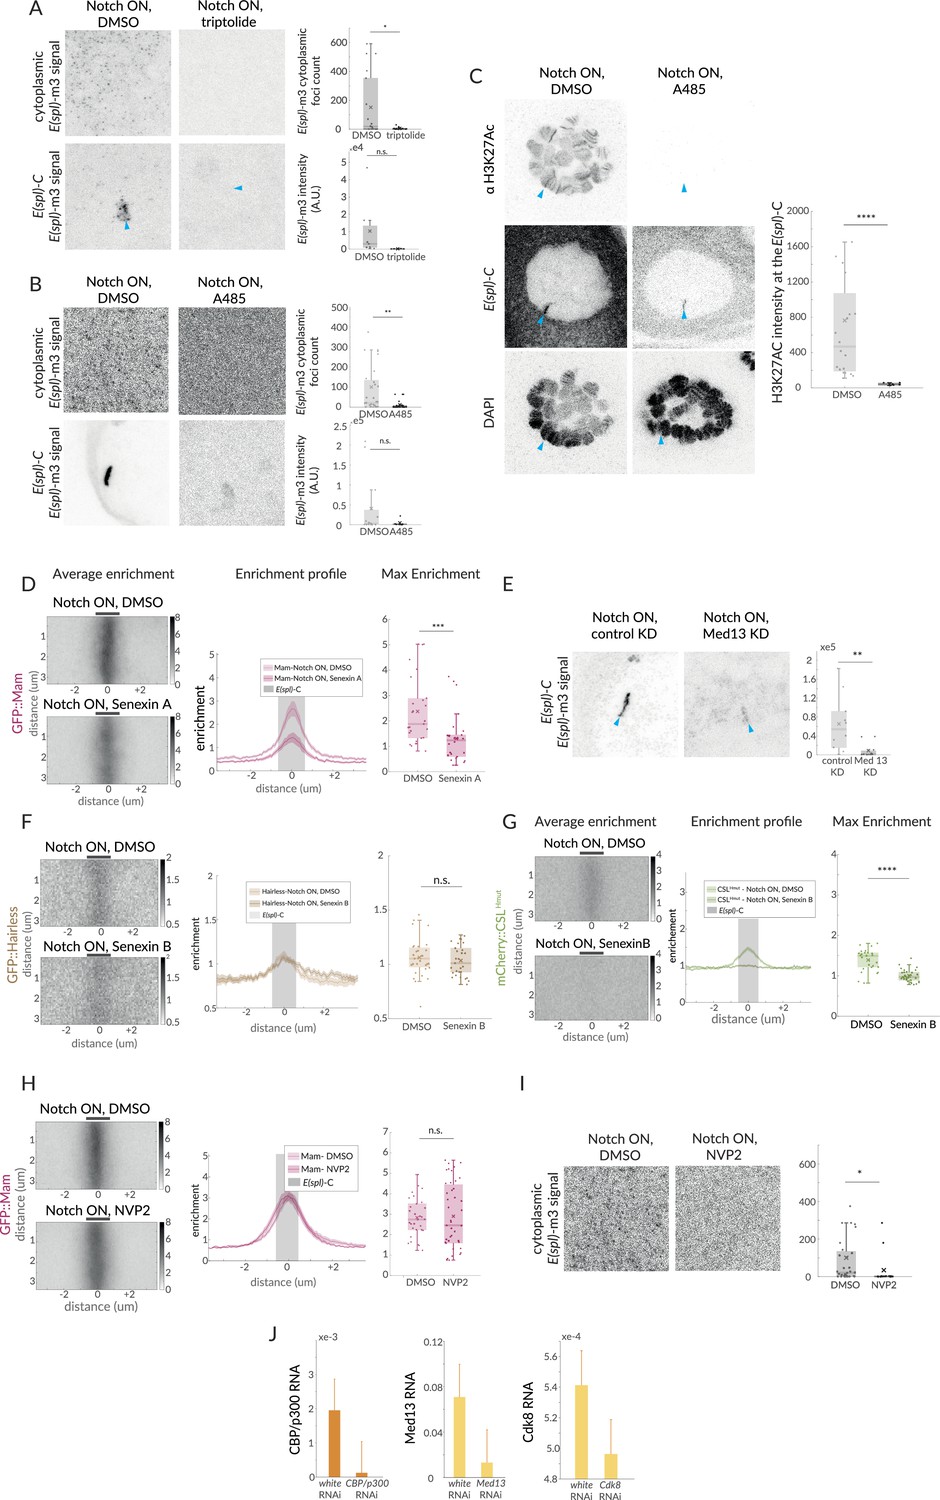
Mediator complex, but not CBP/p300, is involved in Mam enrichment.
(A) Expression of E(spl)-m3, detected by single molecule fluorescent in situ hybridisation (smFISH), is lost upon triptolide treatment in Notch ON cells. Representative images show number of cytoplasmic RNA puncta in the volume sampled (n = 18, 16 for DMSO, triptolide) and intensity at the E(spl)-C (indicated by blue arrow for triptolide, n = 9, 8 for DMSO, triptolide). p-Values provided in Supplementary file 1—Table 4. (B) Expression of E(spl)-m3, detected by smFISH, is lost upon A485 treatment in Notch ON cells. Representative images show the number of cytoplasmic RNA puncta in the volume sampled (n = 31, 22 for DMSO, A485) and intensity at the E(spl)-C (n = 13, 6 for DMSO, A485). (C) Representative images of H3K27Ac staining in Notch ON glands treated with DMSO and A485. H3K27Ac (top row) is lost throughout the nucleus and at E(spl)-C (blue arrows, middle row). Quantification of H3K27Ac levels at E(spl)-C (n = 19, 6 for DMSO and A485). p-Values provided in Supplementary file 1—Table 4. (D) Average, profile, and max enrichment of Mam in Notch ON cells, treated with DMSO or Senexin A (n = 27, 26 for DMSO and Senexin). p-Values provided in Supplementary file 1—Table 4. (E) Expression of E(spl)-m3, detected by smFISH, is lost in the Med13 KD in Notch ON cells compared to control KD (white RNAi). Representative images from the nucleus (centred on E(spl)-C, blue arrow) and quantification of intensity with boxplots, as described in Figure 1B (n = 10, 11 for control KD and Med13 KD). (F) Average, profile, and max enrichment of Hairless in Notch ON cells, treated with DMSO or Senexin B (n = 31, 28 for DMSO and Senexin B). All p-values provided in Supplementary file 1—Table 4. (G) Average, profile, and max enrichment of CSLHmut in Notch ON nuclei, treated with DMSO or Senexin B (n = 27, 31 for DMSO and Senexin B). All p-values provided in Supplementary file 1—Table 4. (H) Average, profile, and max enrichment of Mam in Notch ON nuclei, treated with DMSO or NVP2 (n = 30, 43 for DMSO and NVP2). (I) Expression of E(spl-m3), detected by smFISH, is lost upon NVP2 treatment in Notch ON cells. Representative images illustrate density of RNA puncta. (n = 31, 14 for DMSO and NVP2). All p-values provided in Supplementary file 1—Table 4. (J) mRNA levels of nej (CBP/p300), Med13, and Cdk8 in tissues exposed to the respective RNAi or to control RNAi, measured by RT-qPCR and normalised to RPL32.
Figure 4 with 1 supplement
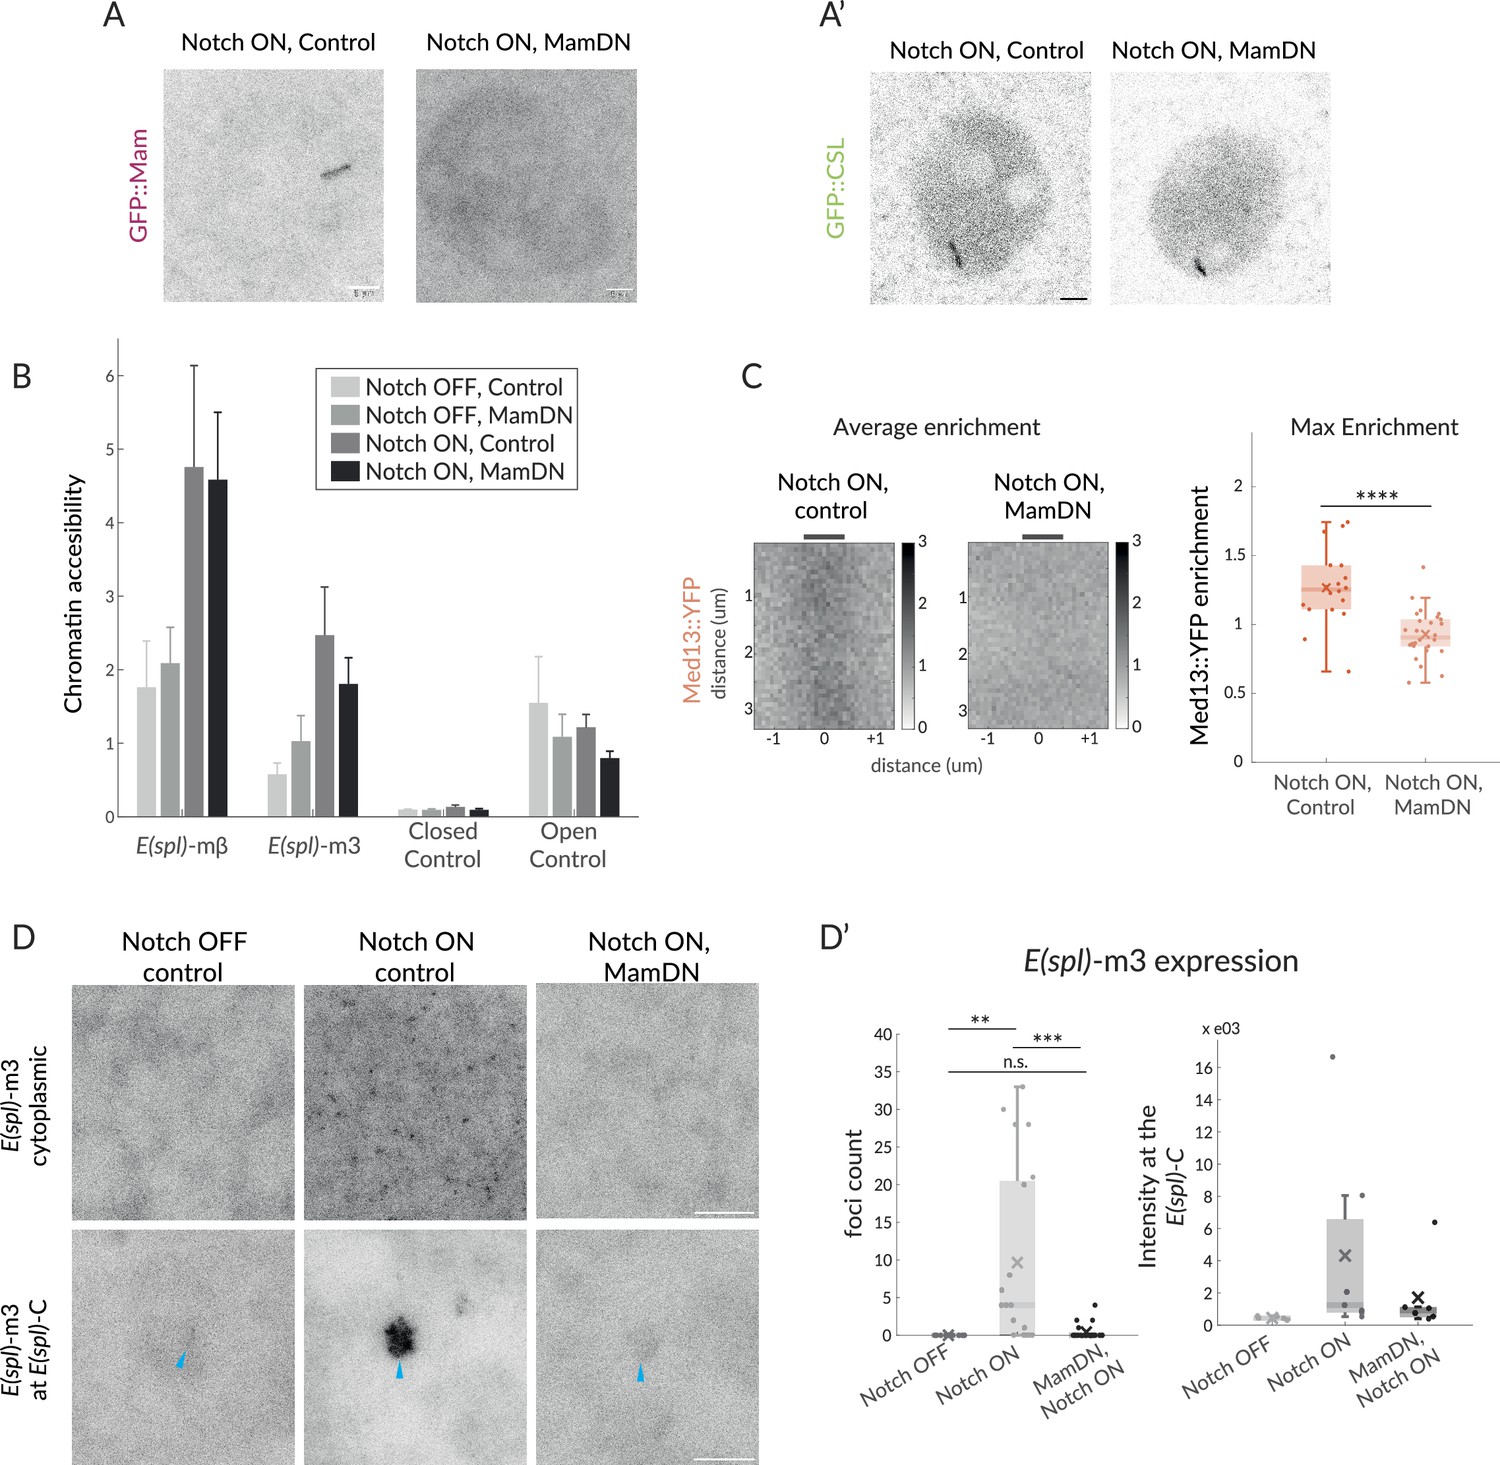
Mam is not necessary for CSL enrichment and chromatin opening but necessary for transcription and Mediator 13 enrichment.
(A–A’) Recruitment of GFP::Mam in Notch ON nuclei is perturbed by MamDN (1151-Gal4 UAS-MamDN) (A) while recruitment of GFP::CSL is unaffected (A'). Control UAS was included in Notch ON combinations, details of genotypes are provided in Supplementary file 1—Table 3. Scale bars represent 5 µm. (B–B’) Accessibility of Notch-regulated enhancers adjacent to E(spl) -mβ and E(spl) -m3 under the conditions indicated was probed using ATAC-qPCR. Values were normalised to Rab11, error bars represent SEM. Closed control is a noncoding genomic region in chromosome 3 and open control’ Eip78, an ecdysone responsive region active in L3 larval stage. (C) Average enrichment and max enrichment of Med13::YFP at E(spl)-C in Notch ON conditions only, and in combination with MamDN. Quantifications as in Figure 1B, OFF, n = 28, ON, n = 31. For p-values, see Supplementary file 1—Table 4. (D–D’) Expression of E(spl)-m3, detected by smFISH in the conditions indicated; representative images from cytoplasm (upper; 1.8 mm3) and nucleus (lower; centred on E(spl)-C, blue arrows). Scale bars represent 5 µm. Graphs (D’), number of RNA puncta (cytoplasmic, n = 18, 20, and 22) and locus intensity (nucleus, n = 6, 7, and 6) in Notch OFF, Notch ON ctrl, and Notch ON MamDN as indicated; boxplots as described in Figure 1B.
Figure 4—figure supplement 1

Mam perturbations do not affect CSL or IDR enrichment.
(A) Representative GFP::CSL images at the E(spl)-C in Notch ON nuclei exposed to ctrl (y-RNAi) or Mam-RNAi. Scale bars represent 5 µm. (B) GFP::NICD[PEST-IDR] average enrichment and profile in Notch ON nuclei exposed to control (lacZ) or Mam[DN] expression. Images were centred on E(spl)-C, lower left(n = 25, 28 for ctrl and Mam[DN)]. p-Values provided in Supplementary file 1—Table 4.
Figure 5 with 1 supplement
Effects of Notch withdrawal on hub composition imply memory state.
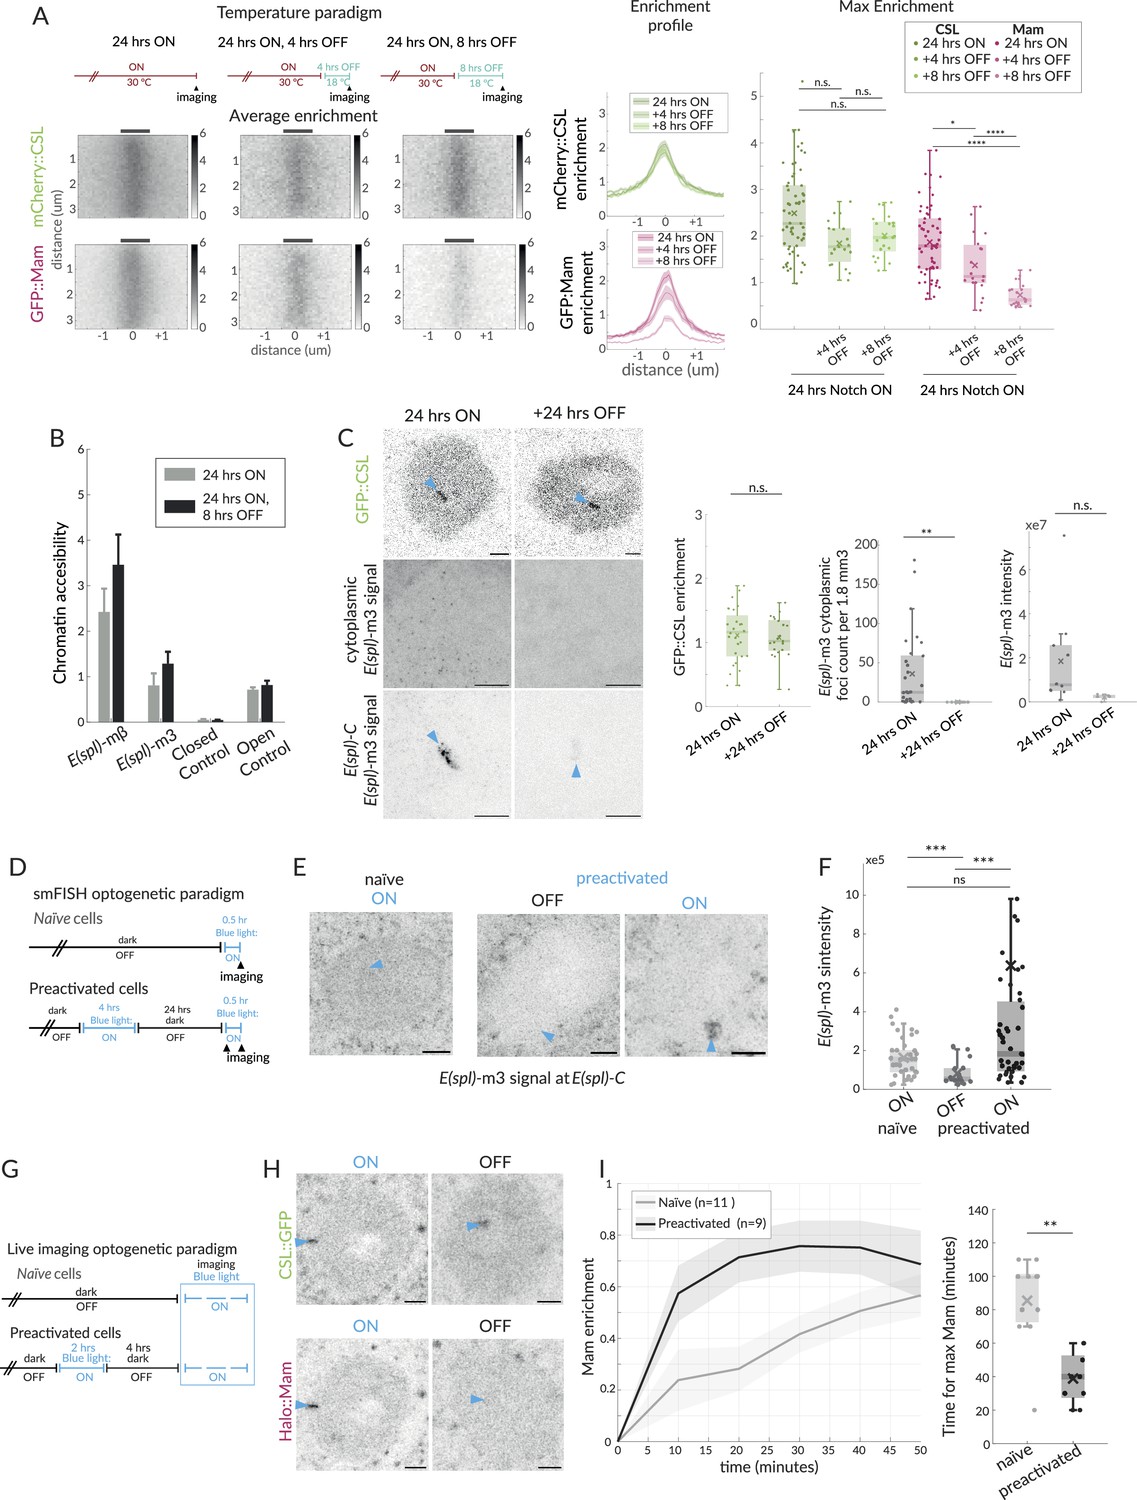
(A) Temperature paradigm: withdrawal of Notch activity using the thermosensitive Gal4/Gal80ts system; after a 24 hr ON period, larvae were transferred to 18C (Gal4 inhibited) for the indicated periods (top) and enrichment of mCherry::CSL and GFP::Mam at E(spl)-C imaged. Average enrichment, enrichment profiles, and max enrichment quantified as in Figure 1B. 24 hr ON, n = 28, 24 hr ON, 4 hr OFF, n = 21, 24 hr ON, 8 hr OFF, n = 19. p-Values are summarised in Supplementary file 1—Table 4. (B) Accessibility of enhancers at E(spl) -mβ and E(spl) -m3, in Notch ON and after Notch withdrawal (8 hr) was probed using ATAC-qPCR, as in Figure 4B. (C) Recruitment of CSL::GFP and expression of E(spl)-m3, detected by single molecule fluorescent in situ hybridisation (smFISH) in the conditions indicated. Robust recruitment of CSL::GFP at E(spl)-C persists after switching to none-permissive temperature (Notch OFF) for 24 hr, representative image and graph (green) with intensity quantifications for multiple nuclei (24 hr ON, n = 28, +24 hr OFF, n = 21). For smFISH, representative images from cytoplasm (upper; 1.8 mm3) and nucleus (lower; centred on E(spl)-C, blue arrow) are shown; scale bars represent 5 µm. RNA puncta are absent after 24 hr Notch OFF. Graphs show the number of cytoplasmic RNA puncta (left) from n = 30, 16 regions and RNA fluorescence intensity at E(spl)-C in the conditions indicated from n = 10, 5 nuclei, with boxplots as described before (Figure 1B). p-Values in Supplementary file 1—Table 4. (D) Optogenetic paradigm used for smFISH: Conditions used to switch ON and OFF Notch activity using OptiC Notch (Townson et al., 2023). (E, F) Expression of E(spl)-m3, detected by smFISH in the conditions indicated. (E) Representative images from the nucleus (centred on E(spl)-C, blue arrows). Scale bars represent 5 µm. (F) Graphs for fluorescence intensity at E(spl)-C in the conditions indicated from n = 38, 21, and 43 nuclei, with boxplots as described before (Figure 1B). p-Values in Supplementary file 1—Table 4. (G) Optogenetic paradigm used for live imaging: conditions used to switch ON and OFF Notch activity using OptiC Notch (Townson et al., 2023). (H) Recruitment of CSL::GFP and Mam::Halo at E(spl)-C, measured following blue light activation in OptiC Notch expressing tissues for 2 hr (ON) and after 4 hr in dark (OFF). GFP::CSL remains enriched, Halo::Mam is depleted. (I) Recruitment of Halo::Mam in preactivated nuclei compared to naïve nuclei; temporal profile of Mam::Halo enrichment (right) and time taken to max enrichment (left). Error bars in the profile represents the SEM, values were normalised from 0 to 1 (similar to FRAP recovery, see Figure 1 and ‘Materials and methods’), n indicates the number of nuclei from >3 salivary glands. Boxplot parameters as in Figure 1B; naïve, n = 11, preactivated n = 9.
Figure 5—figure supplement 1
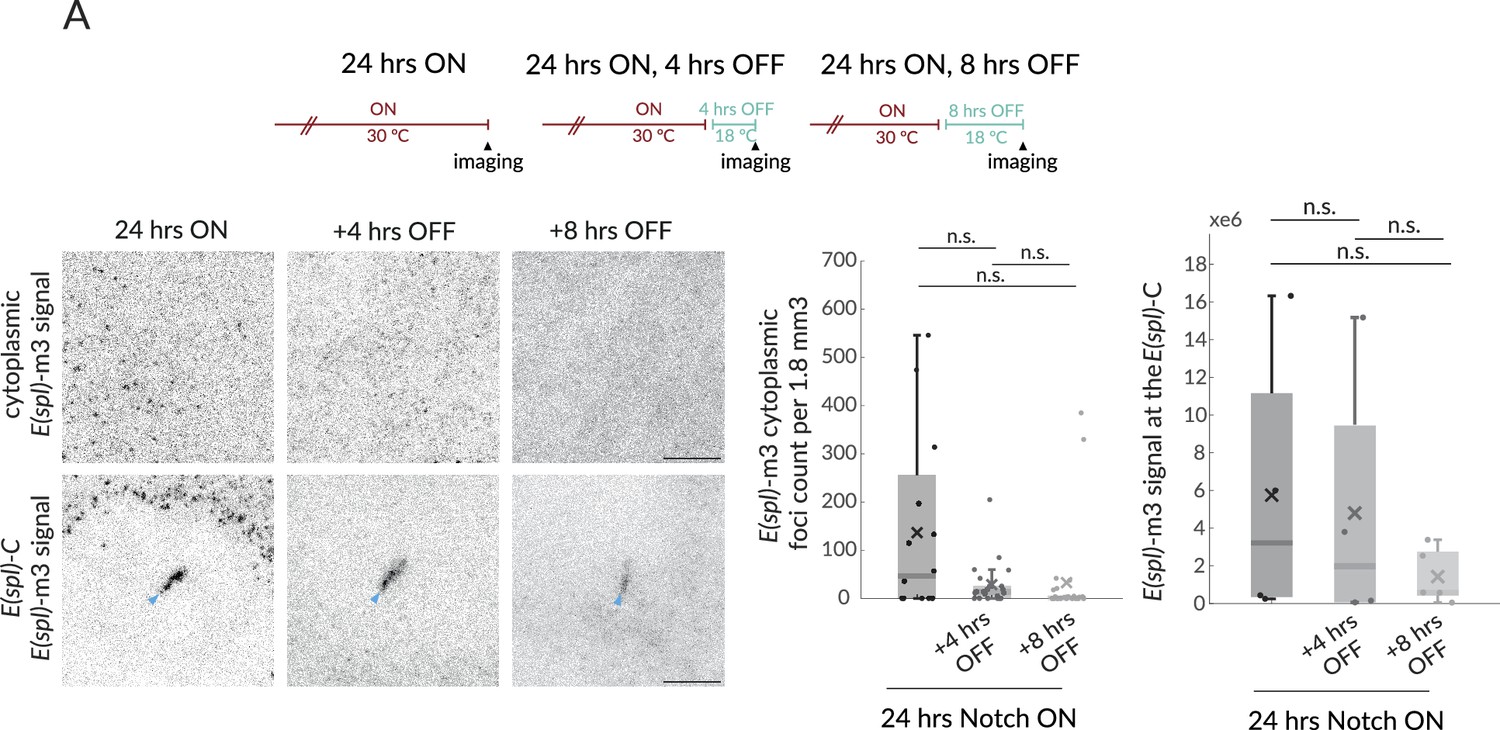
Notch deactivation leads to loss of E(spl)-m3 transcription.
(A) Cartoon depicts temperature paradigm, similar to Figure 5A. Expression of E(spl)-m3 in the conditions indicated, detected by fluorescent in situ hybridisation (smFISH). Upper panels show representative cytoplasmic sections (1.8 mm3) and lower signal at the E(spl)-C. (n = 22, 30,30) for cytoplasmic 24 hr ON, 24 hr ON + 4 hr OFF and 24 hr ON + 8 hr OFF; n = 4, 4, 4 for nuclear 24 hr ON, 24 hr ON + 4 hr OFF and 24 hr ON + 8 hr OFF. p-Values provided in Supplementary file 1—Table 4.
Figure 6 with 1 supplement
Recruitment of Pol II and Med1 in Notch ON is infrequent and augmented by ecdysone.
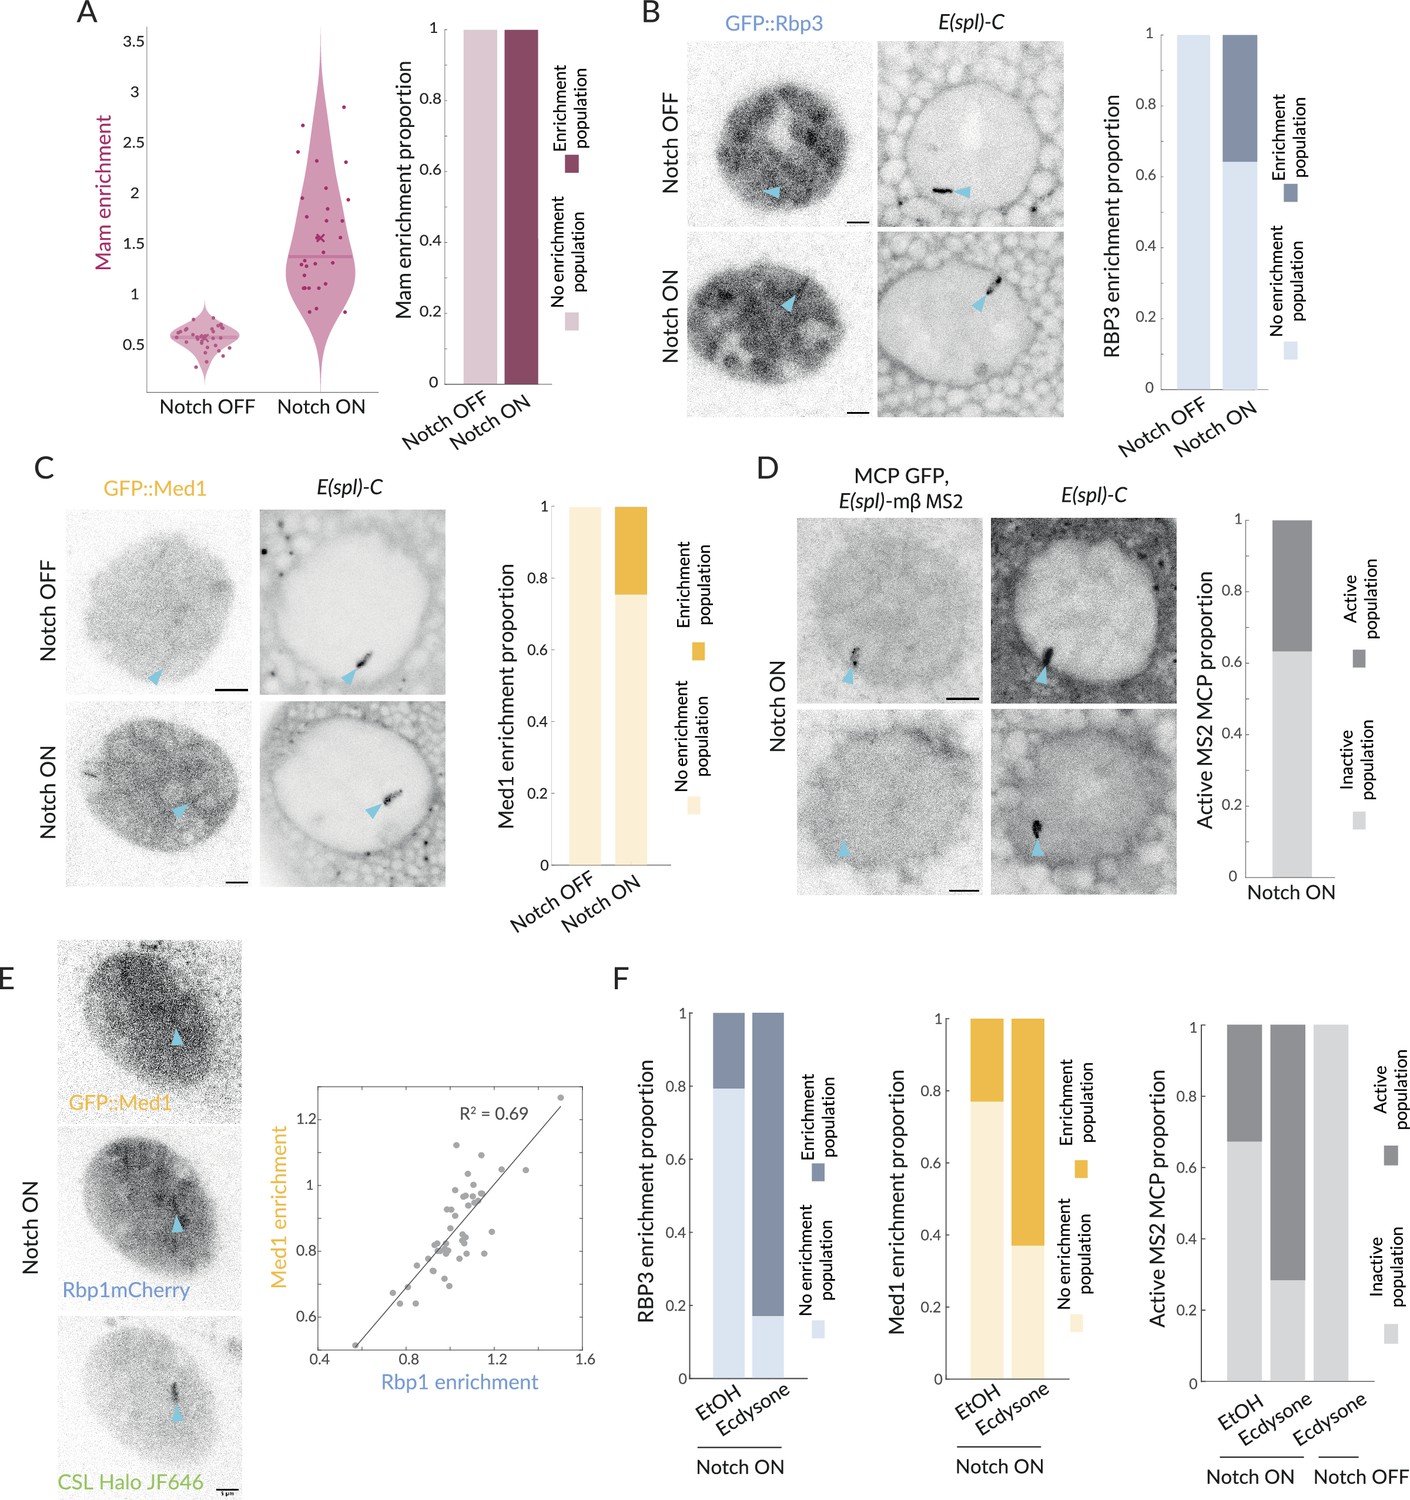
(A) GFP::Mam enrichment at E(spl)-C in Notch OFF and Notch ON conditions as in Figure 1, represented with a violin plot with mean marked by a cross and median by a bar. Right graph: proportions of nuclei with significant enrichment (obtained by performing a Gaussian fit on the fluorescence intensity Images, see Figure 6—figure supplement 1). Over 90% nuclei have significant enrichment (Notch OFF, n = 32, Notch ON, n = 30). (B) Recruitment of GFP::Rbp3, a subunit of Pol II, at E(spl)-C in Notch OFF and Notch ON nuclei. Images: example where enrichment is detected. Graph: proportions of nuclei with significant enrichment as in (A) (Notch OFF, n = 37, Notch ON, n = 43). All scale bars represent 5 µm. (C) Recruitment of GFP::Med1 at E(spl)-C in Notch OFF and Notch ON nuclei. Images: example where enrichment is detected. Graph: proportions of nuclei with significant enrichment as in (A) (Notch OFF and ON, n = 38, 62). All scale bars represent 5 µm. (D) Transcriptional activity in Notch ON cells detected using live imaging of GFP::MCP recruited to MS2 loops in transcripts produced by E(spl)bHLHmβ (see ‘Materials and methods’). Images: representative examples of active (upper) and inactive (lower) nuclei. Graph: Proportion of active nuclei (Notch ON, n = 53). (E) Recruitment of GFP::Med1, mCherry::Rbp1, and Halo::CSL. Med1 and Rbp1 recruitments are correlated. Images: example of co-recruitment of Med1, Rbp1, and CSL. Graph: correlation plot of max enrichment per nucleus at E(spl)-C, (marked by Halo::CSL recruitment), n = 48. (F) Pre-treatment with ecdysone in Notch ON conditions increases proportions of nuclei with recruitment of GFP::Rbp3, GFP::Med1 and with active transcription foci (MS2/MCP intensity) compared to controls (EtOH). Proportions of nuclei with significant enrichment defined as in (A). Rbp3 ctrl, ecdysone: n = 39, 36. Med1 ctrl, ecdysone: n = 34, 34. MS2 ON ctrl, ON ecdysone, OFF ecdysone: n = 52, 42, 22.
Figure 6—figure supplement 1
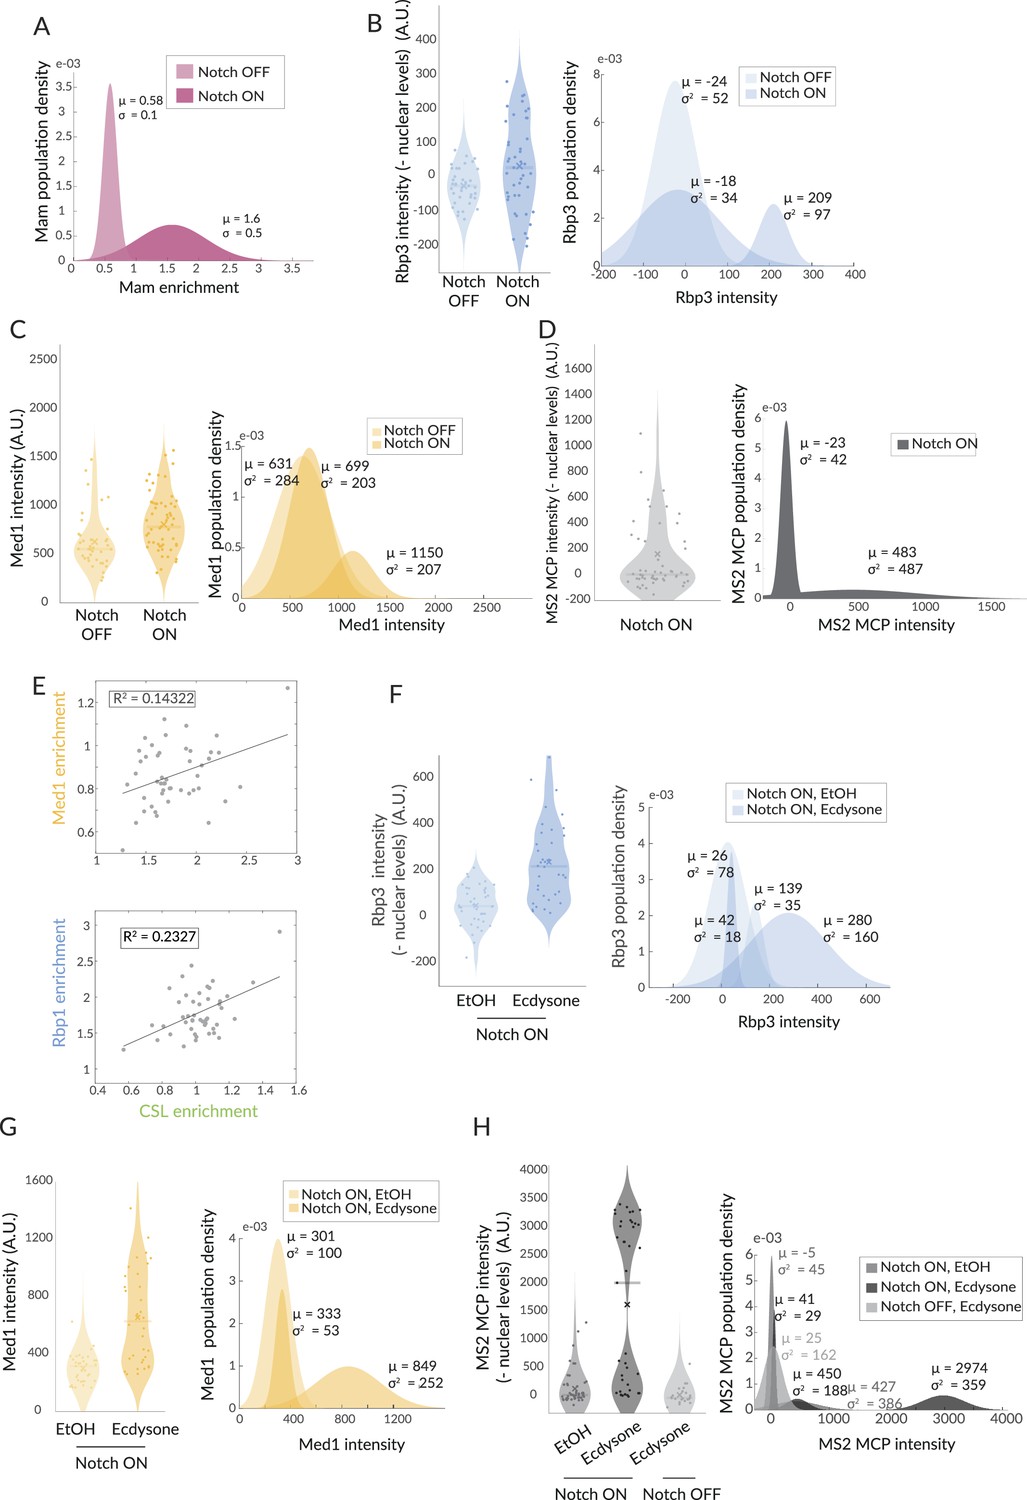
Population fitting reveals infrequent enrichment of Pol II and Med1 but is augmented by ecdysone treatment.
(A–D, F–H) Gaussian fitting of Mam enrichment data from Figure 1 and of Rbp3, Med1, and MS2 in the indicated conditions. Violin plots show the distribution of the data with dots depicting intensity or enrichment per nucleus, x average and bar median. μ indicates population average and σ the standard deviation. (E) Correlation of GFP::Med1 and Halo::CSL, mCherry::Rbp1 and Halo::CSL.
Figure 7

Model illustrating different modes of Notch transcription hub.
In the absence of Notch activity (Notch OFF), target genes are inactive, CSL is complexed with co-repressors (e.g. Hairless). Following Notch activation (Notch ON), released Notch Intra Cellular Domain (NICD) (purple) generates a localised high concentration of transcription factors around target enhancer(s) referred to as a ‘hub’ (pink). Open hub: CSL (green) recruitment and accessible chromatin can occur in the absence of Mam. Engaged hub: presence of Mam (magenta) favours recruitment of additional factors, including Mediator CDK8 module (orange). Active hub: productive transcription, transition to this mode, with core Mediator (orange) and Pol II (pale blue) enrichment, is stochastic (dotted arrow). The probability can be enhanced by secondary signal, such as provided by ecdysone. Memory hub: CSL enrichment and chromatin accessibility remain after withdrawal of NICD.
Tables
Key resources table
| Reagent type (species) or resource | Designation | Source or reference | Identifiers | Additional information |
|---|---|---|---|---|
| Genetic reagent (Drosophila melanogaster) | eGFP::CSL | Gomez-Lamarca et al., 2018 | FBgn0004837 | Genomic fragment insertion attP86Fb (RRID:BDSC24749) |
| Genetic reagent (D. melanogaster) | Halo::CSL | Townson et al., 2023 | FBgn0004837 | Genomic fragment insertion attP86Fb |
| Genetic reagent (D. melanogaster) | eGFP::Hairless | Gomez-Lamarca et al., 2018 | FBgn0001169 | Genomic fragment insertion attP51D |
| Genetic reagent (D. melanogaster) | Hairless::Halo | Baloul et al., 2024 | FBgn0001169 | Genomic fragment insertion attP51D |
| Genetic reagent (D. melanogaster) | sfGFP::Mam | This paper | FBgn0002643 | CRISPR of Mam locus |
| Genetic reagent (D. melanogaster) | Halo::Mam | This paper | FBgn0002643 | CRISPR of Mam locus |
| Genetic reagent (D. melanogaster) | Med13::YFP | Bloomington Drosophila Stock Center | RRID:BDSC_57899 | |
| Genetic reagent (D. melanogaster) | eGFP::Rbp3 | Cho et al., 2022 | CRISPR of Rbp3 locus | |
| Genetic reagent (D. melanogaster) | mCherry::Rbp1 | Cho et al., 2022 | CRISPR of Rbp1 locus | |
| Genetic reagent (D. melanogaster) | UAS-Hairless-RNAi | Bloomington Drosophila Stock Center | RRID:BDSC_27315 | Line used in: Gomez-Lamarca et al., 2018 |
| Genetic reagent (D. melanogaster) | UAS-Mam-RNAi | Bloomington Drosophila Stock Center | RRID:BDSC_28046 | Line used in: Gomez-Lamarca et al., 2018; Lobo-Pecellín et al., 2019; Jia et al., 2016 |
| Genetic reagent (D. melanogaster) | UAS-Med13-RNAi | Bloomington Drosophila Stock Center | RRID:BDSC_34630 | Line used in: Ren et al., 2022 |
| Genetic reagent (D. melanogaster) | UAS-nejire-RNAi | Vienna Resource Center | KK10288 | |
| Genetic reagent (D. melanogaster) | UAS-Cdk8-RNAi | Li et al., 2020 | ||
| Genetic reagent (D. melanogaster) | UAS-Mam[DN] | Bloomington Drosophila Stock Center Helms et al., 1999 | ||
| Genetic reagent (D. melanogaster) | UAS-Cry2-TevC | Bloomington Drosophila Stock Center Townson et al., 2023 | Insertion attP51C | |
| Genetic reagent (D. melanogaster) | UAS-OptIC-Notch{ω}[mCherry] | Townson et al., 2023 | Insertion attP40 | |
| Genetic reagent (D. melanogaster) | E(spl)-mβ-HLH-MS2-LacZ | This paper, modified from Boukhatmi et al., 2020 | FBgn0002733 | CRISPR of E(spl)-mβ |
| Chemical compound, drug | Triptolide | Sigma-Aldrich | T3652 | Used at 10 µM |
| Chemical compound, hormone | Ecdysone | Cayman Chemicals | 16145 | Used at 5 µM |
| Chemical compound, drug | Senexin A | Tocris | 4875 | Used at 1 µM |
| Chemical compound, drug | Senexin B | Cayman Chemicals | 24119 | Used at 2 µM |
| Commercial assay or kit | Tagmentation kit | Illumina | FC-121-1030 | |
| Software, algorithm | MATLAB | MathWorks | MATLAB R2022b |
Additional files
-
Transparent reporting form
- https://cdn.elifesciences.org/articles/92083/elife-92083-transrepform1-v1.docx
-
Supplementary file 1
Genomic coordinates and oligonucleotides used for CRISPR, constructs, and qPCR (Table 1).
Summary of Drosophila strains (Table 2). Genetic combinations for each figure (Table 3). p-values from statistical tests (Table 4).
- https://cdn.elifesciences.org/articles/92083/elife-92083-supp1-v1.docx
Download links
A two-part list of links to download the article, or parts of the article, in various formats.
Downloads (link to download the article as PDF)
Open citations (links to open the citations from this article in various online reference manager services)
Cite this article (links to download the citations from this article in formats compatible with various reference manager tools)
Dynamic modes of Notch transcription hubs conferring memory and stochastic activation revealed by live imaging the co-activator Mastermind
eLife 12:RP92083.
https://doi.org/10.7554/eLife.92083.3


