Assembly of neuron- and radial glial-cell-derived extracellular matrix molecules promotes radial migration of developing cortical neurons
- Graduate School of Agriculture, Tokyo University of Agriculture and Technology, Japan
- Graduate School of Bioagricultural Sciences, Nagoya University, Japan
- Faculty of Food and Agricultural Sciences, Fukushima University, Japan
- Kennedy Institute of Rheumatology, University of Oxford, United Kingdom
- Bioscience and Biotechnology Center, Nagoya University, Japan
- Institute for Glyco-core Research, Nagoya University, Japan
- Laboratory of Biochemistry, Kobe Pharmaceutical University, Japan
Figures
Figure 1 with 1 supplement
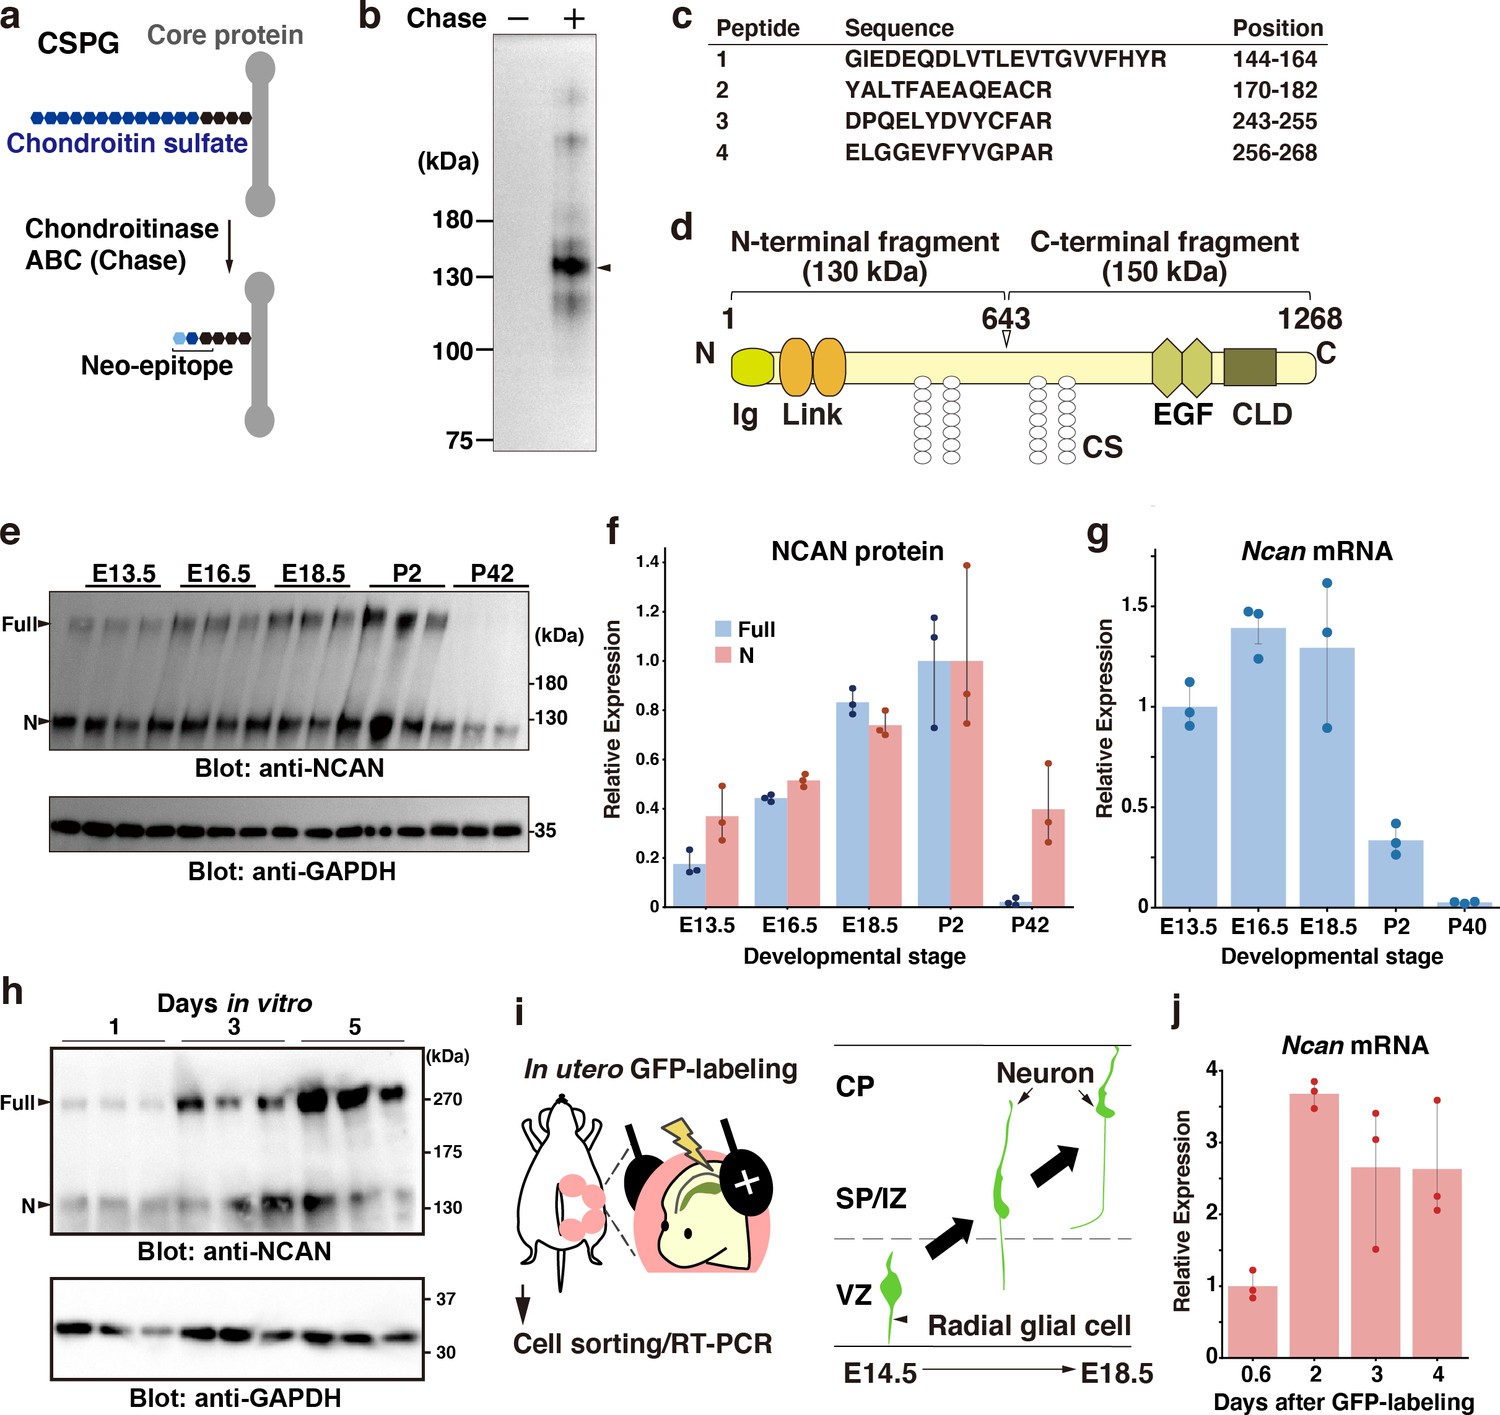
NCAN is a major CSPG produced by developing cortical neurons.
(a) Detection of the neoepitope of CSPGs after digestion with chondroitinase ABC (Chase). (b) Immunoblotting of the neoepitope from undigested (Chase -) and digested (Chase +) cerebral cortex lysates prepared at E18.5. The arrowhead indicates the major CSPG at 130 kDa. (c) List of peptide fragments identified from the 130 kDa band. Positions indicate the amino acid number in full-length NCAN. (d) Domain structure of mouse NCAN. Ig: immunoglobulin-like domain, Link: hyaluronan-binding link module, EGF: epidermal growth factor-like repeat, CLD: C-type lectin domain, CS: chondroitin sulfate chain. (e, f) NCAN expression in the developing cerebral cortex from E13.5 to postnatal day (P) 42. The arrowheads indicate the full-length and N-terminal fragment of NCAN. Values in (f) are normalized to GAPDH and represented relative to P2. N=3 for each point. Mean ± SD. (g) Quantitative RT-PCR analysis of Ncan mRNA in the developing cerebral cortex. Values are normalized to Gapdh and represented relative to E13.5. N=3 for each point. Mean ± SD. (h) Immunoblot analysis of NCAN in the cultured medium of primary cultured cortical neurons 1, 3, and 5 days after plating. (i) Experimental model for in utero labeling. Radial glial cells in the VZ were labeled with GFP on E14.5. GFP-positive cells were isolated 0.6–4 days later. (j) Expression of Ncan mRNA in GFP-labeled cells isolated on the indicated days after in utero electroporation. Values are normalized to Gapdh and represented relative to 0.6 days. N=3 for each point. Mean ± SD.
-
Figure 1—source data 1
Numerical source data and original blots for Figure 1.
- https://cdn.elifesciences.org/articles/92342/elife-92342-fig1-data1-v1.zip
Figure 1—figure supplement 1
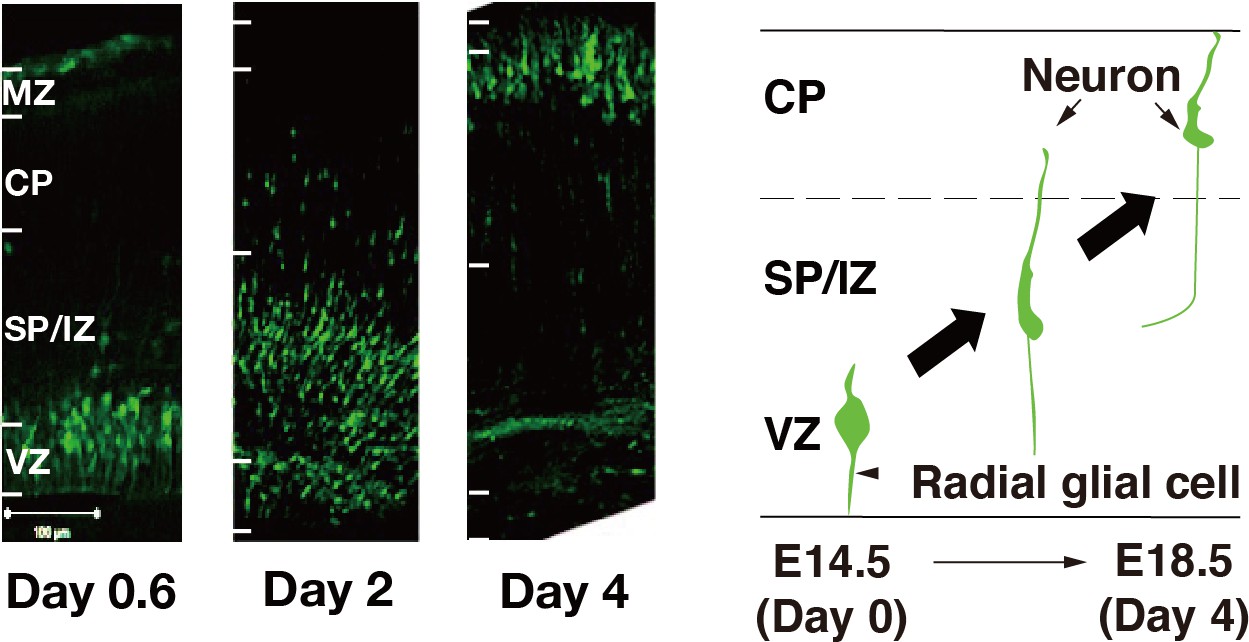
Location of GFP-positive cells 0.6, 2, and 4days after in utero electroporation.
Most GFP-positive cells are in the VZ on day 0.6. GFP-positive cells begin to migrate radially through the SP/IZ on day 2 and reach the CP on day 4. Scale bar represents 100 μm.
Figure 2 with 1 supplement
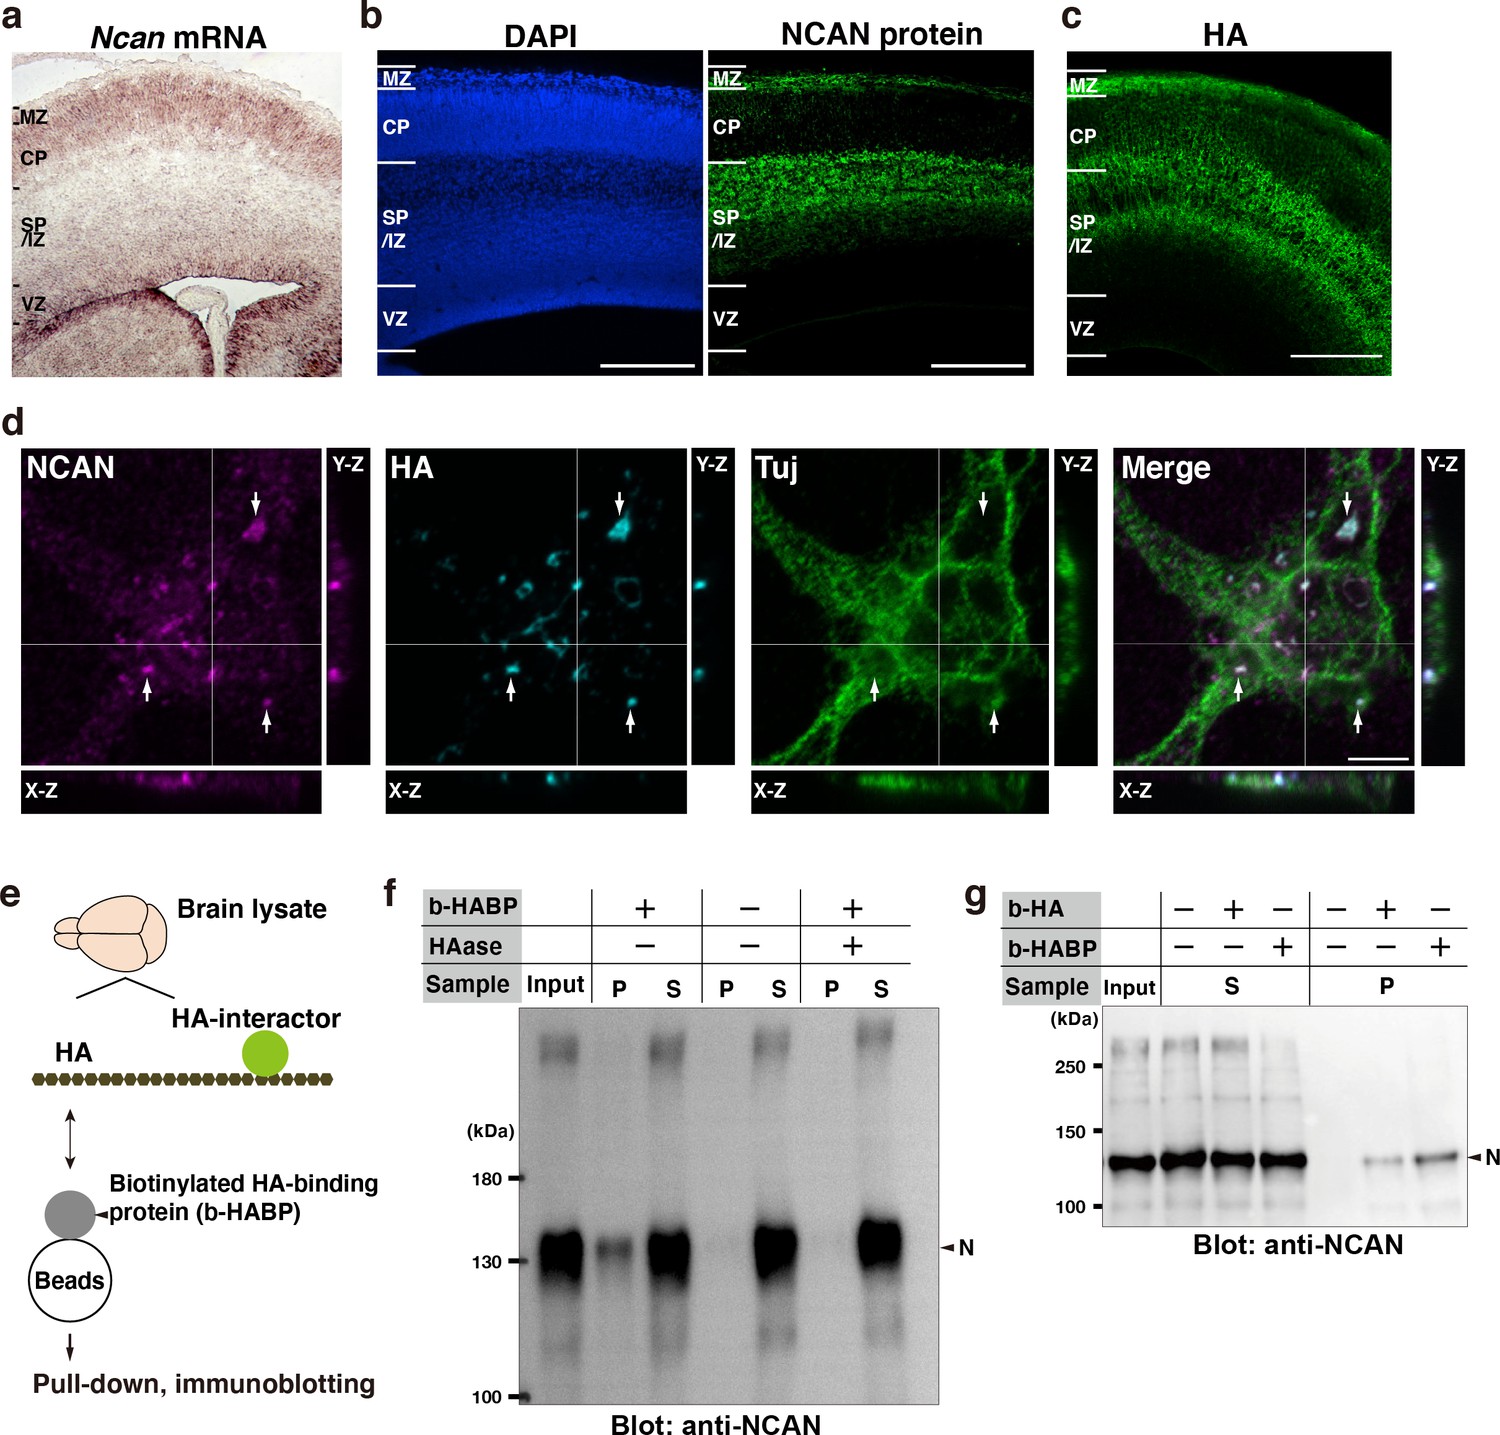
Neuron-derived NCAN forms a pericellular matrix with HA.
(a) In situ hybridization analysis of Ncan mRNA on the E16.5 cerebral cortex. (b) Localization of NCAN protein (green) in the E16.5 cerebral cortex. Nuclei were counterstained with DAPI (blue). (c) Distribution of HA (green) visualized by the biotinylated HA-binding protein (b-HABP) in the E16.5 cerebral cortex. (d) High-magnification views of a Tuj-1-positive primary cultured cortical neuron (green) 5 days after plating. White arrows indicate the co-localization of NCAN (magenta) and HA (cyan). Orthogonal projections in the X-Z and Y-Z planes taken along the white lines showed the localization of NCAN and HA at the adhesion sites between the neuron and culture substrate. (e) Schema of the pull-down assay for analyzing binding between endogenous HA and its interactors. (f) Immunoblotting of the input, precipitate (P), and supernatant (S) with an anti-NCAN antibody. NCAN was precipitated with HA by adding b-HABP (b-HABP +). NCAN was not precipitated without b-HABP (b-HABP -) or after digestion with hyaluronidase (HAase +). (g) Co-precipitation of NCAN with exogenously added biotinylated HA (b-HA +) or endogenous HA (b-HABP +). Scale bars represent 200 μm (a–c) and 5 μm (d).
-
Figure 2—source data 1
Original blots for Figure 2.
- https://cdn.elifesciences.org/articles/92342/elife-92342-fig2-data1-v1.zip
Figure 2—figure supplement 1
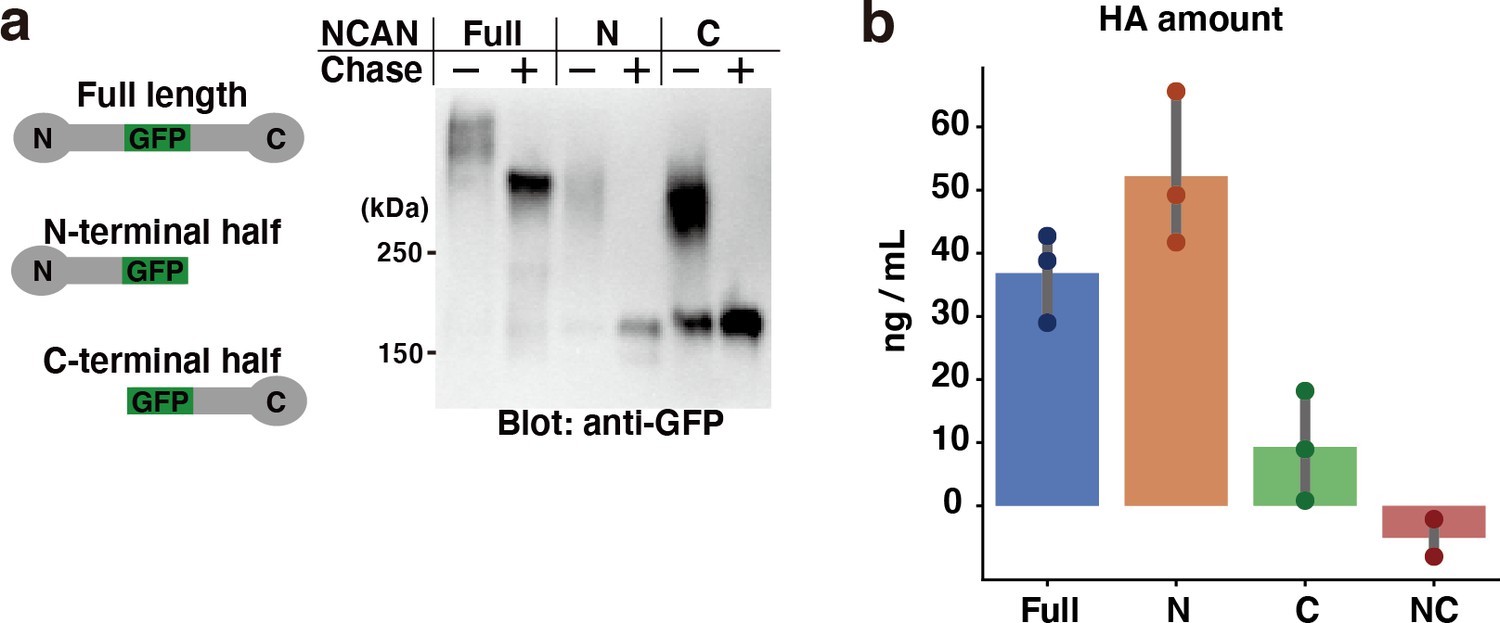
Pull-down assay of HA with recombinant GFP-fused NCAN.
(a) Recombinant expression of GFP-fused full-length, N-terminal, and C-terminal half of NCAN. The culture medium of transfected HEK293 cells was digested with chondroitinase ABC (Chase) and analyzed by immunoblotting with an anti-GFP antibody. (b) Quantification of precipitated HA by the full-length, N-terminal, and C-terminal half of NCAN. A negative control experiment (NC) was conducted without NCAN. N=3 for each point. Mean ± SD.
-
Figure 2—figure supplement 1—source data 1
Numerical source data and original blots for Figure 2—figure supplement 1.
- https://cdn.elifesciences.org/articles/92342/elife-92342-fig2-figsupp1-data1-v1.zip
Figure 3
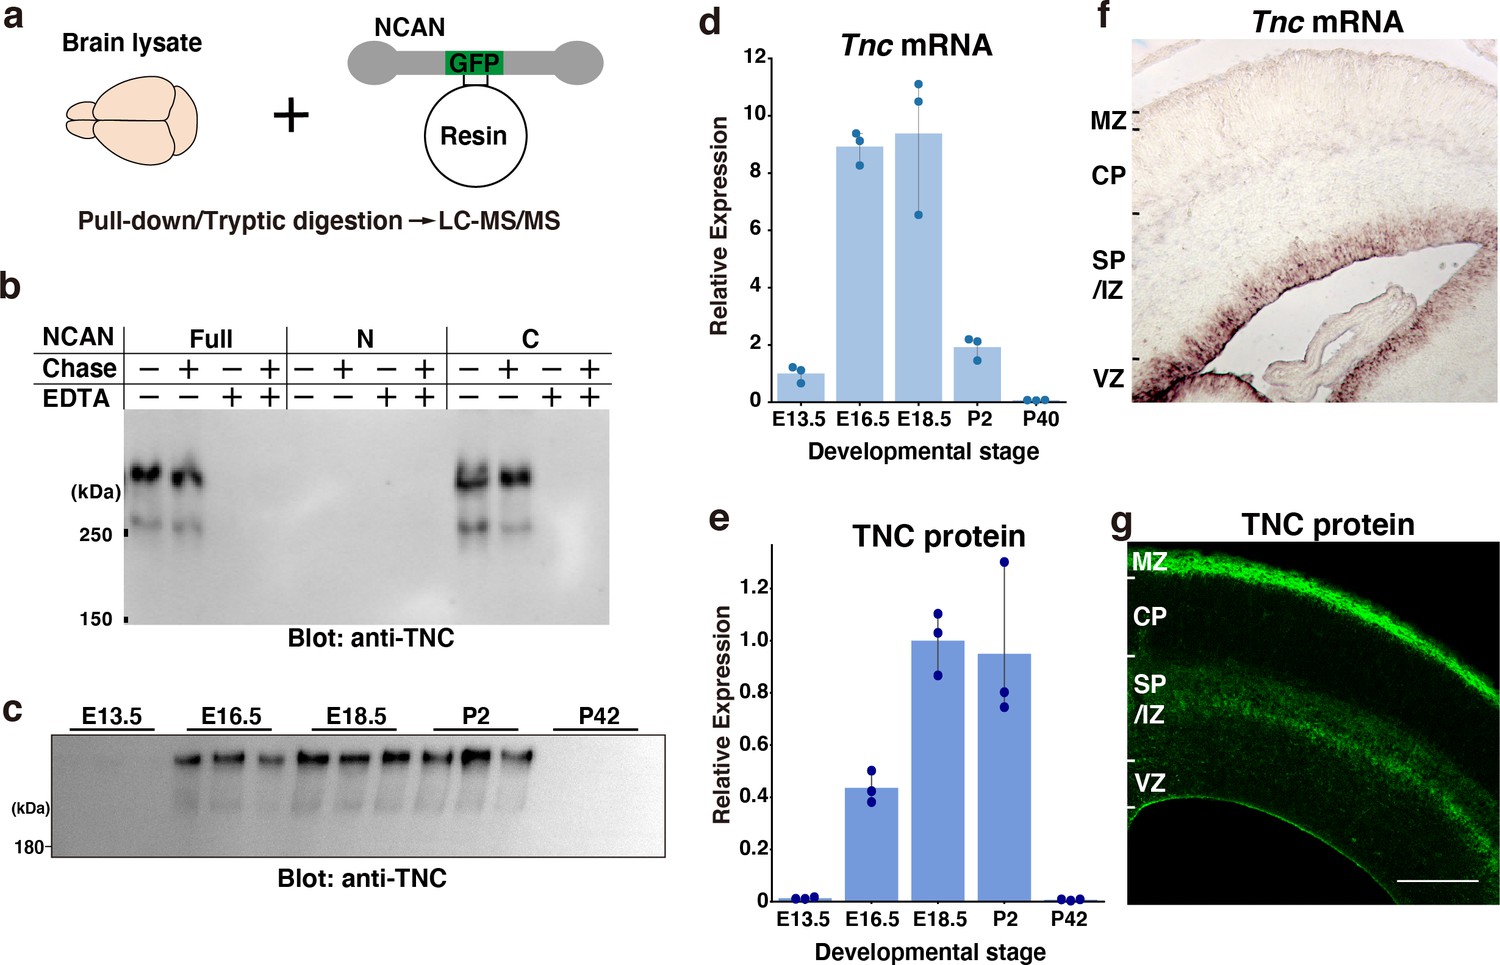
Screening of the interacting partners of NCAN.
(a) Schematic of the pull-down assay to identify NCAN-interacting partners. (b) Co-precipitation of TNC with the full-length and C-terminal half of NCAN. Interactions between NCAN and TNC disappeared following the addition of EDTA but were not affected by Chase digestion. The N-terminal half of NCAN did not bind to TNC. (c, e) TNC expression in the developing cerebral cortex from E13.5 to postnatal day (P) 42. Values in (e) are normalized to GAPDH and represented relative to E18.5. The same brain lysate as in Figure 1e were analyzed. The values for GAPDH were calculated based on the data presented in Figure 1e. N=3 for each point. Mean ± SD. (d) Quantitative RT-PCR analysis of Tnc mRNA in the developing cerebral cortex. Values are normalized to Gapdh and represented relative to E13.5. N=3 for each point. Mean ± SD. (f, g) In situ hybridization analysis of Tnc mRNA (f) and immunohistochemical localization of TNC protein (g) in the E16.5 cerebral cortex. Scale bar represents 200 μm.
-
Figure 3—source data 1
Numerical source data and original blots for Figure 3.
- https://cdn.elifesciences.org/articles/92342/elife-92342-fig3-data1-v1.zip
Figure 4 with 1 supplement
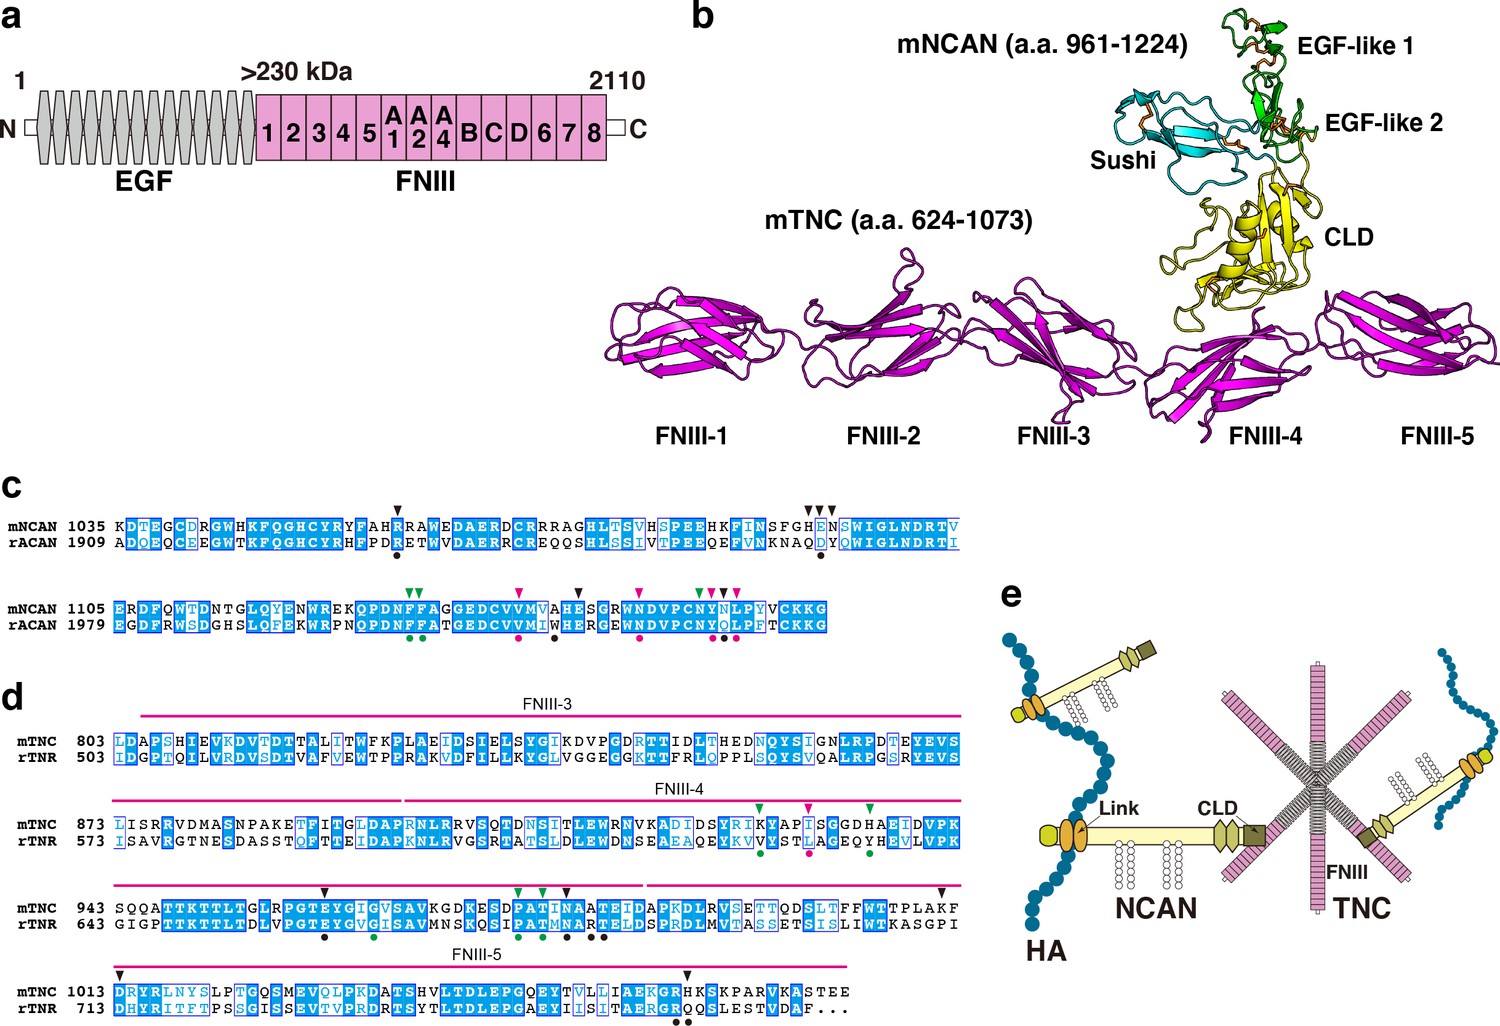
Alphafold2 prediction of the NCAN-TNC complex.
(a) Domain structure of mouse (m) TNC. EGF: epidermal growth factor-like repeat, FNIII: fibronectin type-III domain. (b) Five predicted complex models of the mNCAN and mTNC were generated using AlphaFold2 multimer implemented in ColabFold, and the best-predicted complex was shown. (c, d). Sequence alignments of CLD of mNCAN and rat (r) ACAN (c) and FNIII-3–5 of mTNC and rTNR (d). Circles under alignments indicate the key residues of the rACAN-rTNR complex. Triangles over alignments indicate the residues in the interface of mNCAN-mTNC. Green and magenta circles/triangles are the residues involved in the interaction between L4 loop of CLD and βC, F, G strands of FNIII-4 and β6, 7 strands of CLD and CC’ loop of FNIII-4, respectively. Black circles/triangles indicate residues involved in the interaction between CLD and FNIII-4–5 linker region/FG loop of FNIII-5. (e) Model for forming the ternary complex of NCAN, HA, and TNC.
Figure 4—figure supplement 1
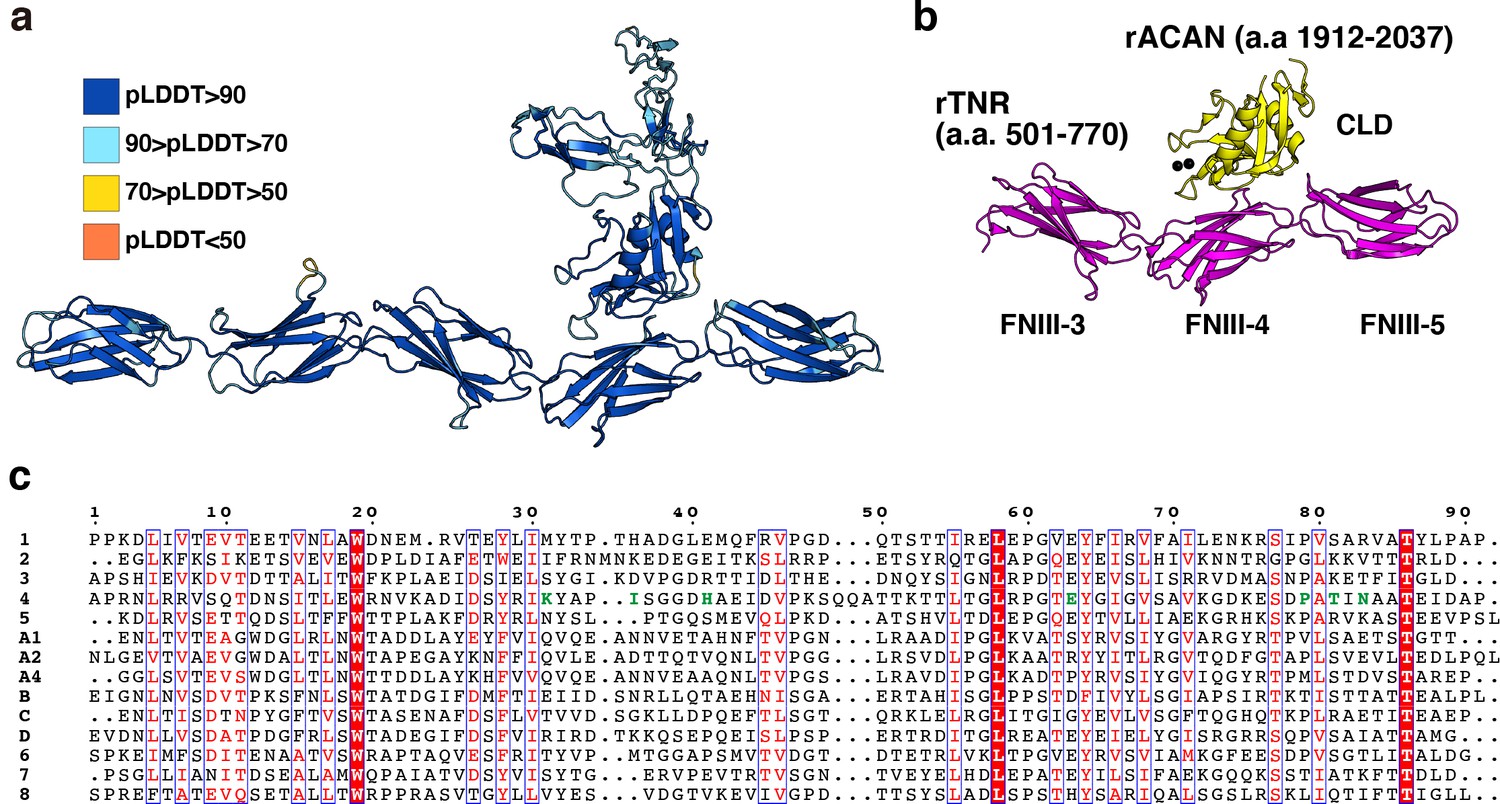
Alphafold2 prediction of NCAN-TNC complex.
(a) Model confidence of NCAN-TNC complex. Each residue is colored by pLDDT score, and a high pLDDT score indicates high accuracy. (b) Crystal structure of rat (r) ACAN-TNR complex (PDB ID: 1TDQ). Each domain is colored the same as in Figure 4c. (c) Sequence alignments of fourteen FNIII of mTNC. Green letters indicate residues involved in the interaction between FNIII-4 and CLD of NCAN.
Figure 5
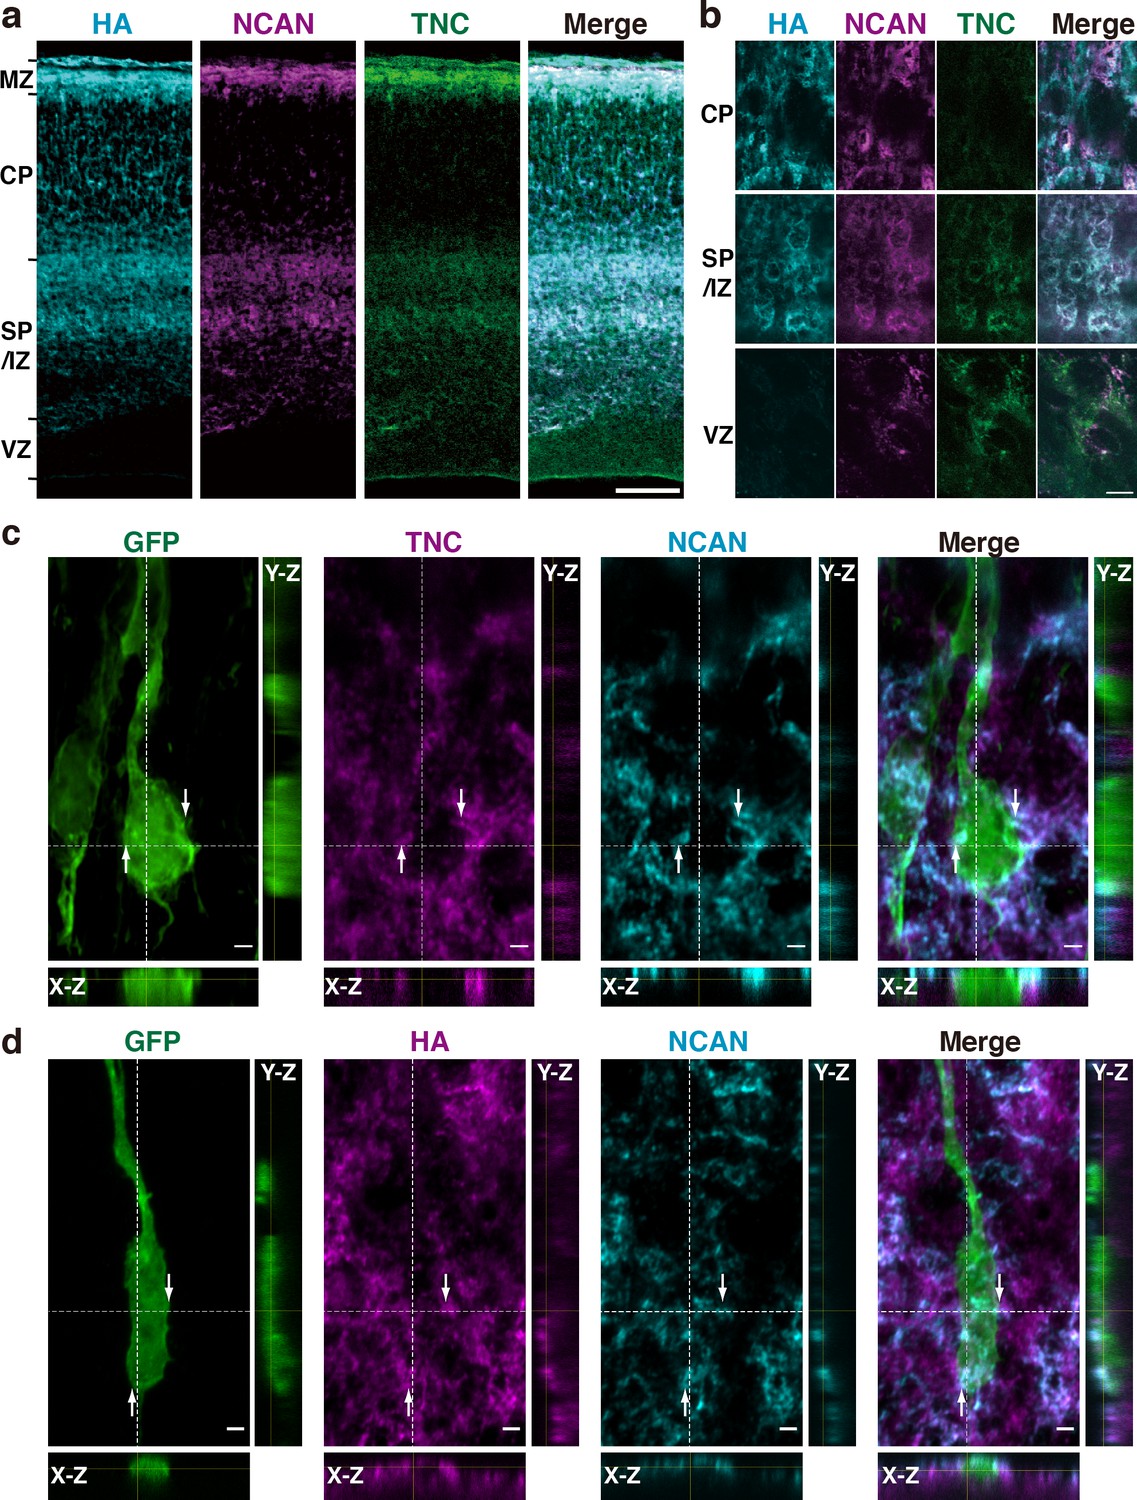
HA, NCAN, and TNC form the ternary complex in the developing cerebral cortex.
(a) Triple staining of the E17.5 mouse cerebral cortex with HA (cyan), NCAN (magenta), and TNC (green). (b) High-magnification images show the co-localization of the three components in the upper part of the SP/IZ but not in the CP or VZ. (c, d) Localization of TNC (c, magenta), NCAN (c, d, cyan), and HA (d, magenta) around GFP-labeled bipolar neurons (green) in the upper SP/IZ at E17.5, 3 days after in utero labeling. Orthogonal views taken along the white dashed lines showed the contact between the ternary complex and the surface of bipolar neurons, as indicated by the arrows. Scale bars represent 100 μm (a), 5 μm (b), and 2 μm (c, d).
Figure 6 with 4 supplements
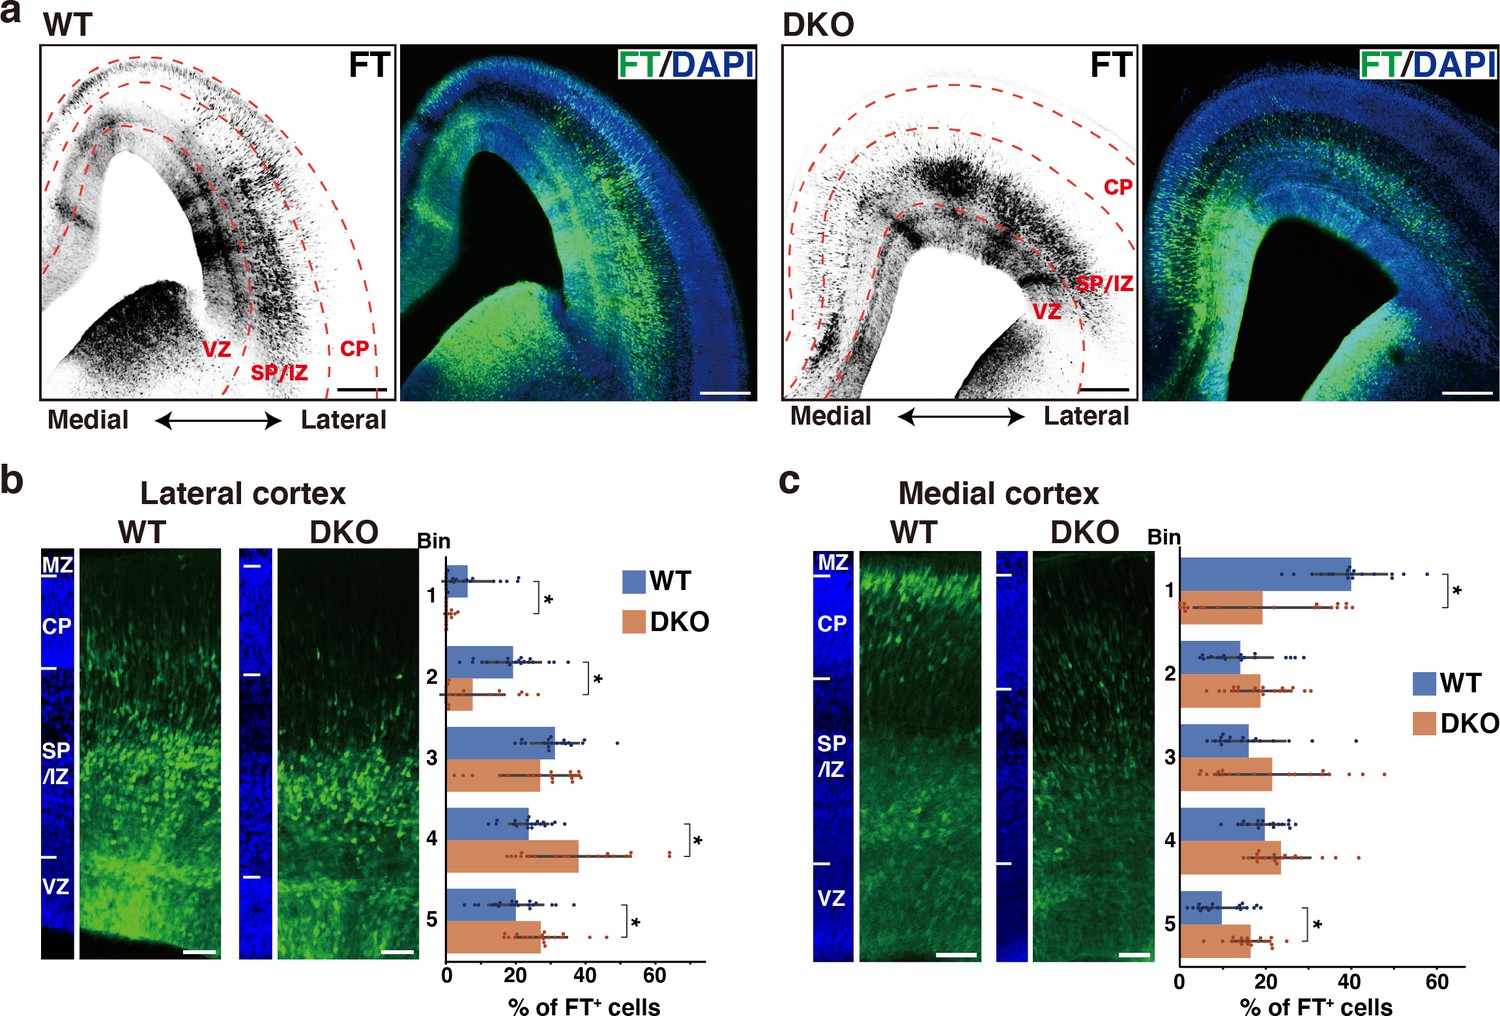
Defects in NCAN and TNC retards neuronal migration.
(a) Low-magnification images of FT-labeled cells (black or green) in WT and DKO mouse coronal sections at E16.5. Nuclei were counterstained with DAPI (blue). (b, c) Radial distribution of FT-labeled cells (green) in the lateral (b) and medial (c) cortices of WT and DKO mice at E16.5. A quantitative analysis of migration profiles across the cortex is shown on the right. The cerebral cortex is divided into five equal areas (bins 1–5) from the pia to the ventricle, and the proportion of FT-labeled cells in each bin was calculated. The nuclei staining images (blue) on the left illustrate the boundaries of the cortical layers. N=19–20 mice per group. Mean ± SD; *p<0.05; Student’s t-test. Scale bars represent 200 μm (a) and 50 μm (b, c).
-
Figure 6—source data 1
Numerical source data for Figure 6.
- https://cdn.elifesciences.org/articles/92342/elife-92342-fig6-data1-v1.zip
Figure 6—figure supplement 1
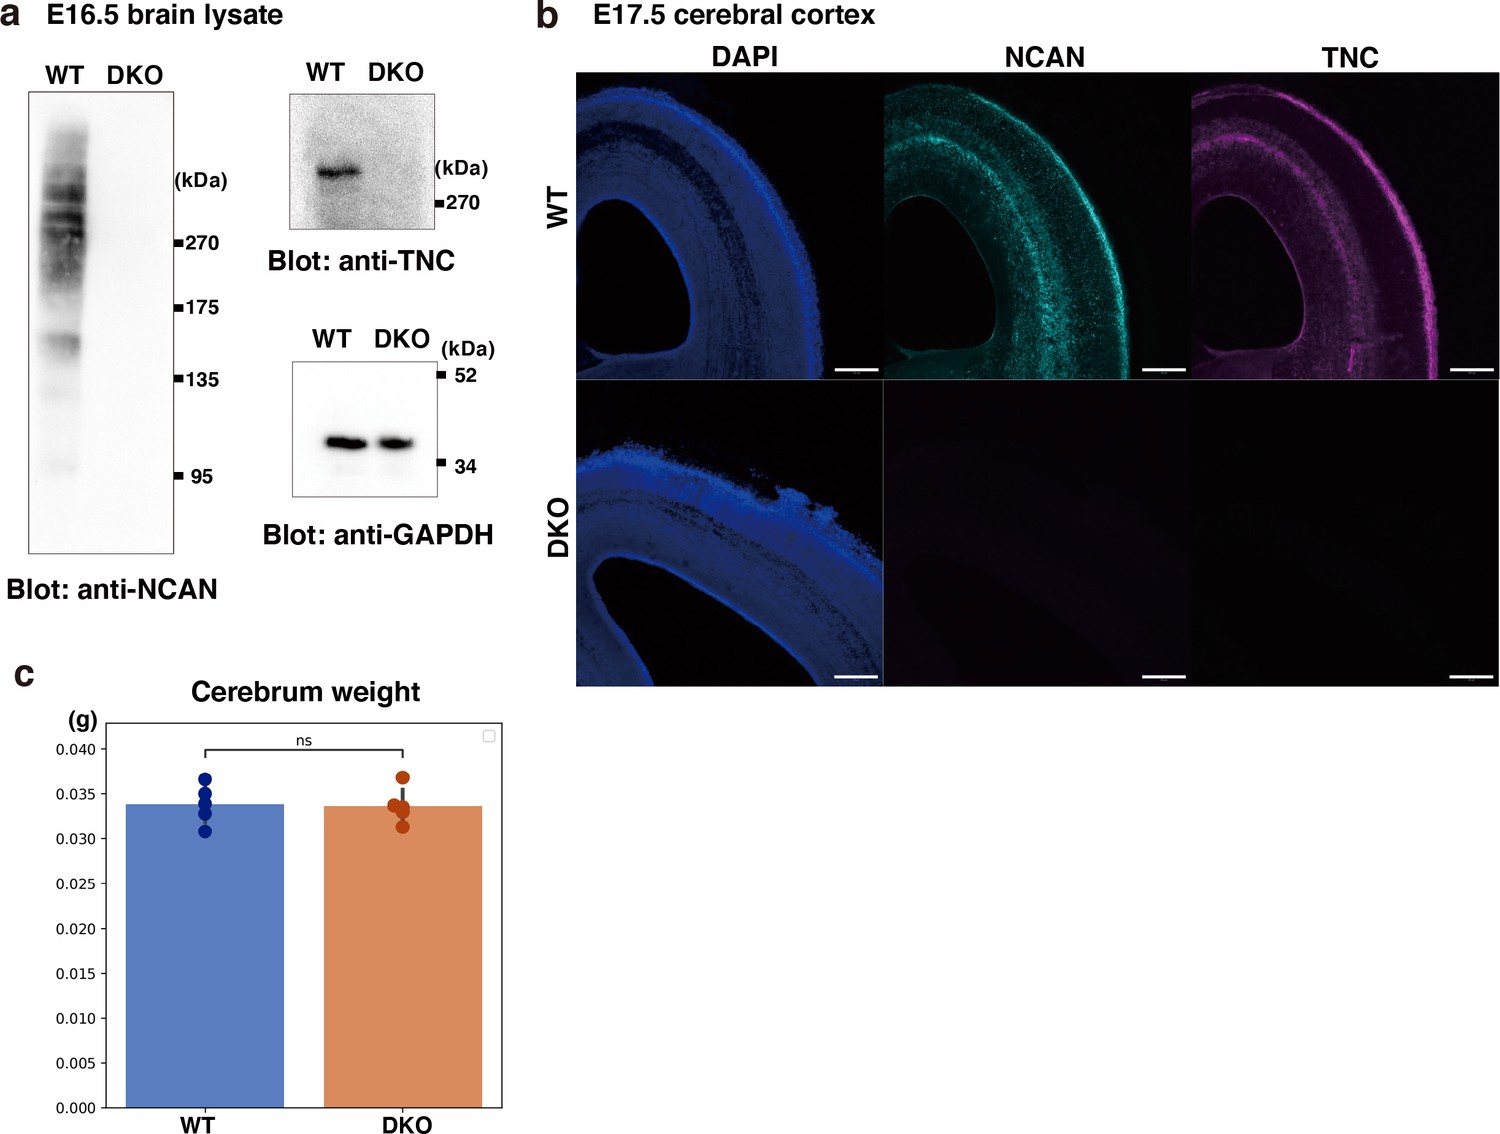
Characterization of DKO mice.
(a) Immunoblot analysis of TNC and NCAN from WT and DKO mouse cerebral cortex lysates. (b) Immunostaining of NCAN and TNC on coronal sections of WT and DKO mouse brains at E17.5. Scale bars represent 200 µm. (c) No significant difference in cerebrum weights between WT and DKO mice at E16.5. N=5 mice per group. Mean ± SD; ns > 0.05; Student’s t-test.
-
Figure 6—figure supplement 1—source data 1
Numerical source data and original blots for Figure 6—figure supplement 1.
- https://cdn.elifesciences.org/articles/92342/elife-92342-fig6-figsupp1-data1-v1.zip
Figure 6—figure supplement 2
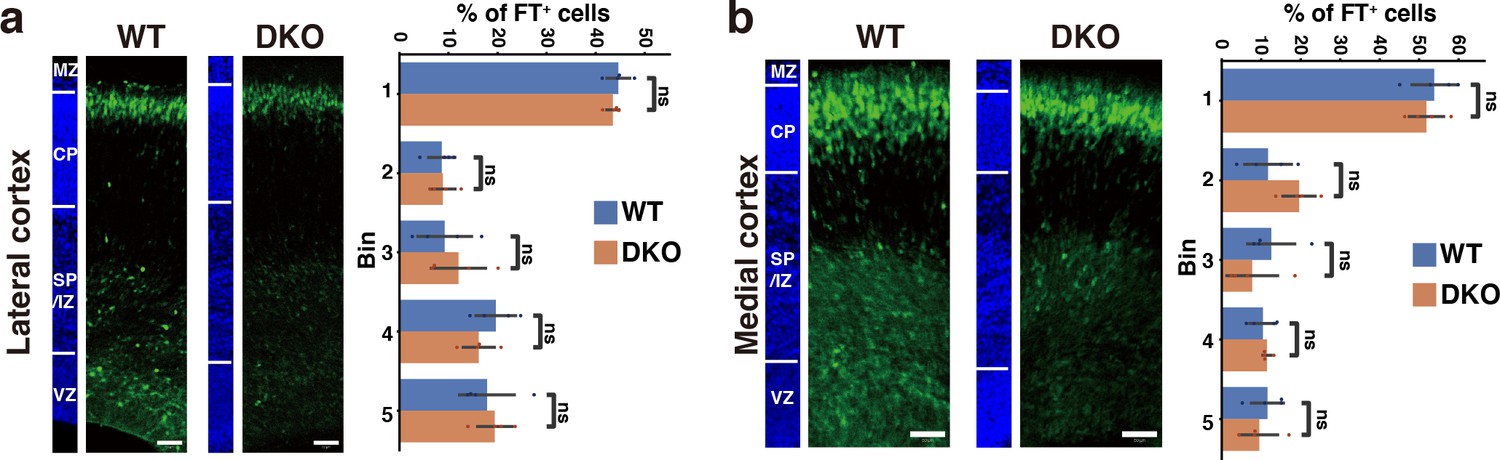
Restored neuronal migration in DKO mice after 3 days of labeling.
(a, b) Radial distribution of FT-labeled cells (green) in the lateral (a) and medial (b) cortices of WT and DKO mice at E17.5. A quantitative analysis of migration profiles across the cortex is shown on the right. The nuclei staining images (blue) on the left illustrate the boundaries of the cortical layers. N=4 mice per group. Mean ± SD; ns > 0.05; Student’s t-test. Scale bars represent 50 µm.
-
Figure 6—figure supplement 2—source data 1
Numerical source data for Figure 6—figure supplement 2.
- https://cdn.elifesciences.org/articles/92342/elife-92342-fig6-figsupp2-data1-v1.zip
Figure 6—figure supplement 3
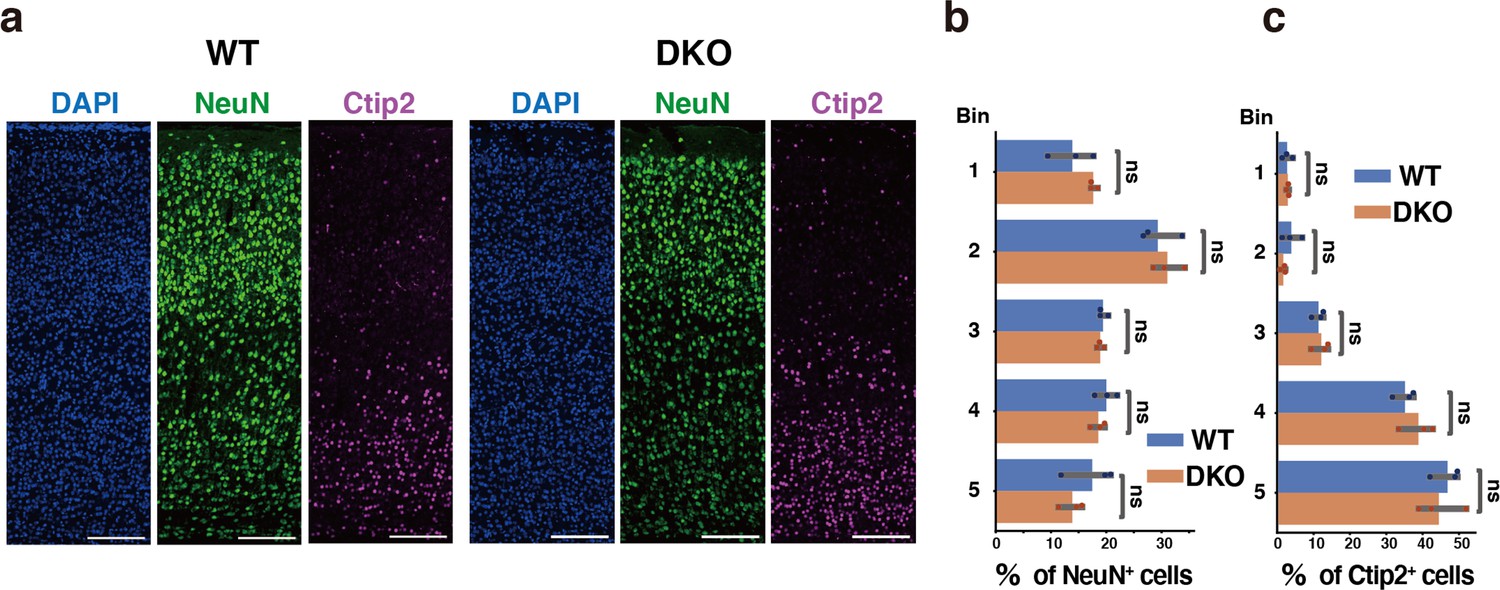
The laminar organization of the postnatal cortex in WT and DKO mice.
(a) Immunostaining of NeuN-positive (green) and Ctip2-positive (magenta) neurons in the cerebral cortices of WT and DKO at 2 weeks of age. Nuclei were counterstained with DAPI (blue). (b, c) Distribution of NeuN-positive (b) or Ctip2-positive (c) neurons in the cerebral cortices of WT and DKO mice. N=3 mice per group. Mean ± SD; ns >0.05; Student’s t-test. Scale bars represent 200 µm (a).
-
Figure 6—figure supplement 3—source data 1
Numerical source data for Figure 6—figure supplement 3.
- https://cdn.elifesciences.org/articles/92342/elife-92342-fig6-figsupp3-data1-v1.zip
Figure 6—figure supplement 4
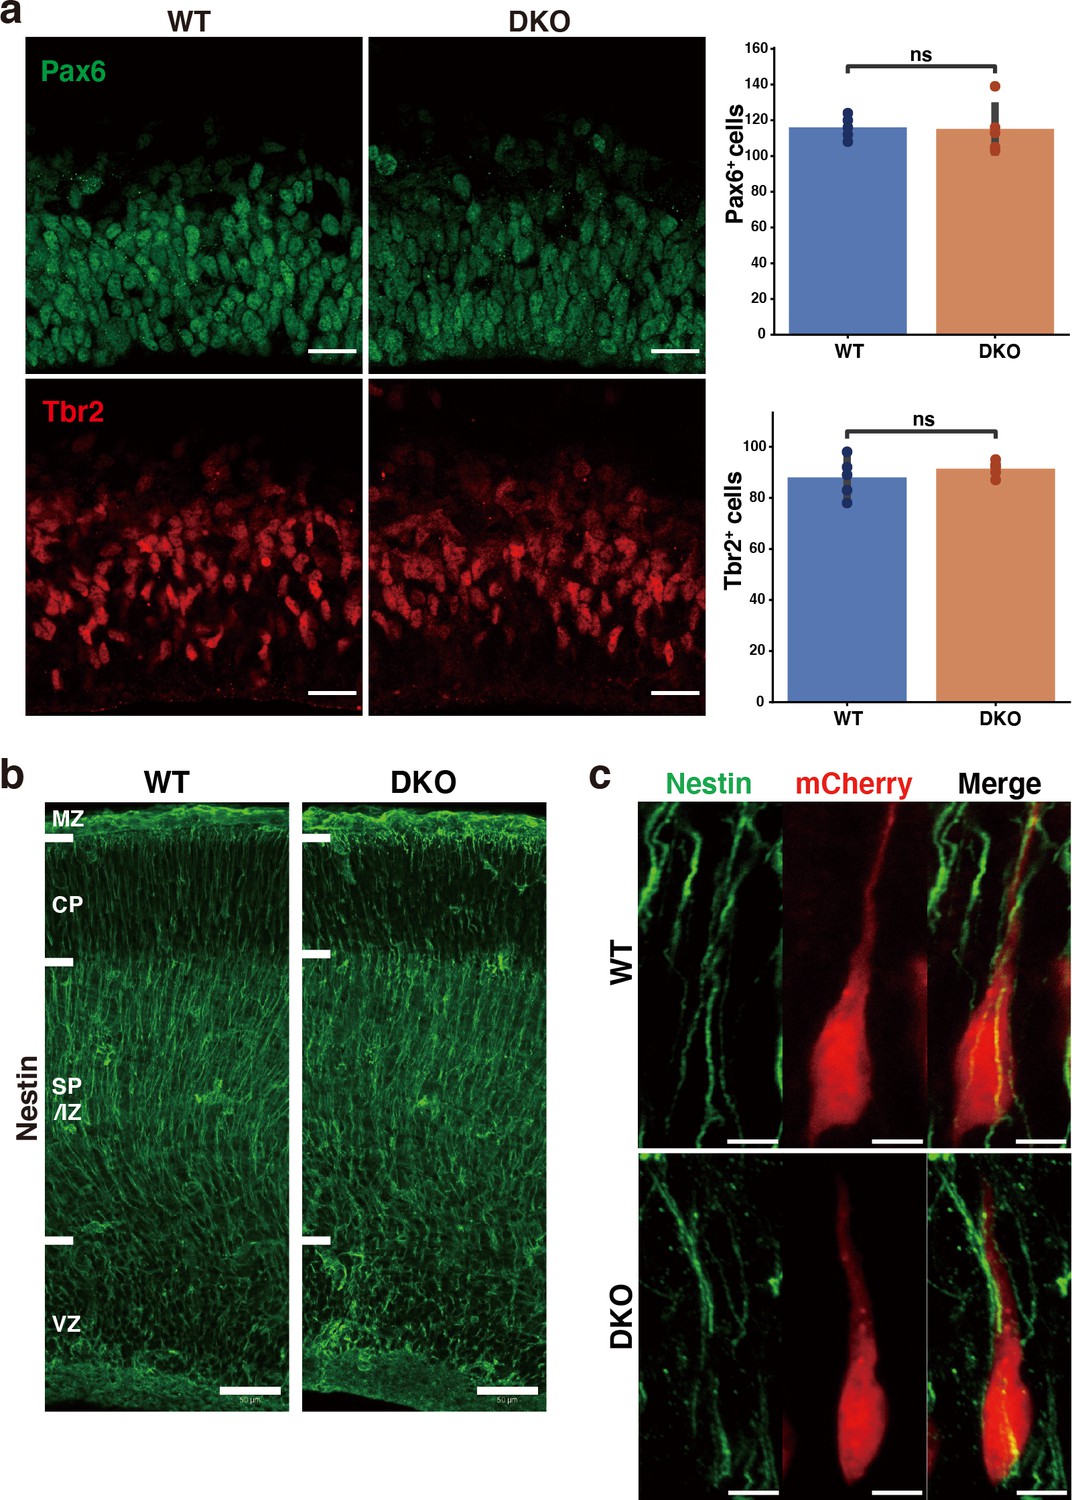
Histochemical analysis of radial glial cells, intermediate progenitor cells, and the morphology of radial fibers in DKO mice.
(a) Immunostaining of Pax6-positive radial glial cells (green) and Tbr2-positive intermediate progenitor cells (red) in the VZ of WT and DKO cerebral cortices at E16.5. Bar graphs show the numbers of Pax6- and Tbr2-positive cells per 150×150 µm2. N=5 mice per group. Mean ± SD; ns > 0.05; Student’s t-test. (b) Immunostaining of nestin-positive radial fibers in WT and DKO cerebral cortices at E16.5. (c) High-magnification images of mCherry-positive bipolar neurons and radial fibers in the WT and DKO at E16.5, 2 days after in utero labeling. Bipolar neurons in the SP/IZ-attached radial fiber, irrespective of genotypes. Scale bars represent 20 µm (a), 50 µm (b), and 5 µm (c).
-
Figure 6—figure supplement 4—source data 1
Numerical source data for Figure 6—figure supplement 4.
- https://cdn.elifesciences.org/articles/92342/elife-92342-fig6-figsupp4-data1-v1.zip
Figure 7 with 1 supplement
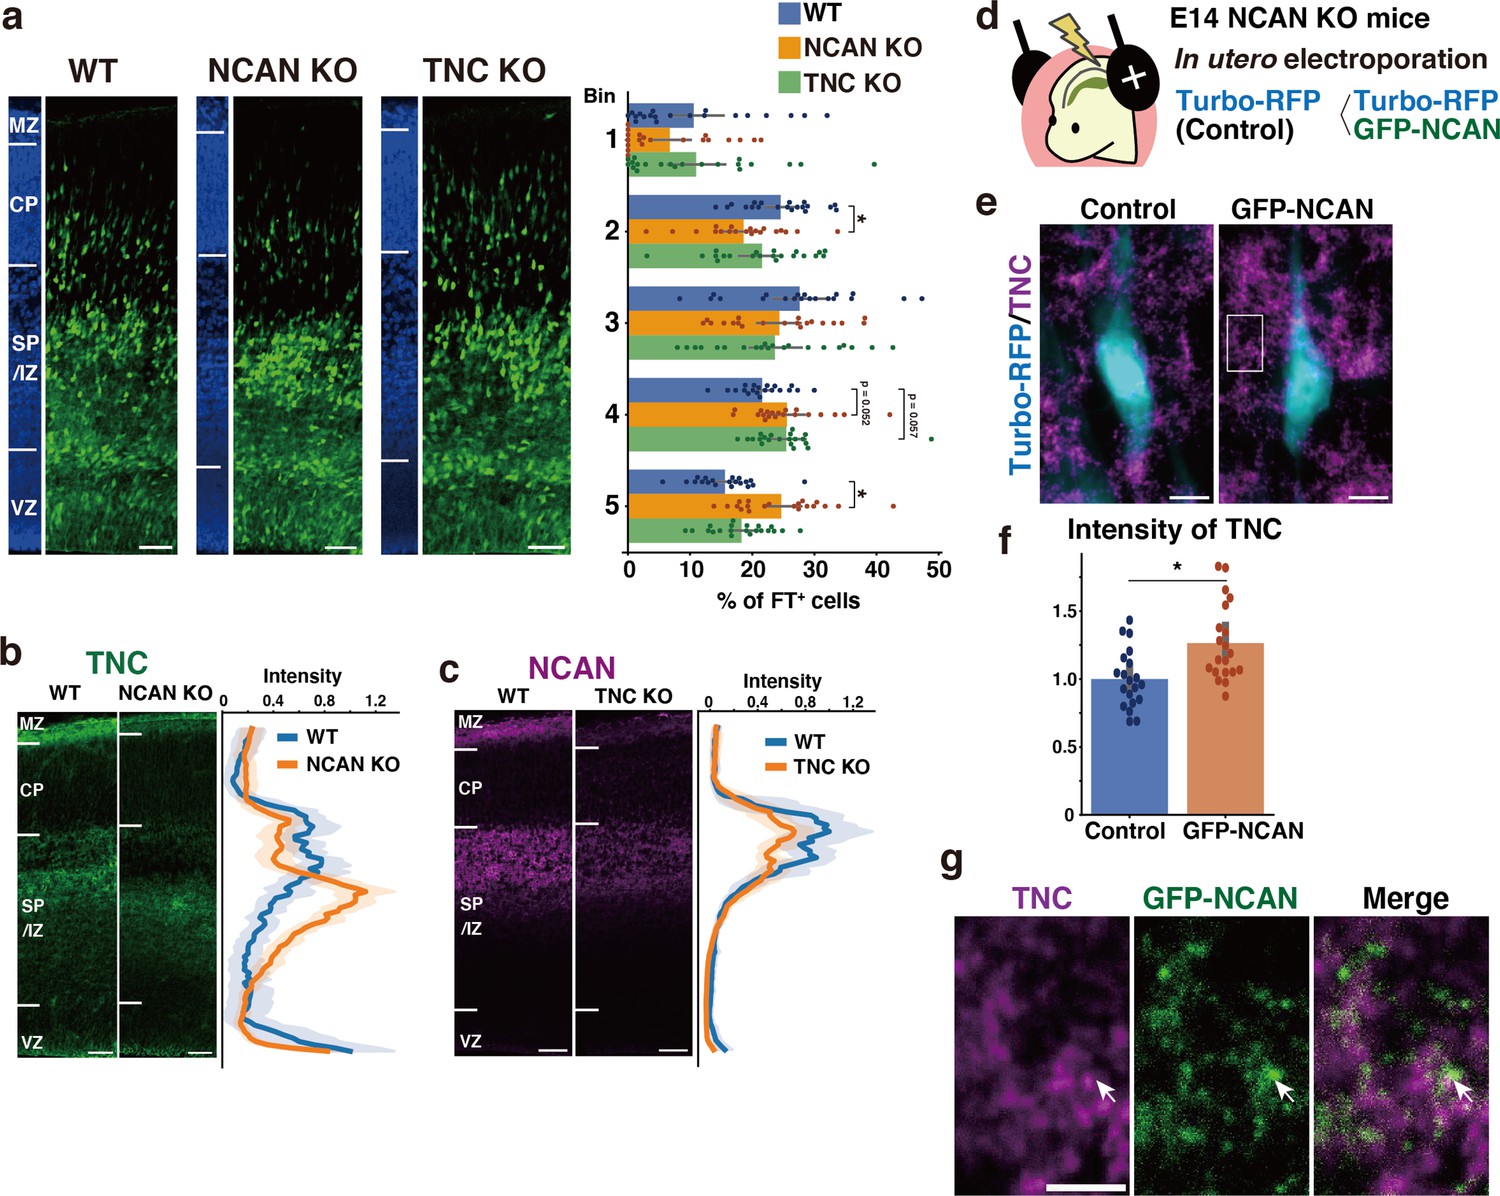
Single deletion of NCAN or TNC results in mild abnormalities in neuronal migration.
(a) Radial distribution of FT-labeled cells (green) in the lateral cortices of WT, NCAN KO, and TNC KO mice at E16.5. A quantitative analysis of migration profiles across the cortex is shown on the right. The nuclei staining images (blue) on the left illustrate the boundaries of the cortical layers. N=20–21 mice per group. Mean ± SD; *p<0.05 vs. WT; Dunnett’s test. (b, c) Localization of TNC in WT and NCAN KO mice at E16.5 (b). Localization of NCAN in WT and TNC KO mice at E16.5 (c). The normalized fluorescence intensity profiles of TNC and NCAN are shown on the right of the images. The maximum intensity value for WT mice was set to 1. N=8–13 mice for each group. Mean ± SD (shaded area). (d) In utero electroporation of Turbo-RFP alone or with GFP-fused full-length NCAN (GFP-NCAN) into the NCAN KO brain at E16.5. (e) Immunostaining of TNC (magenta) around Turbo-RFP-positive neurons (cyan) 2 days after electroporation. (f) Staining intensity of TNC around the control and GFP-NCAN-expressing neuron. N=20 images per group. Mean ± SD; *p<0.05; Student’s t-test. (g) High magnification of the boxed region in (e). The arrows indicate the juxtaposed localization of TNC (magenta) and GFP-NCAN (green). Scale bars represent 50 µm (a, b, c), 5 µm (e), and 2 µm (g).
-
Figure 7—source data 1
Numerical source data for Figure 7.
- https://cdn.elifesciences.org/articles/92342/elife-92342-fig7-data1-v1.zip
Figure 7—figure supplement 1
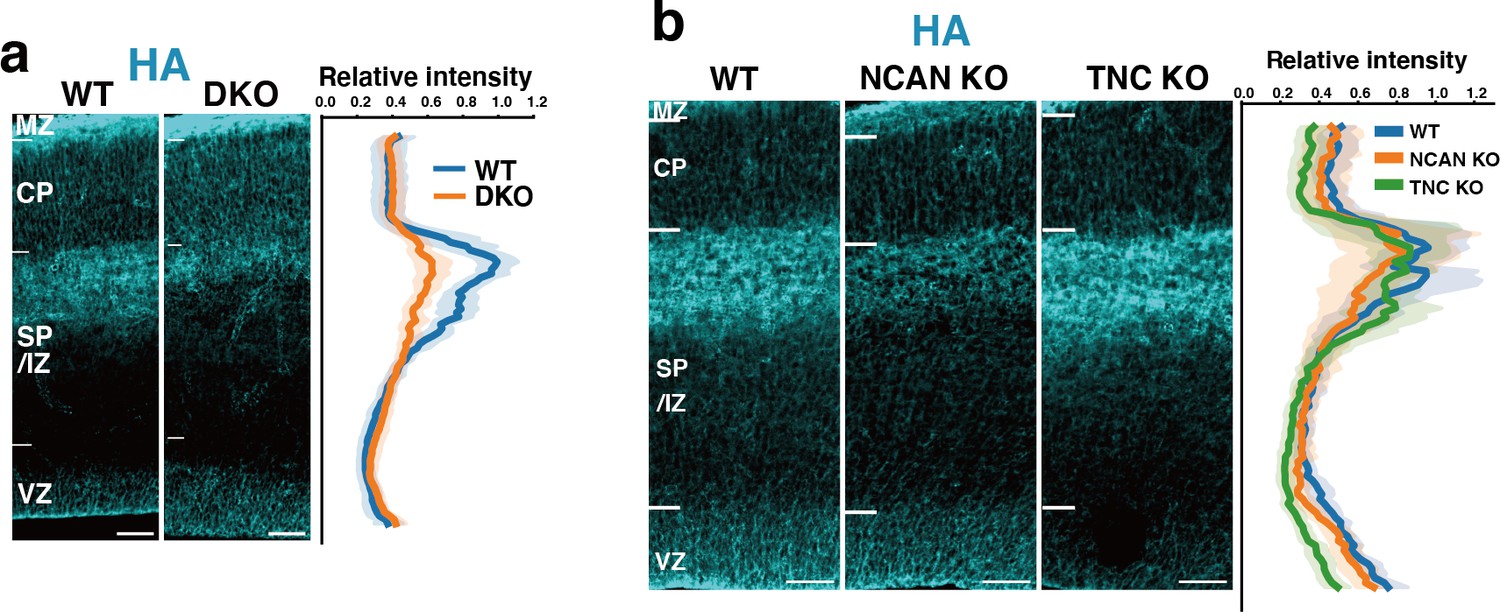
Localization of HA in WT, DKO, NCAN KO, and TNC KO mice.
(a) Distribution patterns of HA in the E16.5 cerebral cortices of WT and DKO mice. The fluorescence intensity profile is shown on the right. The maximum intensity value for WT mice was set to 1. N=11 mice for each group. Mean ± SD (shaded area). (b) Comparison of HA staining in the E16.5 cerebral cortices of WT, NCAN KO, and TNC KO mice. The normalized fluorescence intensity profiles of HA are shown on the right of the image. The maximum intensity value for WT mice was set to 1. N=7–9 mice for each group. Mean ± SD (shaded area). Scale bars represent 50 µm.
-
Figure 7—figure supplement 1—source data 1
Numerical source data for Figure 7—figure supplement 1.
- https://cdn.elifesciences.org/articles/92342/elife-92342-fig7-figsupp1-data1-v1.zip
Figure 8
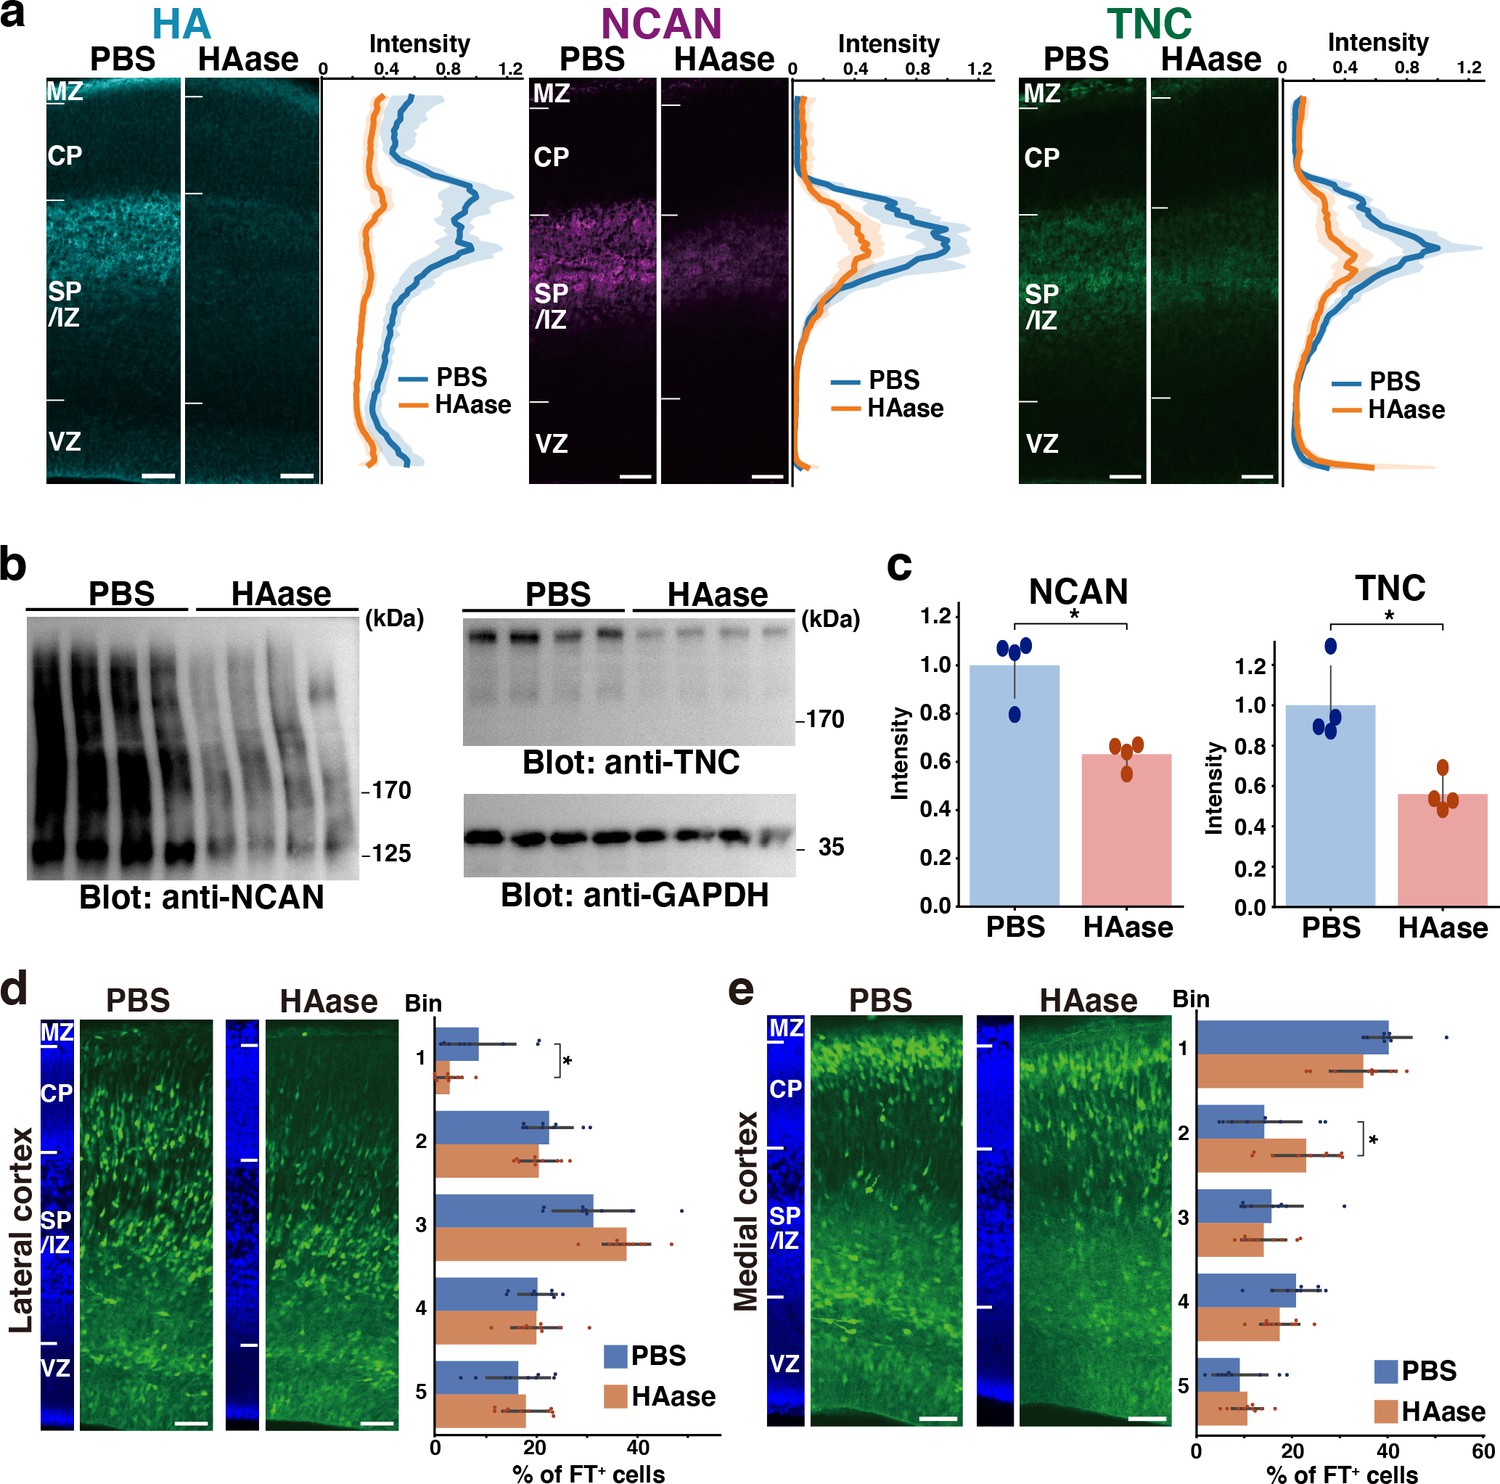
Transient disruption of the ternary complex by hyaluronidase injection.
(a) Localization of HA, NCAN, and TNC in the cerebral cortex 2 days after intraventricular injection of PBS or hyaluronidase (HAase) at E14.5. The normalized fluorescence intensity profiles of HA, NCAN, and TNC are shown on the right of each image. The maximum intensity value for PBS-injected mice was set to 1. N=5 mice for each group. Mean ± SD (shaded area). (b) Immunoblot analysis of NCAN and TNC in cerebral cortex lysates 2 days after intraventricular injection of PBS or HAase. The broadening of the NCAN band is due to the absence of chondroitinase ABC digestion. (c) The NCAN (left) and TNC (right) amounts were represented relative to the PBS-injected group. N=4 mice per group. Mean ± SD; *p<0.01; Student’s t-test. (d, e) Distribution of FT-labeled cells (green) in the lateral (d) and medial (e) cortices 2 days after injection of PBS or HAase at E14.5. N=9–10 mice per group. Mean ± SD; *p<0.05; Student’s t-test. Scale bars represent 50 µm.
-
Figure 8—source data 1
Numerical source data and original blots for Figure 8.
- https://cdn.elifesciences.org/articles/92342/elife-92342-fig8-data1-v1.zip
Figure 9
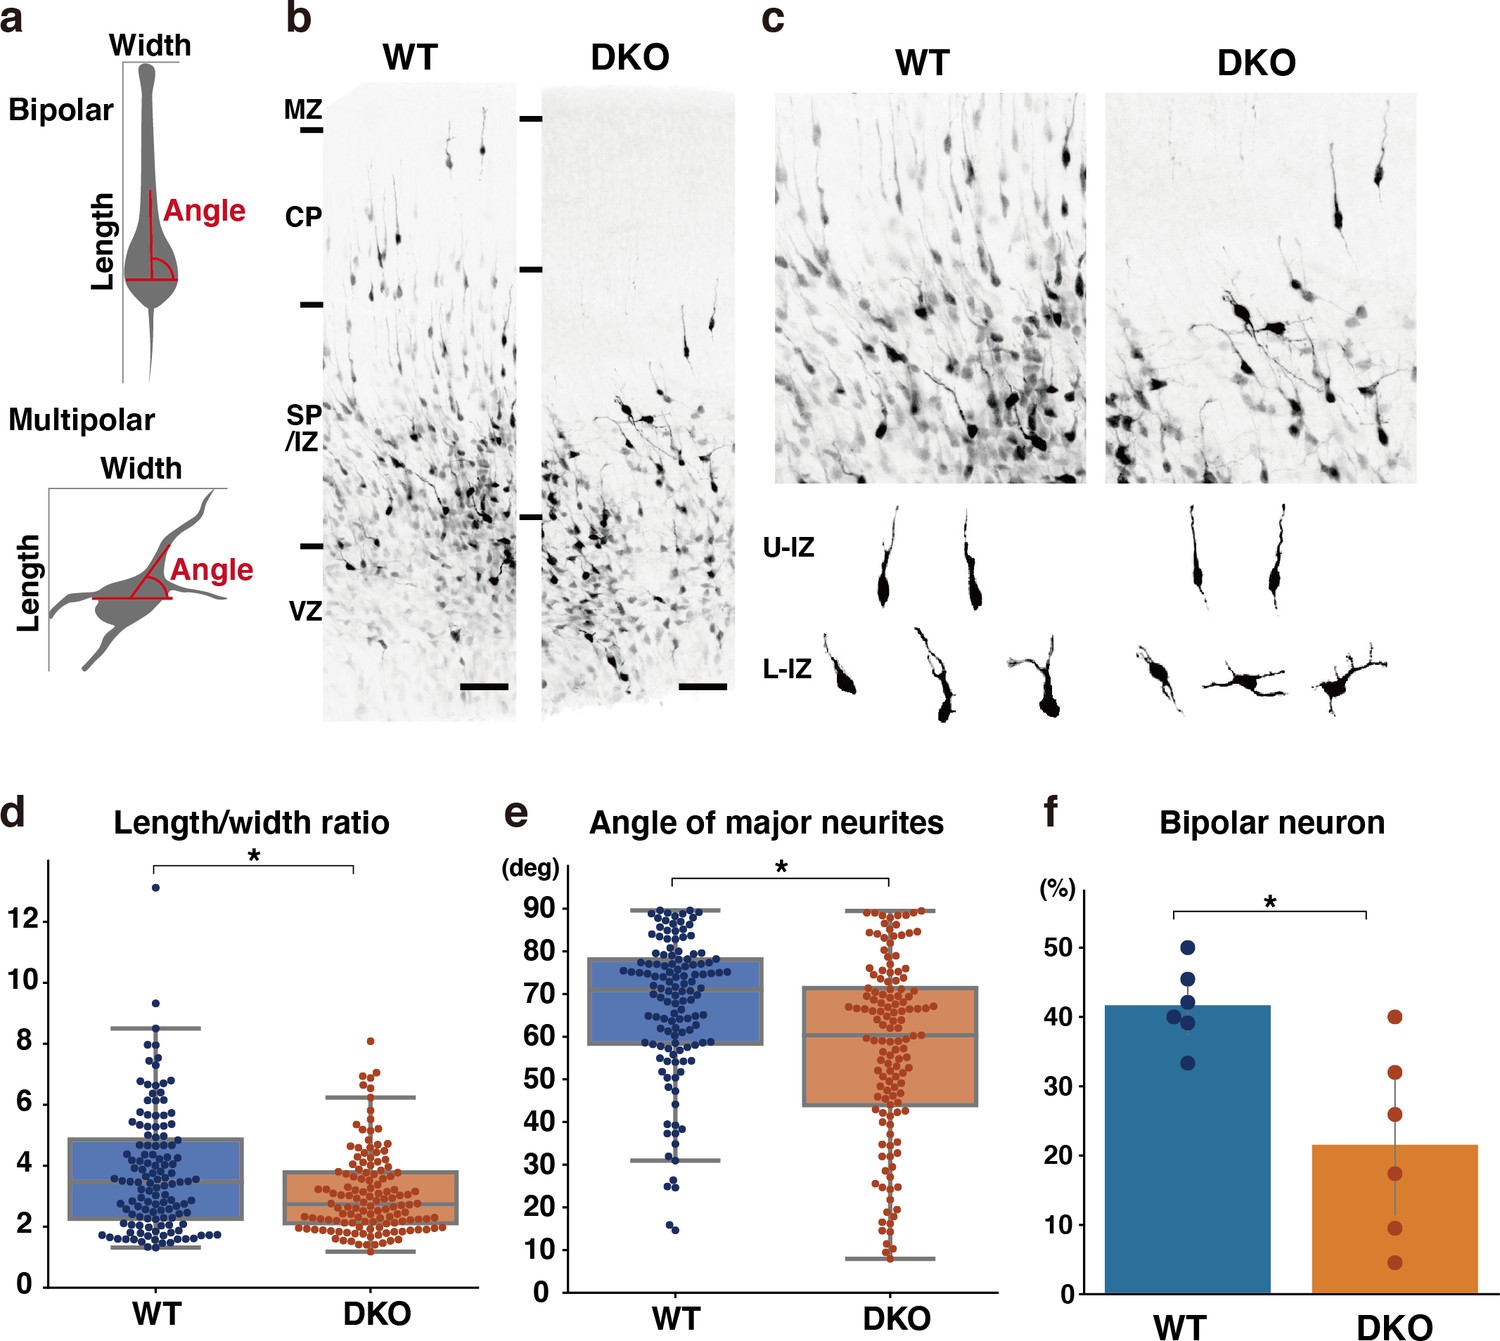
Delayed multipolar-to-bipolar transition in DKO mice.
(a) Schematic of the morphological analysis. (b, c) Migration of mCherry-labeled cells in the WT and DKO cerebral cortices 53 hr after in utero labeling (b). High-magnification images of mCherry-labeled cells in the IZ (c). The images below show the morphology of neurons in the upper IZ (U–IZ) and lower IZ (L–IZ). (d, e) The length-to-width ratio (e) and the major neurite angle (f) of mCherry-positive neurons in WT and DKO mice. N=128–134 cells from 6 mice per group. *p<0.05; Student’s t-test. (f) The proportion of bipolar neurons among mCherry-labeled neurons in the WT and DKO cortices. N=6 mice per group. Mean ± SD; *p<0.05; Student’s t-test. Scale bars represent 50 μm (b).
-
Figure 9—source data 1
Numerical source data for Figure 9.
- https://cdn.elifesciences.org/articles/92342/elife-92342-fig9-data1-v1.zip
Figure 10 with 3 supplements
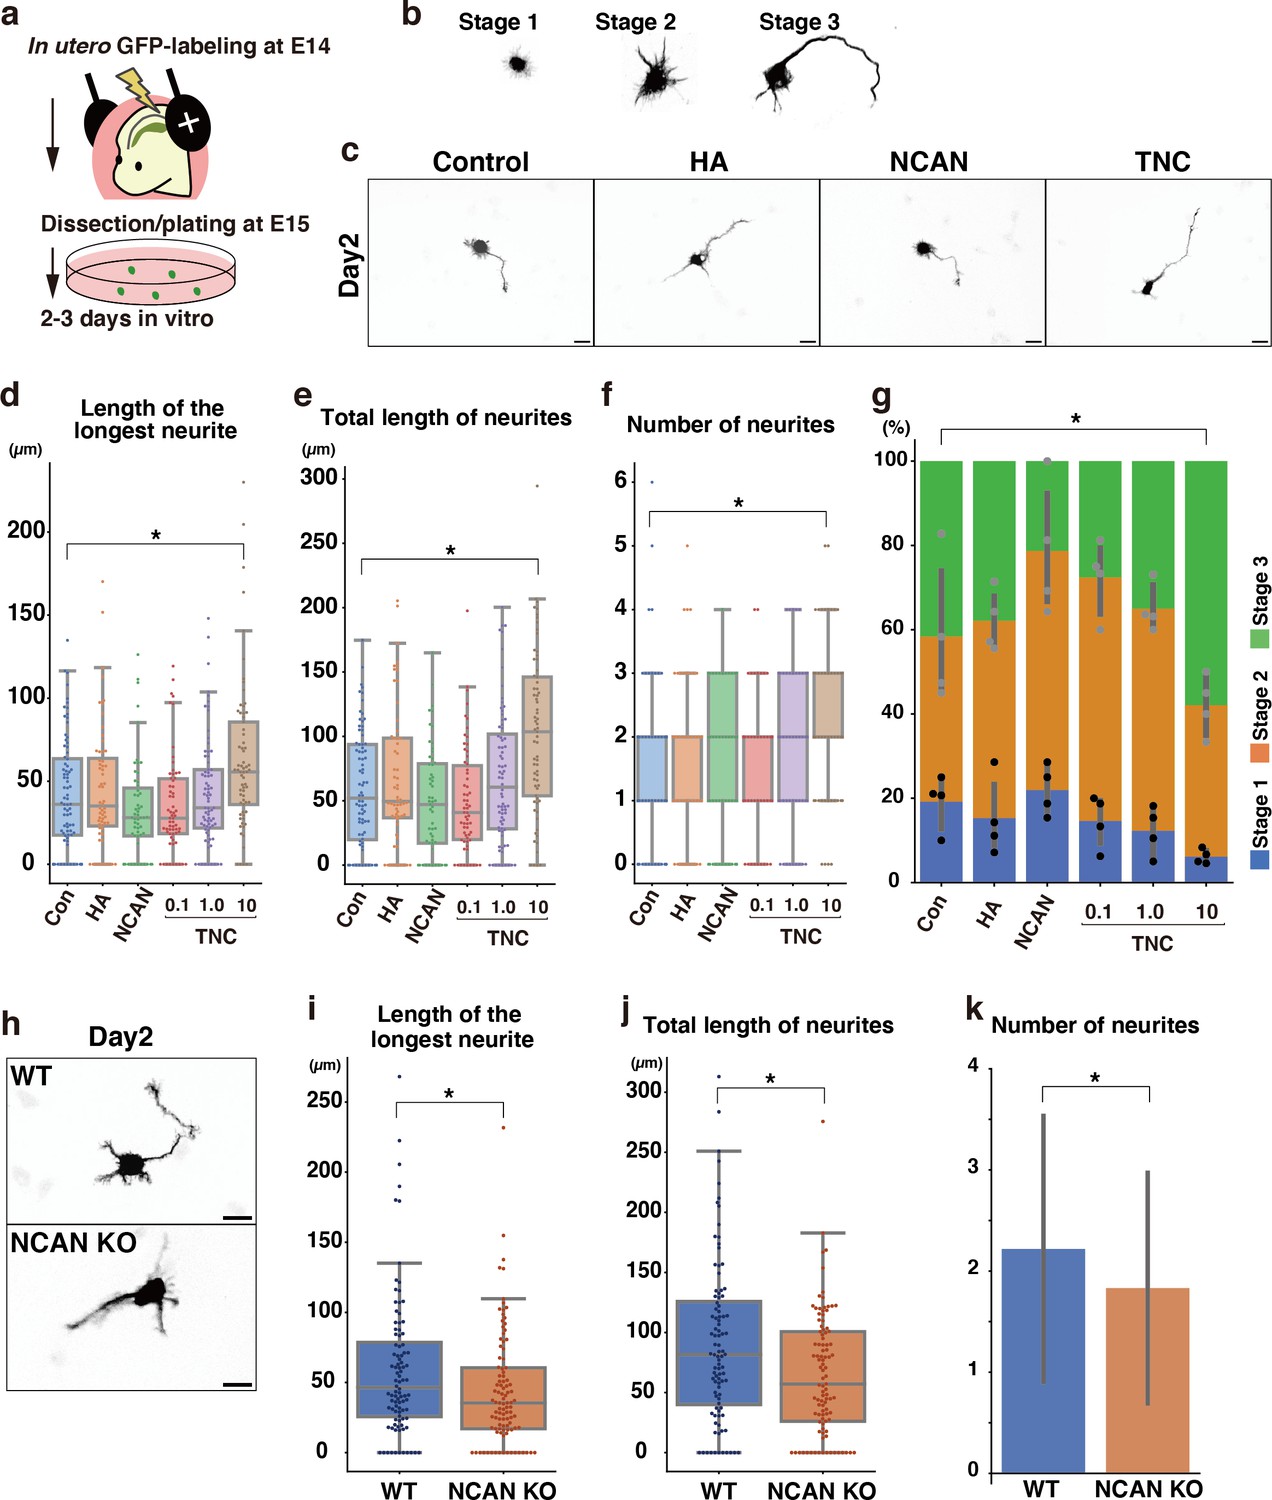
Morphological maturation of cortical neurons by TNC and NCAN.
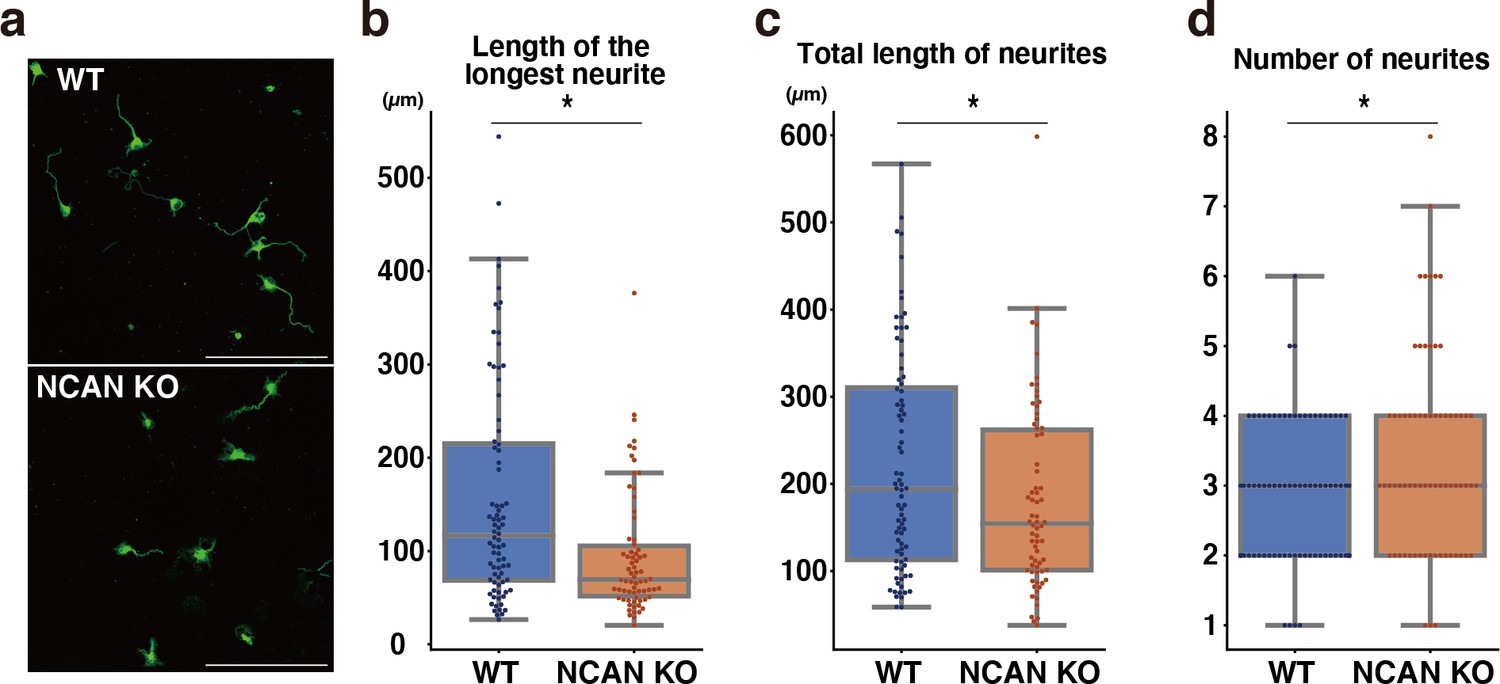
(a) Experimental model for in utero cell labeling and the primary neuronal culture. (b) Morphological stages of primary cultured cortical neurons. (c) Representative images of GFP-labeled neurons cultured for 2 days on cover glasses coated with the control substrate, poly-L-ornithine (POL), and 10 μg/mL of TNC, HA, and NCAN. (d-f) The length of the longest neurite (d), total length of neurites (e), and number of neurites (f) of neurons cultured on the indicated substrate for 2 days. N=55–80 cells per condition. *p<0.05 vs Control (Con); Dunnett’s test. (g) The percentage of neurons with each morphological stage after culturing on the indicated substrate for 2 days. N=4 wells per condition. Mean ± SD. *p<0.05 vs Con for stage 1; Dunnett’s test. (h) Representative images of GFP-labeled neurons derived from WT and NCAN KO mice cultured for 2 days on cover glasses coated with POL. (i–k) The length of the longest neurite (i), total length of neurites (j), and number of neurites (k) of WT and NCAN KO neurons cultured for 2 days. N=96–101 cells per condition. *p<0.05; Student’s t-test. Scale bars represent 20 μm (c, h).
-
Figure 10—source data 1
Numerical source data for Figure 10.
- https://cdn.elifesciences.org/articles/92342/elife-92342-fig10-data1-v1.zip
Figure 10—figure supplement 1
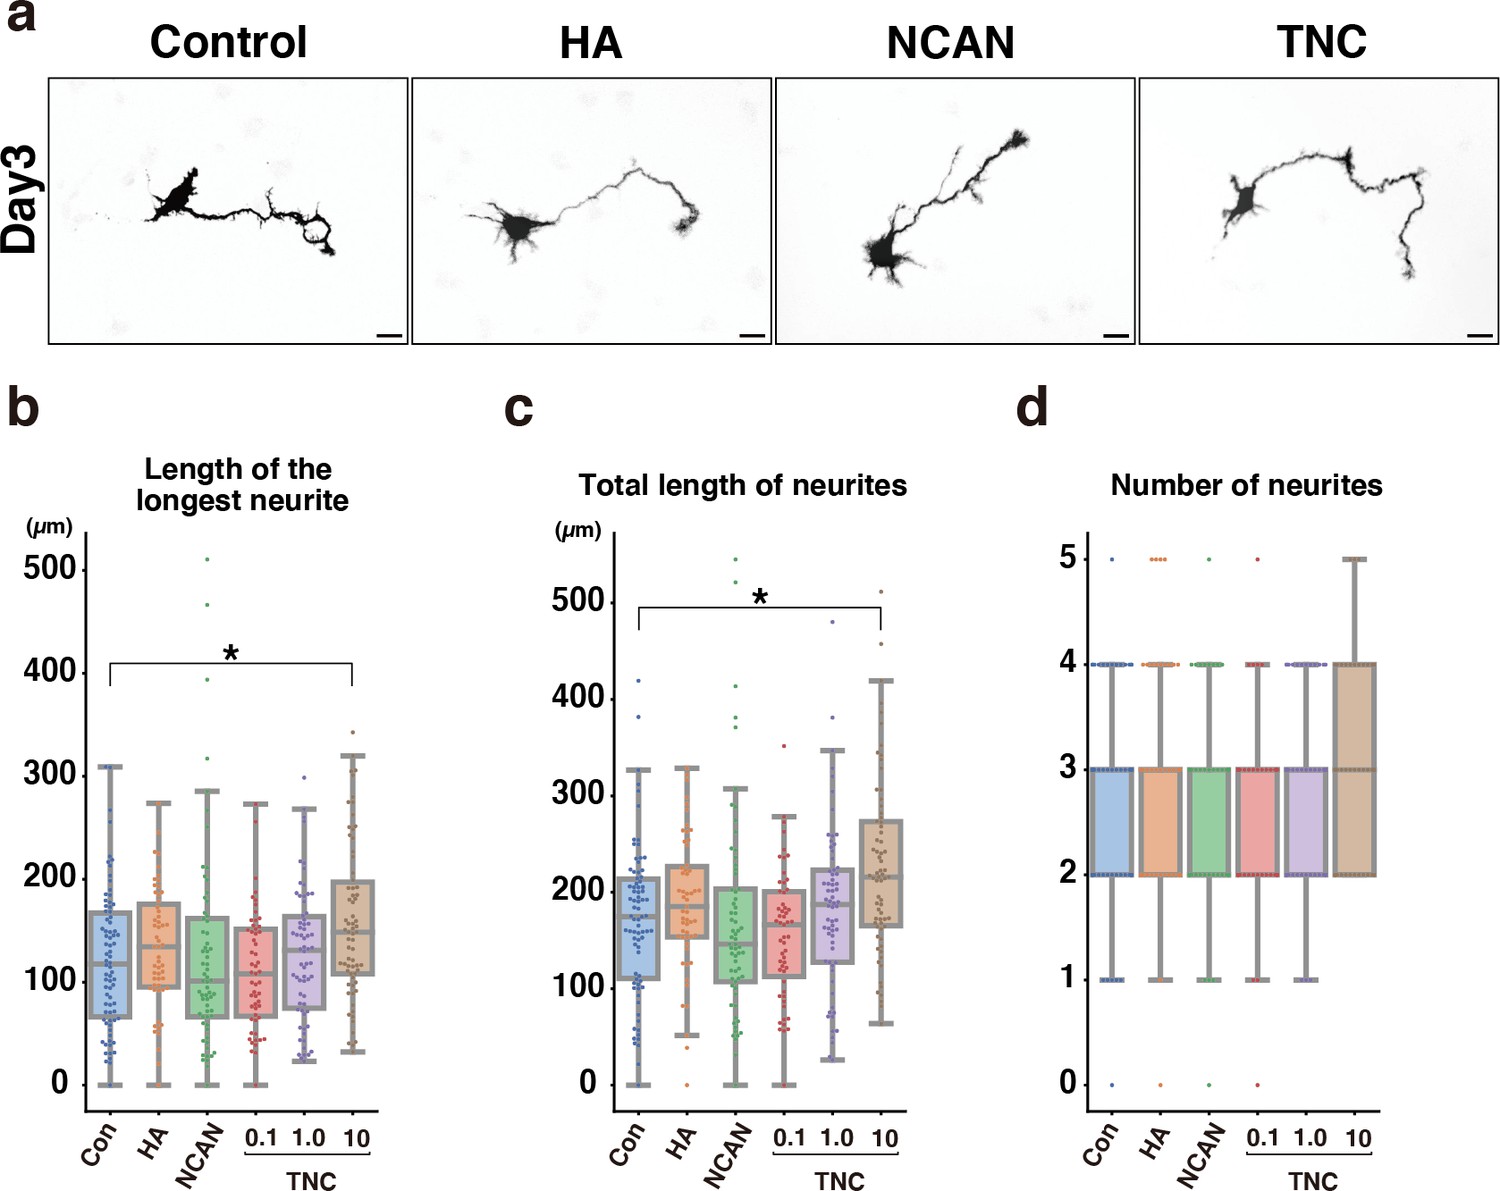
Morphological analysis of cortical neurons cultured for 3 days on cover glasses coated with HA, NCAN, and TNC.
(a) Representative images of GFP-labeled neurons after culturing on the indicated substrate for 3 days. (b–d) The length of the longest neurite (b), total length of neurites (c), and number of neurites (d) of neurons cultured on the indicated substrate for 3 days. N=55–78 cells per condition. *p<0.05 vs Control (Con); Dunnett’s test. Scale bars represent 20 μm.
-
Figure 10—figure supplement 1—source data 1
Numerical source data for Figure 10—figure supplement 1.
- https://cdn.elifesciences.org/articles/92342/elife-92342-fig10-figsupp1-data1-v1.zip
Figure 10—figure supplement 2
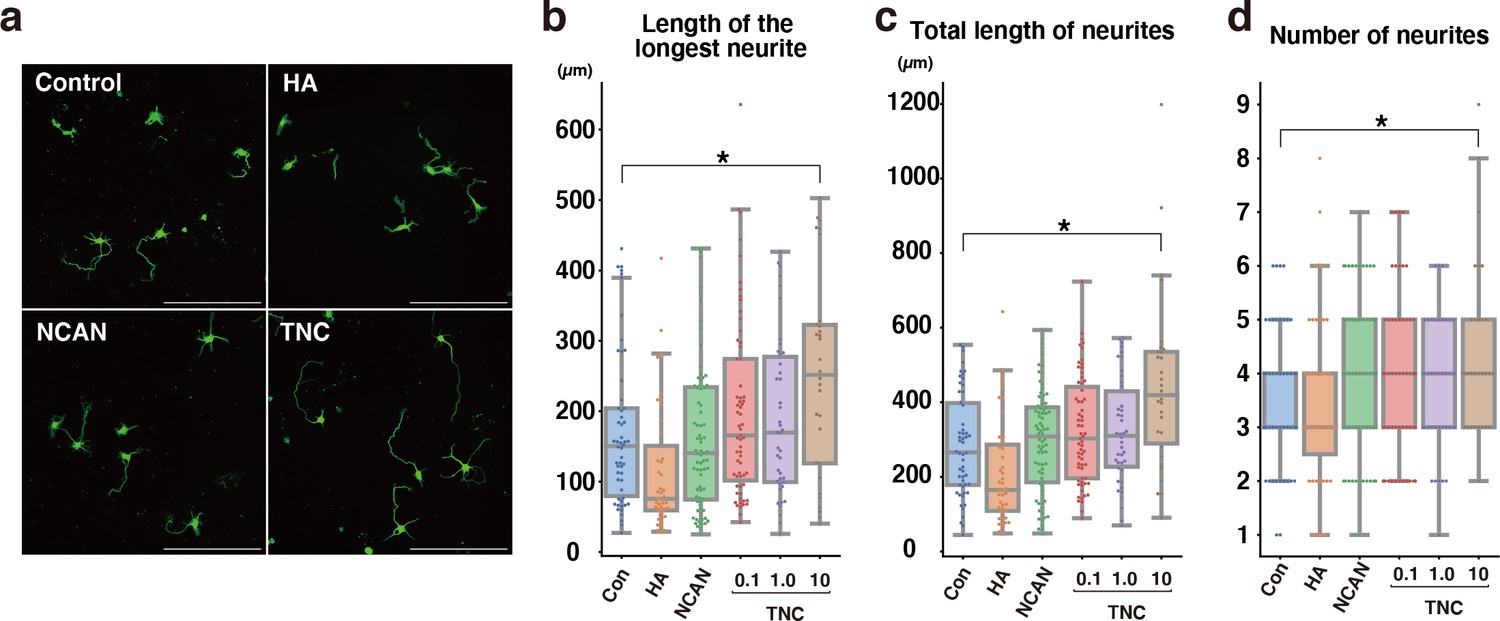
Neurite outgrowth analysis with anti-Tuj-1 antibody staining.
(a) Representative images of neurons stained with anti-Tuj-1 antibody after 3 days of culture on the indicated substrate. (b–d) The length of the longest neurite (b), total length of neurites (c), and number of neurites (d) of neurons. Neurites were analyzed using AutoNeuriteJ. N=30–76 cells per condition. *p<0.05 vs Control (Con); Dunnett’s test. Scale bars represent 200 μm.
-
Figure 10—figure supplement 2—source data 1
Numerical source data for Figure 10—figure supplement 2.
- https://cdn.elifesciences.org/articles/92342/elife-92342-fig10-figsupp2-data1-v1.zip
Figure 10—figure supplement 3
Neurite outgrowth analysis of WT and NCAN KO neurons with anti-Tuj-1 antibody staining.
(a) Representative images of WT and NCAN KO neurons stained with anti-Tuj-1 antibody after 3 days of culture. (b–d) The length of the longest neurite (b), total length of neurites (c), and number of neurites (d) of neurons. Neurites were analyzed using AutoNeuriteJ. N=70–80 cells per condition. *p<0.05; Student’s t-test. Scale bars represent 200 μm.
-
Figure 10—figure supplement 3—source data 1
Numerical source data for Figure 10—figure supplement 3.
- https://cdn.elifesciences.org/articles/92342/elife-92342-fig10-figsupp3-data1-v1.zip
Author response image 1
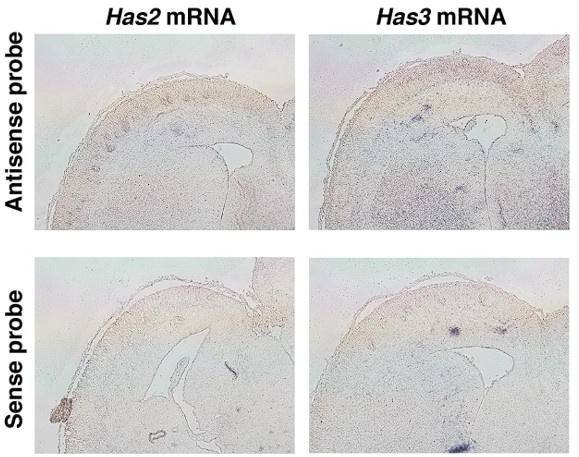
In situ hybridization analysis of Has2 and 3 mRNA on the E16.
5 cerebral cortex. Upper images show results of in situ hybridization using antisense against Has2 and 3. Lower images are in situ hybridization using sense probes as negative controls.
Tables
Table 1
List of proteins identified from GFP-NCAN and negative control resins.
| GFP-NCAN resin | Negative control resin | ||
|---|---|---|---|
| Protein name | No. of peptide | Protein name | No. of peptide |
| Neurocan core protein | 34 | Tubulin beta-2B chain | 21 |
| Tenascin | 22 | Tubulin beta-5 chain | 17 |
| Tubulin alpha-1A chain | 18 | Tubulin beta-3 chain | 15 |
| Tubulin beta-2B chain | 17 | Tubulin beta-6 chain | 15 |
| Tubulin beta-5 chain | 16 | Tubulin alpha-1A chain | 13 |
| Actin, cytoplasmic 2 | 11 | Actin, cytoplasmic 2 | 10 |
| Actin, cytoplasmic 1 | 9 | Elongation factor 1-alpha 1 | 5 |
| Tubulin beta-6 chain | 8 | Macrophage migration inhibitory factor | 5 |
| Elongation factor 1-alpha 1 | 6 | Crk-like protein | 4 |
| Crk-like protein | 4 | Keratin, type II cytoskeletal 1 | 4 |
| Profilin-2 | 4 | Peroxiredoxin-1 | 3 |
| Eukaryotic translation initiation factor 3 subunit L | 4 | L-lactate dehydrogenase A chain | 3 |
| Histone deacetylase 6 | 4 | Keratin, type I cytoskeletal 10 | 3 |
| 40 S ribosomal protein SA | 3 | Hemoglobin subunit alpha | 3 |
| Macrophage migration inhibitory factor | 3 | Hemoglobin subunit beta-1 | 3 |
| Eukaryotic translation initiation factor 3 subunit E | 3 | Keratin, type II cytoskeletal 1b | 3 |
| Keratin, type II cytoskeletal 1b | 3 | ||
Key resources table
| Reagent type (species) or resource | Designation | Source or reference | Identifiers | Additional information |
|---|---|---|---|---|
| Strain, strain background (Mus musculus) | ICR mice | Japan SLC | RRID:MGI:5462094 | |
| Strain, strain background (M. musculus) | C57BL/6 N mice | Japan SLC | RRID:MGI:5295404 | |
| Strain, strain background (M. musculus) | B6.Cg-Tnc<tm1Sia>/Rbrc | RIKEN Bioresource Center | RBRC00169 | |
| Strain, strain background (M. musculus) | DKO mice for TNC and NCAN | This paper | N/A | Mice deficient for TNC and NCAN |
| Cell line (Homo sapiens) | HEK293 | Riken Cell Bank | RCB1637 RRID:CVCL_0045 | Verified by the Riken Cell Bank and tested negative for mycoplasma |
| Cell line (H. sapiens) | HEK293T | Riken Cell Bank | RCB2202 RRID:CVCL_0063 | Verified by the Riken Cell Bank and tested negative for mycoplasma |
| Antibody | Anti-tenascin C Rat IgG2A (Clone # 578) | R&D | MAB2138, RRID:AB_2203818 | IF(1:400), WB (1:3000) |
| Antibody | Anti-β-Tubulin (Tuj-1) Mouse IgG1(clone TUB 2.1) | Sigma | T4026 RRID:AB_477577 | IF(1:1000) |
| Antibody | Anti-Neurocan Sheep IgG | R&D | AF5800 RRID:AB_2149717 | IF(1:400), WB (1:3000) |
| Antibody | Anti-GFP Alexa Fluor 488 conjugate Rabbit IgG | Invitrogen | A21311 RRID:AB_221477 | IF(1:1000) |
| Antibody | Anti-Nestin Mouse IgG | Millipore | MAB5326 RRID:AB_94911 | IF(1:400) |
| Antibody | Anti-Pax6 Rabbit IgG | Fujifilm | 015–27293 | IF(1:400) |
| Antibody | Anti-EOMES (Tbr2) Rat IgG2A | Invitrogen | 14-4875-82 RRID:AB_11042577 | IF(1:400) |
| Antibody | Anti-NeuN Rabbit IgG | Proteintech | 26975–1-AP RRID:AB_2880708 | IF(1:1000) |
| Antibody | Anti-Ctip2 Rat IgG2A | abcam | Ab18465 RRID:AB_2064130 | IF(1:400) |
| Antibody | Anti-GAPDH Mouse IgG1(Clone # 5A12) | Wako | 016–25523 RRID:AB_2814991 | WB (1:10000) |
| Antibody | Anti-Chondroitine-4-Sulfate Mouse IgG1 (Clone # BE-123) | Millipore | MAB2030 RRID:AB_11213679 | WB (1:50000) |
| Antibody | Alexa Fluor 488 donkey anti-Mouse (H+L) | Wako | 715-545-151 RRID:AB_2341099 | IF(1:400) |
| Antibody | Alexa Fluor 594 goat anti-Rat IgG (H+L) | Thermo Fisher | A-11007 RRID:AB_10561522 | IF(1:400) |
| Antibody | Alexa Fluor 647 goat anti-Rat IgG (H+L) | Thermo Fisher | A-21247 RRID:AB_141778 | IF(1:400) |
| Antibody | Alexa Fluor 647 donkey anti-Sheep IgG (H+L) | Thermo Fisher | A-21448 RRID:AB_2535865 | IF(1:400) |
| Antibody | Mouse IgG HRP-conjugated Antibody | MBL | PM009-7 | WB (1:2500) |
| Antibody | Sheep IgG HRP-conjugated Antibody | R&D | HAF016 RRID:AB_562591 | WB (1:2500) |
| Antibody | Rat IgG HRP-conjugated Antibody | Cell Signaling Technology | 7077 S RRID:AB_10694715 | WB (1:2500) |
| Antibody | Rabbit IgG HRP-conjugated Antibody | Cell Signaling Technology | 7074 S RRID:AB_2099233 | WB (1:2500) |
| Recombinant DNA reagent | pCAG-GFP (plasmid) | Addgene | Plasmid #11150 | |
| Recombinant DNA reagent | pCAG-mGFP (plasmid) | Addgene | Plasmid #14757 | |
| Recombinant DNA reagent | pCAG-mCherry (plasmid) | This paper | N/A | Vector backbone: pCAG Gene/Insert name: mCherry |
| Recombinant DNA reagent | pCAGGS-TurboRFP (plasmid) | This paper | N/A | Vector backbone: pCAGGS Gene/Insert name: TurboRFP |
| Recombinant DNA reagent | pCAG-Full length NCAN-GFP (plasmid) | This paper | N/A | Vector backbone: pCAG Gene/Insert name: GFP-fused full length NCAN |
| Recombinant DNA reagent | pCAG-N half NCAN-GFP (plasmid) | This paper | N/A | Vector backbone: pCAG Gene/Insert name: GFP-fused N half of NCAN |
| Recombinant DNA reagent | pCAG-C half NCAN-GFP (plasmid) | This paper | N/A | Vector backbone: pCAG Gene/Insert name: GFP-fused C half of NCAN |
| Sequence-based reagent | ISH TNC probe f | This paper | N/A | CGGAATTCATCTTTGCAGAGAAAGGACAGC |
| Sequence-based reagent | ISH TNC probe r | This paper | N/A | GCTCTAGACTGTGTCCTTGTCATAGGTGGA |
| Sequence-based reagent | ISH NCAN probe f | This paper | N/A | GCGAATTCAGAATGCCTCTCTTGTTGGTG |
| Sequence-based reagent | ISH NCAN probe r | This paper | N/A | GCTCTAGACTACAATAGTGAGTTCGAGGCC |
| Sequence-based reagent | crRNA, Mm.Cas9.NCAN.1.AA | IDT | REF #101658344 | ACCUUAGUCCACUUGAU CCGGUUUUAGAGCUAUGCU |
| Sequence-based reagent | qPCR for Ncan, forward | This paper | N/A | CCCTGCTTCTTTACCCTGCA |
| Sequence-based reagent | qPCR for Ncan, reverse, | This paper | N/A | CGTTGTCTTTGGCCACCAAG-3' |
| Sequence-based reagent | qPCR for Tnc, forward | This paper | N/A | ACCATGGGTACAGGCTGTTG |
| Sequence-based reagent | qPCR for Tnc, reverse | This paper | N/A | CCTTTCCAGCCTGGTTCACA |
| Sequence-based reagent | qPCR for Gapdh, forward | This paper | N/A | GACTTCAACAGCAACTCCCAC |
| Sequence-based reagent | qPCR for Gapdh, reverse | This paper | N/A | TCCACCACCCTGTTGCTGTA |
| Peptide, recombinant protein | Alt-R S.p. Cas9 Nuclease V3 | IDT | Catalog #1081058 | |
| Peptide, recombinant protein | Trypsin (Sequencing Grade) | Promega | V511C | |
| Peptide, recombinant protein | HRP-conjugated streptavidin | Wako | 190–17441 | |
| Peptide, recombinant protein | Hyaluronidase from streptomyces hyalurolyticus | Sigma | H1136 | |
| Peptide, recombinant protein | Recombinant Human Tenascin C Protein | R&D | 3358-TC | |
| Peptide, recombinant protein | Recombinant Human Neurocan Protein | R&D | 6508-NC-050 | |
| Peptide, recombinant protein | Chondroitinase ABC Protease Free | Seikagaku Corporation | 100332 | |
| Commercial assay or kit | BCA assay kit | Thermo Fisher | 23227 | |
| Commercial assay or kit | RNeasy Mini Kit | Qiagen | 74104 | |
| Commercial assay or kit | PowerUp SYBR Green Master Mix | Thermo Fisher | A25741 | |
| Commercial assay or kit | DIG RNA Labeling Kit (SP6/T7) | Roche | 11175025910 | |
| Commercial assay or kit | NEBuilder HiFi DNA Assembly Master Mix | New England Biolabs | E2621 | |
| Commercial assay or kit | In-Fusion HD Cloning Kit | Takara | 639648 | |
| Commercial assay or kit | KOD -Plus- Mutagenesis Kit | Toyobo | SMK-101 | |
| Software, algorithm | MASCOT server | Matrix science | https://www.matrixscience.com/server.html RRID:SCR_014322 | |
| Software, algorithm | ImageJ | Schneider et al., 2012 | https://imagej.nih.gov/ij/ | |
| Other | DAPI solution | DOJINDO | Lot.PF082 340–07971 | |
| Other | N-2 Supplement | Thermo Fisher | 17502–048 | |
| Other | B-27 Supplement | Thermo Fisher | 17504–044 | |
| Other | Neurobasal Medium | Thermo Fisher | 21103–049 | |
| Other | Penicillin-Streptomycin | Thermo Fisher | 15070–063 | |
| Other | HBSS (X10) | Thermo Fisher | 14185–052 | |
| Other | HEPES (1 M) | Thermo Fisher | 15630–080 | |
| Other | Papain | Worthington Biochemical Corporation | LK003178 | |
| Other | Fast Green | Wako | 061–00031 | |
| Other | Protease Inhibitor Cocktail | Sigma | P8340-1ML | |
| Other | Streptavidin Magnetic Beads | Thermo Fisher | 88817 | |
| Other | Poly-L-Ornithine Solution | Wako | 163–27421 | |
| Other | Skim Milk Powder | Wako | 190–12865 | |
| Other | Immobilon Transfer Membrane PVDF | Millipore | IPVH00010 | |
| Other | Immobilon Western Chemiluminescent | Millipore | WBKLS0500 | |
| Other | Sodium Hyaluronate (M2) (Mw:600,000~1,120,000) | PG Research | NaHA-M2 | |
| Other | Biotinylated Sodium Hyaluronate (M1) (Mw:600,000~1,120,000) | PG Research | BHHA-M1 | |
| Other | Carboxyfluorescein diacetate succinimidyl ester | DOJINDO | 341–07401 | |
| Other | GFP-Trap-Agarose | Chromotek | gta-20 | |
| Other | ELISA 96 well plate | IWAKI | 3801–096 | |
| Other | BLOCK ACE Powder | KAC | UKB80 | |
| Other | ELISA POD Substrate TMB Solution | Nacalai | 05299–54 | |
| Other | Hyaluronan Binding Protein (HABP) | Cosmo-bio | BC40 | |
| Other | Hyaluronic Acid Sodium Salt | Wako | 083–10341 | |
| Other | Streptavidin, Alexa Fluor 488 conjugate | Thermo Fisher | S-11223 | |
| Other | Biotinylated Hyaluronan Binding Protein | Hokudo | BC41 | |
| Other | SuperScript III reverse transcriptase | Thermo Fisher | 18080044 | |
| Other | OCT Compound | Sakura Finetek | 45833 | |
| Other | Anion exchange chromatography resin | Tosoh | TOYOPEARL DEAE-650M | |
| Other | Heparin-agarose | Sigma | H6508 | |
| Other | Ultrafiltration filter | Amicon | YM-10 | |
| Other | α-cyano-4-hydroxycinnamic acid | Shimadzu | 70990 | |
| Other | Lipofectamine 3000 Reagent | Thermo Fisher | L3000008 | |
| Other | Electroporator | NEPA GENE | NEPA21 | |
| Other | 5 mm-diameter tweezers-type disc electrodes | NEPA GENE | CUY650P5 | |
| Other | 2.5 mm x 4 mm tweezers-type disc electrodes | NEPA GENE | CUY652P2.5X4 | |
| Other | Vibratome | Leica | VT1200S | |
| Other | LuminoGraph | ATTO | WSE-6100H-ACP | |
| Other | Confocal laser scanning microscope | Nikon | AX | |
| Other | Confocal laser scanning microscope | Carl Zeiss | LSM 710 NLO | |
| Other | Fluorescence stereomicroscope | Leica | M165FC | |
| Other | Animal anesthetizer | Muromachi | MK-AT210 | |
| Other | StepOne Real-Time PCR System | Thermo Fisher | 4376374 | |
| Other | Cryostat | Leica | CM3050 S | |
| Other | Direct nanoLC/MALDI fraction system | KYA technologies | DiNa-MaP | |
| Other | MALDI mass spectrometer | SCIEX | TOF/TOF 5800 | |
| Other | LC-MS/MS System | SCIEX | QTRAP 5500 | |
| Other | Fluorescence-activated cell sorter | Bay bioscience | JSAN |
Additional files
Download links
A two-part list of links to download the article, or parts of the article, in various formats.
Downloads (link to download the article as PDF)
Open citations (links to open the citations from this article in various online reference manager services)
Cite this article (links to download the citations from this article in formats compatible with various reference manager tools)
Assembly of neuron- and radial glial-cell-derived extracellular matrix molecules promotes radial migration of developing cortical neurons
eLife 12:RP92342.
https://doi.org/10.7554/eLife.92342.3


