Antipsychotic-induced epigenomic reorganization in frontal cortex of individuals with schizophrenia
- Department of Chemical Engineering, Virginia Tech, United States
- Department of Chemistry and Biochemistry, University of California, San Diego, United States
- Department of Biomedical Engineering and Mechanics, Virginia Tech, United States
- Department of Physiology and Biophysics, Virginia Commonwealth University School of Medicine, United States
- Department of Pharmacology, University of the Basque Country UPV/EHU, CIBERSAM, Biocruces Health Research Institute, Spain
- Department of Cellular and Molecular Medicine, University of California, San Diego, United States
Figures
Figure 1 with 7 supplements
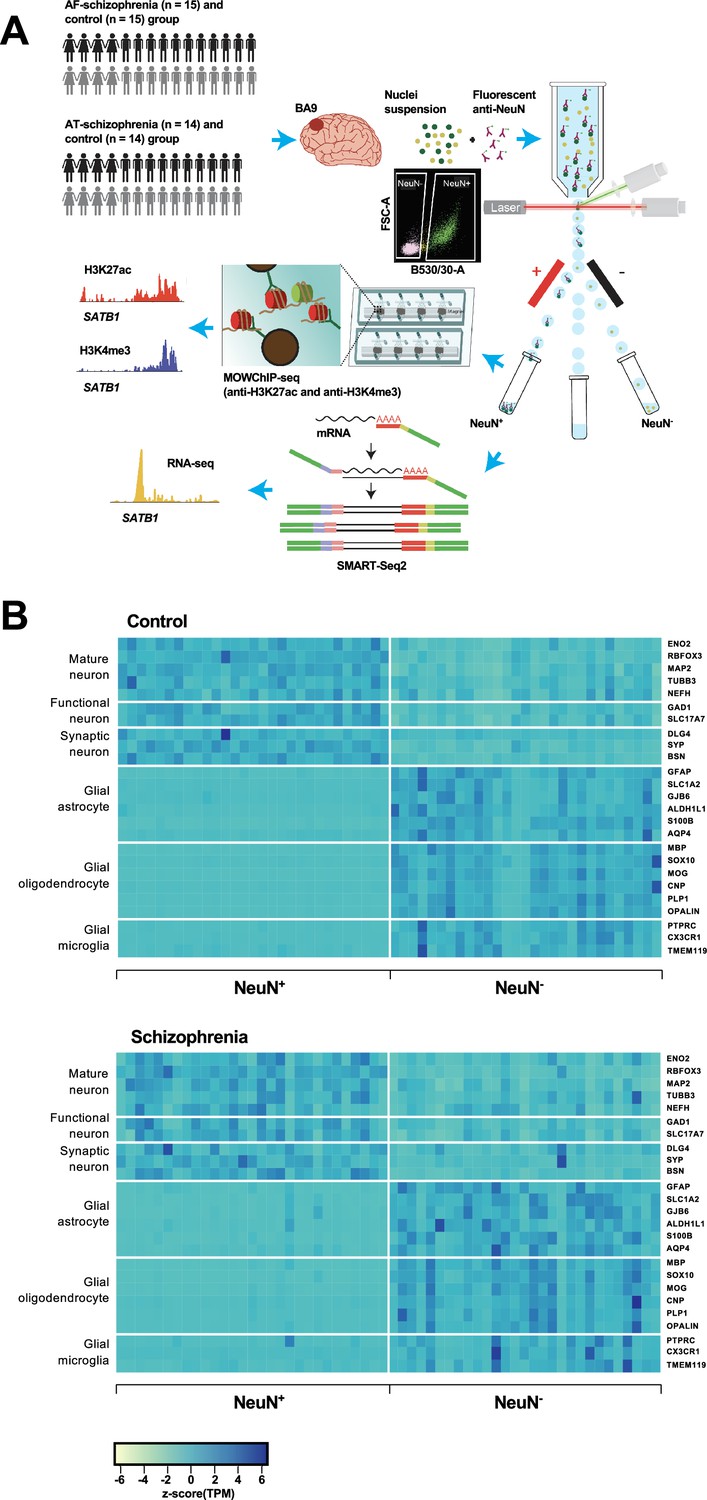
Overview of the multi-omics protocol for analyzing frontal cortex of schizophrenia subjects and controls.
(A) Overview of the experimental design starting from postmortem human frontal cortex samples to generate cell type-specific H3K27ac, H3K4me3, and RNA profiles. (B) Heatmap of the expression of neuronal and glial cell markers across all NeuN+ and NeuN- frontal cortex samples from 29 control subjects and 29 schizophrenia subjects.
Figure 1—figure supplement 1
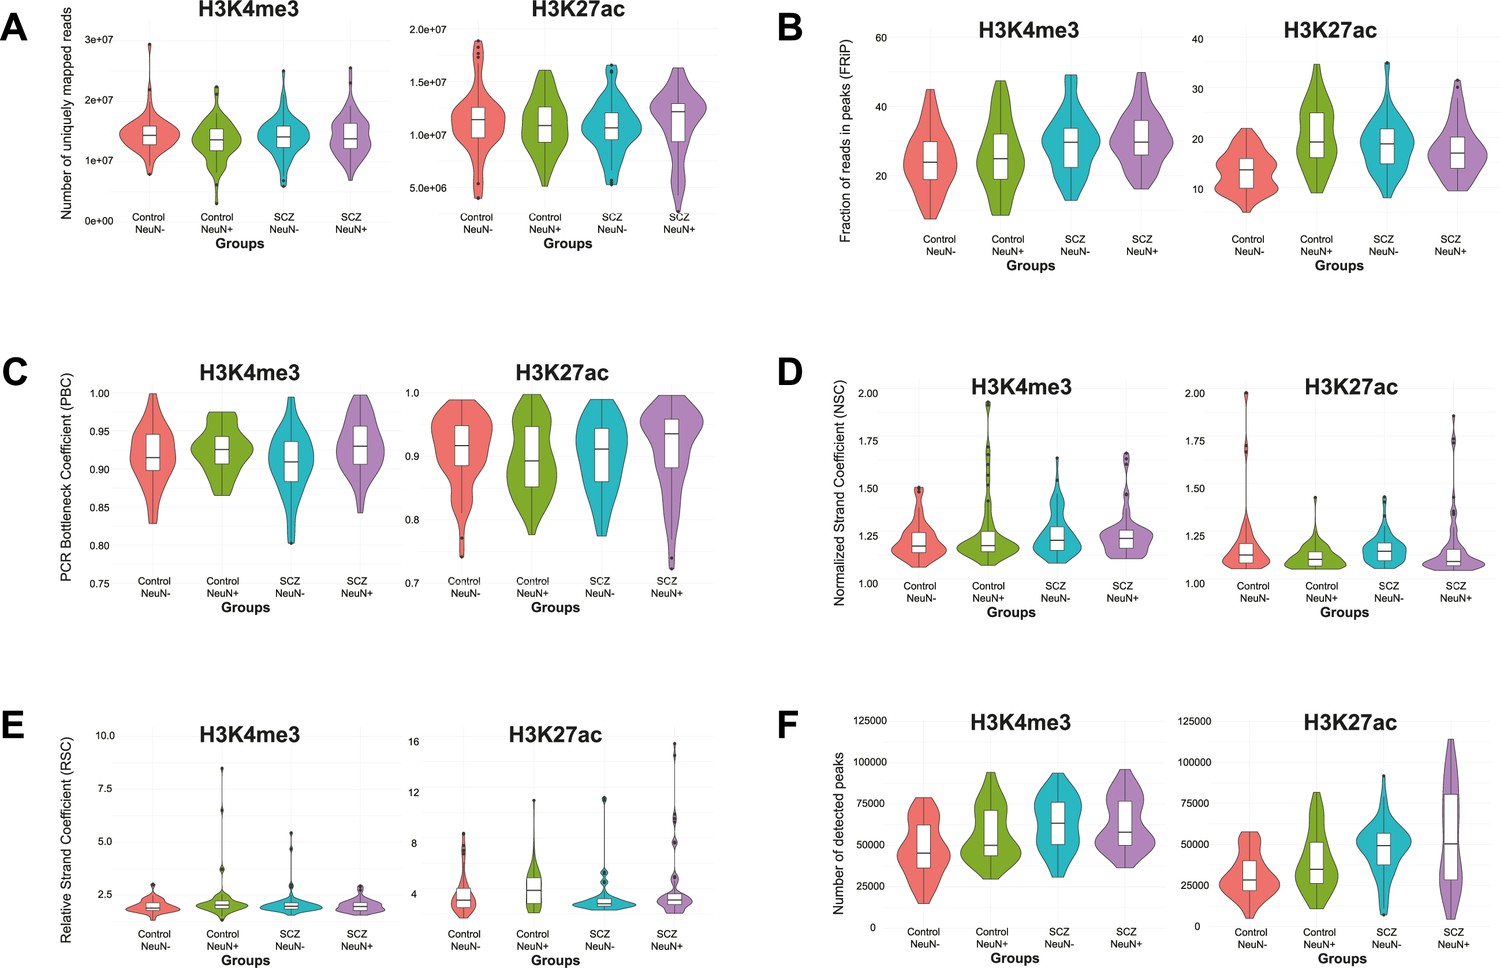
Distribution of six quality control metrics for ChIP-seq data on H3K4me3 and H3K27ac in NeuN-positive (NeuN+) and NeuN-negative (NeuN-) nuclei from schizophrenia and control groups, respectively.
(A) Number of uniquely mapped reads obtained by bowtie2 and bedtools. (B) Fraction of reads in peaks (FRiP) obtained by featureCounts. (C) PCR Bottleneck Coefficient (PBC) obtained by encodeChIPqc. (D) Normalized Strand Coefficient (NSC) obtained by Phantompeakqualtools. (E) Relative Strand Coefficient (RSC) obtained by Phantompeakqualtools. (F) Number of identified peaks by MACS2.
Figure 1—figure supplement 2

Saturation curves on the relationship between the number of sequencing reads and the number of identified peaks with our ChIP-seq data on H3K4me3 and H3K27ac.
Figure 1—figure supplement 3
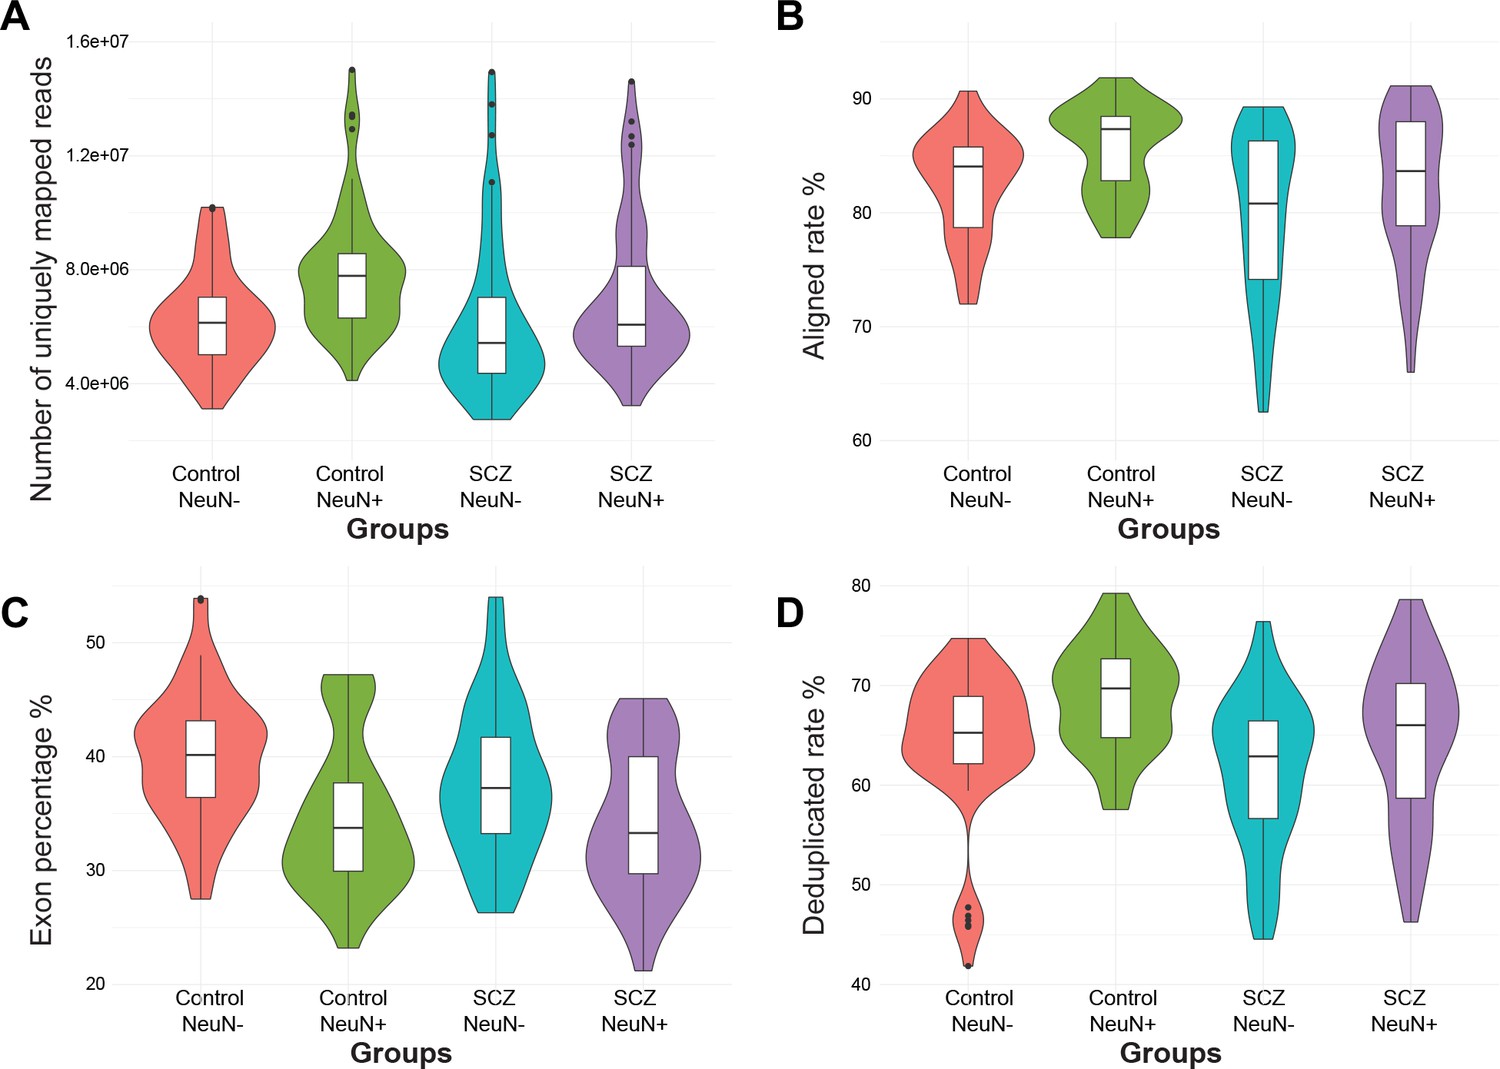
Distribution of four quality control metrics for RNA-seq data in NeuN-positive (NeuN+) and NeuN-negative (NeuN-) nuclei from schizophrenia and control groups.
(A) Number of uniquely mapped reads. (B) Aligned rate. (C) Percentage of reads overlapping exons. (D) Deduplicate rate (percentage of unique reads).
Figure 1—figure supplement 4

Representative results from fluorescence-activated cell sorting (FACS) sorting demonstrating the separation of neuronal (NeuN+) and non-neuronal (NeuN-) nuclei using fluorescence-labeled anti-NeuN antibody in postmortem human frontal cortex samples.
Figure 1—figure supplement 5

Expression of neuronal (NeuN+) and non-neuronal (NeuN-) representative marker genes.
Comparative bar plots with the expression of neuronal (A and B) and glial (C and D) cell markers in both NeuN-positive (NeuN+) and NeuN-negative (NeuN-) frontal cortex samples from 29 control subjects (A and C) and 29 individuals with schizophrenia (B and D).
Figure 1—figure supplement 6

Venn diagrams of the overlap between the identified peaks from our ChIP-seq study (green) and previous datasets (Girdhar et al., 2022) (cyan).
(A) H3K27ac peak overlap (Mb) between our study (NeuN-positive, NeuN+) and previous datasets (NeuN+). (B) H3K27ac peak overlap (Mb) between our study (NeuN+) and previous datasets (bulk). (C) H3K27me3 peak overlap (Mb) between our study (NeuN+) and previous datasets (NeuN+).
Figure 1—figure supplement 7
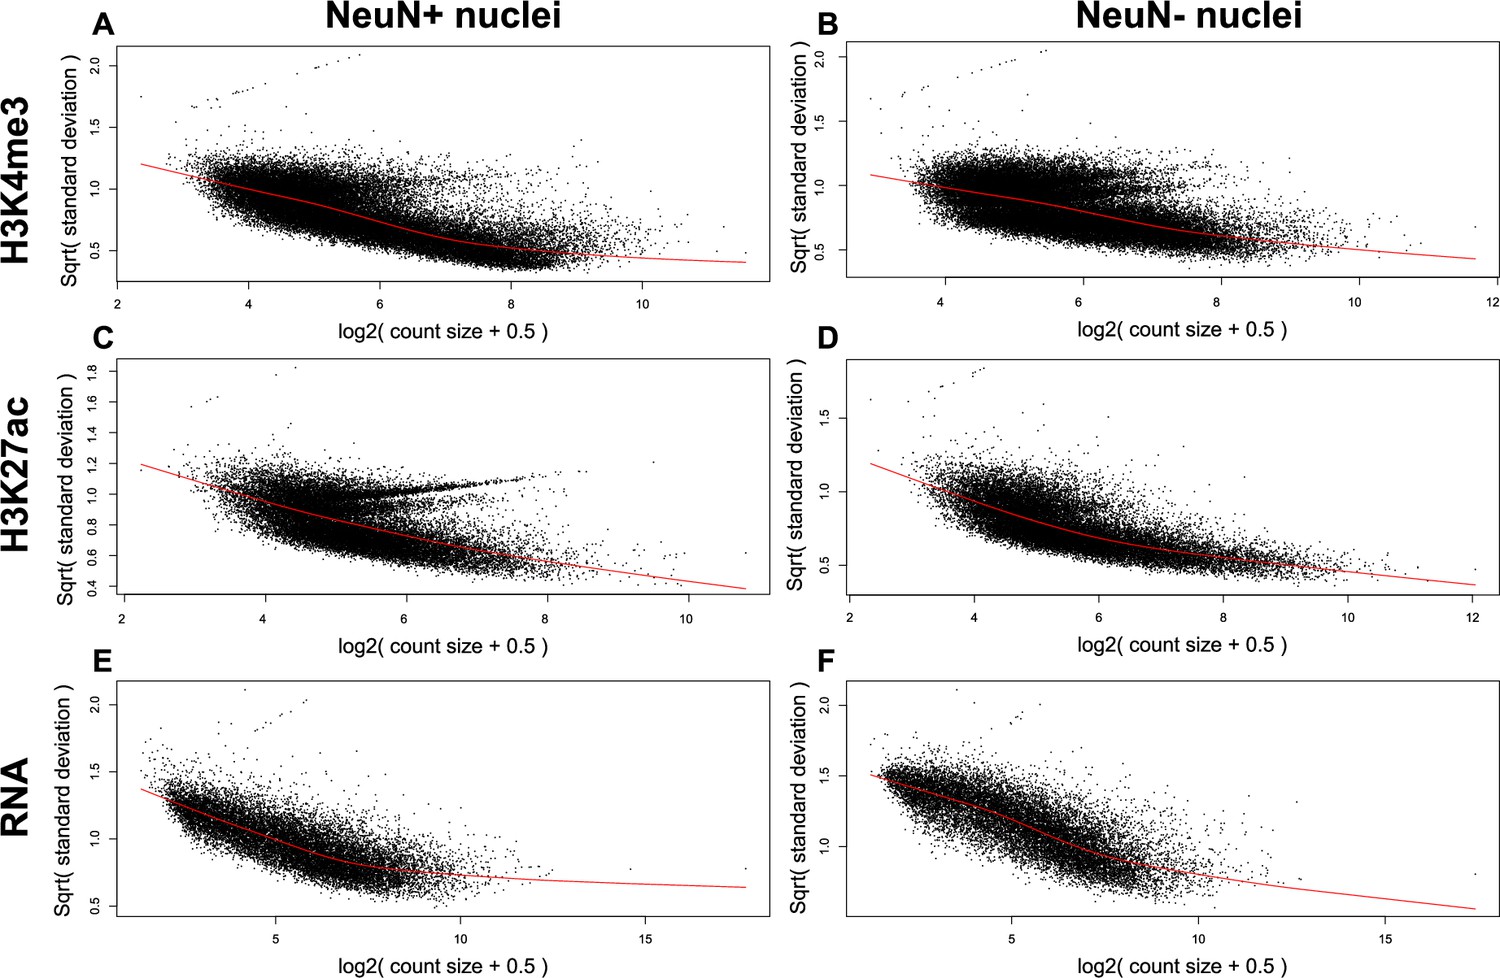
Visualization of peak-wise or gene-wise means and variances of ChIP-seq and RNA-seq data, respectively, by voom plots.
The LOWESS curves (red lines) indicate the smooth mean-variance trend. (A) ChIP-seq data on H3K4me3 from NeuN-positive (NeuN+) nuclei. (B) ChIP-seq data on H3K4me3 from NeuN-negative (NeuN-) nuclei. (C) ChIP-seq data on H3K27ac from NeuN+ nuclei. (D) ChIP-seq data on H3K27ac from NeuN- nuclei. (E) RNA-seq data from NeuN+ nuclei. (F) RNA-seq data from NeuN- nuclei.
Figure 2 with 2 supplements
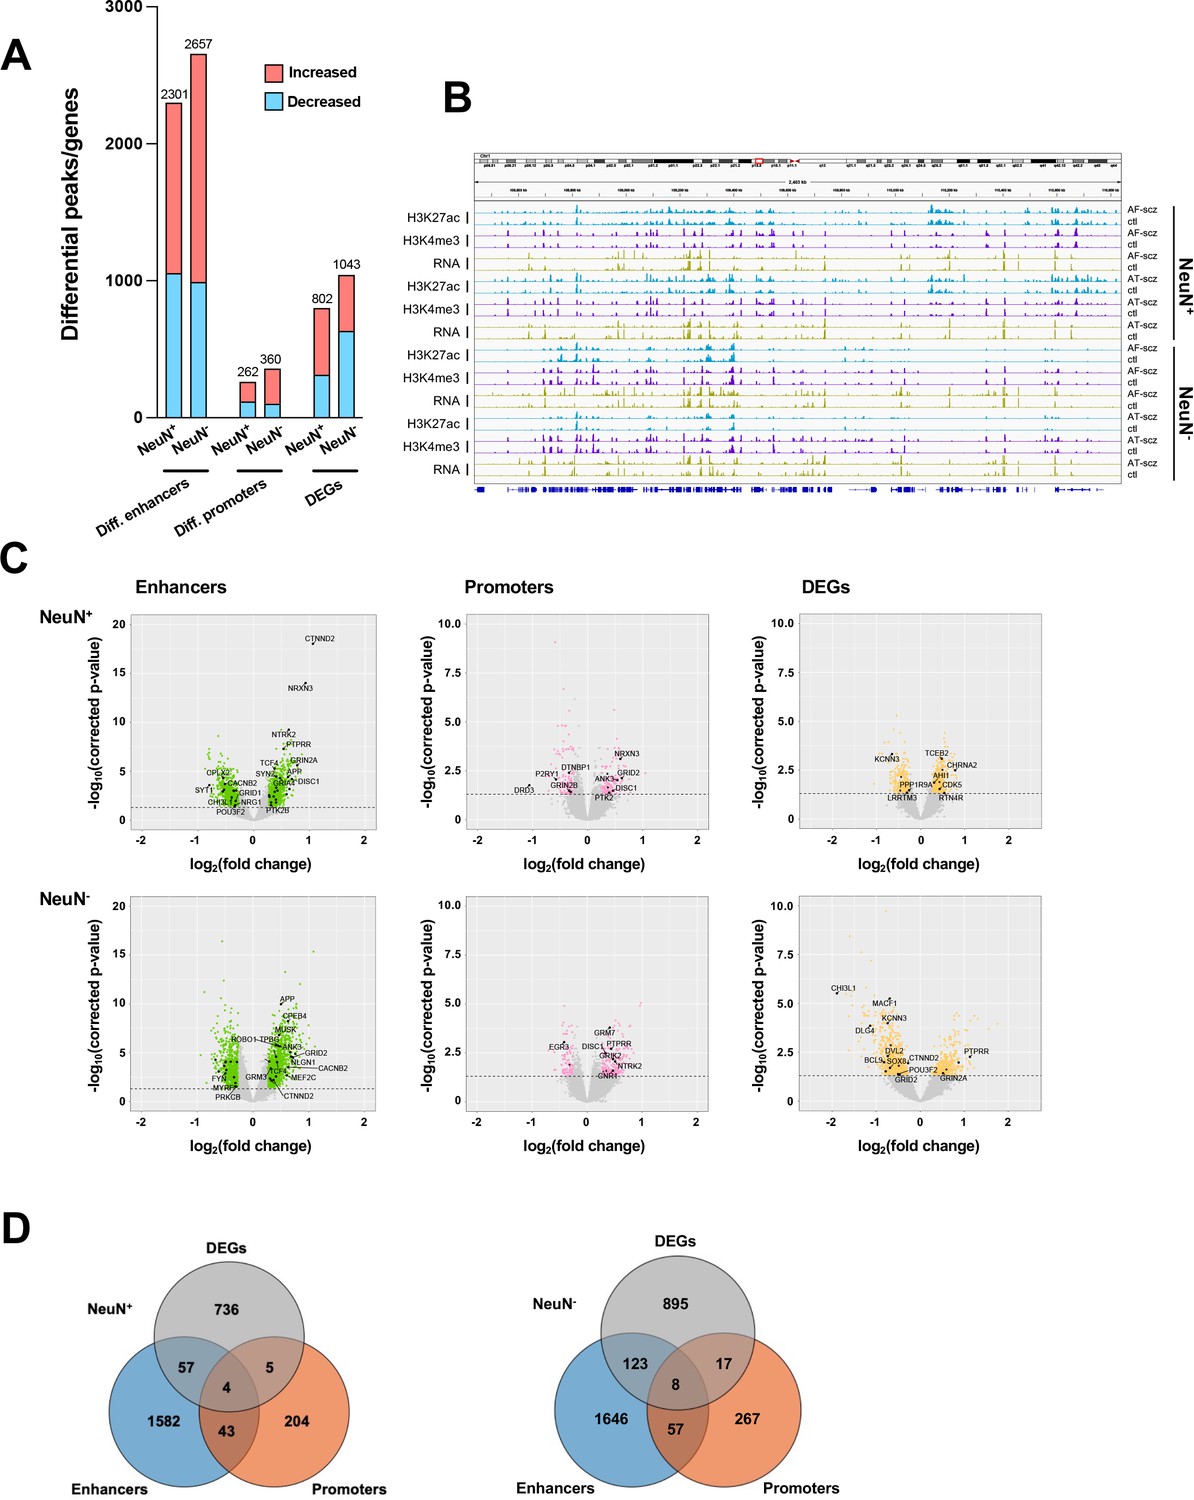
Comparison of epigenomic and transcriptomic landscapes in the frontal cortex of schizophrenia subjects and controls.
(A) Differential enhancer/promoter peaks and differentially expressed genes (DEGs) obtained by comparing schizophrenia (n=29) and controls (n=29). The differential peaks or DEGs were identified using FDR <0.05. (B) Exemplar genomic track view of H3K27ac, H3K4me3, and RNA signals for matched AF-schizophrenia/control and AT-schizophrenia/control pairs in NeuN-positive (NeuN+) and NeuN-negative (NeuN-) cells. 50 Mb region displayed: chr1:68,000,000–118,000,000 (GRCh38). (C) Volcano plots showing genes associated with differential enhancer and promoter peaks and DEGs. Candidate genes for schizophrenia or genes involved in significant GO terms are labeled. The horizontal lines indicate FDR of 0.05. (D) Venn diagrams on the relationship among genes associated with differential enhancer or promoter peaks and DEGs.
Figure 2—figure supplement 1
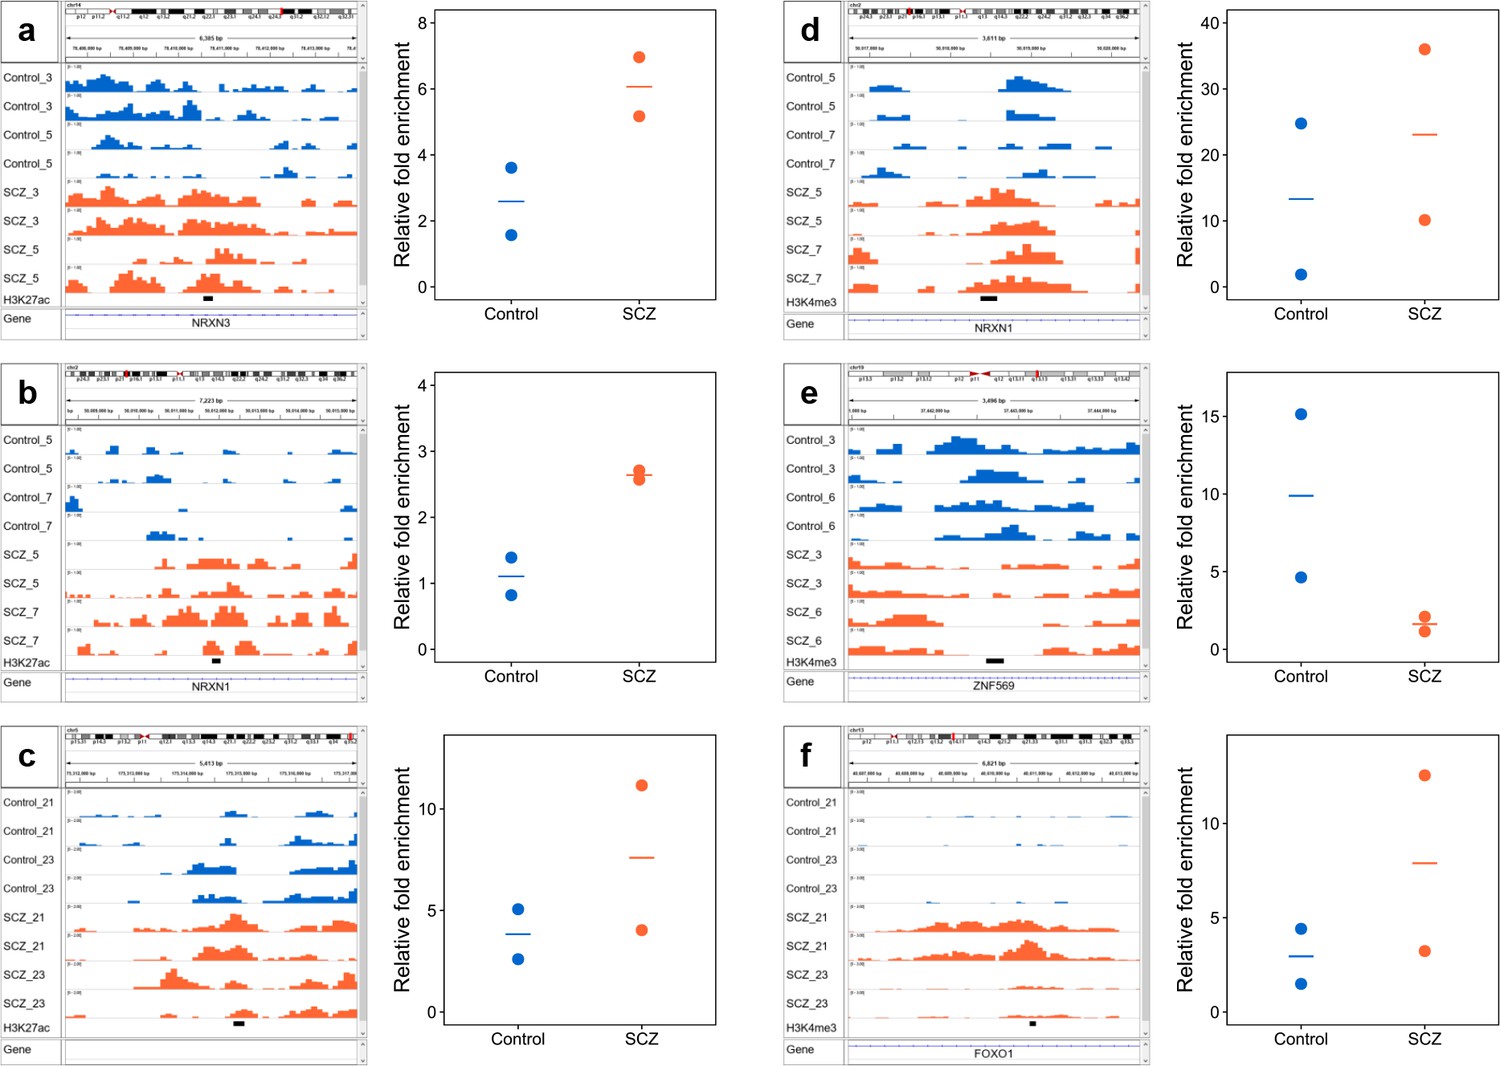
qPCR validation of selected differential ChIP-seq peaks in NeuN+ fraction for H3K27ac (a-c) and H3K4me3 (d-f).
ChIP DNA yielded by MOWChIP assays was examined by qPCR. Primers were designed for each peak (see Methods) and amplicon regions were marked by a black bar under genome browser tracks. A common negative locus at gene AFM was used for all assays. Relative enrichment of peaks against the negative locus was calculated and shown for all samples. We conducted one ChIP-qPCR assay and two ChIP-seq replicates on each sample.
Figure 2—figure supplement 2
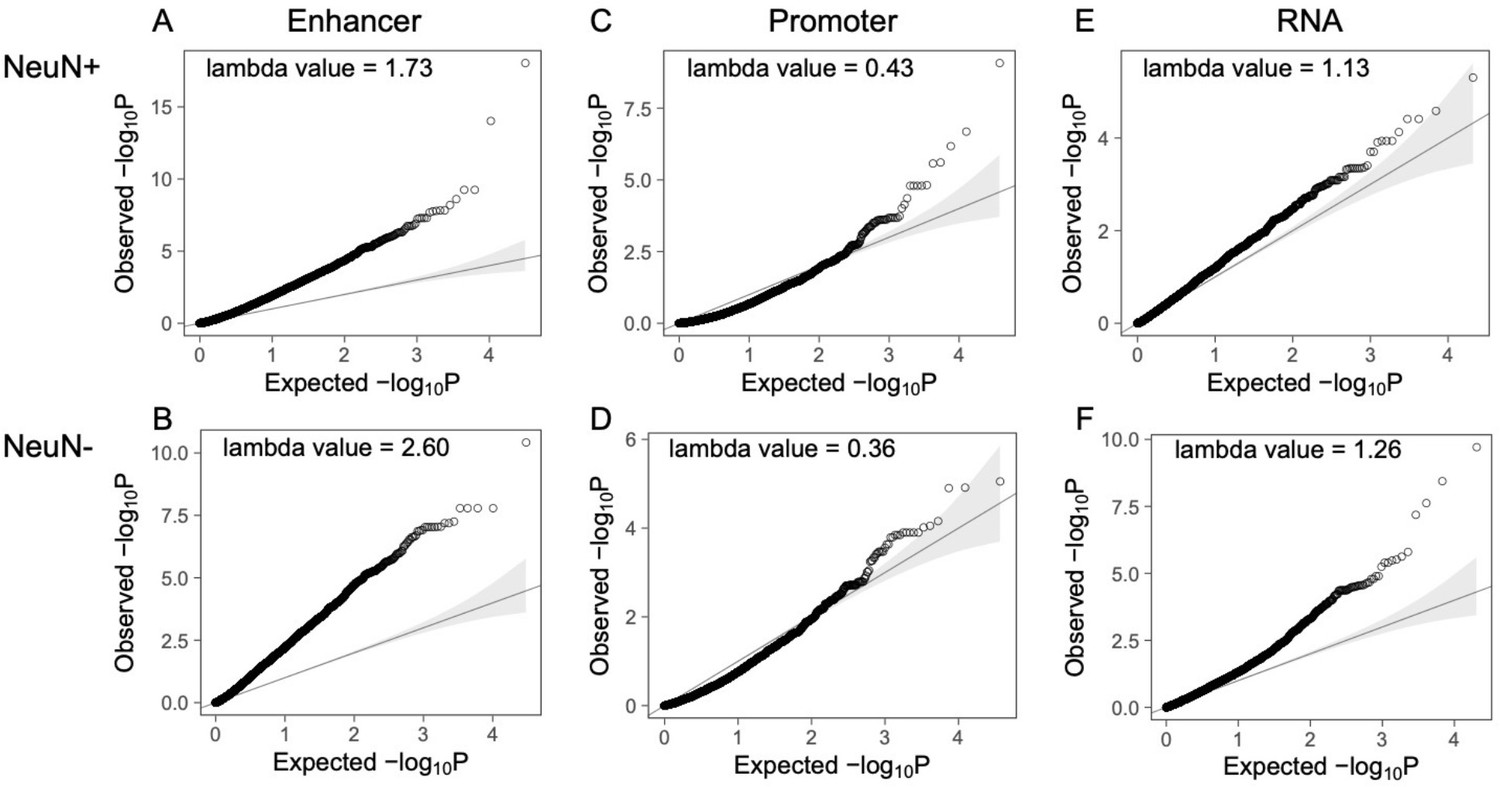
Q-Q plots of the corrected p-value from differential peaks at enhancer/promoter regions and differentially expressed genes.
(A) Differential enhancer peaks from NeuN-positive (NeuN+) nuclei. (B) Differential enhancer peaks from NeuN-negative (NeuN-) nuclei. (C) Differential promoter peaks from NeuN+ nuclei. (D) Differential promoter peaks from NeuN- nuclei. (E) Differentially expressed genes from NeuN+ nuclei. (F) Differentially expressed genes from NeuN- nuclei.
Figure 3

Genome-wide multidimensional clusters in the frontal cortex of schizophrenia subjects and controls.
(A) Integrative analysis using EpiSig. 814 EpiSig clusters across 348 genome-wide sequencing datasets were grouped into 6 sections. The heatmap shows the signal in each EpiSig cluster (row: EpiSig cluster; column: marker). (B) For each EpiSig cluster, from left to right, the heatmaps are: the region percentage in each chromosome; the genomic annotation; the CpG annotation; the percentage of enhancer; the difference signal between schizophrenia and controls in NeuN-positive (NeuN+) and NeuN-negative (NeuN-) nuclei.
Figure 4
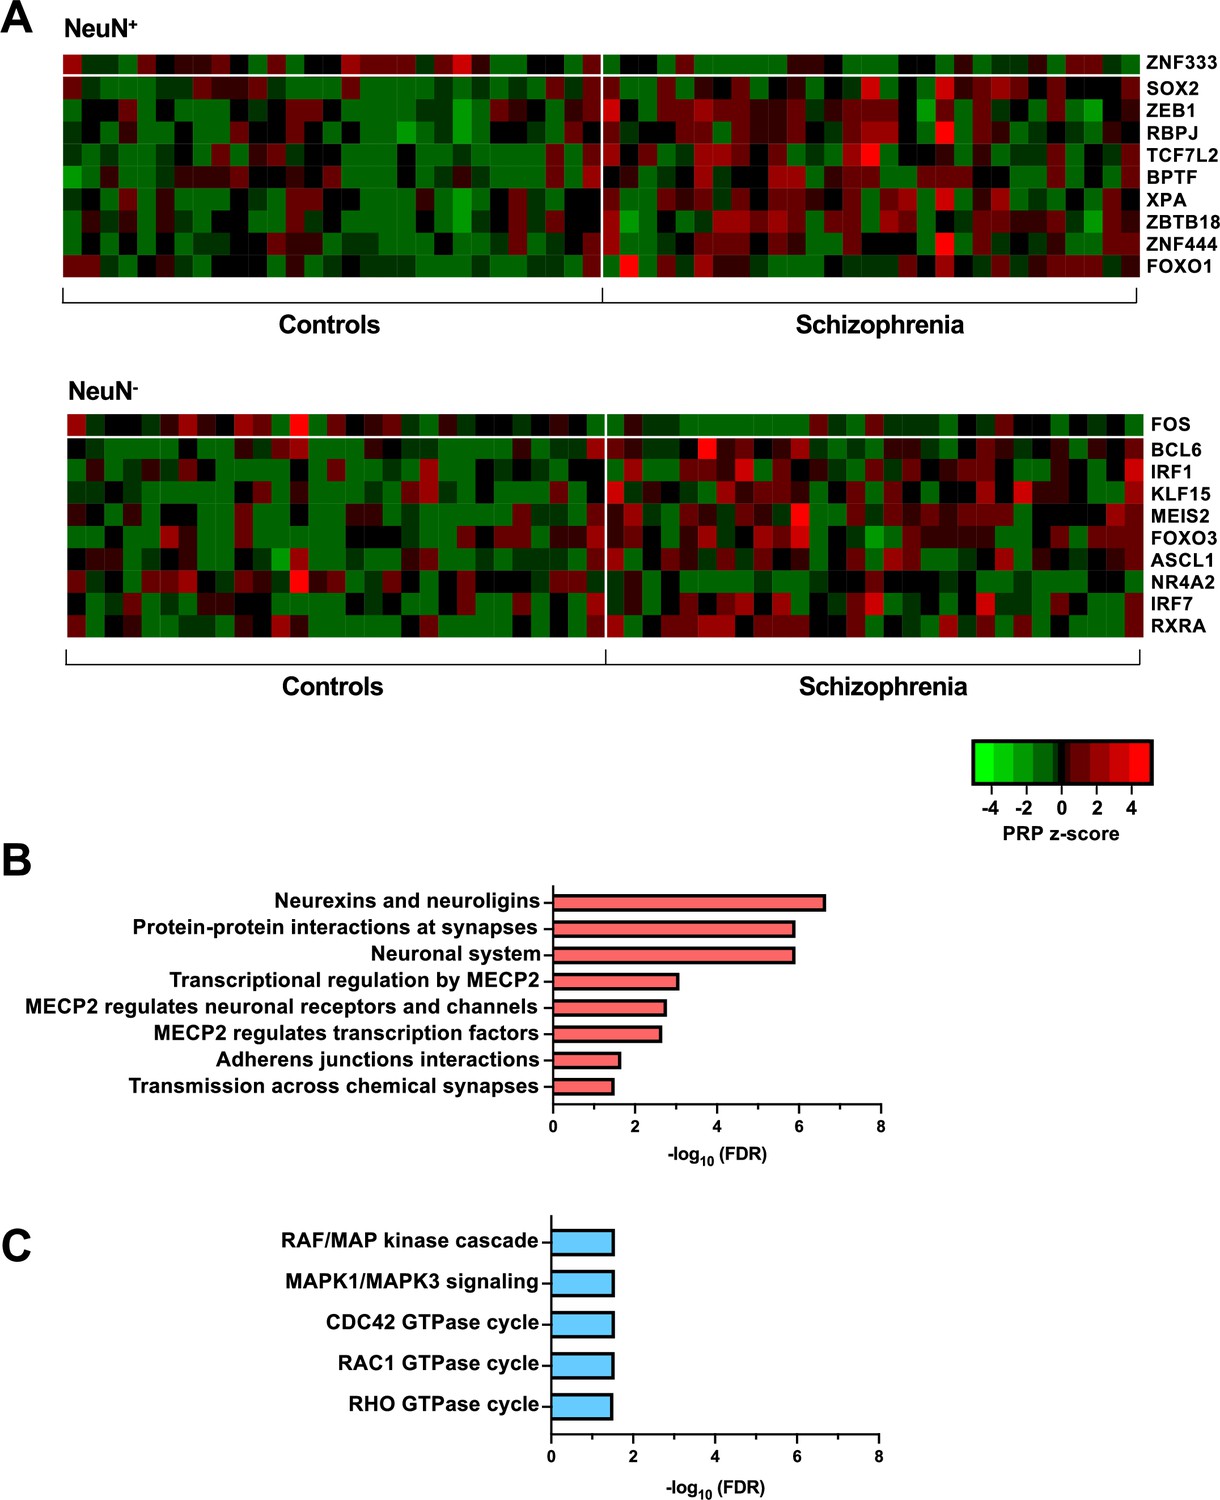
Transcriptional regulatory processes in the frontal cortex of schizophrenia subjects and controls.
(A) Heatmap of z-score Personalized PageRank (PPR) for top 10 significantly differentially expressed transcription factors (TFs) (FDR <0.05) ranked by absolute change in PPR for NeuN-positive (NeuN+) (upper panel) and NeuN-negative (NeuN-) (lower panel) schizophrenia vs control nuclei samples. (B) Overrepresented pathway analysis (FDR <0.05) for 203 downstream regulatees common to the top four schizophrenia vs control NeuN+-specific transcription factors (TFs) (ZNF333, SOX2, ZEB1, and RBPJ). (C) Overrepresented pathway analysis (FDR <0.05) for 225 downstream regulatees common to the top four schizophrenia vs control NeuN--specific TFs (FOS, BCL6, IRF1, and KLF15).
Figure 5 with 4 supplements

Epigenomic alterations affected by antipsychotic treatment.
(A) Scatter plot of average pairwise change in Personalized PageRank (PPR) (PPRschizophrenia – PPRcontrol) for antipsychotic-free (AF) vs antipsychotic-treated (AT) NeuN-positive (NeuN+) cohorts. Orange regions show cohort (AF – AT)<0.5 (i.e. alterations recovered by antipsychotic treatment), whereas beige regions show cohort (AT – AF)>0.5 (i.e. alterations consequence of antipsychotic treatment). Transcription factors (TFs) FDR <0.05 highlighted in red. (B) Scatter plot of average pairwise change in PPR (PPRschizophrenia – PPRcontrol) for AF vs AT NeuN- cohorts. Dark blue regions show cohort (AF – AT)<0.5 (i.e. alterations recovered by antipsychotic treatment), whereas cyan regions show cohort (AT – AF)>0.5 (i.e. alterations consequence of antipsychotic treatment). TFs FDR <0.05 highlighted in red. (C) Number of differentially expressed gene (DEG) regulatees by TFs, and number of DEGs in NeuN+ nuclei from AF-schizophrenia/control pairs. (D) Number of DEG regulatees by TFs, and number of DEGs in NeuN- nuclei from AF-schizophrenia/control pairs. (E) Number of DEG regulatees by TFs, and number of DEGs in NeuN+ nuclei from AT-schizophrenia/control pairs. (F) Number of DEG regulatees by TFs, and number of DEGs in NeuN- nuclei from AT-schizophrenia/control pairs. (G) Functional enrichment analysis of union of genes from AF-schizophrenia/control pairs in NeuN+ nuclei. (H) Functional enrichment analysis of union of genes from AF-schizophrenia/control pairs in NeuN- nuclei. (I) Pairwise expression difference (schizophrenia – control) of an exemplar AF-schizophrenia/control cohort DEG (TUBB2A) across all 29 schizophrenia-control pairs in NeuN+ nuclei. (J) H3K27ac tracks for PDK1 (member of the 84 gene set in E) in NeuN+ nuclei. Box highlighting the FOXO1 DNA-binding motif in promoter at position chr2: 172,555,706–172,555,718 (GRCh38). Two exemplar AT-schizophrenia/control cohort pairs showing differential H3K27ac peak intensity around motif locus and an example AF-schizophrenia/control cohort patient pair with no difference.
Figure 5—figure supplement 1
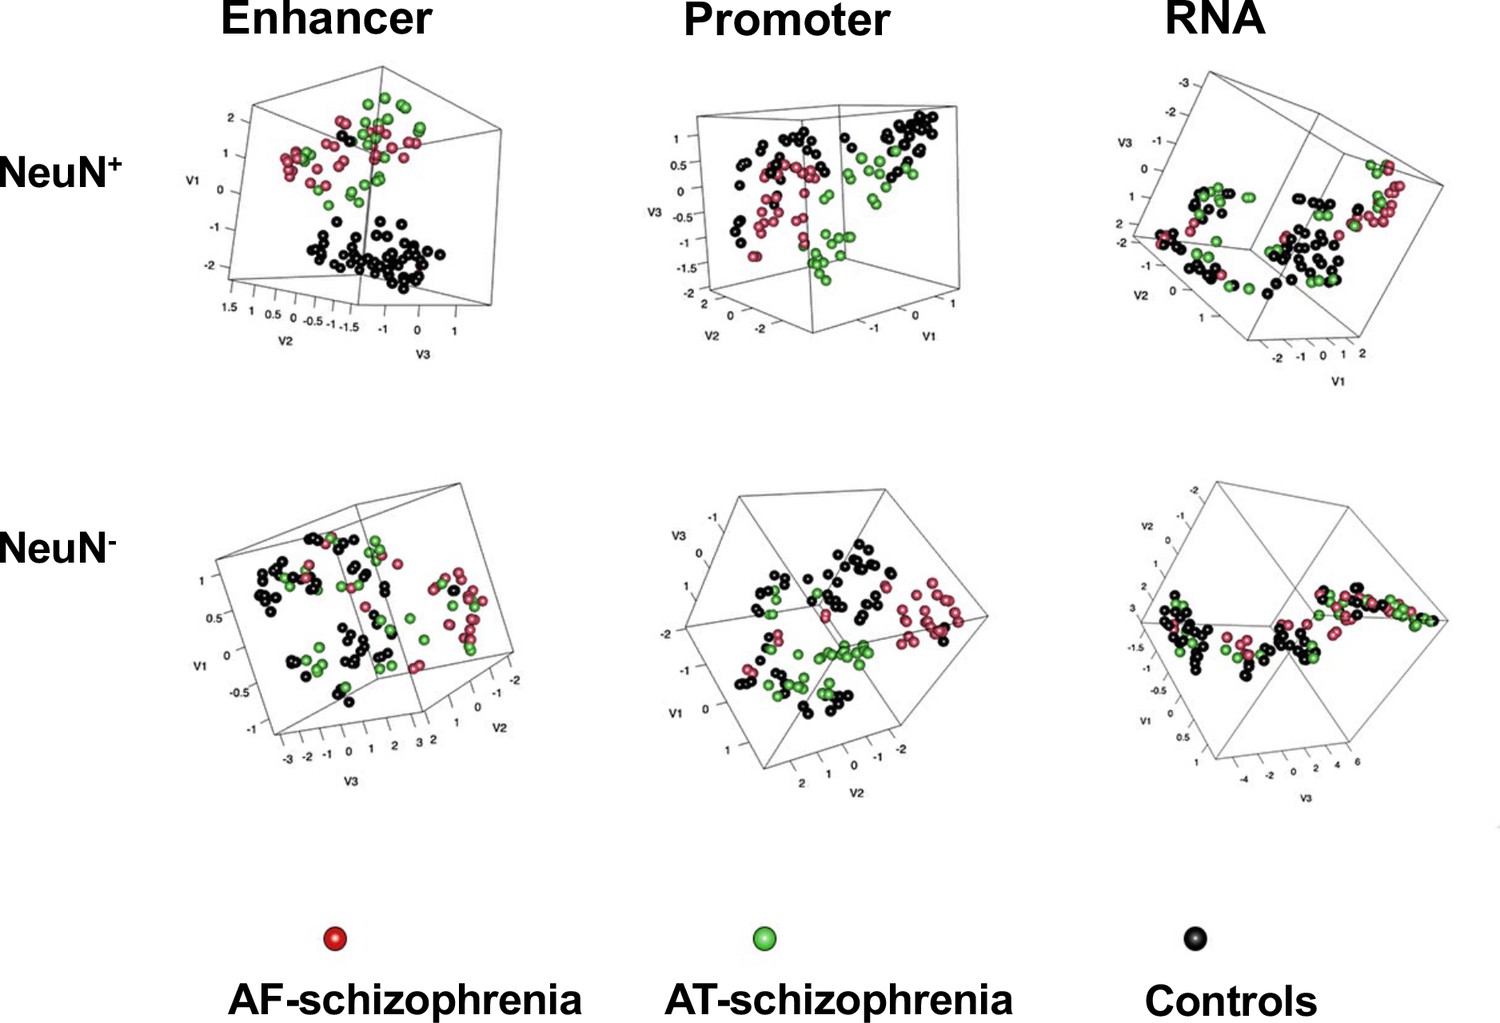
Uniform manifold approximation and projection (UMAP) visualization of the feature matrix of enhancers, promoters, and RNA among antipsychotic-free (AF)-schizophrenia, antipsychotic-treated (AT)-schizophrenia, and control subjects.
Figure 5—figure supplement 2

Differential peak enrichment analysis for antipsychotic-free NeuN-positive (NeuN+) nuclei in EpiSig clusters.
(a) Percentage of total antipsychotic-free (AF)-specific differential H3K27ac peaks in the 22 significantly enriched (FDR <0.05) EpiSig clusters. Top three clusters 630, 732 (Section 1) and 449 (Section 2) highlighted in red. Differential peaks (all cluster regions for clusters with less than 10 differential peaks) mapped to 166 genes using GREAT with default settings. Histograms of ln[distance to tss] and peak width for 36 H3K27ac differential peaks and 72 regions in cluster 449 (median distance to tss 210 kbp). (b) Percentage of total AF-specific differential H3K4me3 peaks in the 22 significantly enriched (FDR <0.05) EpiSig clusters. Top three, clusters 582 (Section 6), 270 and 259 (Section 2) highlighted in red. Differential peaks (all cluster regions for clusters with less than 10 differential peaks) mapped to 128 genes using GREAT with default settings. Histograms of ln[distance to tss] and peak width for 19 H3K27ac differential peaks (median distance to tss 186 kbp) and 16 H3K4me3 differential peaks (median distance to tss 141 kbp). (c) Functional enrichment analysis for the union of gene sets (294 genes) (Supplementary file 14).
Figure 5—figure supplement 3
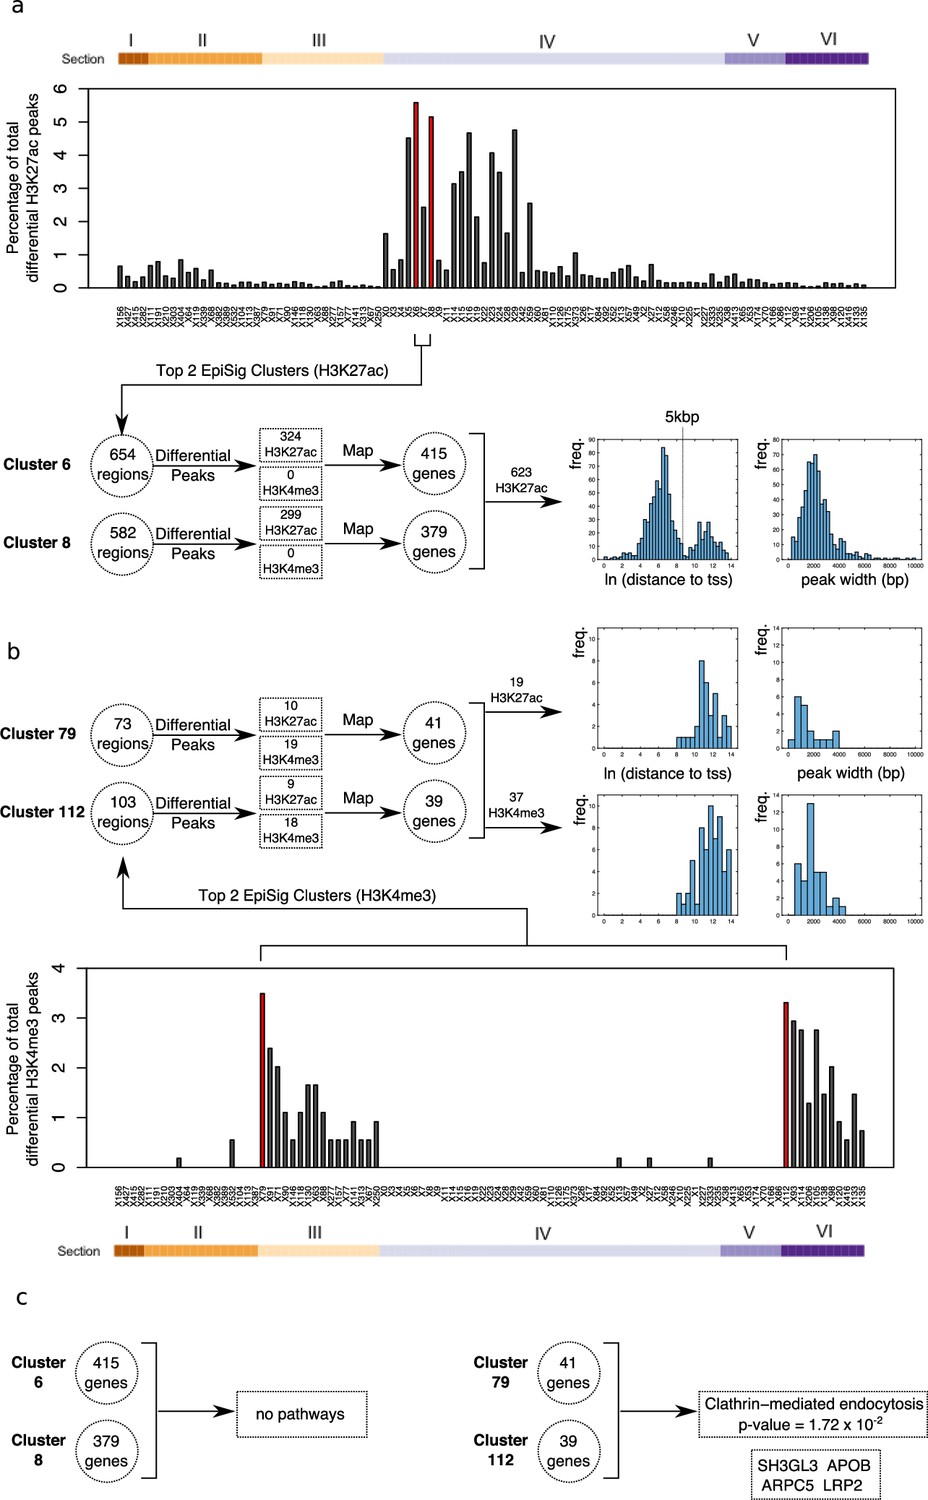
Differential peak enrichment analysis for antipsychotic-treated NeuN-positive (NeuN+) nuclei in EpiSig clusters.
(a) Percentage of total antipsychotic-treated (AT)-specific differential H3K27ac peaks in the 99 significantly enriched (FDR <0.05) EpiSig clusters. Top two clusters 6 and 8 (Section 4) highlighted in red. Differential peaks mapped to 794 genes using GREAT with default settings. Histograms of ln[distance to tss] and peak width for 623 H3K27ac differential peaks showing bimodal proximal/distal distribution. (b) Percentage of total AT-specific differential H3K4me3 peaks in the 99 significantly enriched (FDR <0.05) EpiSig clusters. Top two clusters 79 (Section 3) and 112 (Section 6) highlighted in red. Differential peaks mapped to 80 genes using GREAT with default settings. Histograms of ln[distance to tss] and peak width for 19 H3K27ac differential peaks (median distance to tss 83 kbp) and 37 H3K4me3 differential peaks (median distance to tss 142 kbp). (c) Functional enrichment analysis for the H3K4me3 differential peak gene set (80 genes) (Supplementary file 17).
Figure 5—figure supplement 4
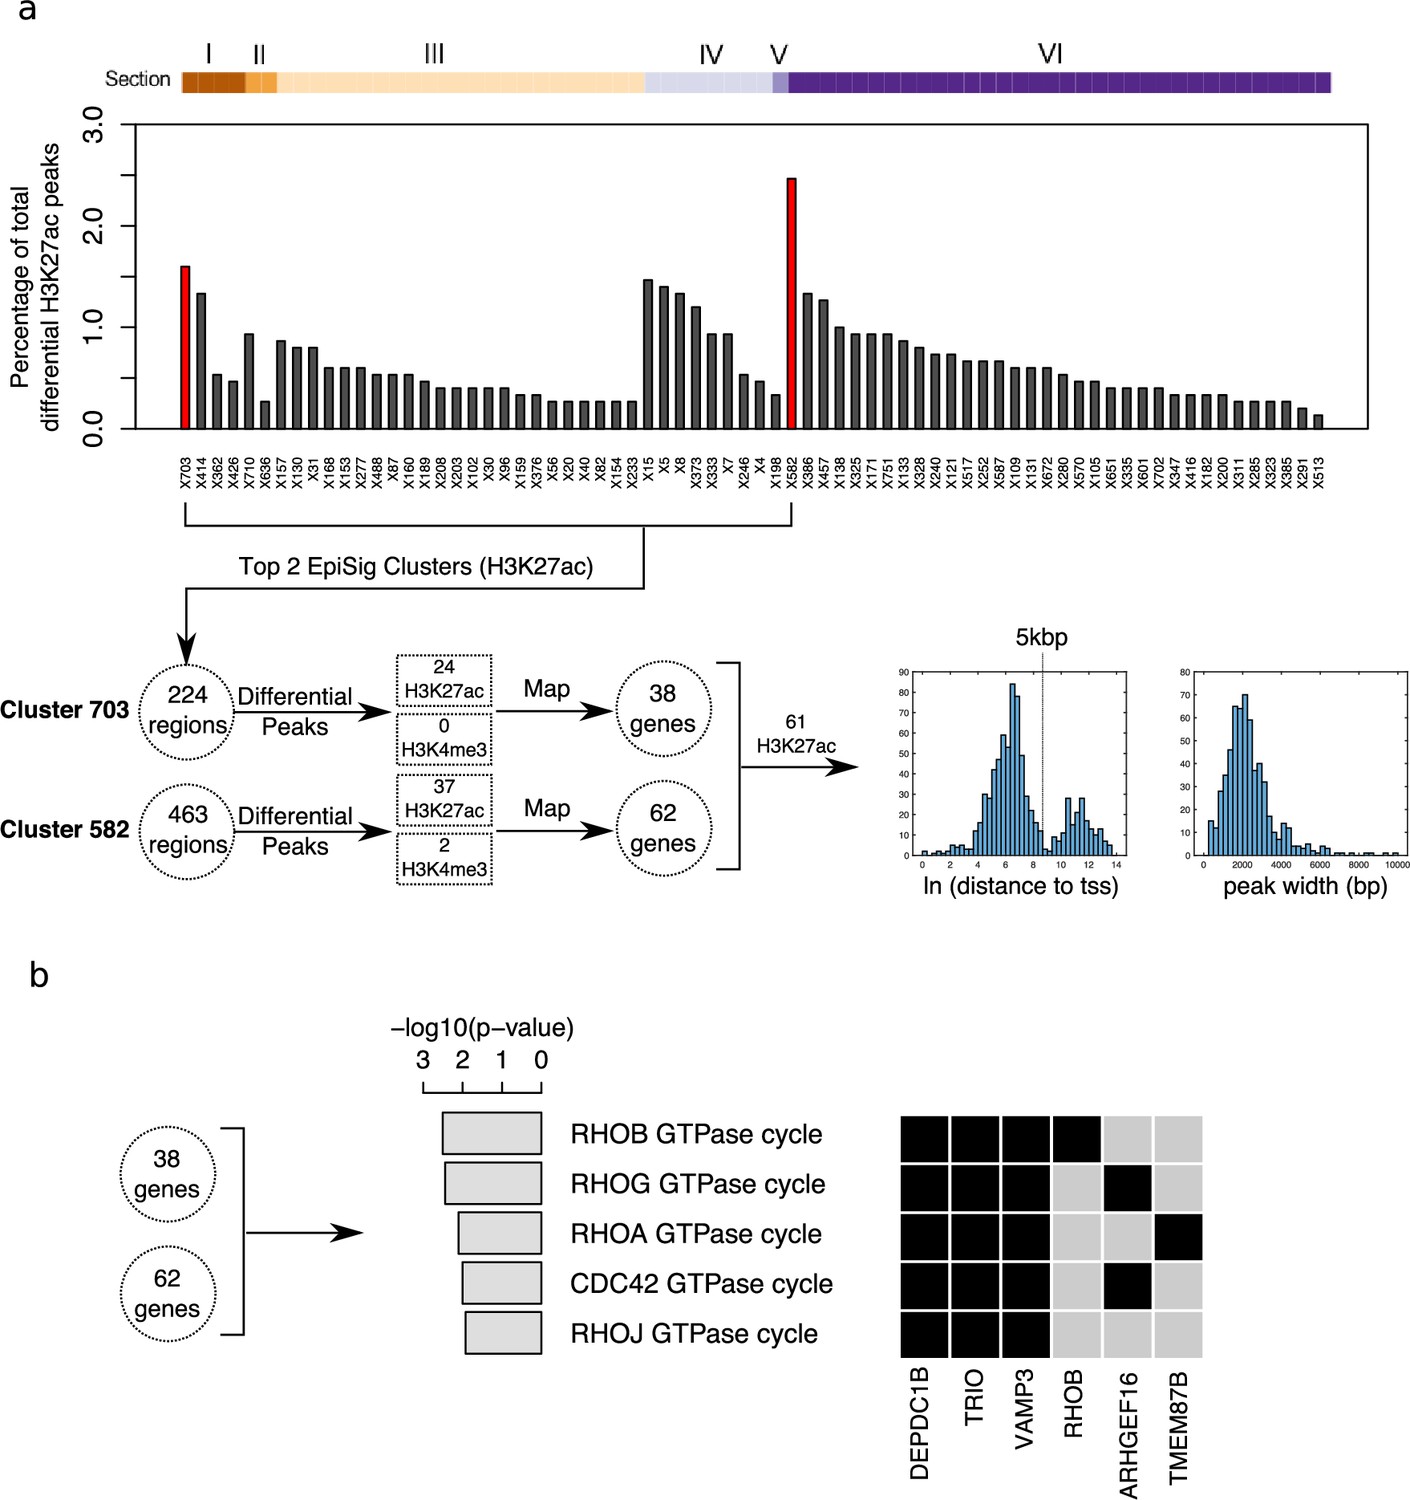
Differential peak enrichment analysis for antipsychotic-treated NeuN-negative (NeuN-) nuclei in EpiSig clusters.
(a) Percentage of total antipsychotic-treated (AT)-specific differential H3K27ac peaks in the 72 significantly enriched (FDR <0.05) EpiSig clusters. Top two clusters 582 (Section 6) and 703 (Section 1) highlighted in red. Differential peaks mapped to 100 genes using GREAT with default settings. Histograms of ln[distance to tss] and peak width for 61 H3K27ac differential peaks showing bimodal proximal/distal distribution. (b) Functional enrichment analysis for the H3K27ac differential peak gene set (100 genes) (Supplementary file 18).
Figure 6

Effect of antipsychotic treatment on differential enhancers/promoters and differentially expressed genes (DEGs) in NeuN-positive (NeuN+) and NeuN-negative (NeuN-) nuclei from the frontal cortex of schizophrenia subjects and controls.
(A) Differential enhancer/promoter peaks and DEGs were obtained by comparing antipsychotic-free (AF)-schizophrenics and individually matched controls. (B) Differential enhancer/promoter peaks and DEGs obtained by comparing antipsychotic-treated (AT)-schizophrenics and individually matched controls.
Figure 7

Epigenomic effect of age on treated schizophrenia subjects.
(A) Violin plots for Pearson’s R correlation coefficients of age vs expression f 742, 622, and 242 genes from control, antipsychotic-free (AF)-schizophrenia, and antipsychotic-treated (AT)-schizophrenia NeuN-positive (NeuN+) nuclei, respectively. (B) Violin plots for Pearson’s R correlation coefficients of age vs expression for 1031, 389, and 351 genes from control, AF-schizophrenia, and AT-schizophrenia NeuN-negative (NeuN-) nuclei, respectively. (C) Number of pairwise transcription factor (TF) Personalized PageRank (PPR) and pairwise gene expression differences correlated with age in NeuN+ nuclei from AF-schizophrenia/control pairs. (D) Number of pairwise TF PPR and pairwise gene expression differences correlated with age in NeuN+ nuclei from AT-schizophrenia/control pairs. (E) Heatmap for the 14 age positively-correlated (schizophrenia – control increase with age) and 12 age negatively-correlated (schizophrenia – control decrease with age) genes of the significant GO term ‘Regulation of kinase activity’ from the AT-schizophrenia/control NeuN+ cohort. (F) Example gene, WNK1 pairwise expression difference (schizophrenia – control) vs age (Pearson’s R=0.73; p-value = 0.003). (G) Example gene, SFRP2 pairwise expression difference (schizophrenia – control) vs age (Pearson’s R=–0.70; p-value = 0.005). (H) Example TF, EGR2 pairwise PPR difference (schizophrenia – control) vs age (Pearson’s R=0.69; p-value = 0.0003) (I) Number of pairwise TF PPR and pairwise gene expression differences correlated with age in NeuN- nuclei from AF-schizophrenia/control pairs. (J) Number of pairwise TF PPR and pairwise gene expression differences correlated with age in NeuN- nuclei from AT-schizophrenia/control pairs. (K) Heatmap for the 5 age positively-correlated (schizophrenia – control increase with age) genes of the significant GO term ‘Beta-catenin independent WNT signaling’ from the AT-schizophrenia/control NeuN- cohort.
Additional files
-
Supplementary file 1
Demographic information of antipsychotic-free (AF)-schizophrenia subjects and controls.
- https://cdn.elifesciences.org/articles/92393/elife-92393-supp1-v1.doc
-
Supplementary file 2
Demographic information of antipsychotic-treated (AT)-schizophrenia subjects and controls.
- https://cdn.elifesciences.org/articles/92393/elife-92393-supp2-v1.doc
-
Supplementary file 3
Quality control measurements on ChIP-seq datasets.
- https://cdn.elifesciences.org/articles/92393/elife-92393-supp3-v1.xls
-
Supplementary file 4
Quality control measurements on RNA-seq datasets.
- https://cdn.elifesciences.org/articles/92393/elife-92393-supp4-v1.xlsx
-
Supplementary file 5
Transcription frequency in transcripts per kilobase million (TPM) on key marker genes for neuronal and glial nuclei samples from control and schizophrenia subjects.
- https://cdn.elifesciences.org/articles/92393/elife-92393-supp5-v1.xlsx
-
Supplementary file 6
Differential histone modification peaks and differentially expressed genes (DEGs) obtained by comparing schizophrenia and controls.
- https://cdn.elifesciences.org/articles/92393/elife-92393-supp6-v1.xlsx
-
Supplementary file 7
Enrichment of various genome-wide association studies (GWAS) traits in differential enhancers and promoters.
- https://cdn.elifesciences.org/articles/92393/elife-92393-supp7-v1.docx
-
Supplementary file 8
Overlap of differentially expressed genes (DEGs) identified in our study and a previous snRNA-seq study.
- https://cdn.elifesciences.org/articles/92393/elife-92393-supp8-v1.xlsx
-
Supplementary file 9
Genes identified via differential analyses of enhancers, promoters, and RNA by comparing schizophrenia and controls.
- https://cdn.elifesciences.org/articles/92393/elife-92393-supp9-v1.xlsx
-
Supplementary file 10
EpiSig analysis in NeuN-positive (NeuN+) nuclei from the frontal cortex of schizophrenia subjects and controls.
- https://cdn.elifesciences.org/articles/92393/elife-92393-supp10-v1.xlsx
-
Supplementary file 11
EpiSig analysis in NeuN-negative (NeuN-) nuclei from the frontal cortex of schizophrenia subjects and controls.
- https://cdn.elifesciences.org/articles/92393/elife-92393-supp11-v1.xlsx
-
Supplementary file 12
Taiji analysis in NeuN-positive (NeuN+) and NeuN-negative (NeuN-) nuclei from the frontal cortex of schizophrenia subjects and controls.
- https://cdn.elifesciences.org/articles/92393/elife-92393-supp12-v1.xlsx
-
Supplementary file 13
Taiji analysis in NeuN-positive (NeuN+)and NeuN-negative (NeuN-) nuclei from the frontal cortex of antipsychotic-free (AF)-schizophrenia subjects, antipsychotic-treated (AT)-schizophrenia subjects, and controls.
- https://cdn.elifesciences.org/articles/92393/elife-92393-supp13-v1.xlsx
-
Supplementary file 14
EpiSig analysis in NeuN-positive (NeuN+) nuclei from the frontal cortex of antipsychotic-free (AF)-schizophrenia subjects and controls.
- https://cdn.elifesciences.org/articles/92393/elife-92393-supp14-v1.xlsx
-
Supplementary file 15
Differential H3K27ac/H3K4me3 peaks and DEGs obtained by comparing antipsychotic-free (AF)-schizophrenia and antipsychotic-treated (AT)-schizophrenia with their respective matched controls.
- https://cdn.elifesciences.org/articles/92393/elife-92393-supp15-v1.xlsx
-
Supplementary file 16
Genes altered in antipsychotic-free (AF-) but not antipsychotic-treated (AT)-schizophrenics, and those altered in AT- but not AF-schizophrenics.
The lists of genes were obtained by differential analyses of enhancers, promoters, and RNA in AF-schizophrenia, AT-schizophrenia, and their respective controls.
- https://cdn.elifesciences.org/articles/92393/elife-92393-supp16-v1.xlsx
-
Supplementary file 17
EpiSig analysis in NeuN-positive (NeuN+) nuclei from the frontal cortex of antipsychotic-treated (AT)-schizophrenia subjects and controls.
- https://cdn.elifesciences.org/articles/92393/elife-92393-supp17-v1.xlsx
-
Supplementary file 18
EpiSig analysis in NeuN-negative (NeuN-) nuclei from the frontal cortex of antipsychotic-treated (AT)-schizophrenia subjects and controls.
- https://cdn.elifesciences.org/articles/92393/elife-92393-supp18-v1.xlsx
-
Supplementary file 19
Effect of age on chromatin organization in the frontal cortex of AF-schizophrenia subjects, AT-schizophrenia subjects, and controls.
- https://cdn.elifesciences.org/articles/92393/elife-92393-supp19-v1.xlsx
-
Supplementary file 20
Toxicological analysis in postmortem human brain samples.
- https://cdn.elifesciences.org/articles/92393/elife-92393-supp20-v1.xlsx
-
MDAR checklist
- https://cdn.elifesciences.org/articles/92393/elife-92393-mdarchecklist1-v1.docx
Download links
A two-part list of links to download the article, or parts of the article, in various formats.
Downloads (link to download the article as PDF)
Open citations (links to open the citations from this article in various online reference manager services)
Cite this article (links to download the citations from this article in formats compatible with various reference manager tools)
Antipsychotic-induced epigenomic reorganization in frontal cortex of individuals with schizophrenia
eLife 12:RP92393.
https://doi.org/10.7554/eLife.92393.3


