Tgif1-deficiency impairs cytoskeletal architecture in osteoblasts by activating PAK3 signaling
- Molecular Skeletal Biology Laboratory, Department of Trauma Surgery and Orthopedics, University Medical Center Hamburg-Eppendorf, Germany
- Institute of Musculoskeletal Medicine, LMU University Hospital, LMU Munich, Germany
- Musculoskeletal University Center Munich, LMU University Hospital, LMU Munich, Germany
Figures
Figure 1 with 1 supplement
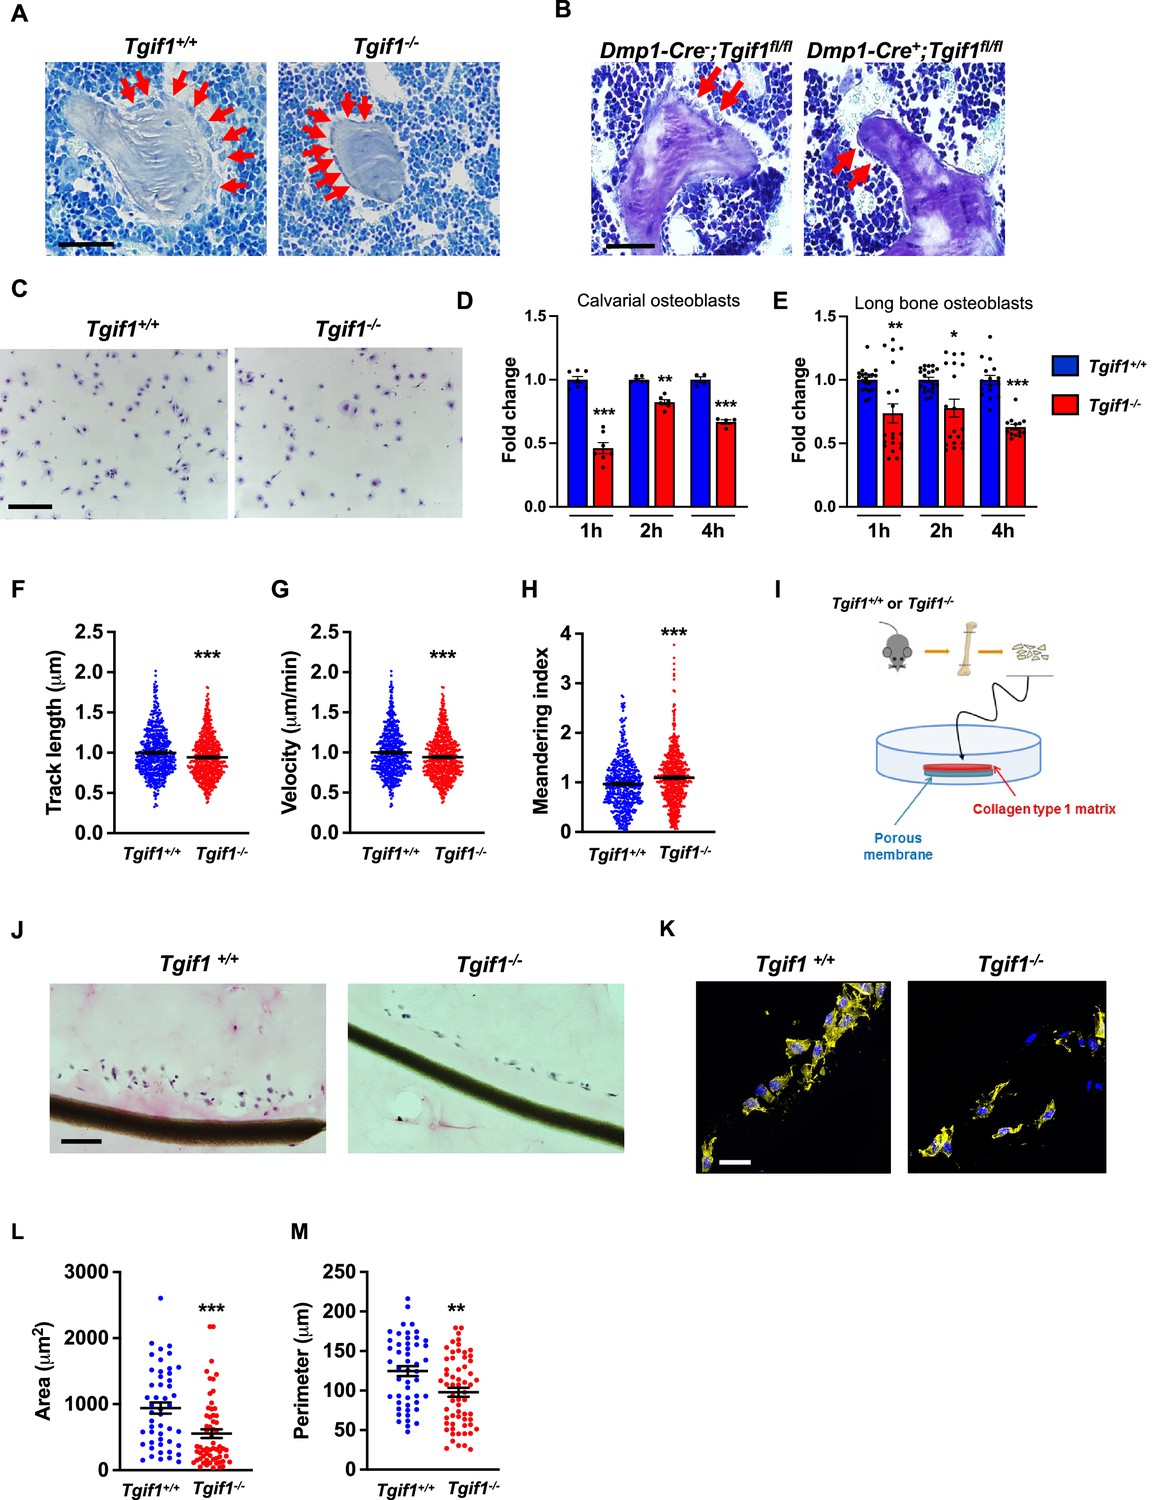
Loss of TG-interacting factor 1 (Tgif1) reduces osteoblast size in vivo and impairs osteoblast adhesion and migration in vitro.
(A) Representative images of the femora from 12-week-old Tgif1+/+ (n=4) and Tgif1-/- (n=4) mice stained with Toluidine blue. (B) Femora of 12-week-old Dmp1-Cre-;Tgif1fl/fl (n=4) and Dmp1-Cre+;Tgif1fl/fl (n=4) mice stained with toluidine blue. (A, B) Arrows indicate osteoblasts. Scale bars indicate 100 µM. (C, D) Osteoblasts isolated from calvariae of neonatal Tgif1+/+ and Tgif1-/- mice upon adherence on Col-I coated surfaces for 1, 2, and 4 hr, fixation, and staining with toluidine blue. (C) Representative images of Toluide blue-stained cells after 2 hr of adhesion. (D) Quantification of adherent Tgif1+/+ and Tgif1-/- calvarial osteoblasts after 1, 2, 4 hr of adhesion on Col-I coated surfaces. (E) Osteoblasts isolated from long bones of 8-week-old Tgif1+/+ and Tgif1-/- mice upon adherence on Col-I coated surfaces for 1, 2, and 4 hr, fixation, and staining with toluidine blue. Quantification of adherent cells at indicated time points. (F–H) Migration of calvarial osteoblasts obtained from neonatal Tgif1+/+ and Tgif1-/- mice was analyzed using live cell imaging. Quantification of (F) track length, (G) migration velocity, and (H) meandering index of Tgif1+/+ and Tgif1-/- calvarial osteoblasts. (I) Long bones were harvested from Tgif1+/+ and Tgif1-/- mice. Osteoblasts were isolated from bone chips and spread on Col-I matrices placed on porous membranes for 48 hr. Membranes were frozen, cut, and stained with (J) H&E or (K) phalloidin (yellow) and DAPI (blue). Quantification of cell area (L) and cell perimeter (M) of Tgif1+/+ and Tgif1-/-long bone osteoblasts on Col-I matrices. Scale bars indicate 50 µm. n=minimum of three independent experiments with technical duplicates. Data are presented as mean ± SEM. Two-tailed Student’s t test was used to compare two groups, *p<0.05, **p<0.01, ***p<0.001vs. Tgif1+/+.
-
Figure 1—source data 1
Numerical data related to Figure 1D, E, F, G and H.
- https://cdn.elifesciences.org/articles/94265/elife-94265-fig1-data1-v1.xlsx
Figure 1—figure supplement 1

Migration of calvarial osteoblasts obtained from neonatal Tgif1+/+ (n=20) and Tgif1-/- (n=20) mice was analyzed using live cell imaging.
The direction and distance of individual cell migration are visualized.
Figure 2 with 1 supplement
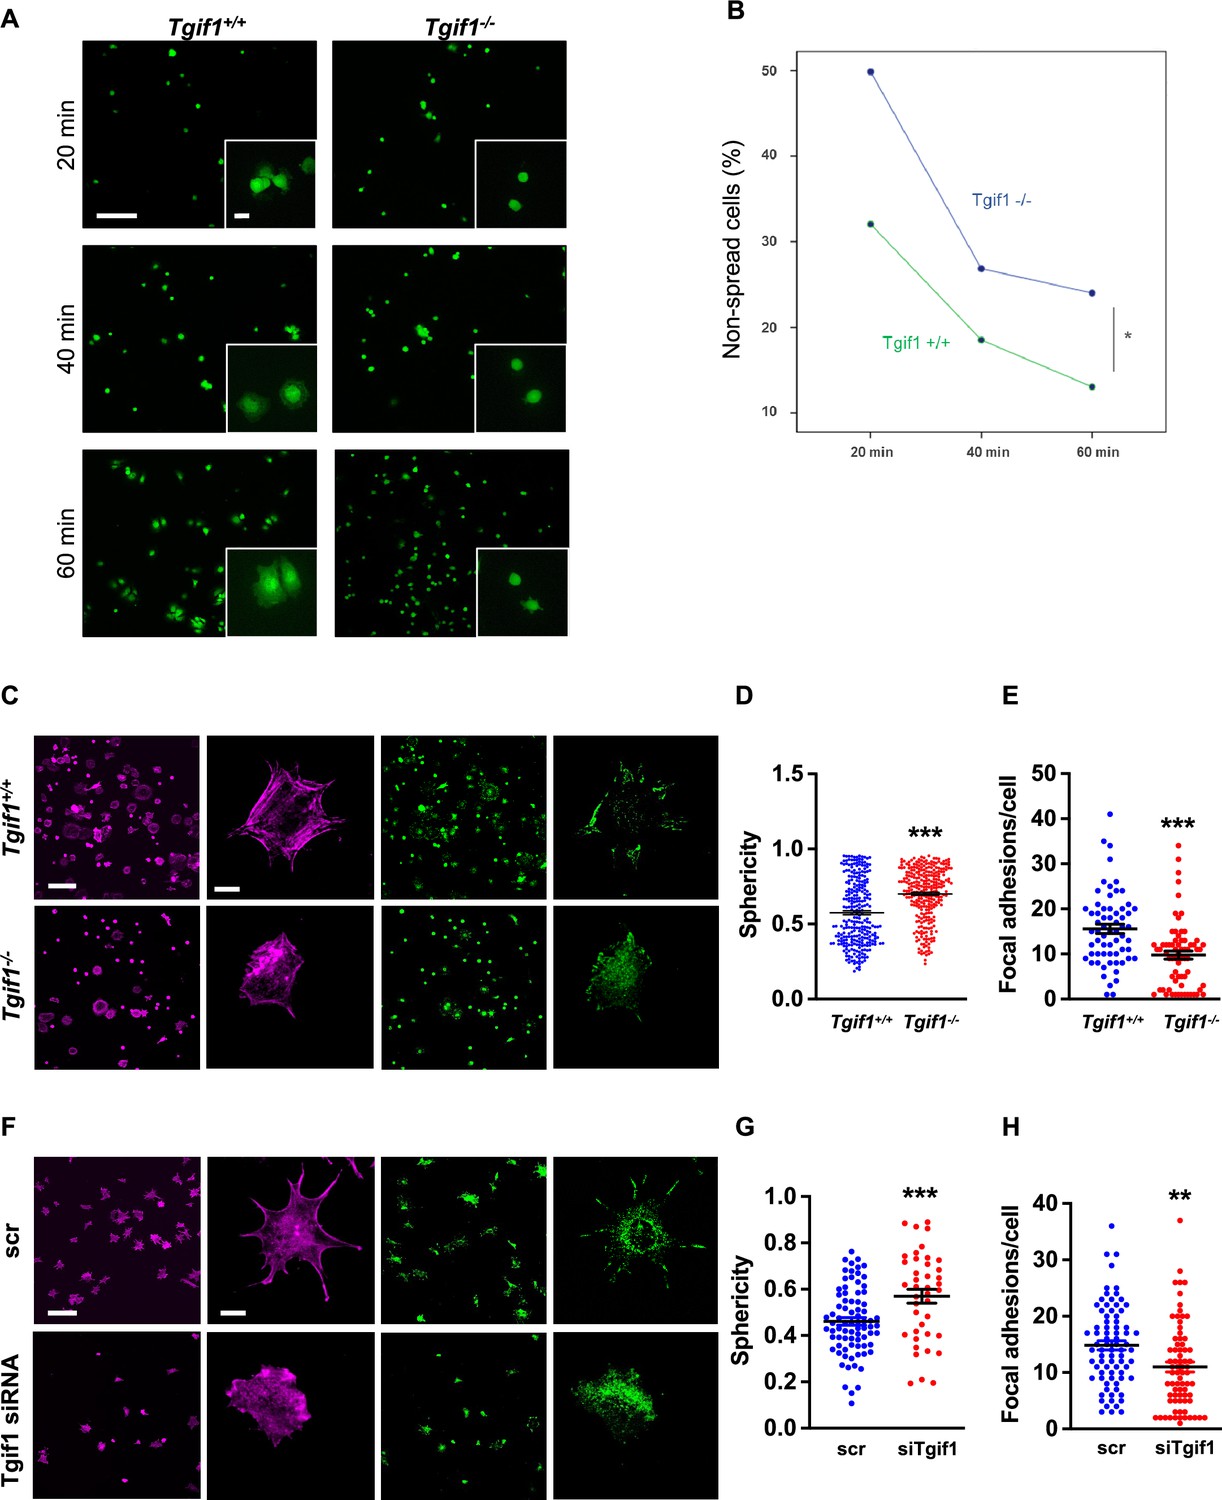
TG-interacting factor 1 (Tgif1)-deficient osteoblasts are impaired to spread and form focal adhesions.
(A, B) Calvarial osteoblast obtained from Tgif1+/+ and Tgif1-/- mice adhered on Col-I coated slides for 20, 40, and 60 min. (A) Cell spreading was visualized by Calcein-AM. (B) The number of round (non-spread) cells was counted. Scale bar indicates 100 µm in low magnification images and 20 µm in the insets. n=6 independent experiments; Repeated Measures ANOVA, Estimated margins means test, *p<0.05 between genotypes. (C) Tgif1+/+ and Tgif1-/- calvarial osteoblasts were allowed to adhere on Col-I coated slides for 60 min. Focal adhesion formation was visualized by paxillin staining (green) and actin cytoskeleton by phalloidin (magenta). Scale bars indicate 100µm (lower magnification) or 10µm (single cells). (D) Analysis of single-cell sphericity after 3D reconstruction using IMARIS and (E) quantification of focal adhesions using Image J. (F–H) Tgif1 was silenced in OCY454 cells using siRNA and cells were allowed to adhere on Col-I coated slides for 60 min. (F) Focal adhesion formation was visualized by Paxillin staining (green) and cell protrusions by phalloidin (magenta). Scale bars indicate 100µm (lower magnification) or 10µm (single cells). (G) Analysis of cell sphericity after 3D reconstruction and (H) quantification of focal adhesions. n=6 independent experiments; Data are presented as mean ± SEM. Unpaired t-test, ***p<0.001, **p<0.01 vs. Tgif1+/+ (D, E), and scr (G, H).
-
Figure 2—source data 1
Numerical data related to Figure 2D, E, G and H.
- https://cdn.elifesciences.org/articles/94265/elife-94265-fig2-data1-v1.xlsx
Figure 2—figure supplement 1

Representative image of an immunoblot demonstrating the expression of TG-interacting factor 1 (Tgif1) in OCY454 cells transfected with scrambled control siRNA (Scr) or siRNA against Tgif1 (siTgif1).
Actin was used as a loading control.
-
Figure 2—figure supplement 1—source data 1
Original files for the western blot analysis in Figure 2—figure supplement 1 (anti-Tgif1 and anti-actin).
- https://cdn.elifesciences.org/articles/94265/elife-94265-fig2-figsupp1-data1-v1.zip
-
Figure 2—figure supplement 1—source data 2
PDF containing Figure 2—figure supplement 1A and original scans of the relevant western blot analysis (anti-Tgif1 and anti-actin) with highlighted bands and sample labels.
- https://cdn.elifesciences.org/articles/94265/elife-94265-fig2-figsupp1-data2-v1.zip
Figure 3 with 3 supplements
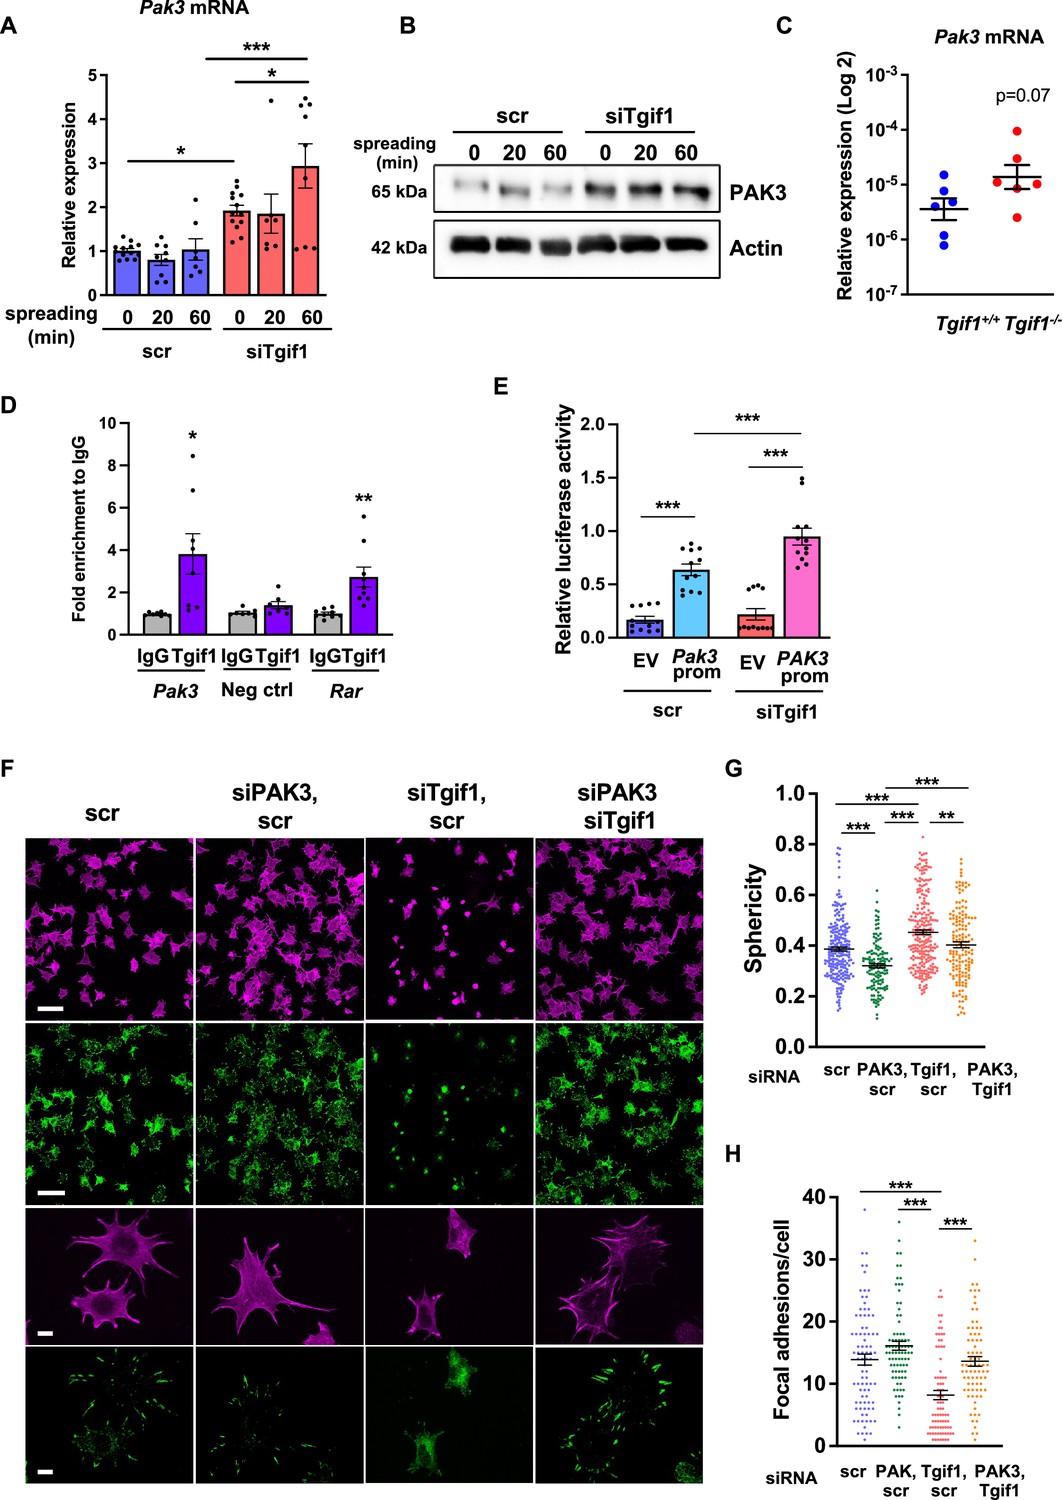
Silencing of p21-activated kinase 3 (PAK3) restores cell spreading and focal adhesion formation in TG-interacting factor 1 (Tgif1)-deficient cells.
(A) Pak3 mRNA expression in OCY454 cells transfected with siRNA targeting Tgif1 (siTgif1) or scrambled control (scr) siRNA before (0) and after 20 and 60 min of spreading on Col-I coated slides. n=9, 1-way ANOVA with Tukey’s multiple comparison test, *p<0.05, ***p<0.001. (B) Representative images of immunoblots demonstrating the abundance of PAK3 expression upon silencing of Tgif1. Actin was used as a control. (C) Pak3 mRNA expression in tibiae of 12-week-old Tgif1+/+ (n=6) and Tgif1-/- (n=6) mice. (D) Tgif1 binding to the predicted site of the Pak3 promoter in OCY454 cells analyzed by ChIP and quantified as fold enrichment to the relative IgG control. Negative and positive (Rarα) controls were used as indicated. n=8, unpaired t-test with Welch’s correction, *p<0.05, **p<0.01 vs. respective IgG control. (E) Tgif1-deficient (siTgif1) or control (scr) OCY454 cells were transfected with renilla plasmid and a pGL3 plasmid (EV) or a pGL3 plasmid containing a 2.3 kb fragment of the rat Pak3 promoter upstream of the luciferase gene. The promoter activity was quantified using luciferase assays and presented as relative luciferase activity (luciferase/renilla). One-way ANOVA, Tukey’s multiple comparison test, ***p<0.001. (F–H) OCY454 cells were transfected alone or in combinations with siTgif1 for 48 hr, siPak3 for 24 hr, and scrambled (scr) control. (F) Cells were allowed to adhere on Col-I coated slides for 60 min. Formation of focal adhesions was visualized by paxillin staining (green) and actin cytoskeleton by phalloidin staining (magenta). Scale bars indicate 100µm (two upper rows) or 10 µm (two lower rows). (G) Quantification of cell sphericity using IMARIS. (H) Quantification of the number of mature focal adhesions per cell using the Image J software. n=4 independent experiments in which individual cells were analyzed. One-way ANOVA, Tukey’s multiple comparison test, **p<0.01 ***p<0.001. Data are presented as mean ± SEM.
-
Figure 3—source data 1
Numerical data related to Figure 3A, C, D, E, G and H.
- https://cdn.elifesciences.org/articles/94265/elife-94265-fig3-data1-v1.xlsx
-
Figure 3—source data 2
Original files for the western blot analysis in Figure 3B (anti-PAK3 and anti-actin).
- https://cdn.elifesciences.org/articles/94265/elife-94265-fig3-data2-v1.zip
-
Figure 3—source data 3
PDF containing Figure 3B and original scans of the relevant western blot analysis (anti-PAK3 and anti-actin) with highlighted bands and sample labels.
- https://cdn.elifesciences.org/articles/94265/elife-94265-fig3-data3-v1.zip
Figure 3—figure supplement 1
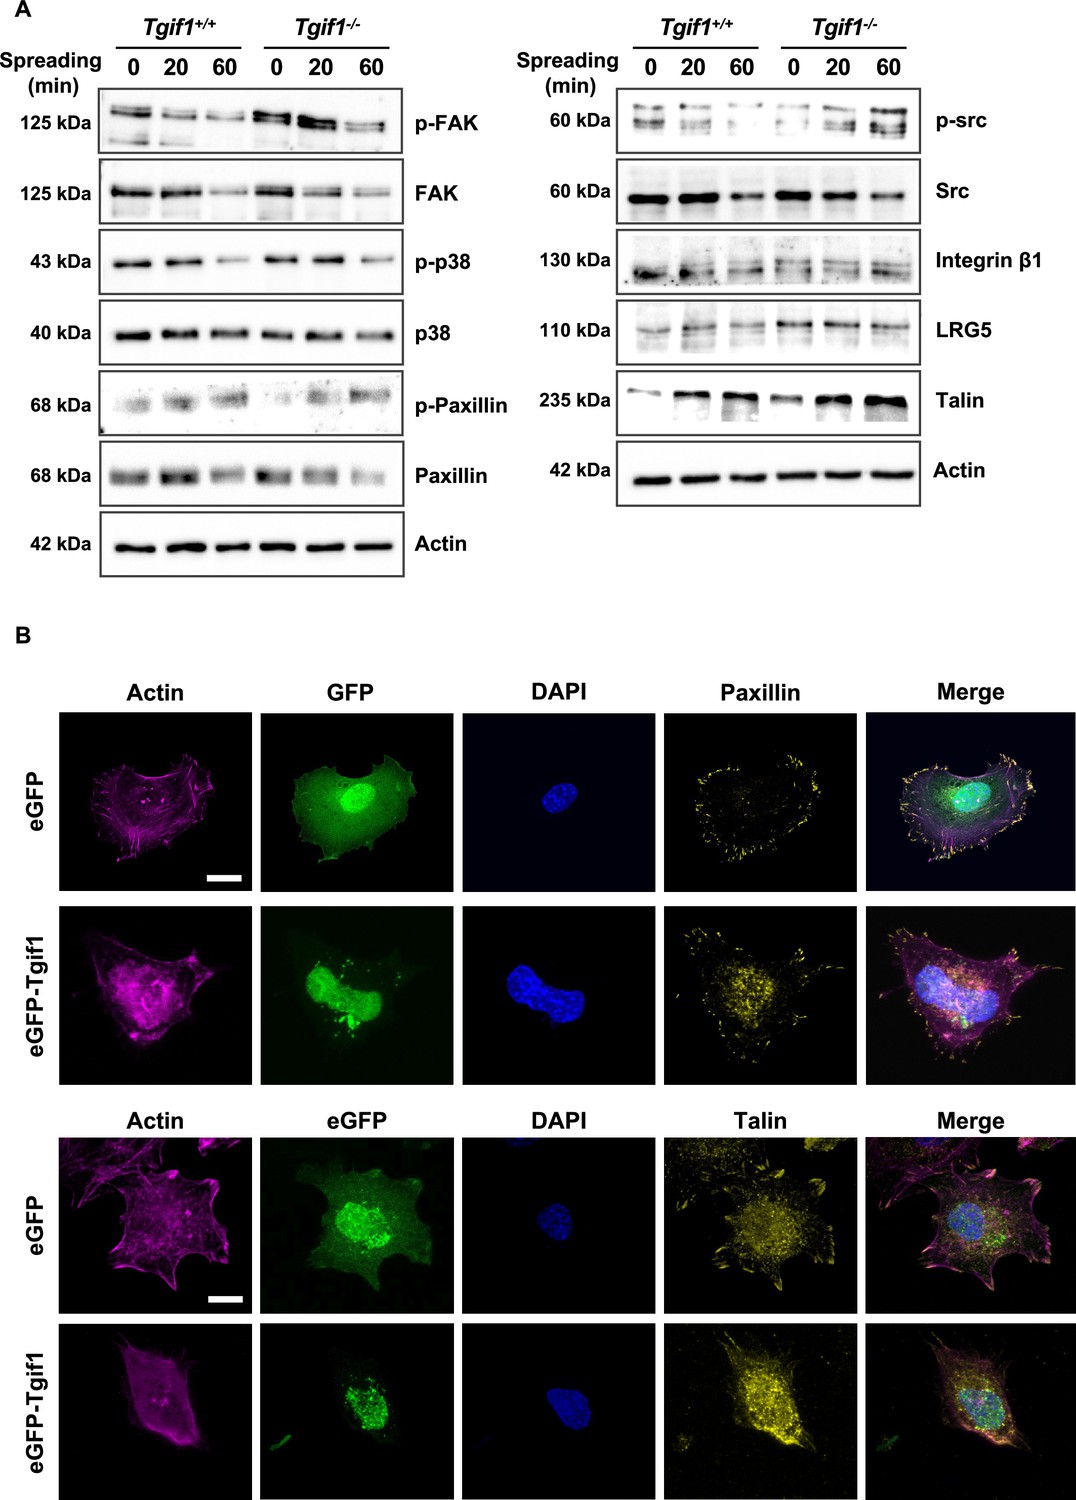
TG-interacting factor 1 (Tgif1)-deficiency does not alter the abundance or activation of the FA components and Tgif1 does not co-localize with FA complexes.
(A) Osteoblasts adhered on Col-I coated slides for 0, 20, or 60 min. Representative images of immunoblots demonstrating the abundance of p-FAK, FAK, p-p38, p38, p-Paxillin, Paxillin, p-src, src, Integrin β1, LRG5, and Talin. Actin was used as a loading control. n=4 independent experiments. (B) Osteoblasts over-expressing eGFP-Tgif1 or eGFP adhered on Col-I coated plates for 60 min. Cells were stained for actin (magenta), nuclei (blue), Paxillin (upper panels), or Talin (lower panels, both yellow). Scale bars indicate 10µm.
-
Figure 3—figure supplement 1—source data 1
Original file for the western blot analysis in Figure 3—figure supplement 1A (anti-pFAK, anti-FAK, anti-pp38, anti-p38, anti-ppaxillin, anti-paxillin, anti-psrc, anti-src, anti-integrin β1, anti LRG5, anti-talin, anti-actin).
- https://cdn.elifesciences.org/articles/94265/elife-94265-fig3-figsupp1-data1-v1.zip
-
Figure 3—figure supplement 1—source data 2
PDF containing Figure 3—figure supplement 1A and original scans of the relevant western blot analysis (anti-pFAK, anti-FAK, anti-pp38, anti-p38, anti-ppaxillin, anti-paxillin, anti-psrc, anti-src, anti-integrin β1, anti LRG5, anti-talin, anti-actin) with highlighted bands and sample labels.
- https://cdn.elifesciences.org/articles/94265/elife-94265-fig3-figsupp1-data2-v1.zip
Figure 3—figure supplement 2
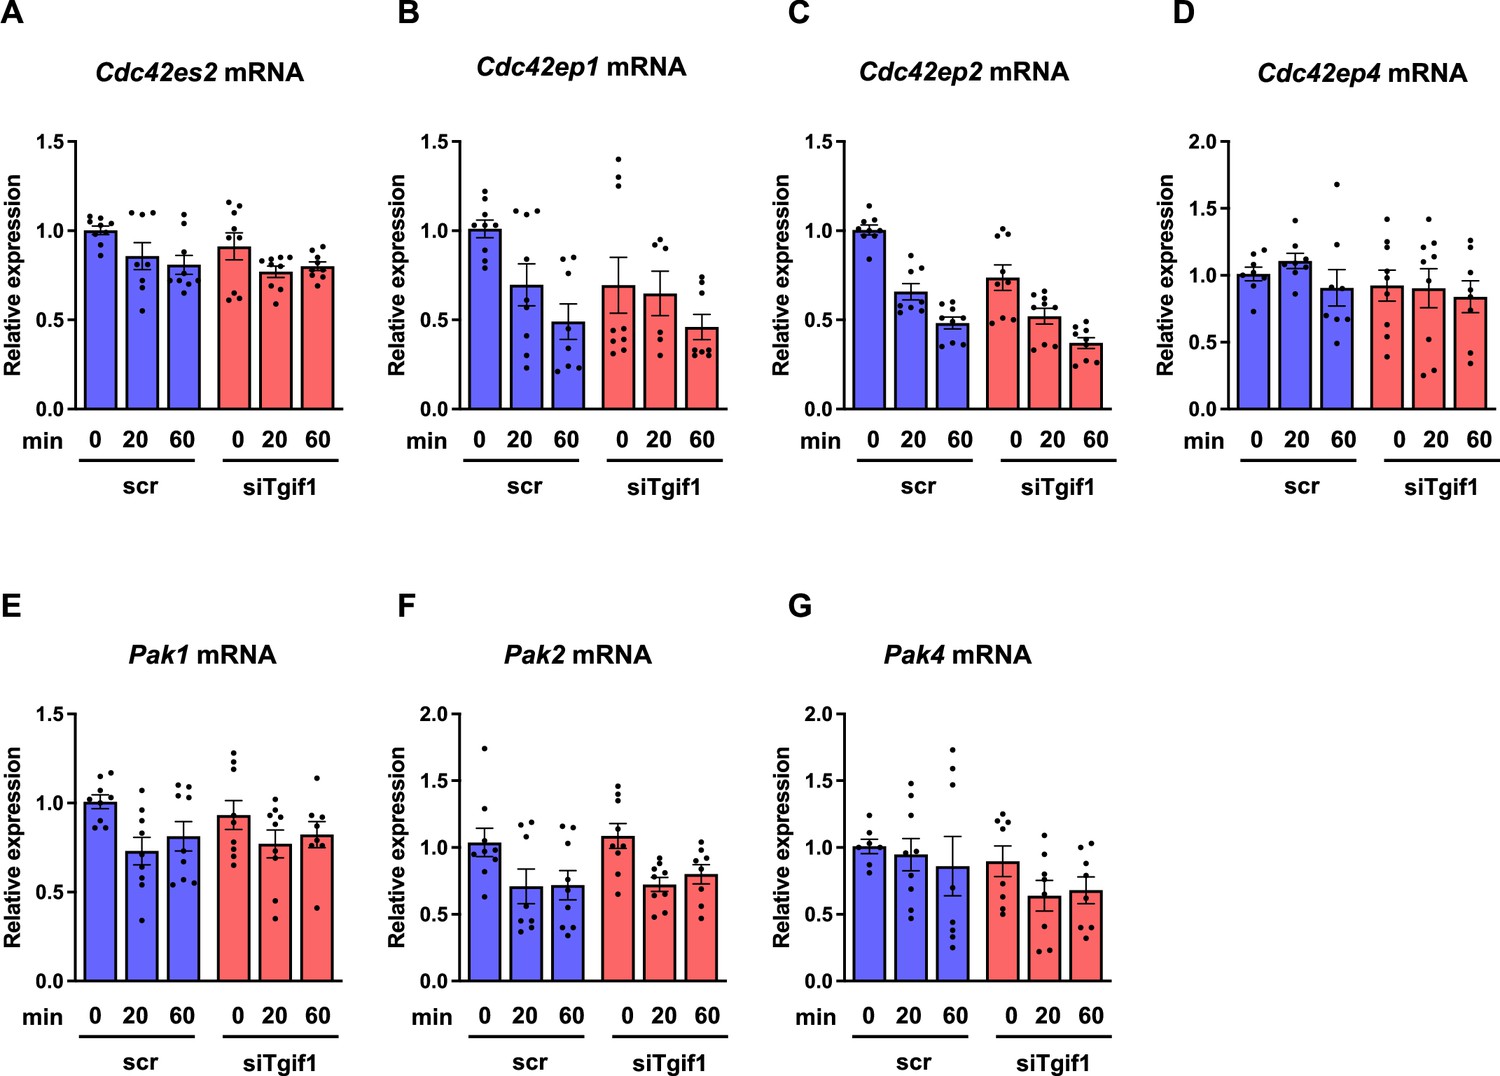
Lack of TG-interacting factor 1 (Tgif1) does not alter the expression of Cdcs, Pak11, Pak2, or Pak4.
OCY454 cells were transfected with a siRNA targeting Tgif1 (siTgif1) or scramble control (scr) prior to adherence on Col-I coated slides for 20 and 60 min. Gene expression was quantified by qPCR for (A) Cdc42es2, (B) Cdc42ep1, (C) Cdc42ep2, (D) Cdc42ep4, (E) Pak1, (F) Pak2 and (G) Pak4. n=minimum 3 independent experiments with duplicates. One-way ANOVA, Tukey’s Multiple Comparison Test.
-
Figure 3—figure supplement 2—source data 1
Numerical data related to Figure 3—figure supplement 2A-G.
- https://cdn.elifesciences.org/articles/94265/elife-94265-fig3-figsupp2-data1-v1.xlsx
Figure 3—figure supplement 3

Tgif1 binding site on the PAK3 promoter and expression of PAK3 and Tgif1.
(A) Schematic of the conserved predicted TG-interacting factor 1 (Tgif) binding site on the rat and mouse p21-activated kinase 3 (Pak3) promoters. (B) OCY454 cells were transfected with siRNA targeting Tgif1 (siTgif1) for 48 hr and with siRNA targeting Pak3 (siPAk3) for 24 hr alone and in combination alongside with the respective scrambled controls (scr) resulting in four groups: scr (scr; scr), siPAK3 (scr; siPAK3), siTgif1 (scr; siTgif1), and siPAK3+siTgif1 (siPAK3; siTgif1). Representative images of immunoblots demonstrate the abundance of PAK3 and Tgif1. Actin was used as a loading control. n=3 independent experiments.
-
Figure 3—figure supplement 3—source data 1
Original file for the western blot analysis in Figure 3—figure supplement 3 (anti-PAK3, anti-Tgif1, and anti-actin).
- https://cdn.elifesciences.org/articles/94265/elife-94265-fig3-figsupp3-data1-v1.zip
-
Figure 3—figure supplement 3—source data 2
PDF containing Figure 3—figure supplement 3 and original scans of the relevant western blot analysis (anti-PAK3, anti-Tgif1, and anti-actin) with highlighted bands and sample labels.
- https://cdn.elifesciences.org/articles/94265/elife-94265-fig3-figsupp3-data2-v1.zip
Figure 4
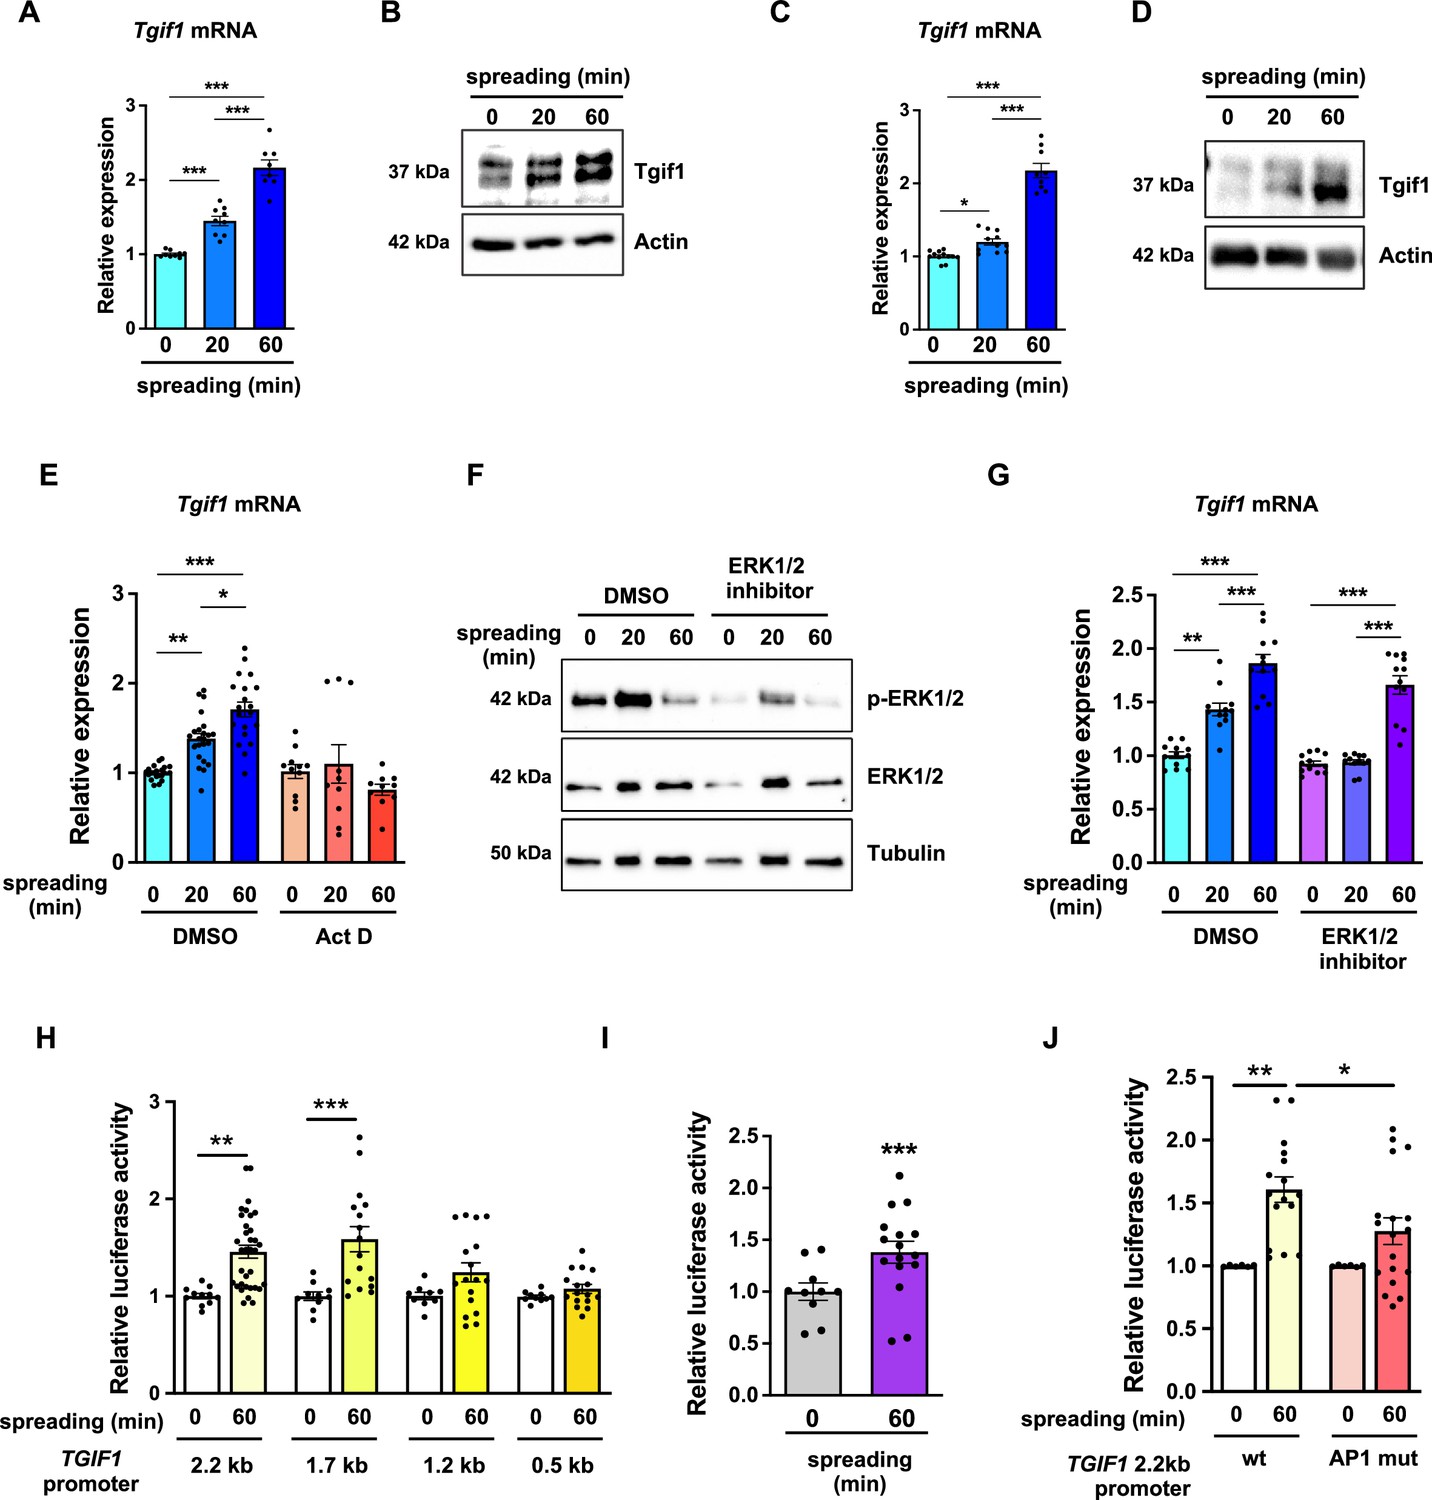
TG-interacting factor 1 (Tgif1) expression is increased during cell spreading via ERK and AP1 signaling pathways.
(A) Quantification of Tgif1 mRNA expression and (B) representative images of immunoblots of Tgif1 expression in calvarial osteoblasts before (0 min) and after 20 and 60 min of spreading. Actin was used as a control. (C) Tgif1 mRNA expression and (D) representative images of immunoblots of Tgif1 expression in OCY454 cells before (0 min) and after 20 and 60 min spreading on Col-I coated slides. Actin was used as a control. (E) OCY454 cells were treated with DMSO as control or with 5 µM Actinomycin D for 15 min prior to adherence on Col-I coated slides for 20 and 60 min. Tgif1 mRNA was quantified before (0 min) and during spreading. (F) Representative immunoblot images demonstrating the efficiency of ERK1/2 inhibitor SCH772984 (1 µg/ml) to prevent ERK1/2 phosphorylation (n=4). (G) Quantification of Tgif1 mRNA expression during spreading after 15 min pre-treatment with DMSO (control) or with the ERK inhibitor SCH772984. (H) Quantification of the TGIF1 promoter activity during cell spreading. OCY454 cells were transfected with a luciferase reporter plasmid encoding a 2.2 kb fragment of the TGIF1 promoter or progressive truncations thereof (1.7, 1.2, and 0.5 kb) along with a plasmid encoding renilla firefly as control. Upon spreading for 60 min, promoter activity was quantified using a dual luciferase reporter gene assay and presented as normalized luciferase activity (luciferase/renilla). (I) Quantification of the AP1 transcriptional activity during cell spreading. OCY454 cells were transfected with a 6X-TRE-luciferase reporter to determine AP-1 activity along with a plasmid encoding renilla firefly as control. Upon spreading for 60 min, promoter activity was quantified using a dual luciferase reporter gene assay and presented as normalized luciferase activity (luciferase/renilla). (J) Quantification of the activity of the wild-type (wt) TGIF1 2.2 kb promoter and of the same fragment bearing a mutant AP1 binding site (AP1 mut) during cell spreading. OCY454 cells were transfected either with a luciferase reporter plasmid encoding a wild-type (wt) 2.2 kb fragment of the TGIF1 promoter or with the same promoter in which the AP1 binding site has been mutated (mut) along with a plasmid encoding renilla firefly as control. Upon spreading for 60 min, the promoter activity was quantified using a dual luciferase reporter gene assay and presented as normalized luciferase activity (luciferase/renilla). n = minimum 4 independent experiments. Data are presented as mean ± SEM. Two-tailed Student’s t test was used to compare two groups (I) One-way ANOVA, Tukey’s multiple comparisons test was used to compare multiple groups, *p<0.05, **p<0.01, ***p<0.001 vs. respective control.
-
Figure 4—source data 1
Numerical data related to Figure 4A, C, E, G, H, I and J.
- https://cdn.elifesciences.org/articles/94265/elife-94265-fig4-data1-v1.xlsx
-
Figure 4—source data 2
Original files for the western blot analysis in Figure 4B (anti-Tgif1 and anti-actin).
- https://cdn.elifesciences.org/articles/94265/elife-94265-fig4-data2-v1.zip
-
Figure 4—source data 3
PDF containing Figure 4B and original scans of the relevant western blot analysis (anti-Tgif1 and anti-actin) with highlighted bands and sample labels.
- https://cdn.elifesciences.org/articles/94265/elife-94265-fig4-data3-v1.zip
-
Figure 4—source data 4
Original files for the western blot analysis in Figure 4D (anti-Tgif1 and anti-actin), anti-pERK1/2, anti-ERK1/2, and anti-tubulin.
- https://cdn.elifesciences.org/articles/94265/elife-94265-fig4-data4-v1.zip
-
Figure 4—source data 5
PDF containing Figure 4D and F and original scans of the relevant western blot analysis (anti-Tgif1 and anti-actin) with highlighted bands and sample labels.
- https://cdn.elifesciences.org/articles/94265/elife-94265-fig4-data5-v1.zip
-
Figure 4—source data 6
Original files for the western blot analysis in Figure 4F (anti-pERK1/2, anti-ERK1/2, and anti-tubulin).
- https://cdn.elifesciences.org/articles/94265/elife-94265-fig4-data6-v1.zip
-
Figure 4—source data 7
PDF containing Figure 4F and original scans of the relevant western blot analysis (anti-pERK1/2, anti-ERK1/2, and anti-tubulin) with highlighted bands and sample labels.
- https://cdn.elifesciences.org/articles/94265/elife-94265-fig4-data7-v1.zip
Figure 5
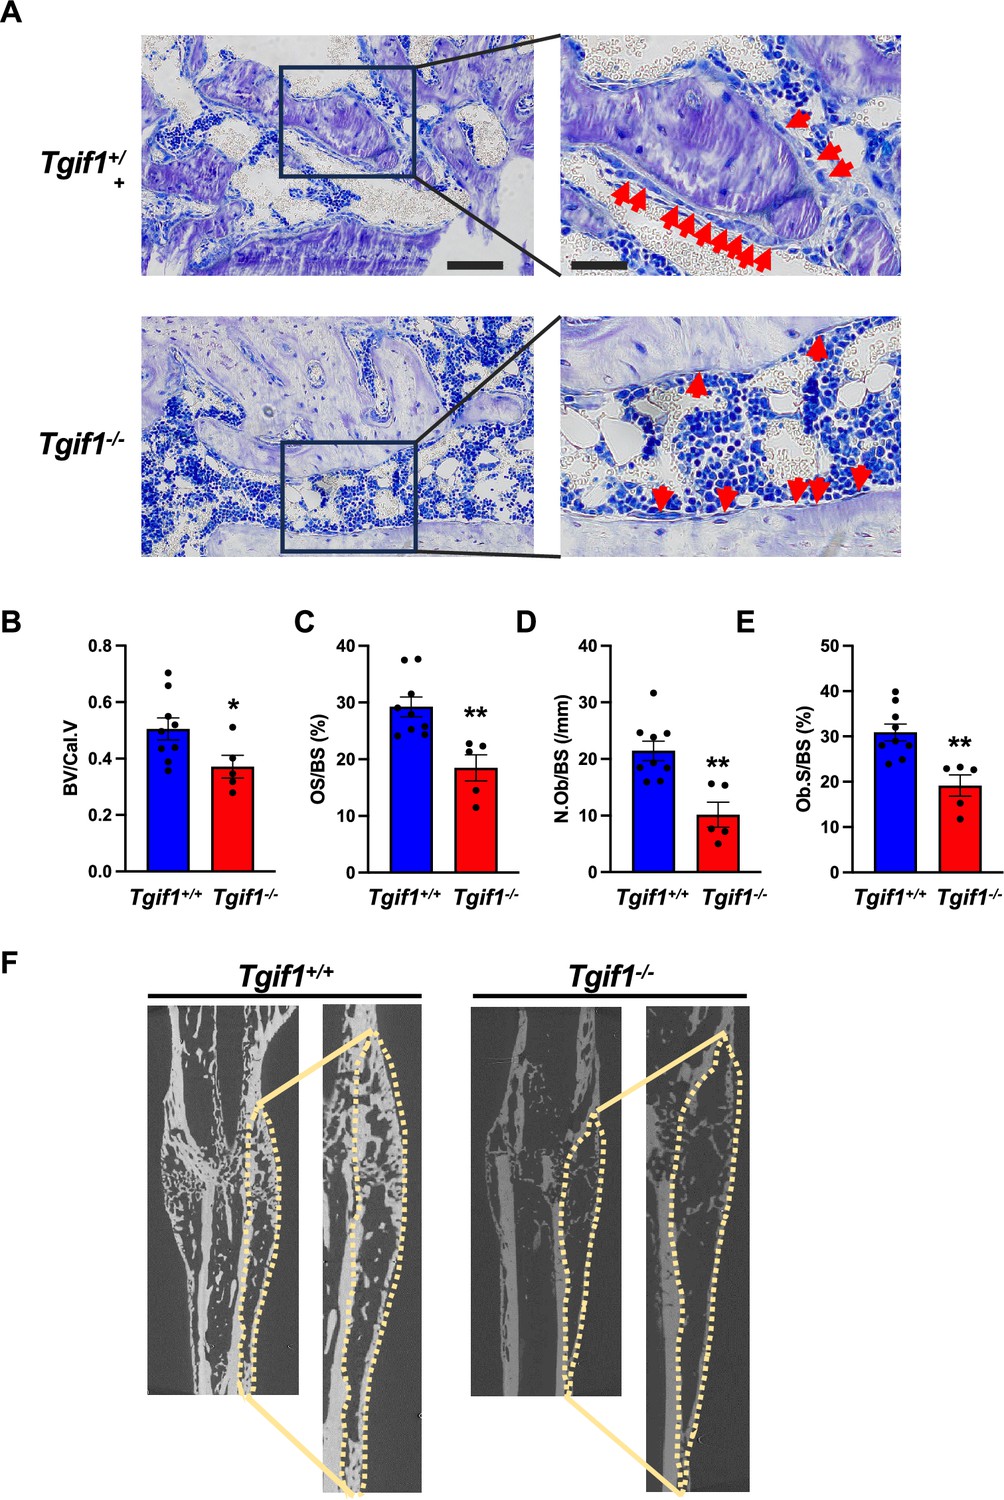
TG-interacting factor 1 (Tgif1) deficiency causes a reduced number and activity of osteoblasts during bone repair.
(A) Representative images of Toluidine blue-stained sections of bones from male Tgif1+/+ (n=9) and Tgif1-/- mice (n=5) that received an open fracture of the midshaft tibia at 10 weeks of age followed by bone healing for 3 weeks upon intramedullary stabilization. Arrows indicate osteoblasts. Scale bars indicate 100 µm (left panels) and 50 µm (right panels). (B - E) Histological sections were used to quantify the histomorphometric parameters (B) bone volume per callus volume (BV/Cal.V), (C) osteoid surface per bone surface (OS/BS), (D) number of osteoblasts per bone surface (N.Ob/BS) and (E) osteoblast surface per bone surface (Ob.S/BS). (F) Representative micro-computed tomography (µCT) images of the tibiae of Tgif1+/+ and Tgif1-/- mice 21 days after fracture. Data are presented as mean ± SEM. Unpaired t-test, *p<0.05, **p<0.01 vs. Tgif1+/+.
-
Figure 5—source data 1
Numerical data related to Figure 5B, C, D and E.
- https://cdn.elifesciences.org/articles/94265/elife-94265-fig5-data1-v1.xlsx
Figure 6
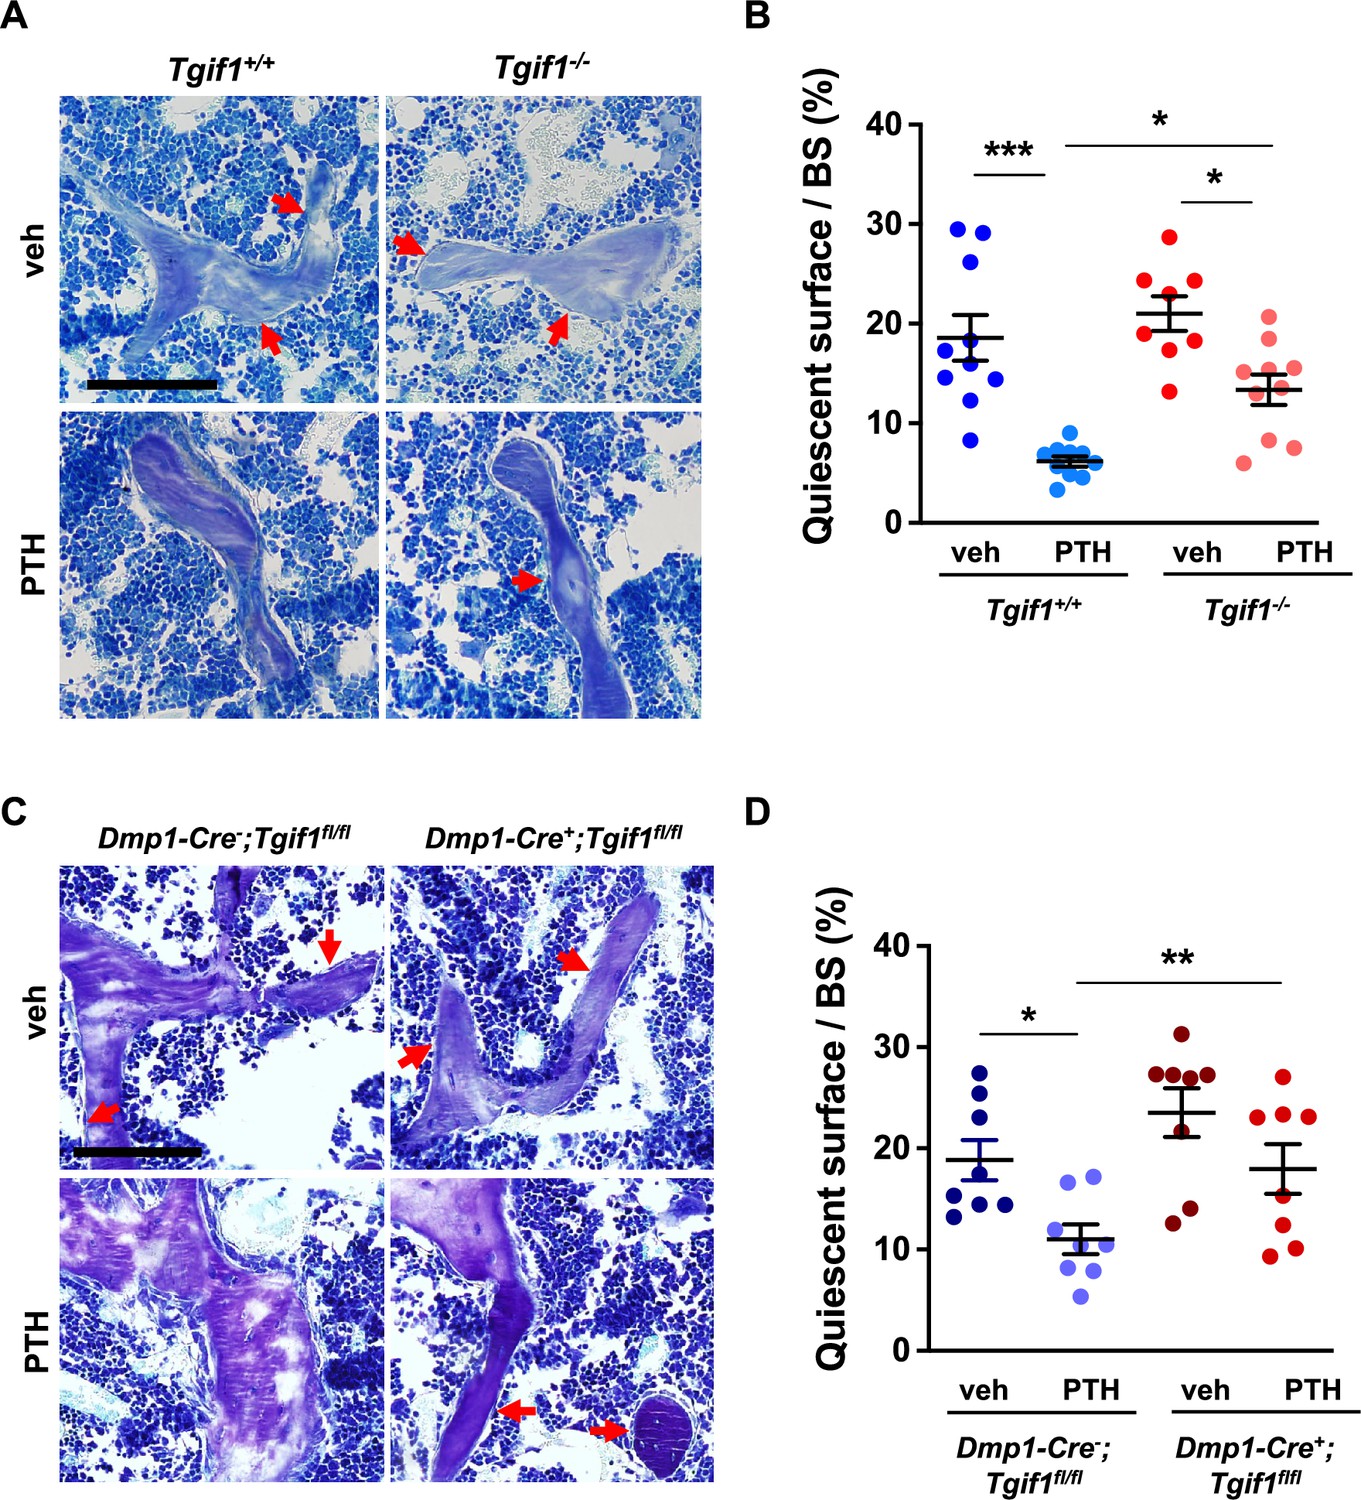
PTH is impaired in activating quiescent bone surfaces in TG-interacting factor 1 (Tgif1)-deficient mice.
(A) Toluidine blue staining of tibiae from 12-week-old Tgif1+/+ and Tgif1-/- mice treated with vehicle (veh) or PTH. Quiescent surfaces are indicated by red arrows. Representative images are shown. Scale bar indicates 100 µm. (B) Quantification of the percentage of quiescent surfaces per bone surface (BS). Tgif1+/+, veh n=10; Tgif1+/+, PTH n=10, Tgif1-/-, veh n=8; Tgif1-/-, PTH n=10. (C) Toluidine blue staining of tibiae from 12-week-old Dmp1-Cre-;Tgif1fl/fl and Dmp1-Cre+;Tgif1fl/fl mice treated with vehicle (veh) or PTH. Quiescent surfaces are indicated by red arrows. Representative images are shown. Scale bar indicates 100 µm. (D) Quantification of the percentage of quiescent surfaces per BS. Dmp1-Cre-;Tgif1fl/fl, veh n=8; Dmp1-Cre-;Tgif1fl/fl, PTH n=8, Dmp1-Cre+;Tgif1fl/fl, veh n=8; Dmp1-Cre+;Tgif1fl/fl, PTH n=8. Data are presented as mean ± SEM. One-way ANOVA with Tukey’s multiple comparison test, *p<0.05, **p<0.01 vs Tgif1+/+, or veh (B) or Dmp1-Cre-;Tgif1fl/fl, veh (D) .
-
Figure 6—source data 1
Numerical data related to Figure 6B and D.
- https://cdn.elifesciences.org/articles/94265/elife-94265-fig6-data1-v1.xlsx
Figure 7
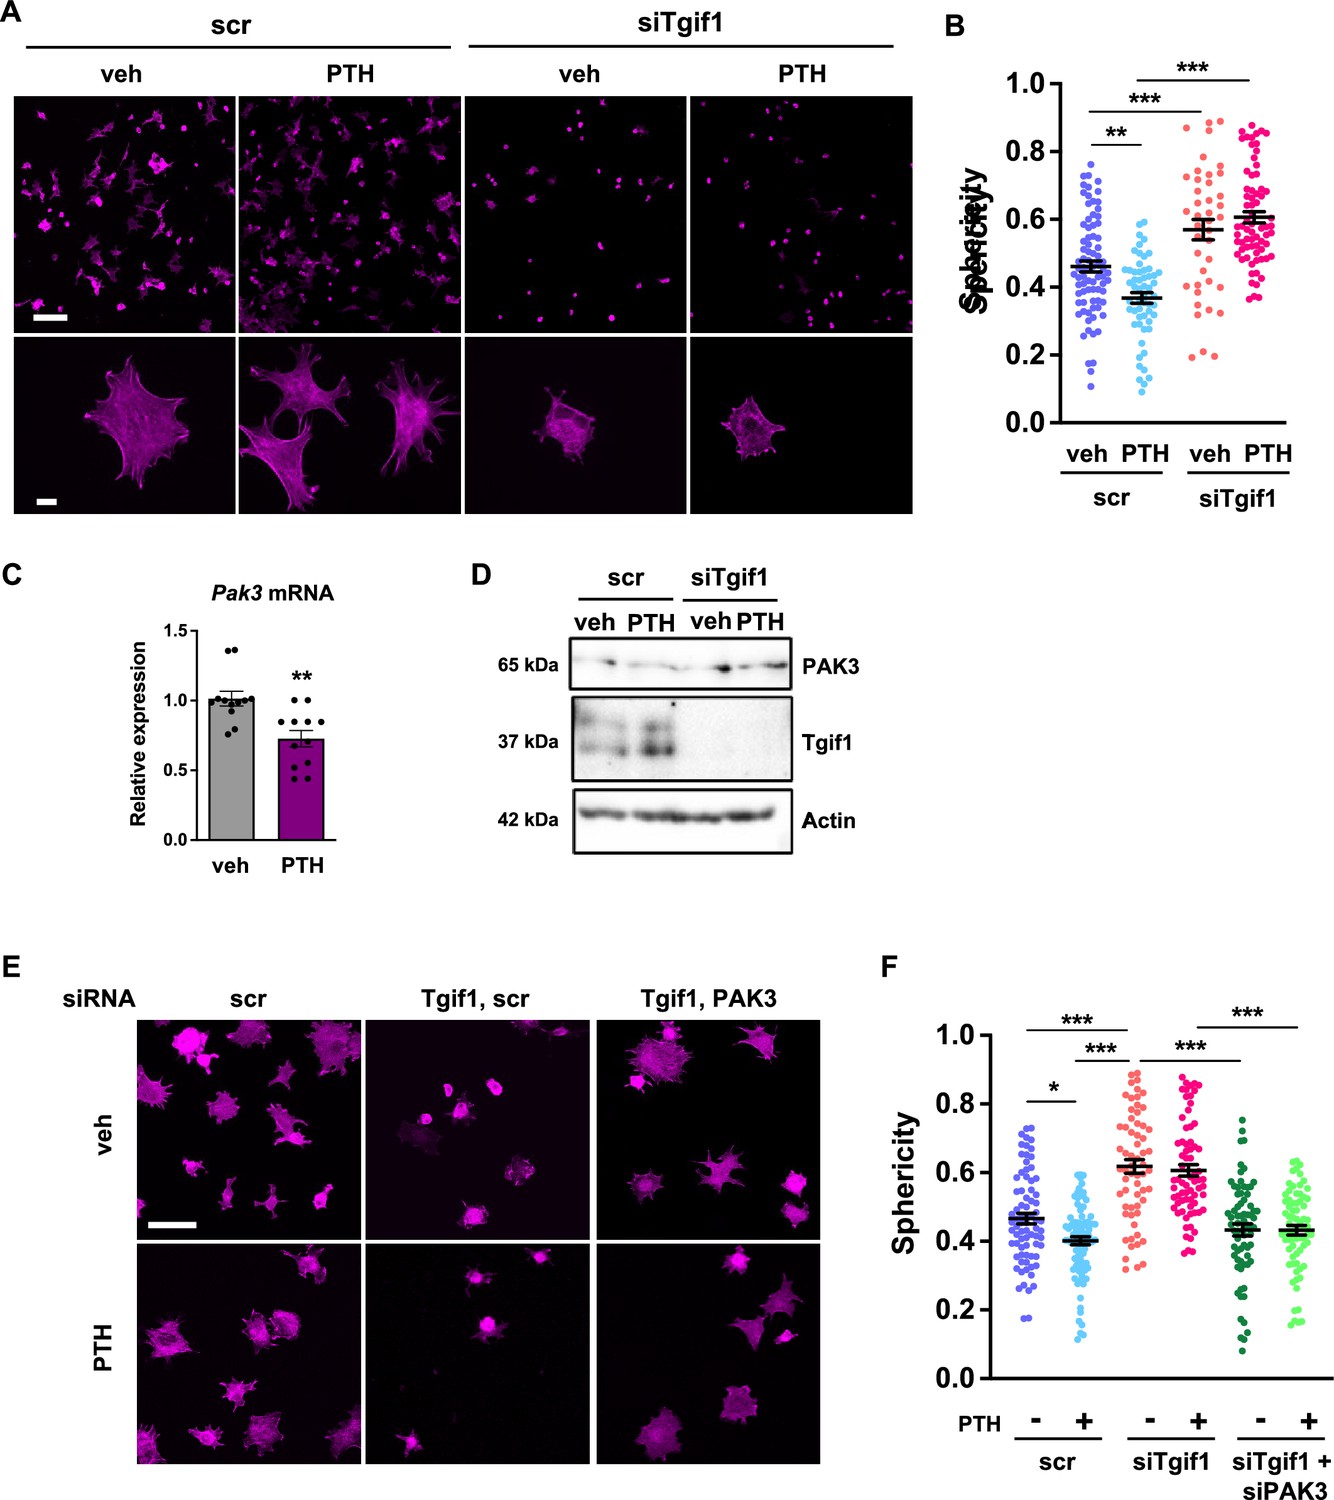
PTH promotes cell spreading via TG-interacting factor 1 (Tgif1)-PAK3 signaling.
(A) OCY454 cells were transfected with siRNA against Tgif1 (siTgif1) or scramble control siRNA (scr) and treated with vehicle (veh) or PTH for 4 hr. Cells were allowed to adhere on Col-I coated slides for 60 min. The cytoskeleton was visualized by phalloidin staining (magenta). Scale bars indicate 100 µm (upper panel) or 10 µm (lower panel). (B) Cell sphericity was quantified using IMARIS software. One-way ANOVA with Tukey’s multiple comparisons test was applied, **p<0.01, ***p<0.001. (C) p21-activated kinase 3 (Pak3) mRNA expression after 4 hr of PTH treatment. Unpaired t-test, **p<0.01 vs. veh. (D) Representative image of immunoblots demonstrating PAK3 and Tgif1 protein abundance upon PTH treatment in cells transfected with siTgif1 or scr. Actin was used as a loading control. n = 4 independent experiments. (E) OCY454 cells were transfected with scr or Tgif1 siRNA for 48 hr and Pak3 or scr siRNA for 24 hr and treated with vehicle (veh) or PTH for 4 hr. Cells adhered on Col-I coated slides for 60 min. The cytoskeleton was visualized by phalloidin staining (magenta). Scale bar indicates 50 µm. (F) Cell sphericity was quantified using IMARIS software. n=4 independent experiments, one-way ANOVA, Tukey’s multiple comparison test, *p<0.05, ***p<0.001. Data are presented as mean ± SEM.
-
Figure 7—source data 1
Numerical data related to Figure 7B, C and F.
- https://cdn.elifesciences.org/articles/94265/elife-94265-fig7-data1-v1.xlsx
-
Figure 7—source data 2
Original files for the western blot analysis in Figure 7D (anti-PAK3, anti-Tgif1, and anti-actin).
- https://cdn.elifesciences.org/articles/94265/elife-94265-fig7-data2-v1.zip
-
Figure 7—source data 3
PDF containing Figure 7D and original scans of the relevant western blot analysis (anti-Tgif1, anti-actin, anti-pERK1/2, anti-ERK1/2, and anti-tubulin) with highlighted bands and sample labels.
- https://cdn.elifesciences.org/articles/94265/elife-94265-fig7-data3-v1.zip
Additional files
Download links
A two-part list of links to download the article, or parts of the article, in various formats.
Downloads (link to download the article as PDF)
Open citations (links to open the citations from this article in various online reference manager services)
Cite this article (links to download the citations from this article in formats compatible with various reference manager tools)
Tgif1-deficiency impairs cytoskeletal architecture in osteoblasts by activating PAK3 signaling
eLife 13:RP94265.
https://doi.org/10.7554/eLife.94265.3


