Epidermal barrier defects link atopic dermatitis with altered skin cancer susceptibility
- King's College London, United Kingdom
- Cancer Research UK Cambridge Research Institute, United Kingdom
- Hokkaido University, Japan
- Otto von Guericke University Magdeburg, Germany
Figures
Figure 1
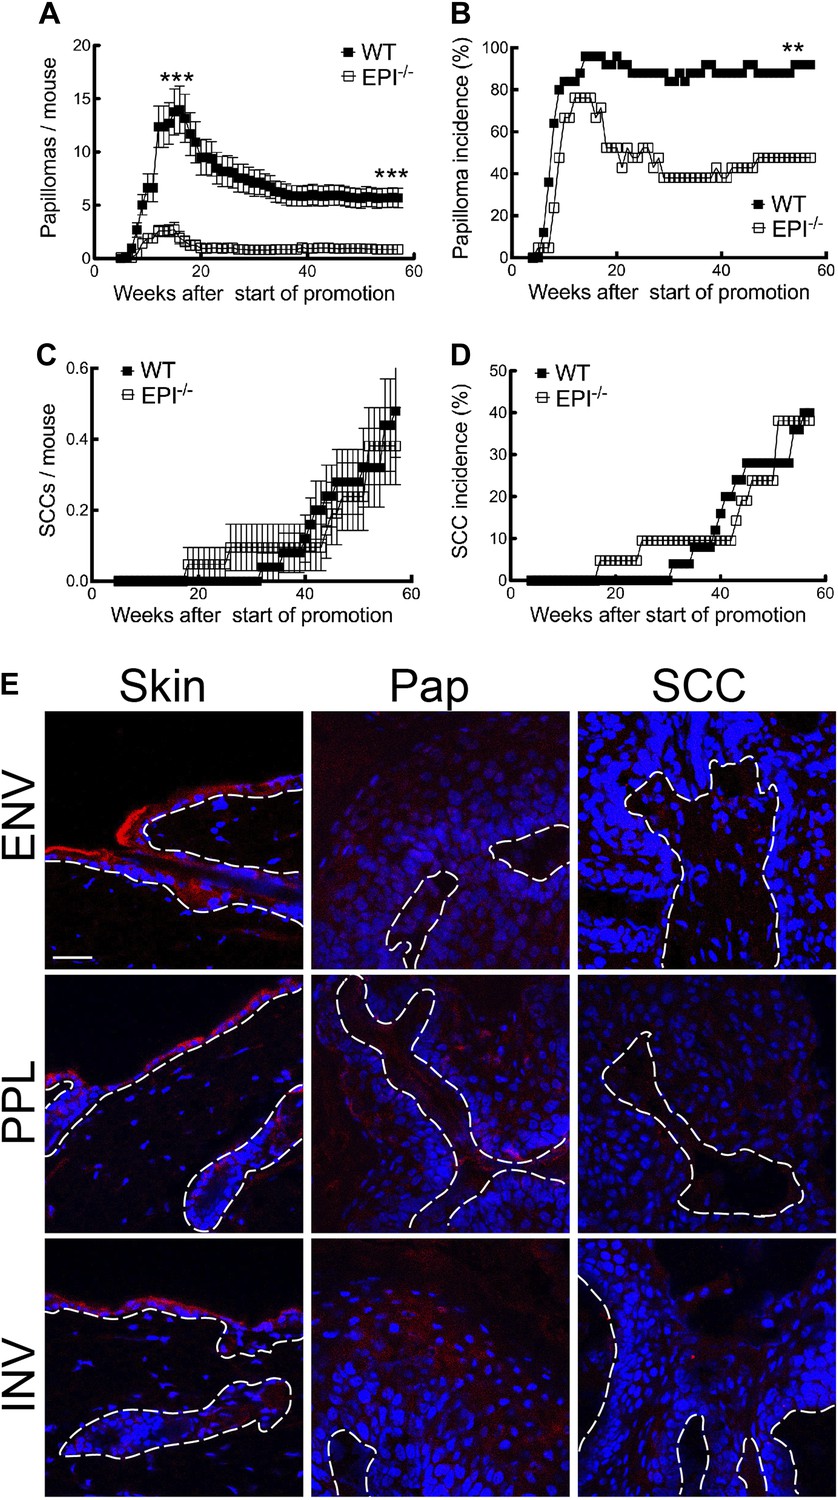
Chemical carcinogenesis in EPI−/− and WT mice.
(A) Average number of papillomas per mouse. (B) % mice with one or more papilloma. (C) Average number of SCCs per mouse. (D) % mice with one or more SCC. (A and C) Data are means ± SEM. (E) Back skin, papillomas (pap) and SCCs from WT mice were immunostained for Envoplakin, Periplakin, or Involucrin (red) and DAPI (blue). Dotted line indicates basement membrane. Scale bars: 100 μm.
Figure 2

Response of EPI−/− and WT mice to DMBA.
(A) Q-PCR of enzymes responsible for DMBA uptake and metabolic activation. (B) Number of CD207+ Langerhans cells per mm2 ear epidermis. (C–E) Number of epidermal cells that scored positive for γH2AX (C), PH3 (D) or active caspase-3 (E) per cm. 7-cm skin was analysed per marker. (F) Q-PCR of anti- and pro-apoptotic genes. (A–F) Data in all histograms are means ± SEM of at least three mice per genotype. (G) Hras codon 61 mutations in 4 SCCs per genotype were quantified by Q-PCR of genomic DNA.
Figure 3
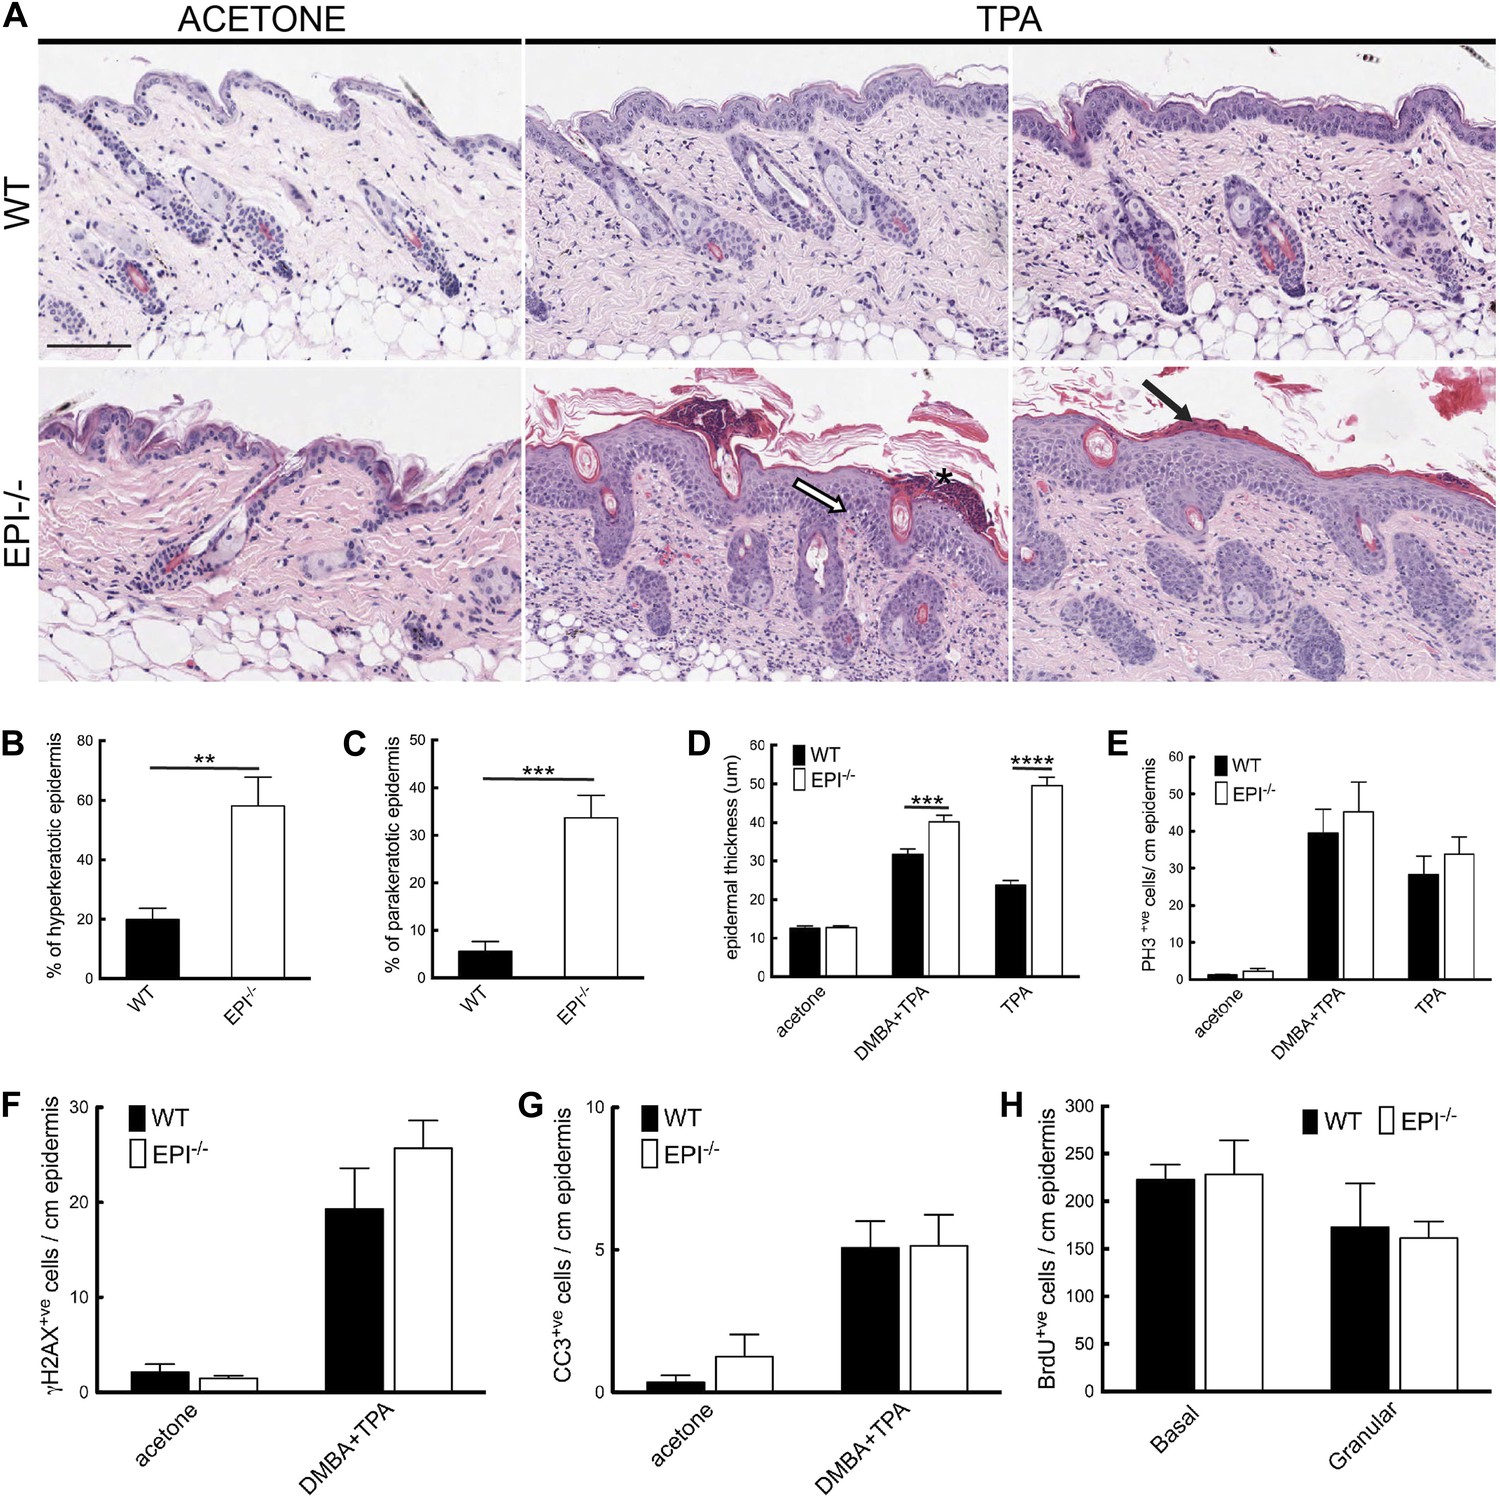
Keratinocyte responses to TPA treatment.
(A) H&E stained skin sections of mice treated three times with acetone or TPA. Asterisk: neutrophil containing pustule; white arrow: spongiosis; black arrow: parakeratosis. % hyperkeratotic (B) and parakeratotic (C) stratum corneum (8 cm skin analysed per condition). (D) Epidermal thickness in μm (8 cm skin analysed per condition). (E–G) Number of epidermal cells positively labeled for PH3 (E), γH2AX (F) and active caspase-3 (G) per cm skin (7 cm skin analysed per condition). (H) Number of BrdU positive cells in basal and uppermost two granular layers per cm epidermis of mice treated three times with TPA and injected with BrdU 24 hr before harvesting. Data from all graphs represent means ± SEM from at least four mice per genotype. Scale bar: 100 μm.
Figure 4
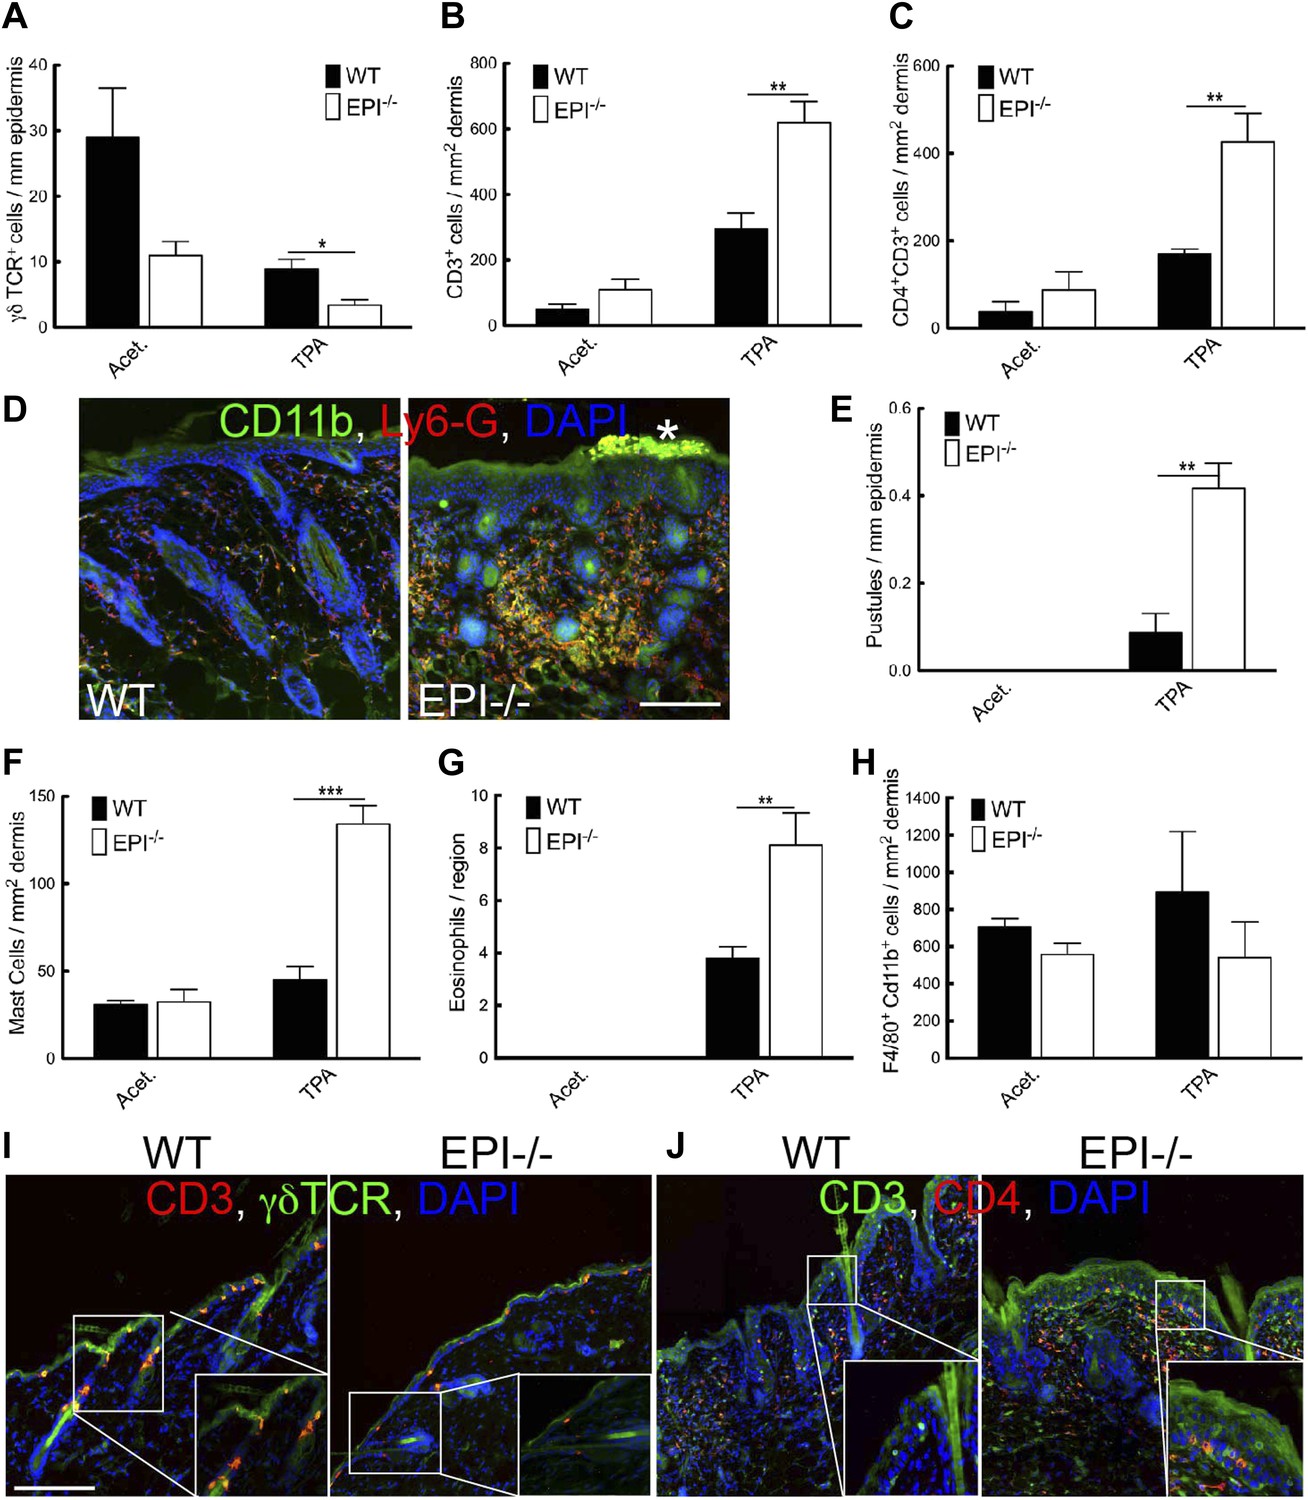
Immune cell responses to TPA treatment.
(A–C and E–H) Quantitation of specific T lymphocyte populations (A–C), pustules (E), mast cells (F), eosinophils (G), and macrophages (H) per mm epidermis or mm2 dermis. Data in all histograms are means ± SEM of at least three mice per genotype. (D, I, J) Skin sections of mice treated three times with acetone (I) or TPA (D and J) and labelled for CD11b (green, D), Ly6G (red, D), CD3 (red I, green J), γδTCR (green I) or CD4 (red, J) with DAPI nuclear counterstain (blue). White asterisk: neutrophil pustule. Insets in I and J are higher magnification views of boxed areas. Scale bars: 100 μm.
Figure 5

Stress signals, cytokine, and chemokine production in EPI−/− and WT skin.
(A) Heatmap of mRNA levels relative to GAPDH from epidermis and dermis. Each value represents the mean of data obtained from four mice. (B and C) Serum levels of IgE (B) and TSLP (C) determined by ELISA. (D–F) Q-PCR of indicated mRNAs in epidermis. All histograms represent mean ± SEM (N = 5 untreated, N = 7 acetone, N = 4 DMBA, N = 10 TPA treated mice per genotype).
Figure 6

Blocking strategies to revert the atopic response to TPA treatment.
(A–E) H&E stained skin sections of WT and EPI−/− mice painted with TPA and injected with IgG (A), Dexamethasone (B), α-CD4 antibody (C), α-Ly6G antibody (D) or α-IL4 (E). Scale bars: 100 μm. (F) Spleen mass of mice treated with acetone, TPA or TPA + Dexamethasone as % of body weight. Data are means ± SEM from 12 (acetone, TPA) or 3 (TPA + DXM) mice per genotype. (G) Numbers of granulocytes per μl blood in TPA treated mice injected with IgG or α-Ly6G antibody. (H) Quantification of serum levels of IL-4 in EPI−/− mice treated with IL-4 or control antibodies. (I and J) Effects of anti-IL-4 on epidermal thickness (μm) (8 cm skin analysed per condition) (I) and dermal CD4 + T cells (J).
Figure 7
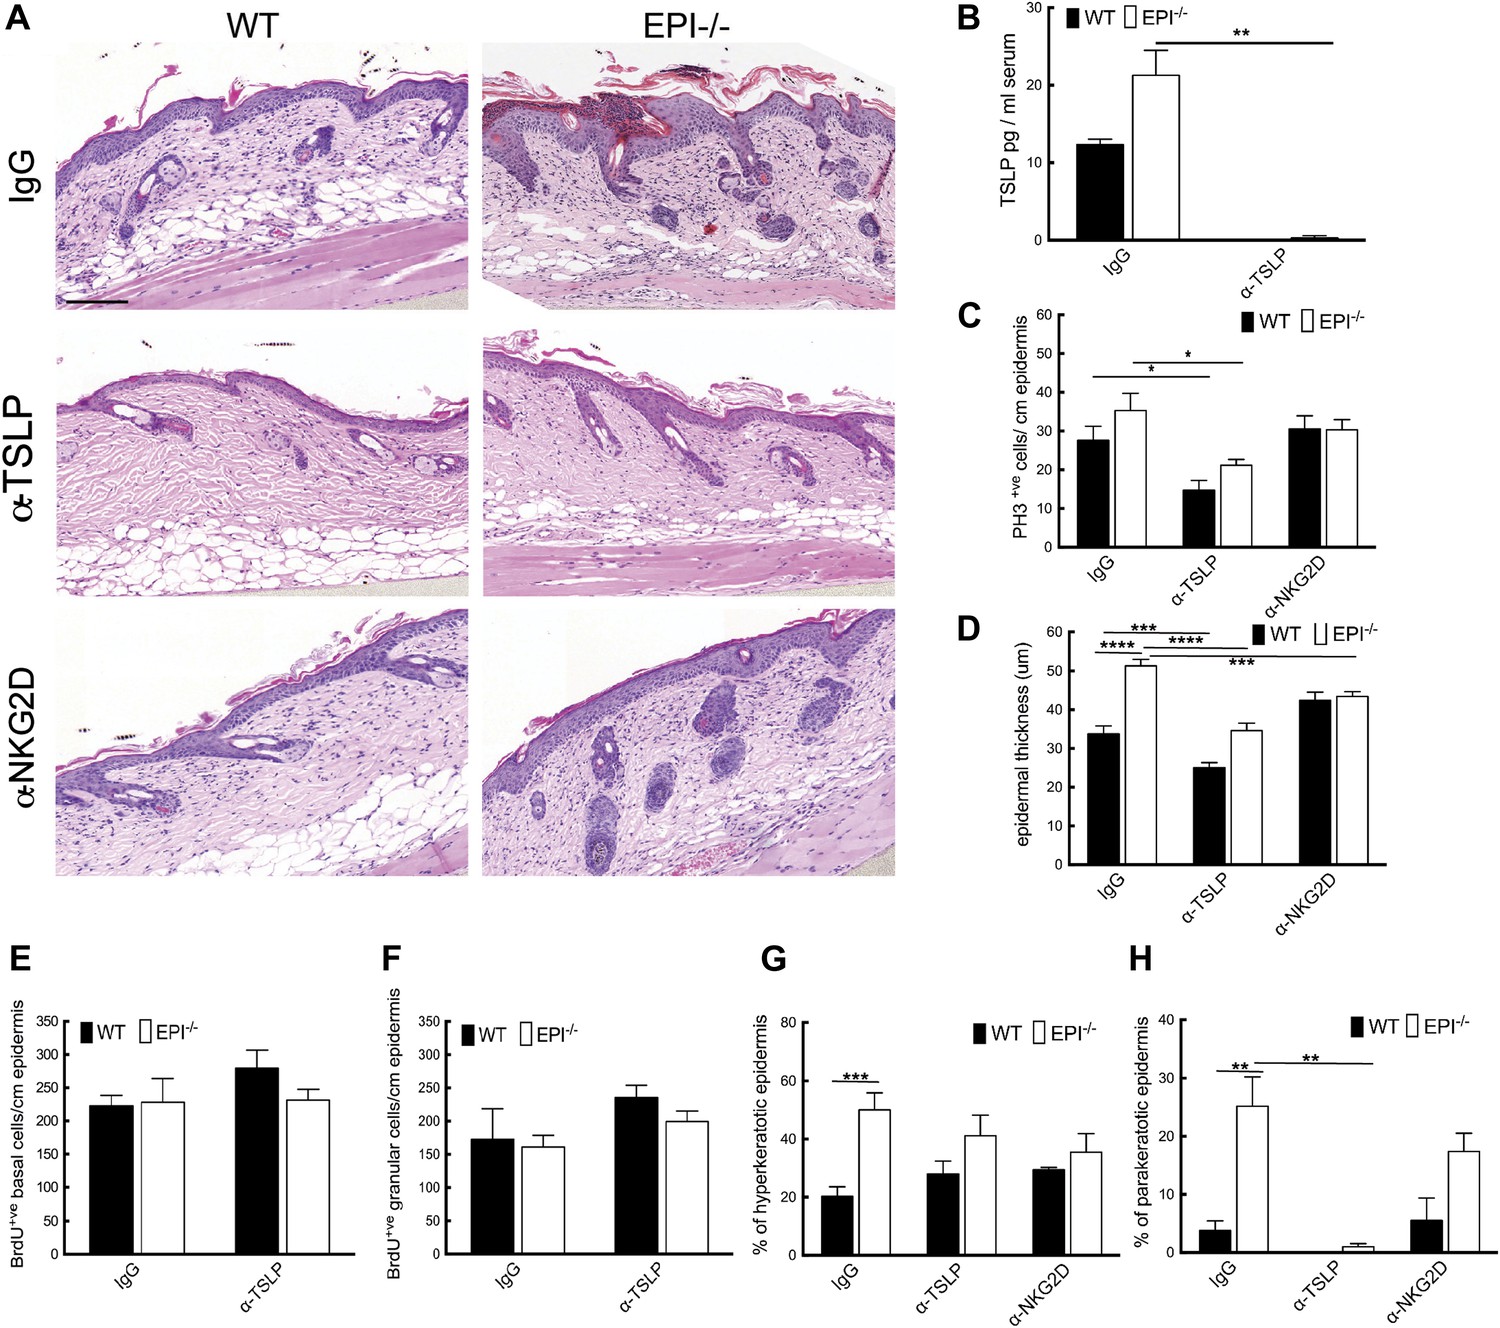
TSLP and NKG2D inhibition reduce epidermal responses to TPA.
(A) H&E stained sections of skin from TPA-treated mice injected with IgG, anti-TSLP, or anti-NKG2D antibodies. (B) Quantification of serum levels of TSLP in WT and EPI−/− mice treated with TSLP or control antibodies. (C and D) Quantification of PH3+ cells (C) and epidermal thickness (μm) (D). (E and F) Number of BrdU positive cells in basal (E) and uppermost two granular (F) epidermal layers in mice treated with TPA and the indicated antibodies. (G and H) % hyperkeratotic (G) and parakeratotic (H) stratum corneum. (C–D and E–F) 7-cm skin analysed per condition.
Figure 8
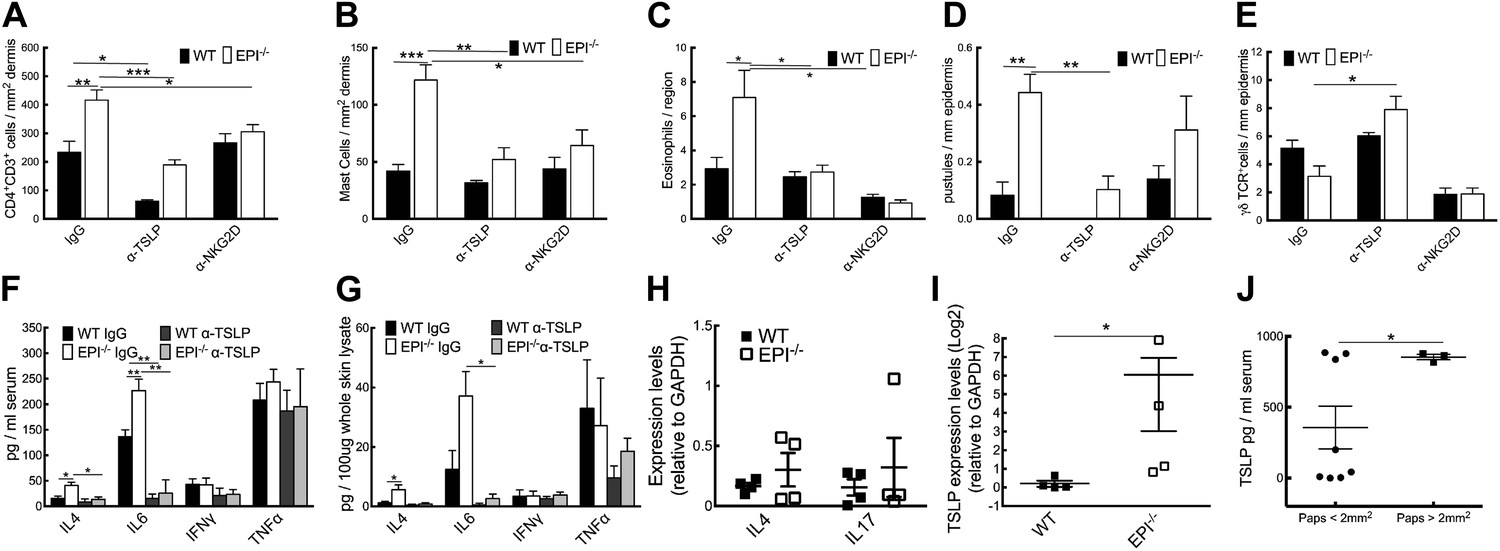
Effects of TSLP and NKG2D inhibition and quantitation of cytokine levels in SCCs.
(A–E) CD4+ T cells (A), mast cells (B), eosinophils (C), pustules (D), and γδ T cells (E) per mm epidermis or mm2 dermis. Data are means ± SEM from at least three mice per genotype. (F and G) Serum (F) and whole skin (G) protein levels of the cytokines indicated. Data are means ± SEM from 6 IgG and 3 α-TSLP-treated mice. (H and I) Q-PCR of mRNAs indicated in SCCs. Data are means ± SEM of 4 SCCs per genotype. (J) Serum levels of TSLP in EPI−/− mice bearing papillomas smaller than 2 mm2 or at least one papilloma larger than 2 mm2. Data are means ± SEM of at least three mice per group.
Figure 9

Model of the role of an epidermal barrier defect in tumour protection.
EPI−/− mice lack three cornified envelope proteins, resulting in a defective epidermal barrier. Topical application of DMBA induces H-Ras mutations, as in wild-type mice. Topical TPA treatment elicits an exaggerated atopic response, characterized by altered keratinocyte differentiation and an enhanced inflammatory response. Epidermal production of TSLP and activation of the ligand-NKG2D pathway on immune cells are proposed to contribute to tumour protection.
Additional files
-
Supplementary file 1
Primers and TaqMan probes used.
- https://doi.org/10.7554/eLife.01888.012
Download links
A two-part list of links to download the article, or parts of the article, in various formats.
Downloads (link to download the article as PDF)
Open citations (links to open the citations from this article in various online reference manager services)
Cite this article (links to download the citations from this article in formats compatible with various reference manager tools)
Epidermal barrier defects link atopic dermatitis with altered skin cancer susceptibility
eLife 3:e01888.
https://doi.org/10.7554/eLife.01888


