The transcription factor Pou3f1 promotes neural fate commitment via activation of neural lineage genes and inhibition of external signaling pathways
- Institute of Biochemistry and Cell Biology, Shanghai Institutes for Biological Sciences, Chinese Academy of Sciences, China
- West China Hospital, Sichuan University, China
- CAS-MPG Partner Institute for Computational Biology, Shanghai Institutes for Biological Sciences, Chinese Academy of Sciences, China
- Institute of Life Science, Nanchang University, China
Figures
Figure 1 with 4 supplements

Pou3f1 is essential for ESC neural differentiation.
(A) Schematic expression profiles of Pou3f1 and of several key marker genes during ESC neural differentiation in serum-free medium. Rex1, ESC marker; Fgf5, EpiSC marker; Sox1, NPC marker; Tuj1, neuron marker. Detection of Pou3f1 protein expression during ESC neural differentiation by Western blotting. (B) Gene expression levels in control-ESCs (Ctrl) and in Pou3f1-knockdown ESCs (Pou3f1-KD1, Pou3f1-KD3) at neural differentiation day 4 were determined by Q-PCR. Three independent experiments were performed. (C) Immunocytochemical assays of Sox/Oct4, Pax6, and Tuj1 in day 4 EBs described in B. DNA is stained with DAPI. Scale bars: 50 μm. (D) Statistical analysis of Sox+/Oct4−, Pax6+, and Tuj1+ cells in C. (E) Gene expression levels in control-ESCs and inducible Pou3f1-overexpressing (Pou3f1-OE) ESCs at unbiased differentiation (10%FBS) day 8 were determined by Q-PCR. Dox (2 μg/ml) was added for 8 days. (F) Immunocytochemical assays of Sox/Oct4, Pax6, Nestin, and of Tuj1 in day 8 EBs described in E. Scale bars, 50 μm. (G) Statistical analysis of Sox+/Oct4−, Pax6+, and Tuj1+ cells in F. (H) Pou3f1-knockdown ESCs were transfected with control or with Pou3f1-overexpressing lentiviruses. Gene expression levels at neural differentiation day 4 were determined by Q-PCR. The values represent the mean ± SD for B, D, E, G, and for H. (*p<0.05; **p<0.01).
Figure 1—figure supplement 1
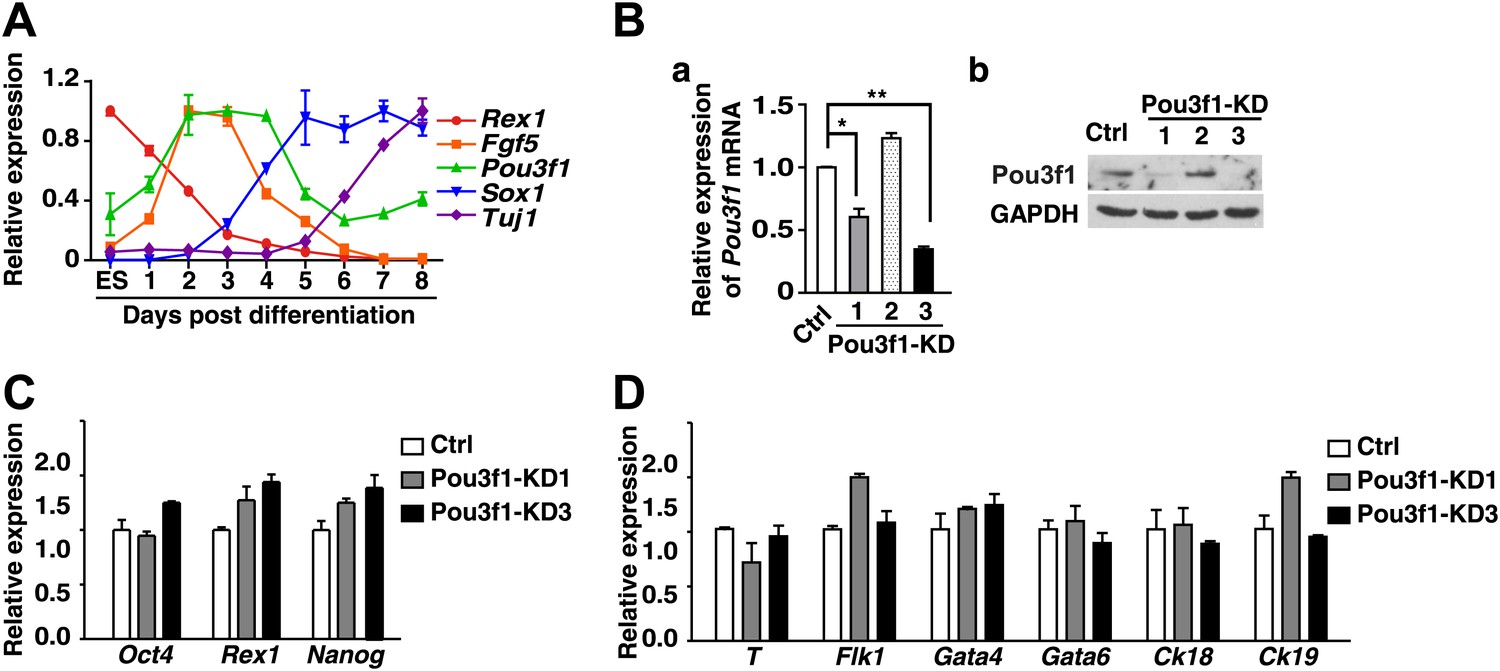
Pou3f1-knockdown ESCs could differentiate into non-neural cell lineages.
(A) Expression profiling of Pou3f1 and of several key marker genes during ESC neural differentiation in serum-free medium, was determined by Q-PCR. (B) a, Knockdown efficiency of Pou3f1 with control-shRNA and Pou3f1-KD1/2/3 lentivirus-transfected ESCs was determined by Q-PCR. b, Knockdown of Pou3f1 protein by Pou3f1-shRNAs. (C) Gene expression levels in control and Pou3f1-knockdown ESCs were determined by Q-PCR. (D) Expression levels of germ layer genes in control and Pou3f1-knockdown ESCs at unbiased differentiation day 8 were determined by Q-PCR. The values represent the mean ± SD. (*p<0.05; **p<0.01).
Figure 1—figure supplement 2
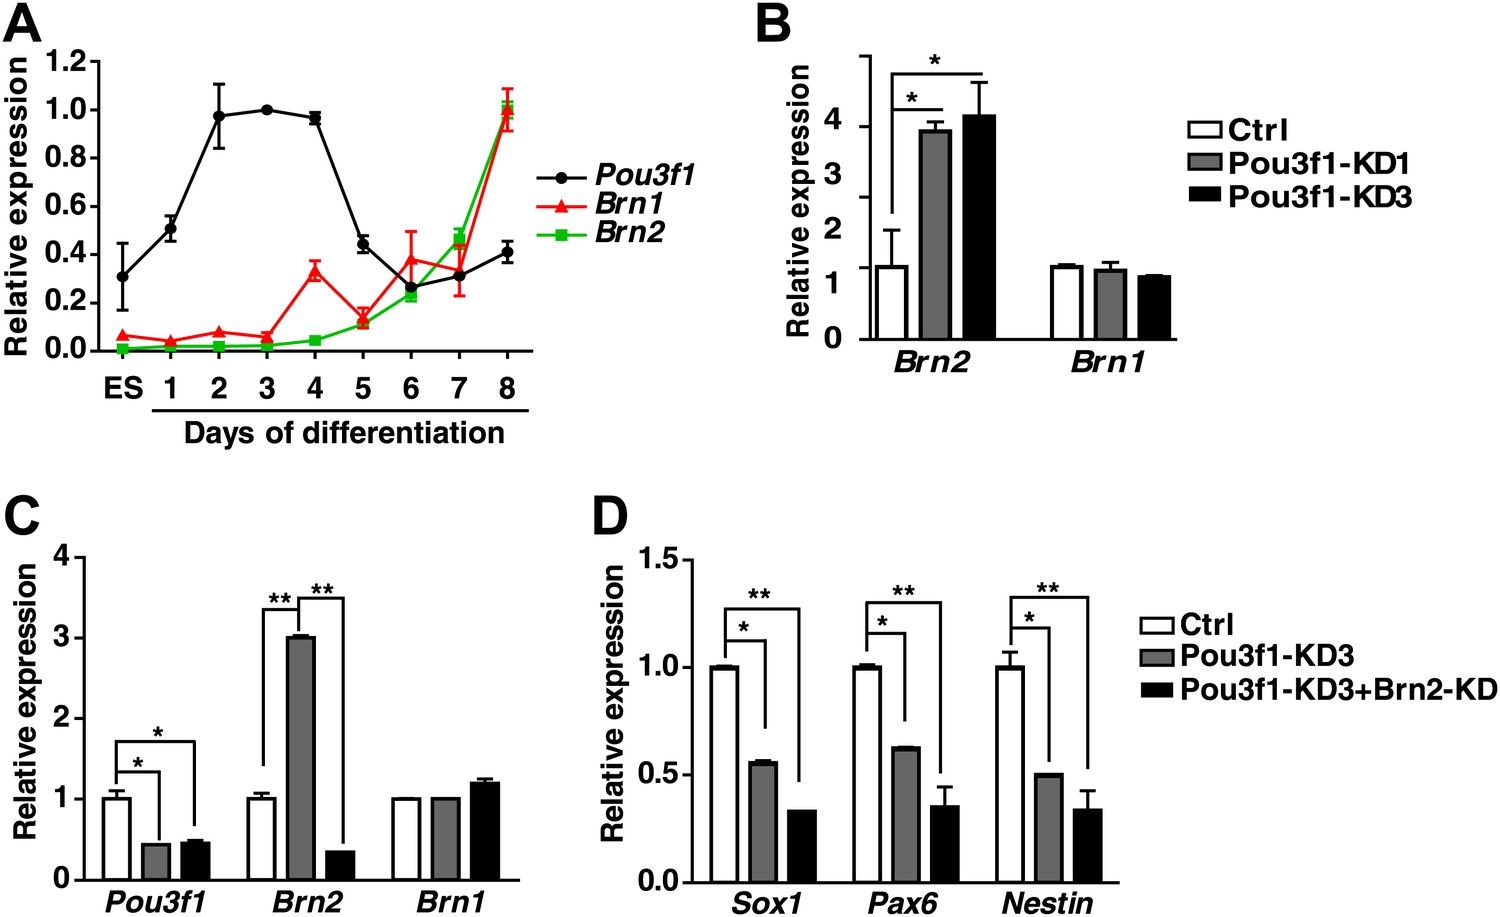
Brn2 could compensate for the Pou3f1 depletion during ESC neural fate commitment.
(A) Expression levels of the POU III family members Pou3f1, Brn1, and Brn2 during ESC neural differentiation in serum-free medium. (B) Brn1 and Brn2 expression levels in control and Pou3f1-knockdown ESCs were determined by Q-PCR. (C) Expression levels of POUIII family members in control, Pou3f1-knockdown and Pou3f1/Brn2-knockdown ESCs undergoing differentiation for 4 days in serum-free medium. (D) Expression levels of neural marker genes in control, Pou3f1-knockdown, and Pou3f1/Brn2-knockdown ESCs undergoing differentiation for 4 days in serum-free medium.
Figure 1—figure supplement 3
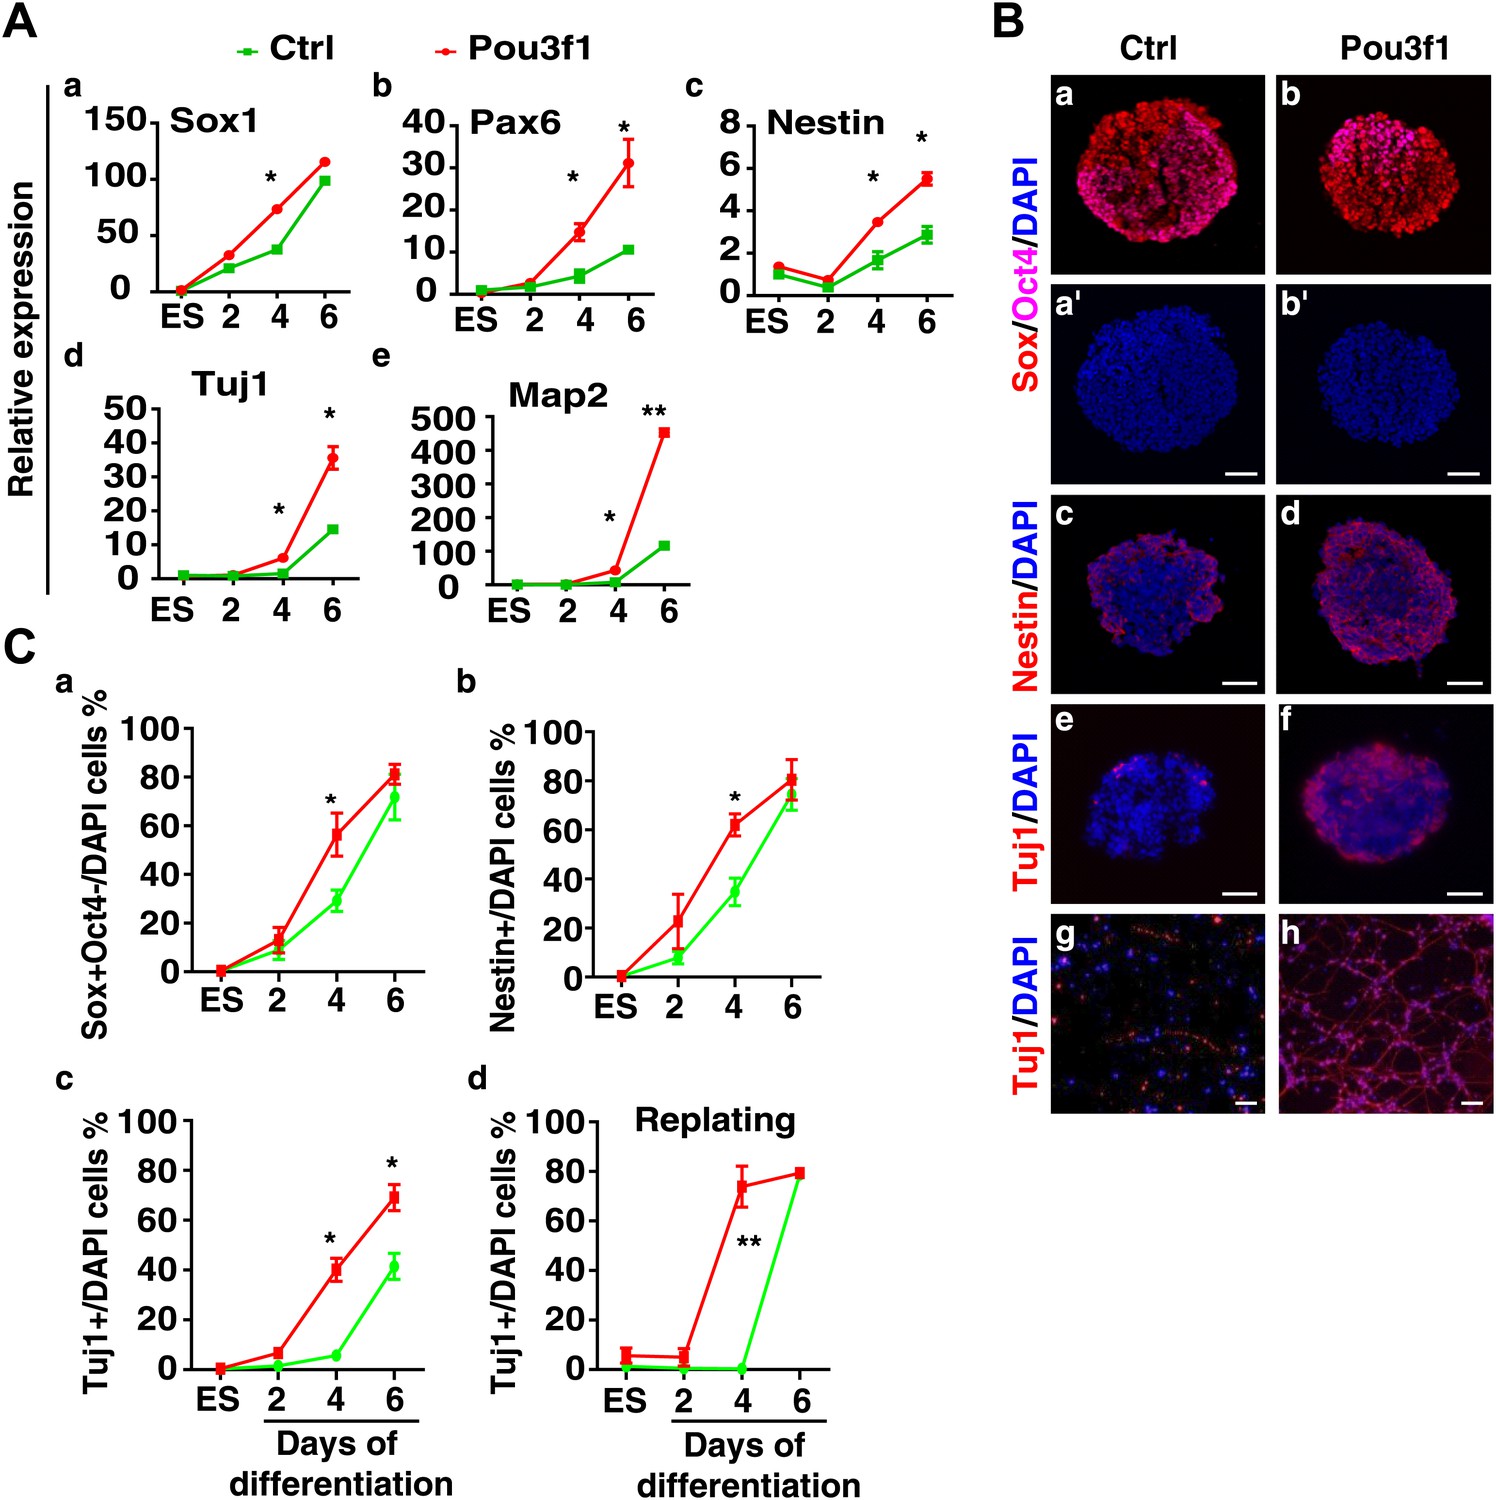
Overexpression of Pou3f1 accelerates ESC neural differentiation in serum-free condition.
(A) Expression levels of neural marker genes in control and Pou3f1-stable-overexpression ESCs differentiated in serum-free medium from days 0 to 6. (B) Immunocytochemical assays of Sox/Oct4, Nestin, and Tuj1 in day 4 EBs described in A. Cells in day 4 EBs were replated in N2 medium for 2 days. Immunostaining of Tuj1 (red) was performed (g and h). DNA is stained with DAPI. Scale bars: 50 μm. (C) Statistical analysis of Sox+/Oct4−, Nestin+, and Tuj1+ cells in EBs and percentages of Tuj1+ cells in adherent culture during neural differentiation from days 0 to 6 in A.
Figure 1—figure supplement 4
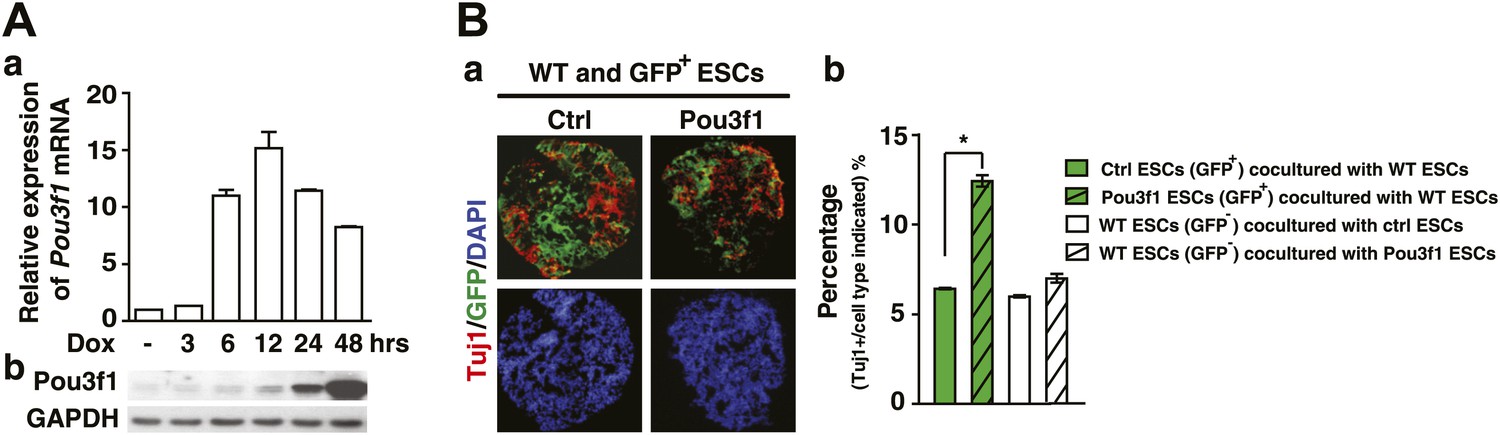
Pou3f1 promotes neural differentiation in a cell-autonomous manner.
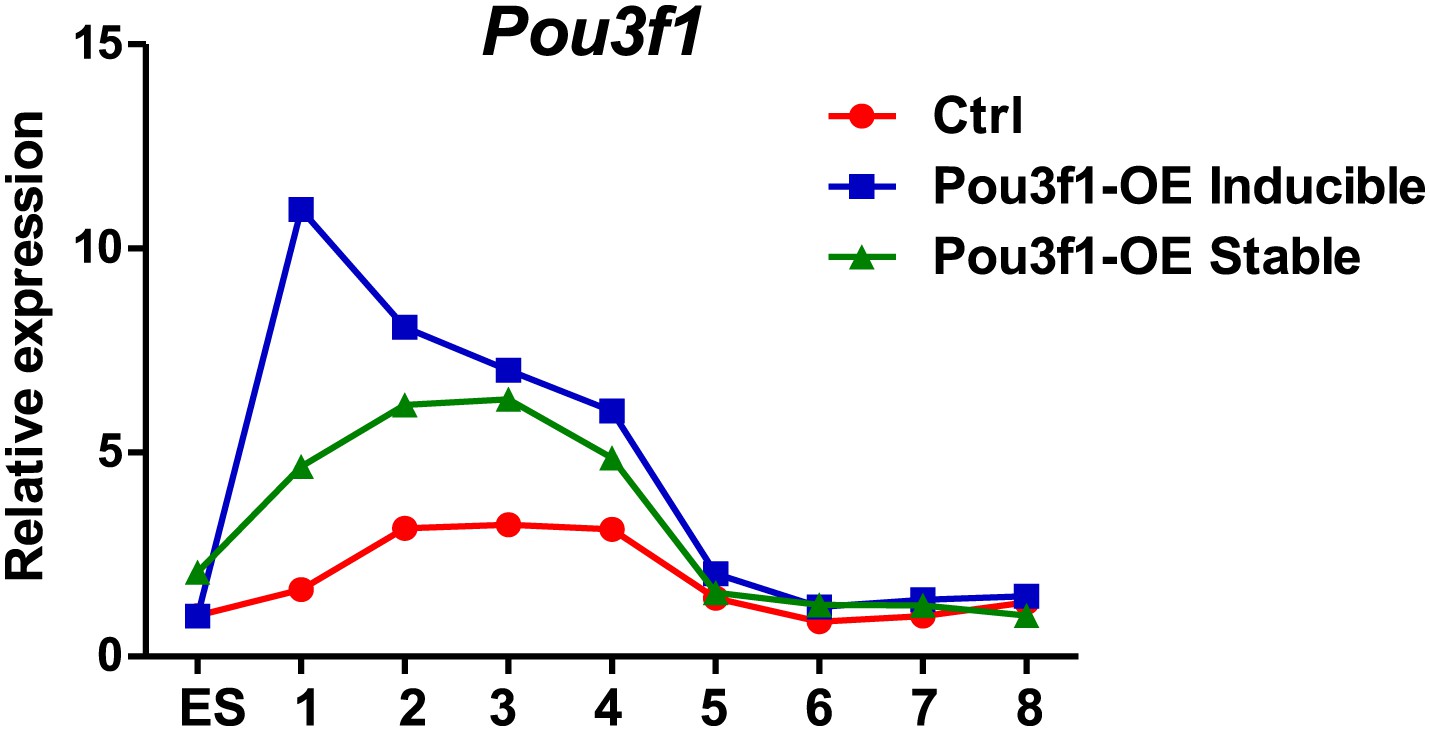
(A) a, Q-PCR and b, Western blotting analysis of induced Pou3f1 overexpression. ESCs in adherent cultures were treated with Dox for 48 hr. (B) a, Immunocytochemical assays for Tuj1 (red) and GFP (green) using the co-cultured EBs. Wt ESCs (GFP−) were co-cultured with control ESCs (GFP+) or with Pou3f1-overexpressing ESCs (GFP+) in serum-free medium for 6 days. b, Cells in ‘a’ were immunostained by the Tuj1 antibody and then analyzed by fluorescence-activated cell sorting. The values represent the mean ± SD. (*p<0.05; **p<0.01).
Figure 2
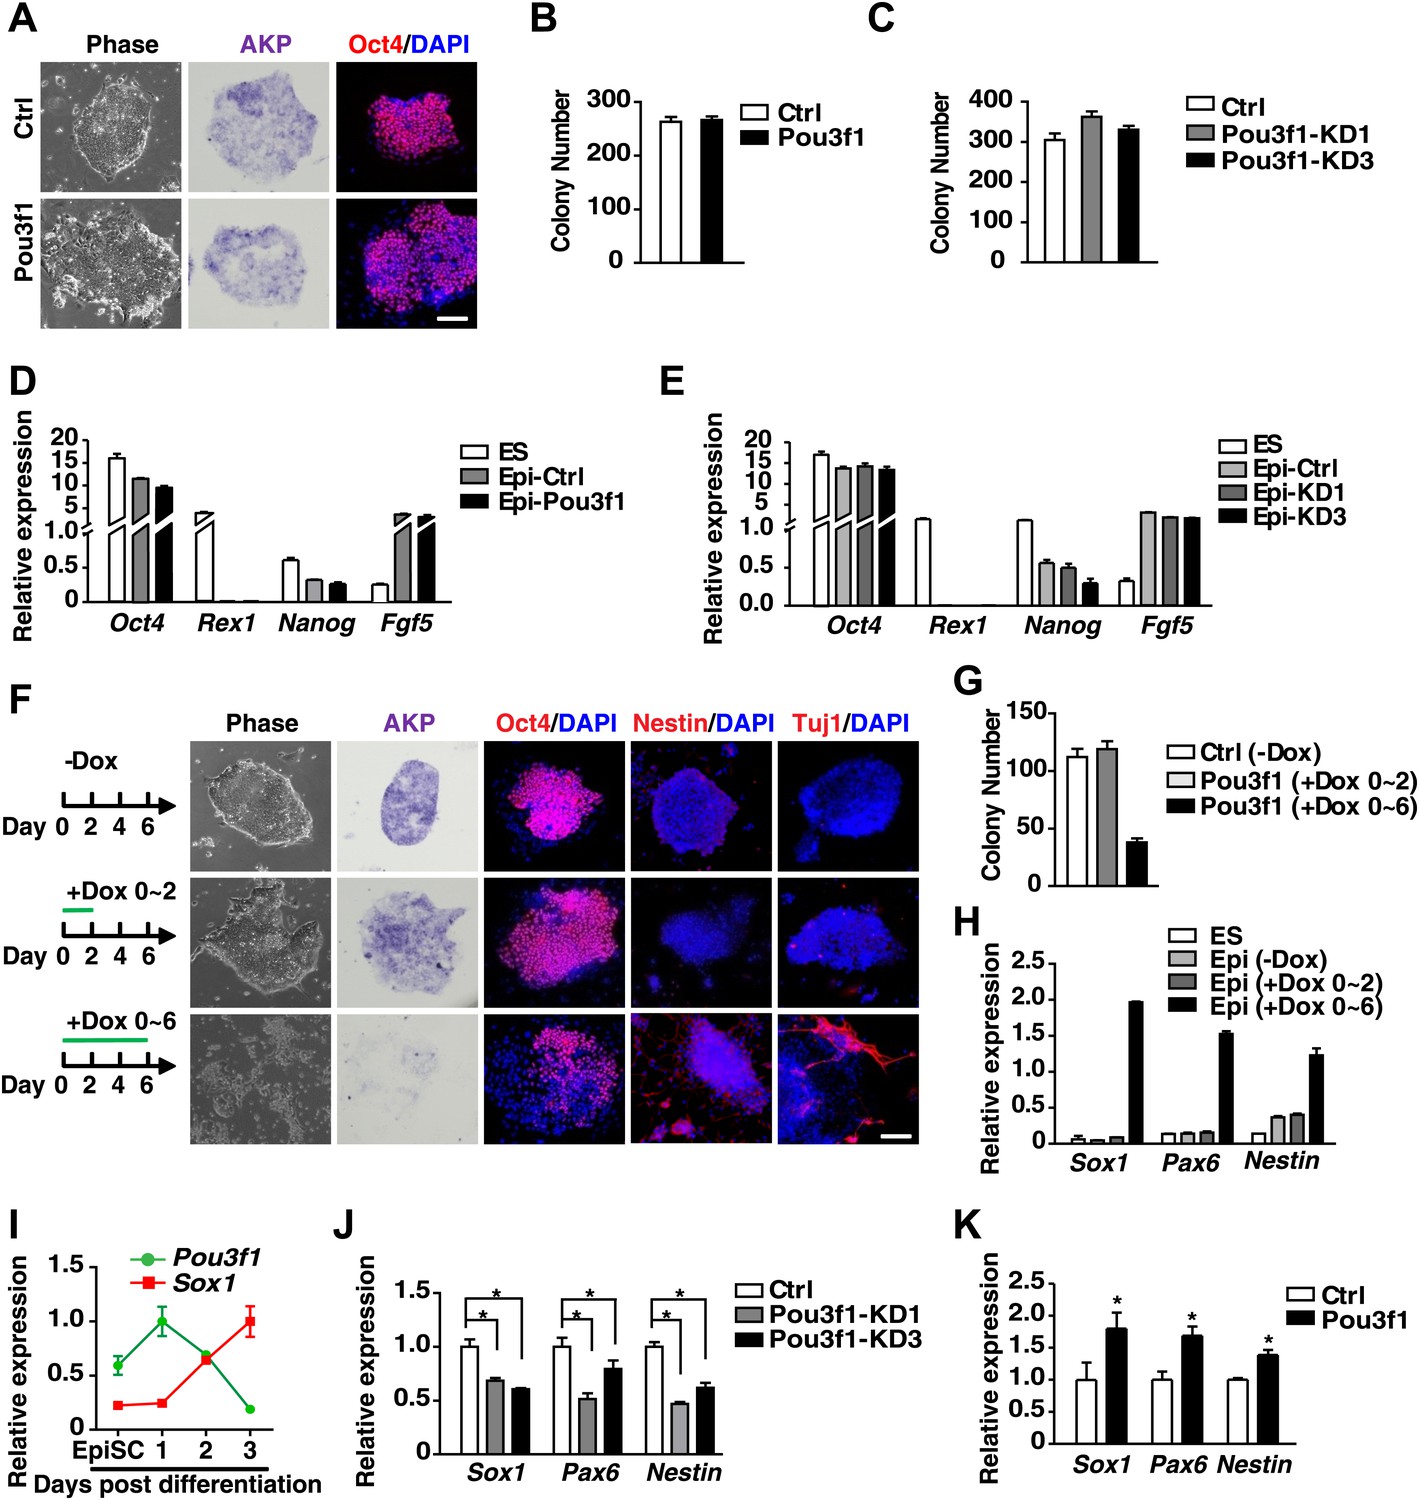
Pou3f1 promotes the neural differentiation from EpiSCs to NPCs.
(A) Inducible Pou3f1-overexpressing ESCs were cultured as EBs for 2 days in the medium with or without Dox and then subjected to the ESD-EpiSC colony formation assay for 6 days in Dox-free CDM/AF medium. EpiSC-like colony cellular morphology, alkaline phosphatase activity (AKP) (purple), and Oct4 immunostaining (red) are presented. Scale bars, 100 μm. (B) Statistical analysis of EpiSC-like colonies in A. (C) Statistical analysis of EpiSC-like colonies from the control-ESCs and from Pou3f1-knockdown ESCs (Pou3f1-KD1, Pou3f1-KD3) in the ESD-EpiSC colony formation assay. (D) Gene expression levels in ESCs and in EpiSC-like colonies formed in A. (E) Gene expression levels in ESCs and in EpiSC-like colonies formed in C. (F) EpiSC-like colonies from control-ESCs (−Dox), short-term Pou3f1-overexpressing ESCs (+Dox 0–2), and from long-term Pou3f1-overexpressing ESCs (+Dox 0–6) in the ESD-EpiSC colony formation assay. Cellular morphology, AKP activity, and immunostaining for Oct4, Nestin, or for Tuj1 with DAPI are presented. Scale bars, 100 μm. (G) Statistical analysis of EpiSC-like colony numbers described in F. (H) Gene expression levels of ESCs and of the EpiSC-like colonies described in F. (I) Expression profiling of Pou3f1 and Sox1 during EpiSC neural differentiation in serum-free medium. (J) Gene expression levels of control and Pou3f1-knockdown EpiSCs in serum-free medium at differentiation day 2 were determined by Q-PCR. (K) Gene expression levels of control and Pou3f1-overexpressing EpiSCs at unbiased EBs differentiation day 2 were determined by Q-PCR. The values represent the mean ± SD for B–E and for G–K. (*p<0.05).
Figure 3 with 1 supplement
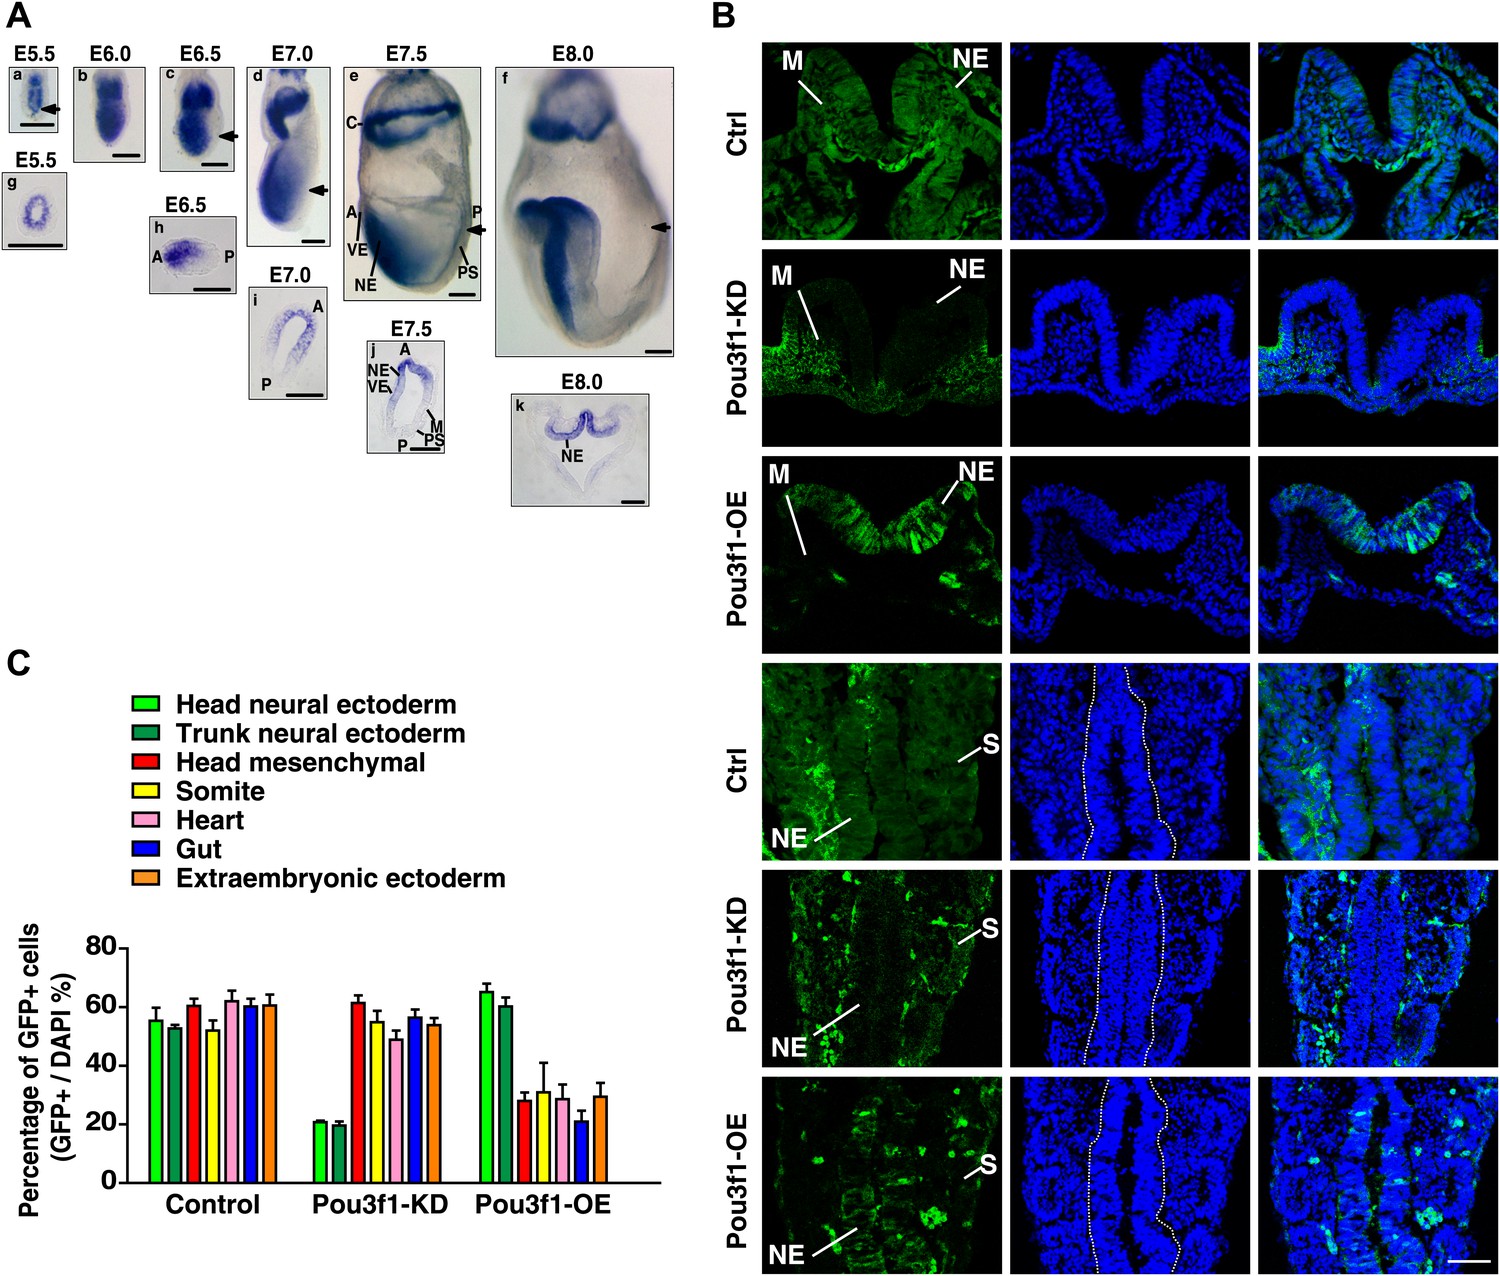
Pou3f1 promotes neural fate commitment in vivo.
(A) Whole-mount in situ hybridization of Pou3f1 in early mouse embryos (E5.5–E8.0). The arrowhead marks the position-plane of the transverse section of the corresponding embryo below. Scale bars, 100 μm. (B) Contribution of injected GFP-labeled control (Ctrl), Pou3f1-knockdown (Pou3f1-KD), and inducible Pou3f1-overexpressing (Pou3f1-OE) ESCs to different germ lineages in chimeric embryos. NE, neuroectoderm; M, mesenchyme; and S, somite. Scale bars, 50 μm. (C) Statistical analysis of GFP-positive cell distribution in the various germ layer lineages in the ESC blastocyst injection study. The values represent the mean ± SD for C.
Figure 3—figure supplement 1
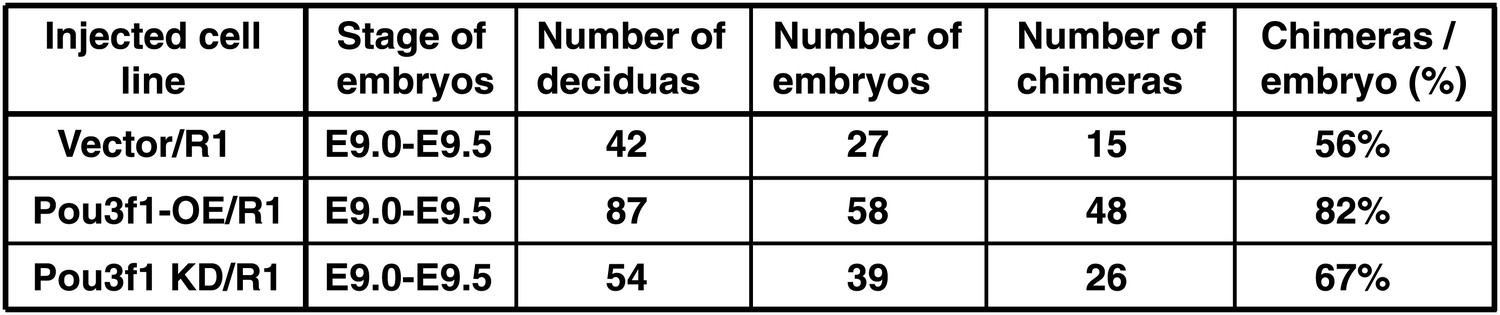
Information of chimeric mice generated from Pou3f1-overexpressing or knockdown ESCs.
https://doi.org/10.7554/eLife.02224.010
Figure 4 with 1 supplement
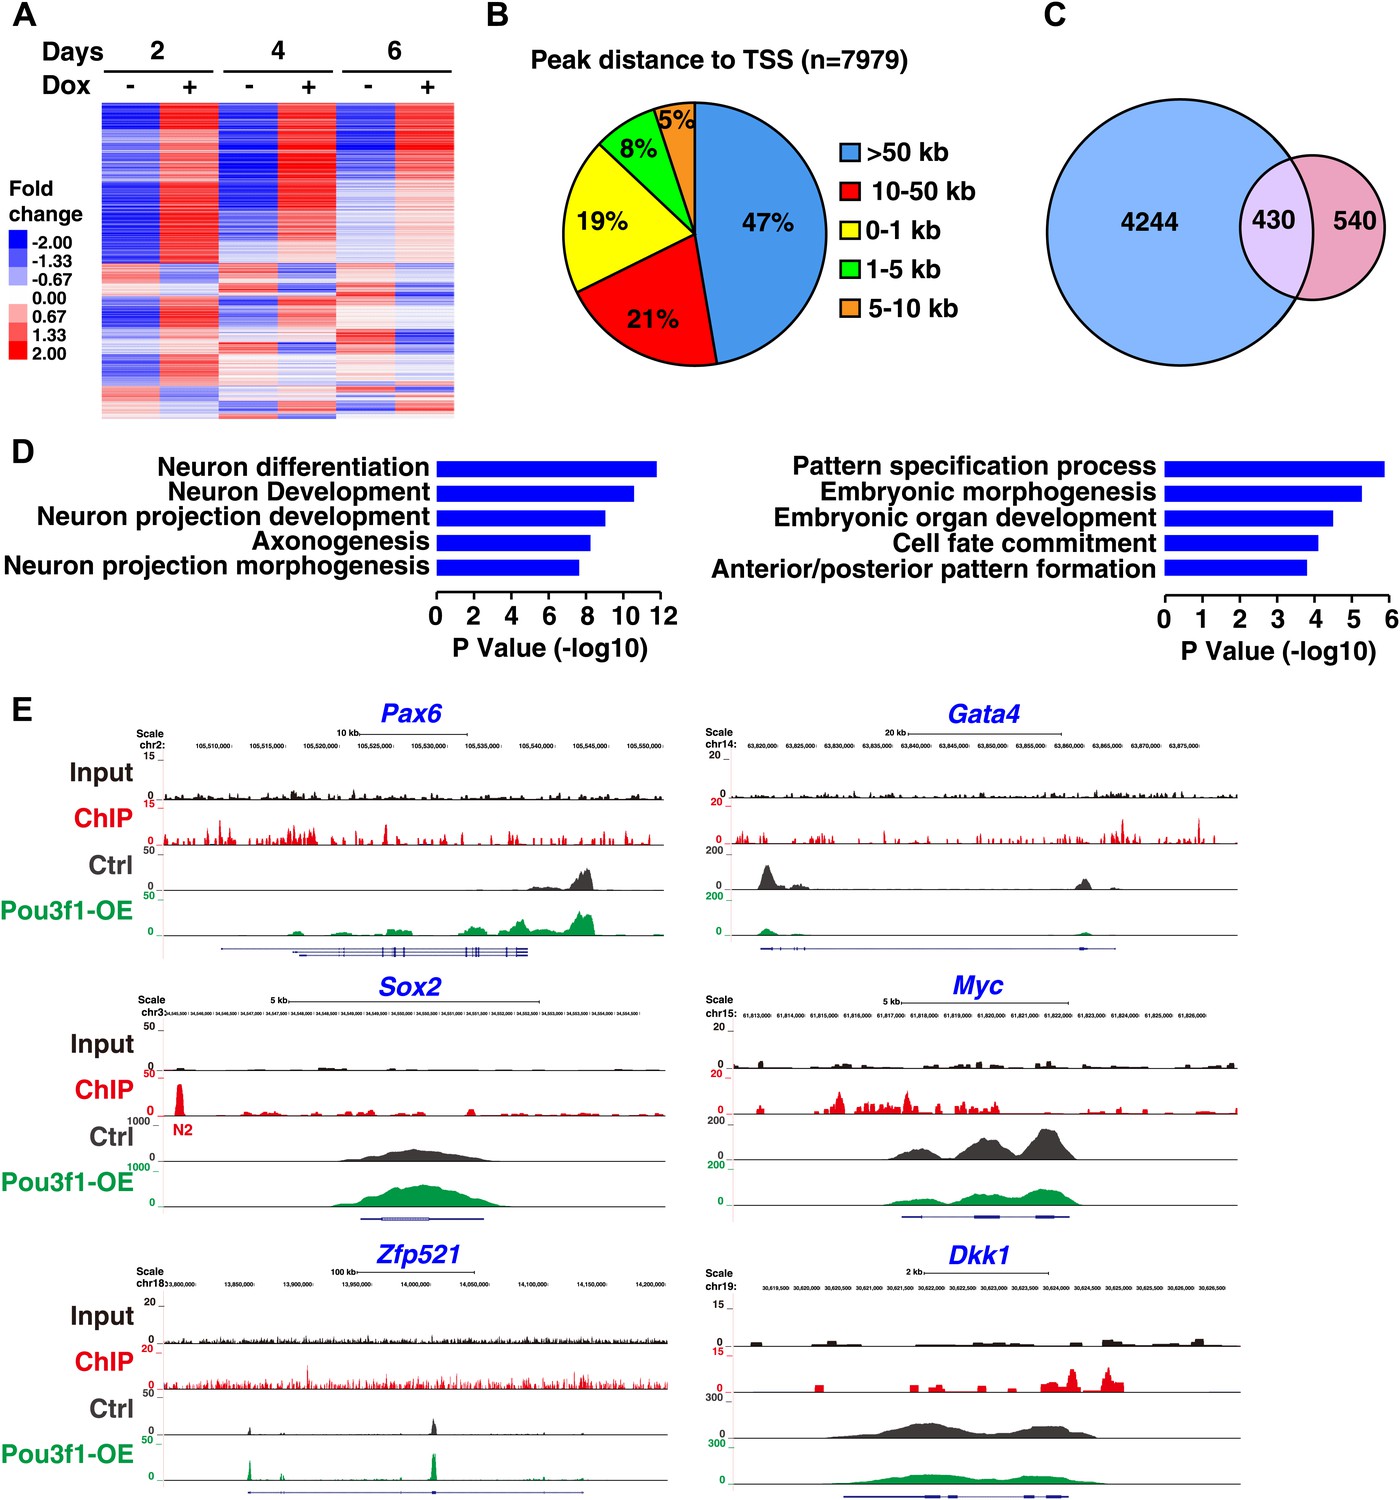
RNA-seq and ChIP-seq analysis of Pou3f1 downstream targets.
(A) RNA-seq gene expression heat map of control and of inducible Pou3f1-overexpressing ESCs with Dox-treatment for 6 days. Heat-map colors (red, up-regulation; blue, down-regulation) indicate gene expression in units of standard deviation from the mean of all samples. (B) Analysis of Pou3f1-enriched regions in the ChIP-seq assay. Pie chart showing the percentage distribution of Pou3f1-binding peaks in each category. The ChIP-seq assay was performed with Pou3f1-overexpressing ESCs at differentiation day 4. (C) Venn diagram depicting the overlap (purple) of Pou3f1-bound genes (blue) and genes with significantly altered expression upon Pou3f1 overexpression (pink) at differentiation day 4. Statistical significance was estimated by Fisher's exact test (p<4.71e−75). (D) GO analysis of biological processes of the overlap genes described in C. Many genes involved in neural differentiation processes were up-regulated, whereas a few genes related to pattern specification were down-regulated. Log p value was used to rank the enrichment. (E) Genome browser view of the distribution of the ChIP-seq and RNA-seq reads of represented genes. The upper panels show the Pou3f1-binding regions identified by ChIP-seq (black, input; red, Pou3f1-binding site at genomic loci), and the lower panels depict the RNA-seq reads of the represented genes in control ESCs (gray) and in Pou3f1-overexpressing ESCs (green) at differentiation day 4.
Figure 4—figure supplement 1
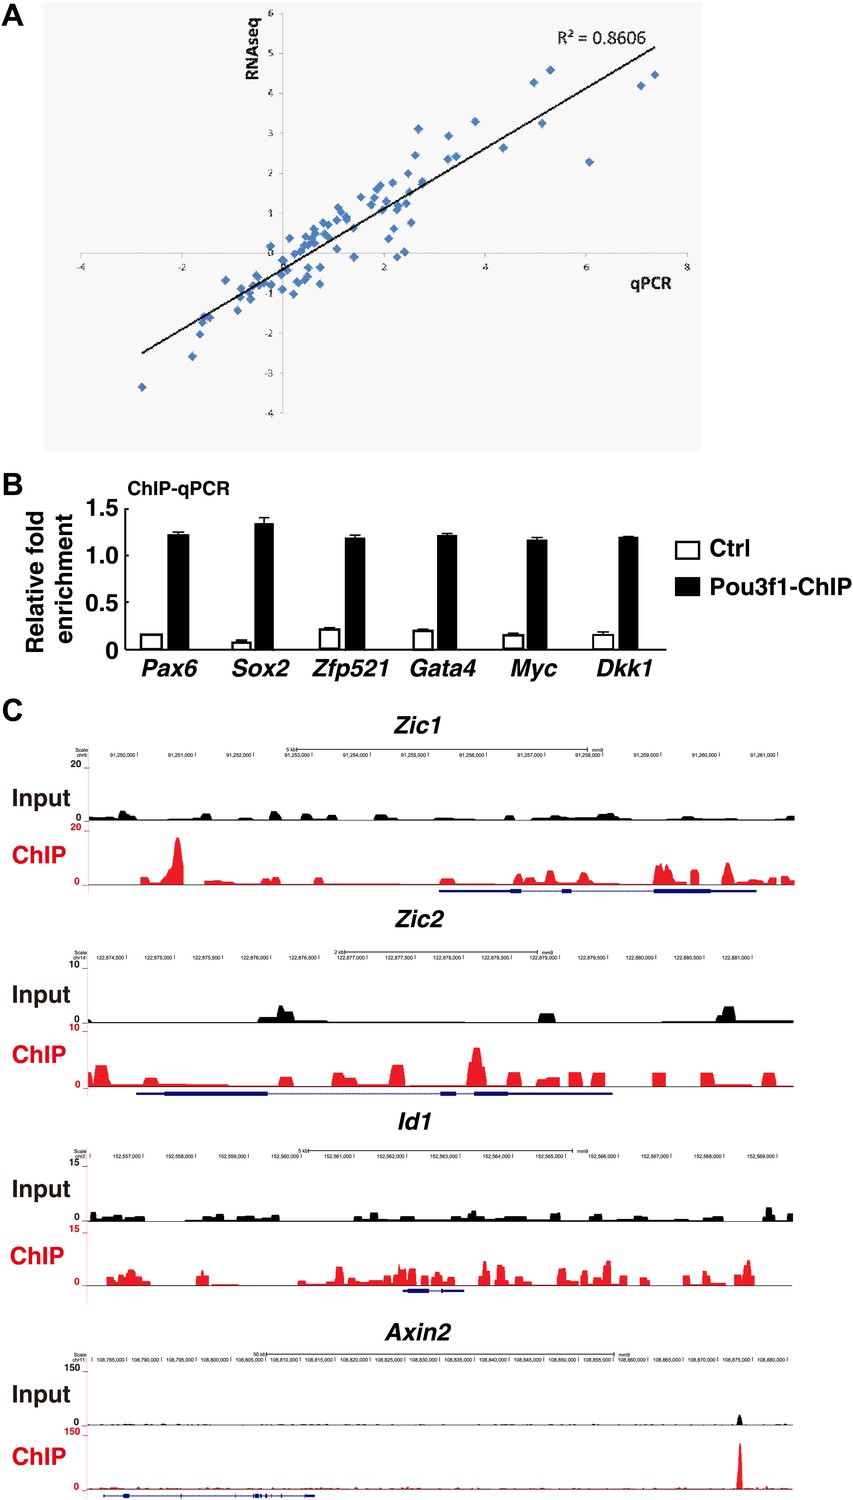
Pou3f1 is enriched in the loci of multiple downstream target genes.
(A) Correlation between Q-PCR and RNA-Seq data. Approximately, 30 genes were chosen to confirm the RNA-Seq results. (B) ChIP-qPCR verification of the ChIP-seq data represented in Figure 4E. Pou3f1 enrichment at identified binding sites of each gene was normalized to corresponding coding regions. (C) Genome browser view of the distribution of Pou3f1 binding on the loci of representative genes. The values represent the mean ± SD for B.
Figure 5 with 1 supplement
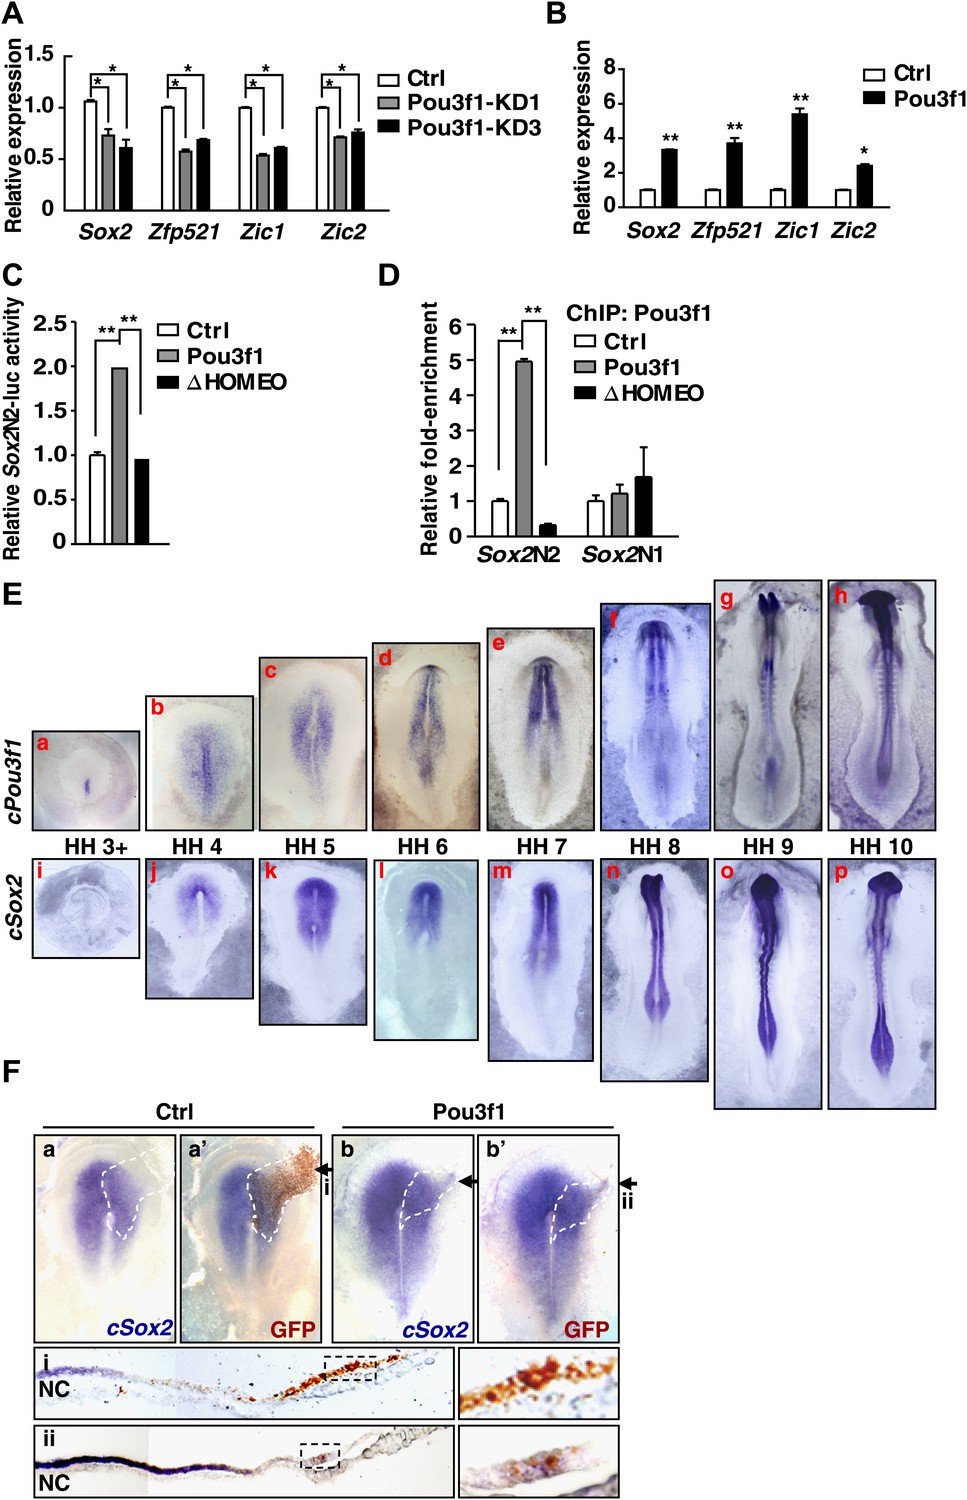
Pou3f1 increases neural lineage-specifier expression.
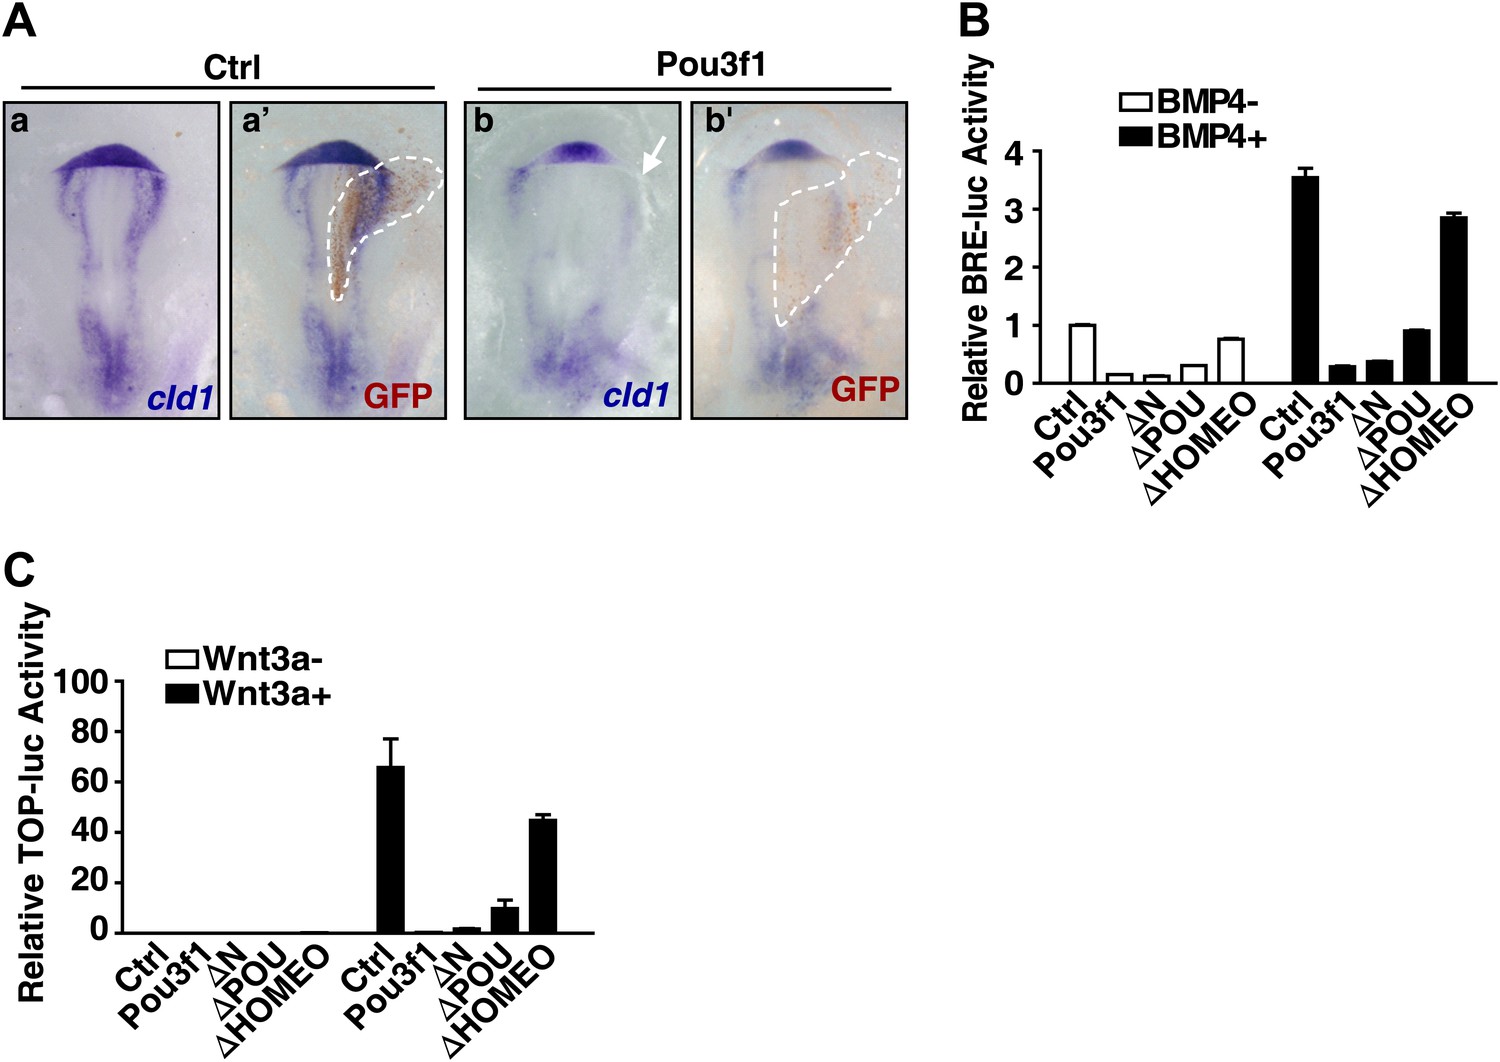
(A) Gene expression levels in control and in Pou3f1-knockdown ESCs differentiated in serum-free medium for 4 days. (B) Gene expression levels in control and in inducible Pou3f1-overexpressing ESCs at unbiased differentiation day 8. (C) Luciferase assays using the Sox2N2-luc enhancer in control, Pou3f1-full length, or in Pou3f1-ΔHOMEO vector-transfected HEK293 cells. (D) ChIP assay in control, Pou3f1-full length, or in Pou3f1-ΔHOMEO lentivirus-transfected P19 cells. A Pou3f1-specific antibody was used, and Pou3f1 enrichment at Sox2N2 and Sox2N1 enhancer regions was normalized to the Sox2 coding region. (E) Whole-mount in situ hybridization of cPou3f1 (a–h) and cSox2 (i–p) in early chick embryos from HH stage 3+ to HH stage 10. (F) Pou3f1 overexpression induces cSox2 expression ectopically. IRES-GFP (control vector, a and a′) or Pou3f1-IRES-GFP (b and b′) was electroporated into the epiblast layer of the chick embryos. cSox2 (blue) expression was examined by in situ hybridization (a, b, a′, b′). GFP expression (brown) indicating the electroporated field was detected by immunohistochemical assays (a′ and b′). The arrowhead marks the position-plane of the corresponding embryo transverse section below (i and ii). NC, notochord. The values represent the mean ± SD for A–D. (*p<0.05; **p<0.01).
Figure 5—figure supplement 1
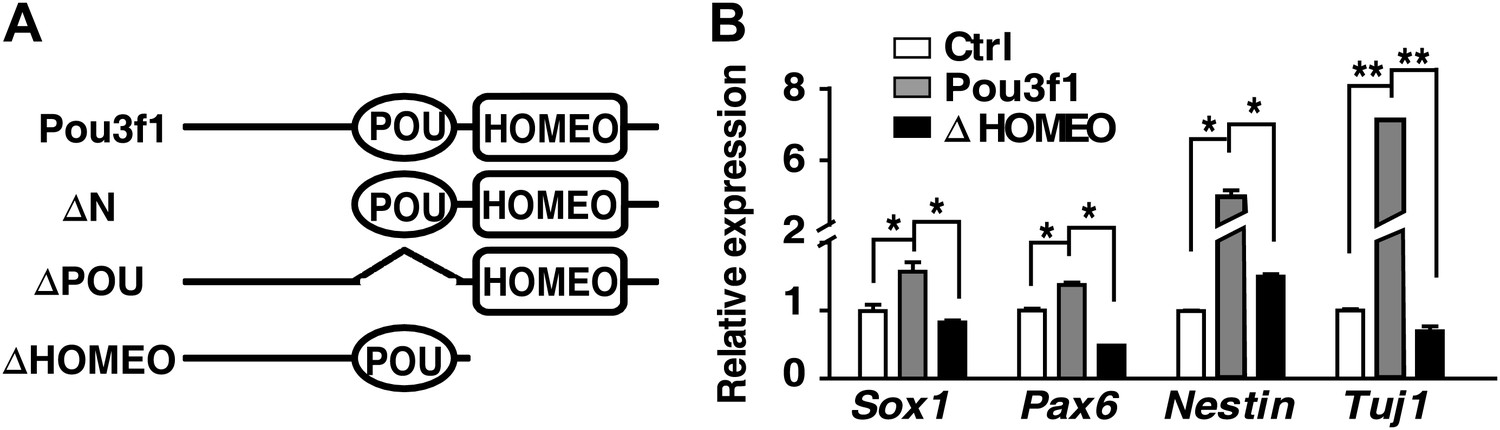
HOMEO domain is essential for the neural-promoting effect of Pou3f1.
(A) Schematic structure of full-length and domain-deleted mutant Pou3f1 proteins. Row 1, full-length Pou3f1; Row 2, Pou3f1 without the N-terminus (ΔN, missing 1–244 amino acids); Row 3, Pou3f1 without the POU domain (ΔPOU, missing 245–324 amino acids); Row 4, Pou3f1 without the HOMEO domain (ΔHOMEO, missing 325–499 amino acids). (B) Gene expression levels in ESCs transfected with control, Pou3f1-full length or with Pou3f1-ΔHOMEO lentiviruses at differentiation day 4 in serum-free medium. The values represent the mean ± SD for B. (*p<0.05; **p<0.01).
Figure 6 with 1 supplement
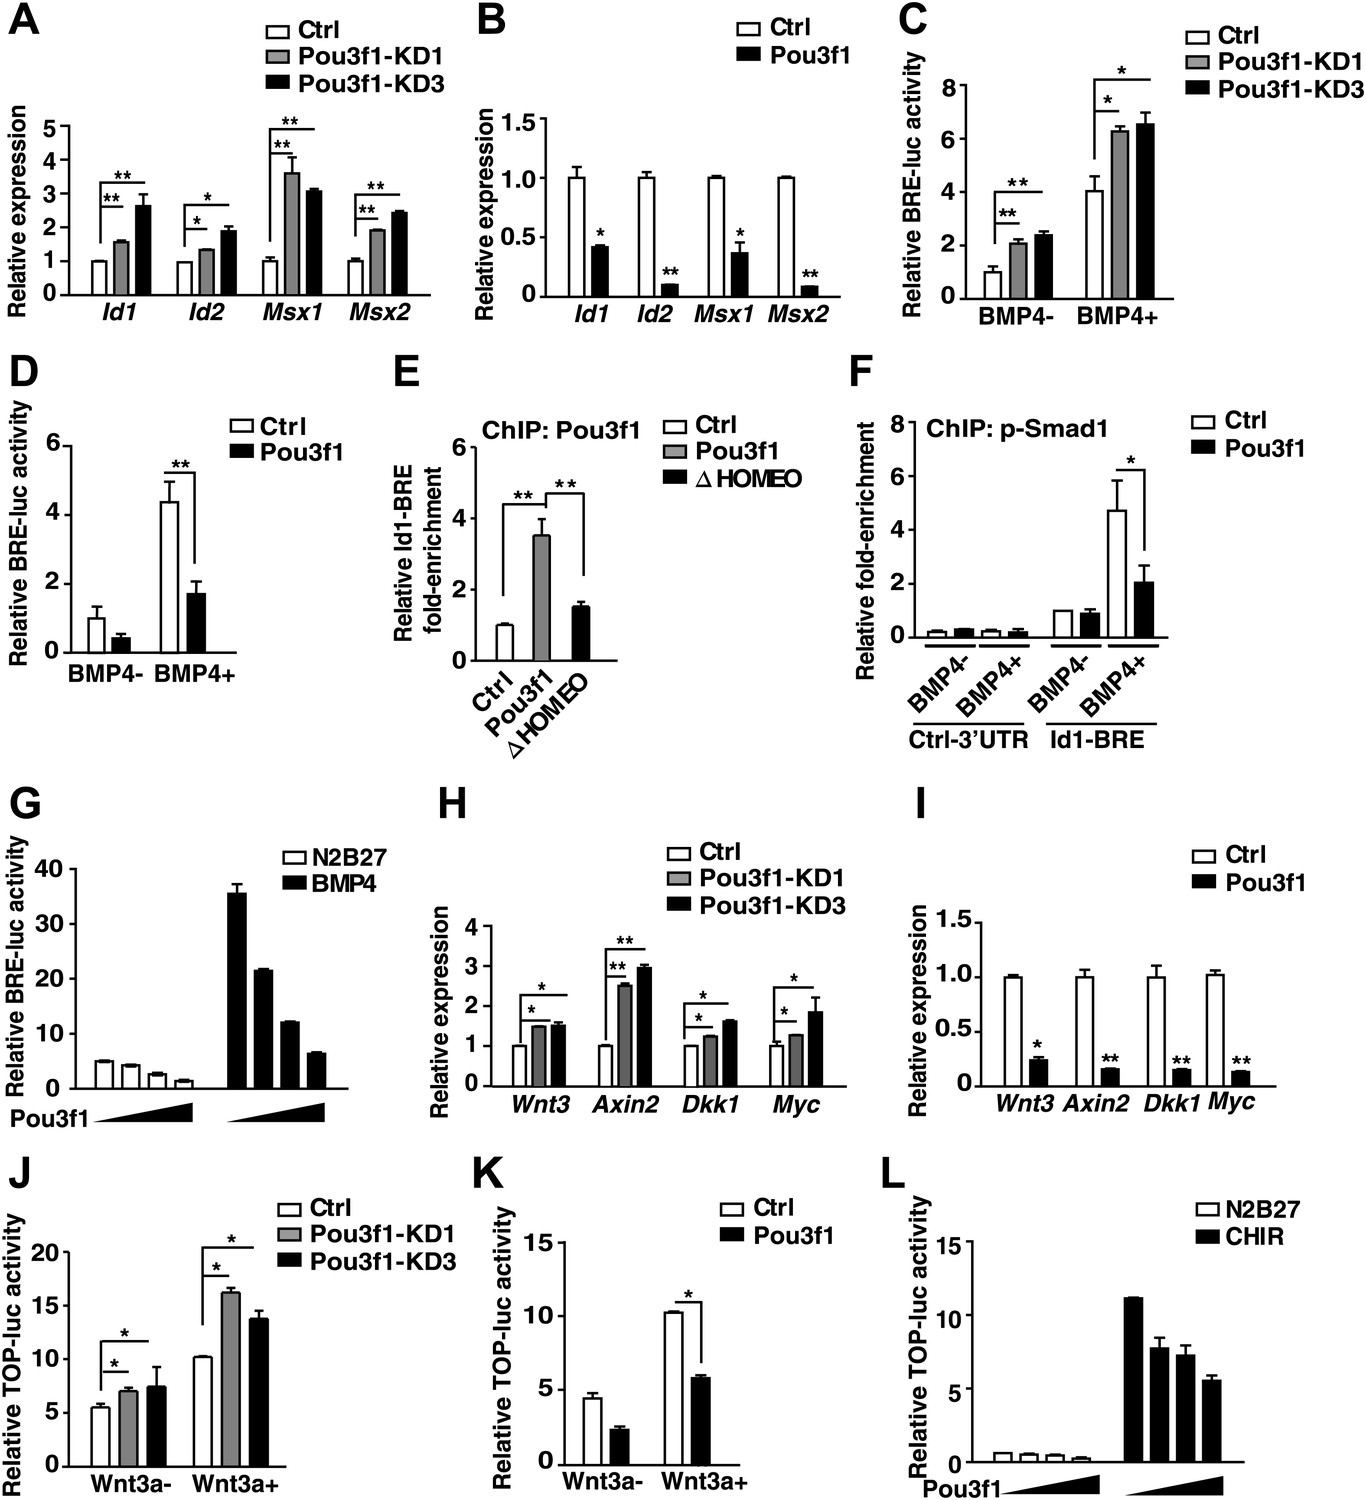
Pou3f1 represses BMP and Wnt signaling at the transcriptional level.
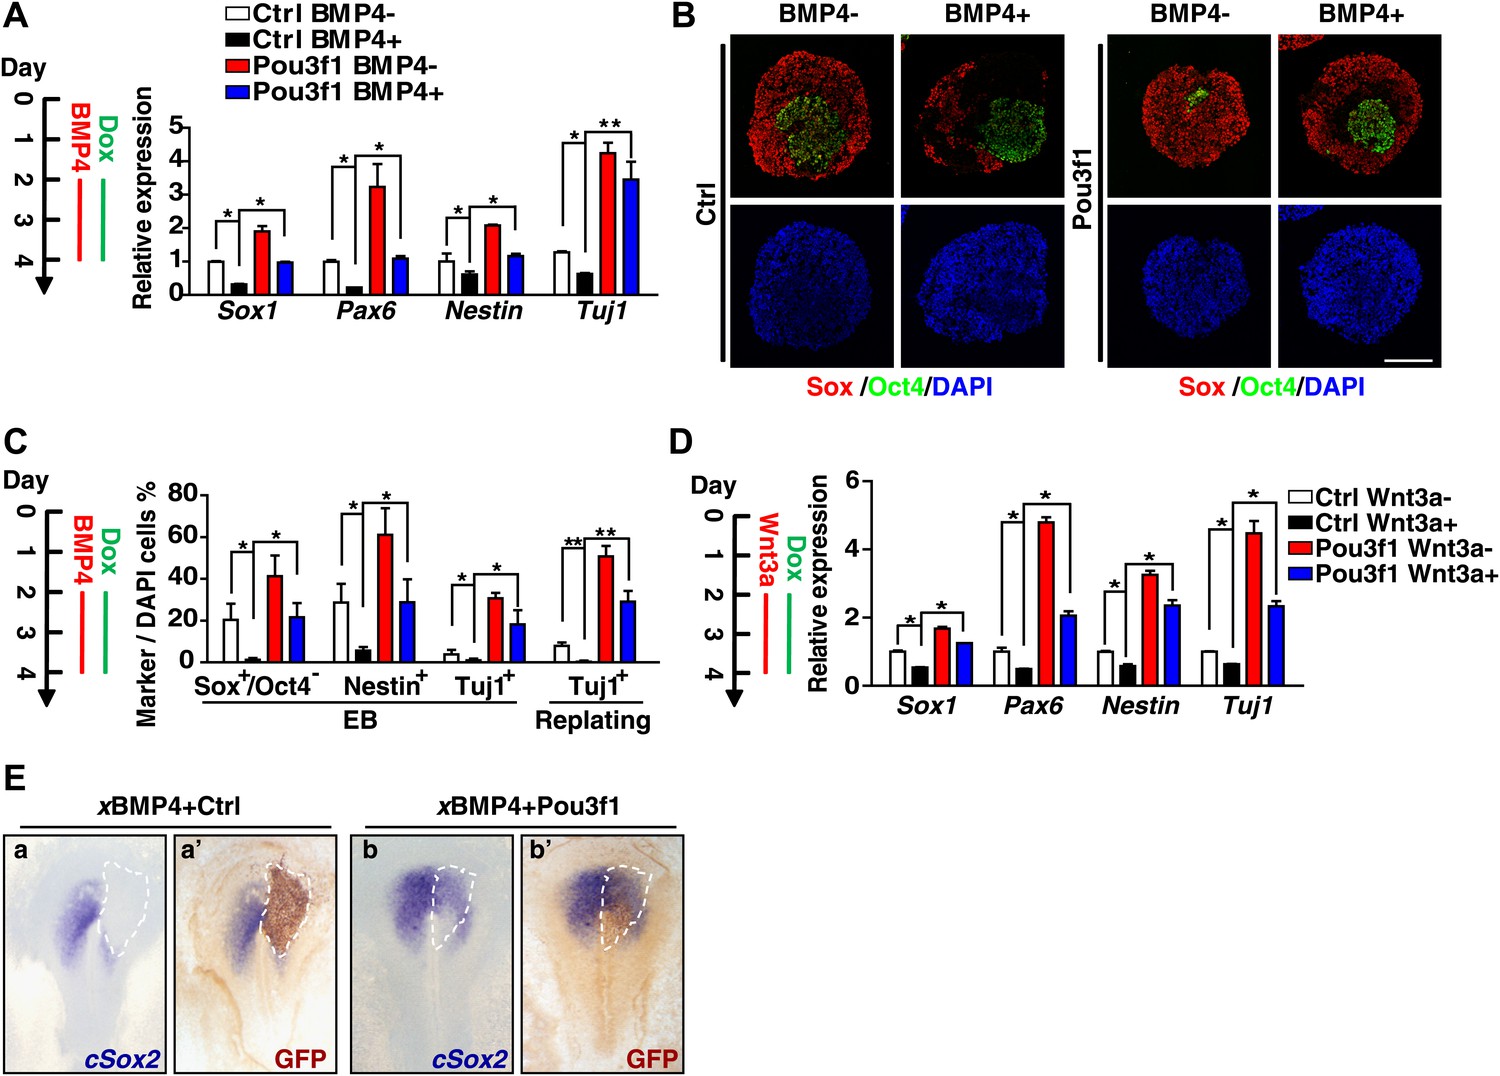
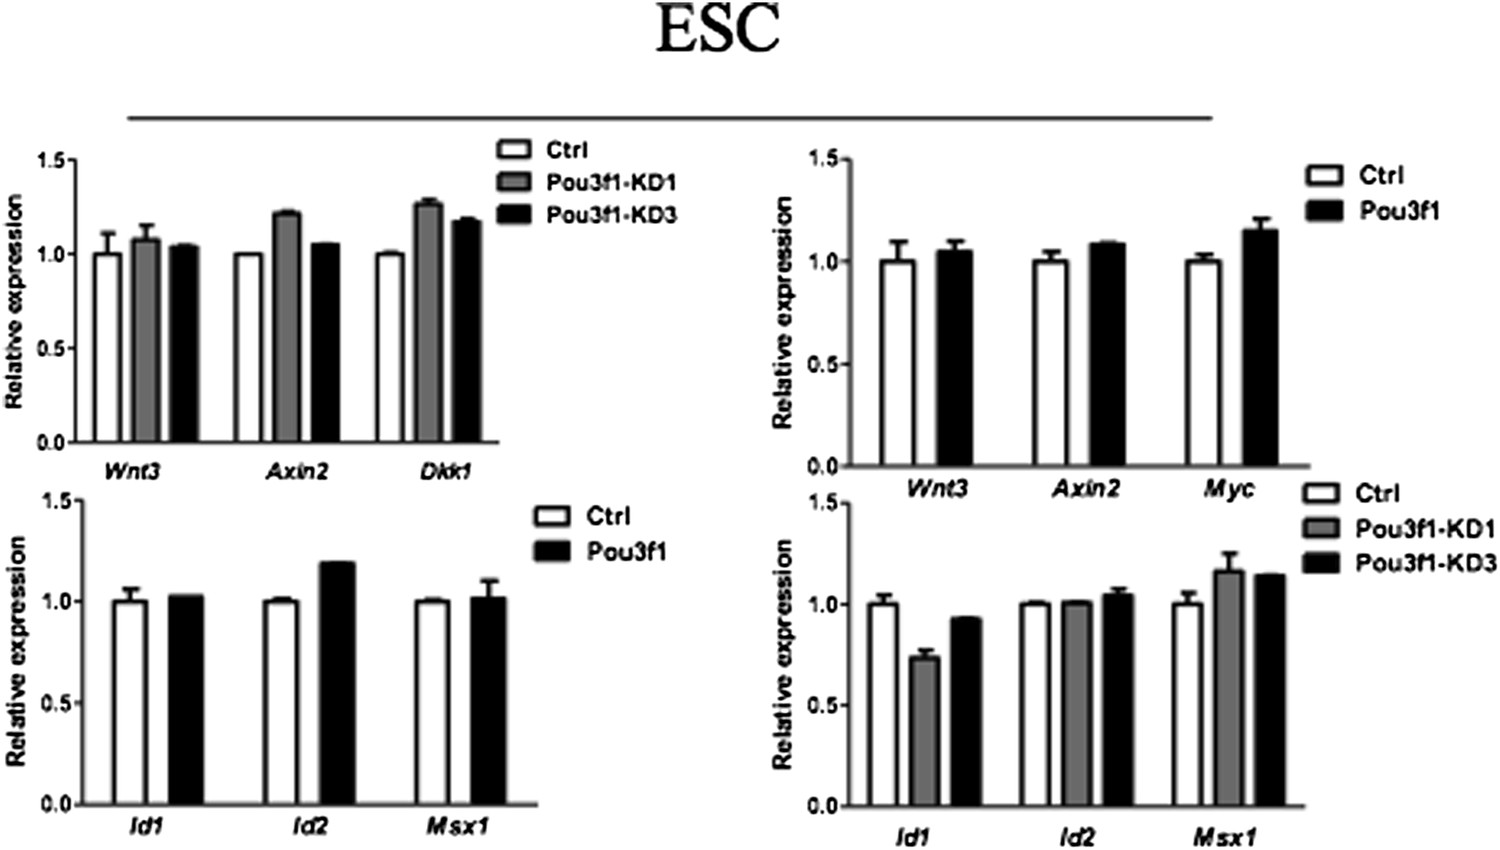
(A) Expression levels of BMP signaling target genes in control and Pou3f1-knockdown ESCs differentiated in serum-free medium. (B) Expression levels of BMP signaling target genes in control and Pou3f1-overexpressing ESCs in unbiased differentiation. (C) Luciferase assays using BRE-luc in control and Pou3f1-shRNA vector-transfected ESCs with or without BMP4 treatment in N2B27 medium. (D) Luciferase assays using BRE-luc in control and Pou3f1-expressing vector-transfected ESCs with or without BMP4 treatment in N2B27 medium. (E) Pou3f1 ChIP assays in control, Pou3f1-full length, or in Pou3f1-ΔHOMEO lentivirus-transfected P19 cells. Pou3f1 enrichment at the Id1-BRE was normalized to the Id1 3′ UTR region. (F) pSmad1 ChIP assay in control and Pou3f1-full length lentivirus-transfected P19 cells with or without BMP4 treatment. A pSmad1/5/8-specific antibody was used in the assay. pSmad1 enrichment at the Id1-BRE and control 3′ UTR region were analyzed. (G) Dose-dependent inhibitory effect of Pou3f1 on the BRE-luc reporter activities. P19 cells were transfected with increasing amounts of Pou3f1-expressing vector and treated with or without BMP4 in N2B27 medium. (H) Expression levels of Wnt signaling target genes in control and Pou3f1-knockdown ESCs differentiated in serum-free medium. (I) Expression levels of Wnt signaling target genes in control and Pou3f1-overexpressing ESCs in unbiased differentiation. (J) Luciferase assays using TOPflash in control and Pou3f1-shRNA vector-transfected ESCs with or without stimulation of Wnt3a in N2B27 medium. (K) Luciferase assays using TOPflash in control and Pou3f1-expressing vector-transfected ESCs with or without stimulation of Wnt3a in N2B27 medium. (L) Dose-dependent inhibitory effect of Pou3f1 on the TOPflash luciferase reporter activities. P19 cells were transfected with increasing amounts of Pou3f1-expressing vector and treated with or without CHIR99021 in N2B27 medium. The values represent the mean ± SD. (*p<0.05; **p<0.01).
Figure 6—figure supplement 1
Pou3f1 interferes with BMP and Wnt signaling pathways at the transcriptional level.
(A) In situ hybridization of cId1 expression (blue) in chick embryos that were electroporated with IRES-GFP (control vector, a and a′) or with Pou3f1-IRES-GFP (b and b′). GFP expression (brown) was detected in a′ and b′ by immunohistochemical assay. (B) Luciferase assays using BRE-luc in P19 cells that were transfected with control, Pou3f1-full length or with each of the Pou3f1-deletion mutant vectors shown in Figure 5—figure supplement 1 with or without BMP4 stimulation in N2B27 medium. (C) Luciferase assays using TOPflash-luc in P19 cells that were transfected with control, Pou3f1-full length expression or with each Pou3f1-deletion mutant vector shown in Figure 5—figure supplement 1 with or without Wnt3a stimulation in N2B27 medium. The values represent the mean ± SD for B and C.
Figure 7
Pou3f1 alleviates the inhibitory effects of BMP4 and Wnt3a on neural fate commitment.
(A) Inducible Pou3f1-overexpressing ESCs were cultured as EBs in serum-free medium for 4 days with or without BMP4/Dox treatment from day 2 to day 4. Gene expression levels were detected by Q-PCR. (B) Immunocytochemical assays using day 4 EBs described in A. The EBs were stained with Sox (red) and with Oct4 (green). Scale bars, 100 μm. (C) Statistical analysis of results from the immunocytochemical assay of Sox+/Oct4−, Nestin+, and Tuj1+ cells in EBs and of Tuj1+ replated cells. (D) Pou3f1-overexpressing ESCs were cultured as EBs in serum-free medium for 4 days with or without Wnt3a/Dox addition from day 2 to day 4. Gene expression levels were detected by Q-PCR. (E) Pou3f1 partially rescues the inhibitory effects of xBMP4 on cSox2. In situ hybridization of cSox2 (blue) in chick embryos that were co-electroporated with xBMP4 plus IRES-GFP (control vector, a and a′) or Pou3f1-IRES-GFP (b and b′), respectively. GFP expression (brown) was detected in a′ and b′ by immunohistochemistry. The values represent the mean ± SD for A, C, and D. (*p<0.05; **p<0.01).
Author response image 1
Author response image 2
Additional files
-
Supplementary file 1
Primer list for PCR analysis. (A) The PCR primers used to clone Pou3f1 into the lentiviral expression vector pFUGW-IRES-EGFP. (B) Oligo sequences used for Pou3f1 RNAi. (C) Primers used for Real-time Q-PCR analysis. (D) Primers used for ChIP-qPCR.
- https://doi.org/10.7554/eLife.02224.018
Download links
A two-part list of links to download the article, or parts of the article, in various formats.
Downloads (link to download the article as PDF)
Open citations (links to open the citations from this article in various online reference manager services)
Cite this article (links to download the citations from this article in formats compatible with various reference manager tools)
The transcription factor Pou3f1 promotes neural fate commitment via activation of neural lineage genes and inhibition of external signaling pathways
eLife 3:e02224.
https://doi.org/10.7554/eLife.02224


