The transcription factor Pitx2 positions the embryonic axis and regulates twinning
- University College London, United Kingdom
- Universidad Nacional Autónoma de México, Mexico
- University of London, United Kingdom
Figures
Figure 1 with 3 supplements

Microarray screens for upstream regulators of cVg1.
(A) Diagram of the first screen: the posterior marginal zone (PMZ) and anterior marginal zone (AMZ) were dissected from embryos at stage XI–XII; the remaining embryo was then fixed and stained for cVg1 by in situ hybridisation (ISH) to confirm that the explants had been obtained from the correct regions. This was done from 40 embryos for each of three biological replicates, which were then run on microarrays. The diagram is accompanied by an example of an embryo after ISH. All 120 embryos are shown in Figure 1—figure supplement 1. (B) Hierarchical clustering of differentially expressed genes for this experiment, and a plot of where cVg1-like probes (enriched in PMZ) are displayed in red and cVg1-unlike (‘downregulated’) probes shown in green across triplicate samples (A1–A3 for AMZ, P1–P3 for PMZ). The scatter plot relates normalised log2 mean signal intensities and log2 fold changes of probes from both samples (AMZ and PMZ). Probes identified as upregulated in the PMZ with a log2 fold change cut-off of 0.263 (linear fold change 1.2) are displayed in red and those identified as downregulated in the PMZ with the same cut-off are displayed in blue. (C) Diagram of the second screen. An embryo at stage XI–XII was cut in half at a right angle to the future midline; the posterior half was fixed for ISH with cVg1 to confirm the orientation (an example is shown), and the isolated anterior half cultured for 7 hr. At this point, a small explant was dissected from the marginal zone adjacent to the left and right side of the cut, and the remaining anterior half-embryo fixed for ISH with cVg1 (an example is shown). This allowed identification of the ‘cVg1-like’ and ‘cVg1-unlike’ explants, which were then pooled appropriately. This was done for 70 embryos for each of three biological replicates; all 210 posterior and anterior fragments are shown in Figure 1—figure supplement 2 after ISH for cVg1. (D) Hierarchical clustering of the probes expressed differentially in this assay, and corresponding scatter plot; details similar to (B) ≠V1, ≠V2, and ≠V3 correspond to each of the triplicate samples that do not express cVg1 and = V1, =V2, and = V3 correspond to explants that express cVg1. (E) Venn diagrams showing the intersection of upregulated and downregulated probes common to both the PMZ and isolated anterior cut halves. A total of 122 upregulated probes and 78 downregulated probes were found to be common in both experiments using both p value and fold change as the criteria. The complete dataset has been submitted to ArrayExpress where it has been assigned the Accession number E-MTAB-3116.
Figure 1—figure supplement 1
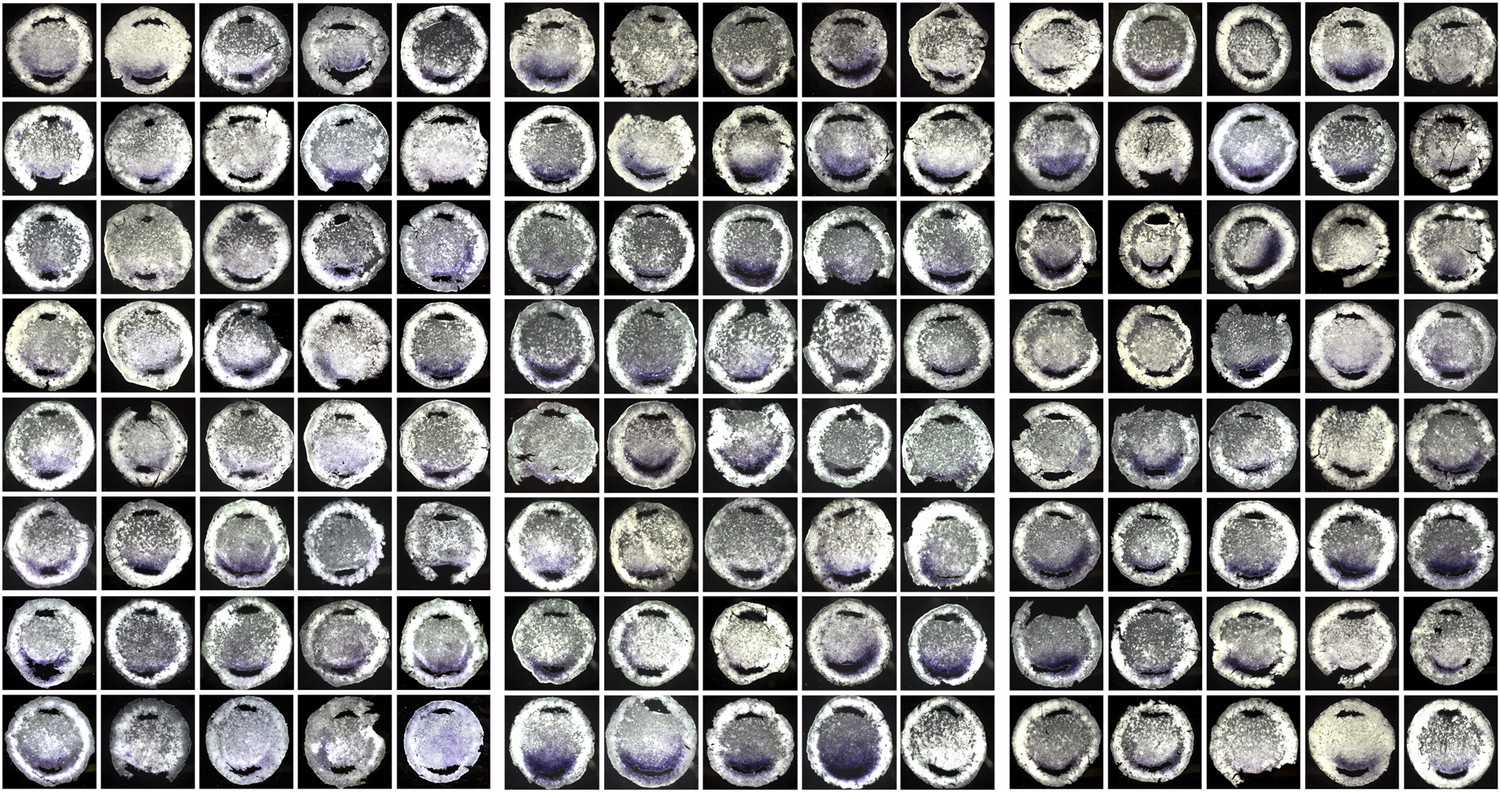
The 120 embryos used for the first screen (AMZ vs PMZ), after excision of the explants and ISH for cVg1.
The three sets of 40 embryos correspond to those used for each Affymetrix microarray.
Figure 1—figure supplement 2
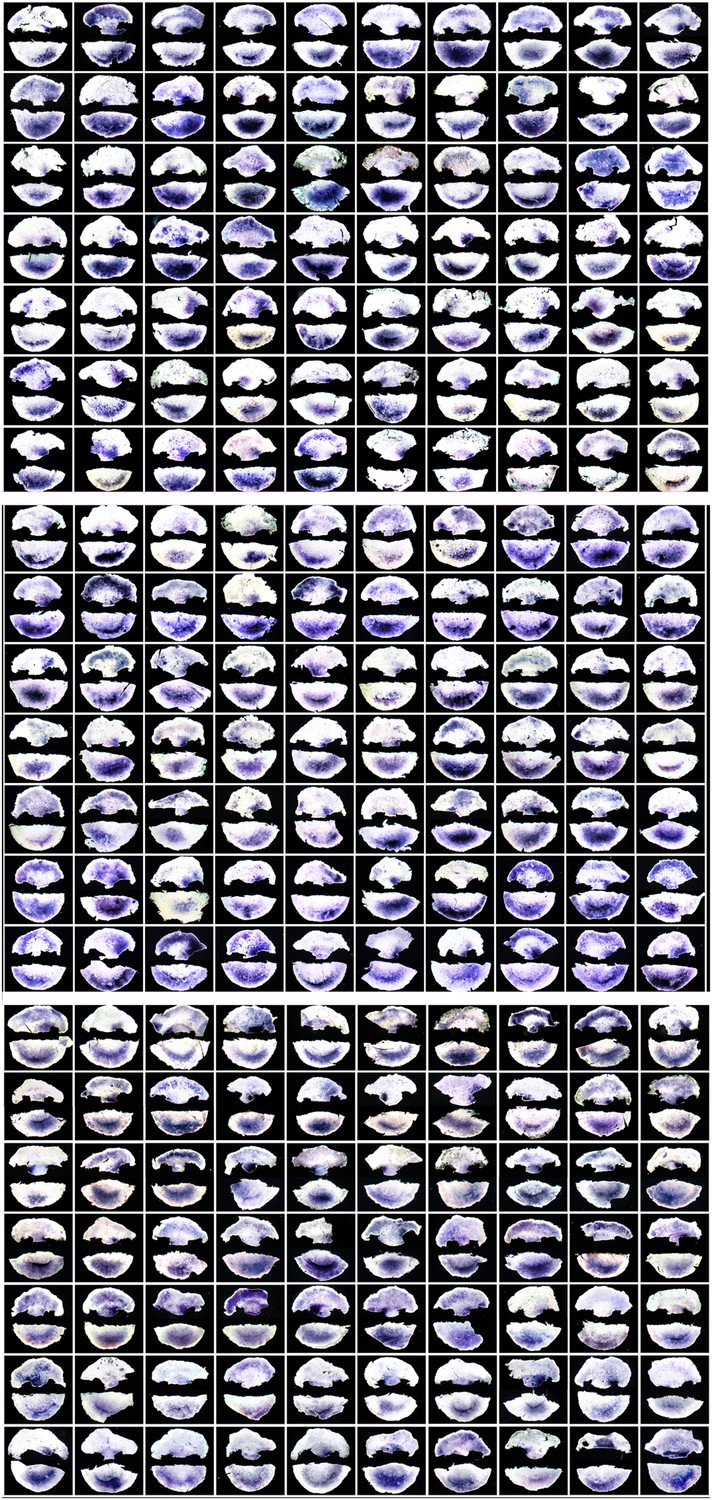
The 210 embryos used for the second screen (lateral marginal zone from isolated anterior half embryos, cultured for 7 hr, then sorted into cVg1-like or cVg1-unlike expression).
The procedure shown in Figure 1C was used. Embryos (stage XI–XII) were bisected at right angles to the midline, the posterior half (shown at the bottom of each panel) fixed immediately and processed by ISH for cVg1 to confirm the orientation of the cut. The anterior half was cultured for 7 hr, a piece of marginal zone adjacent to the cut edge excised from each side, and the remainder of the anterior half fixed and processed for cVg1 expression (upper image in each panel). The pieces corresponding to the side expressing cVg1 were pooled together (‘cVg1-like’), and those on the opposite side pooled with each other (‘cVg1-unlike’). Seventy embryos were used for each microarray, and the experiment performed in triplicate. The sets of embryo fragments shown here correspond to each of the three microarrays.
Figure 1—figure supplement 3
Analysis of microarray datasets for posterior marginal zone (PMZ) and isolated anterior cut halves.
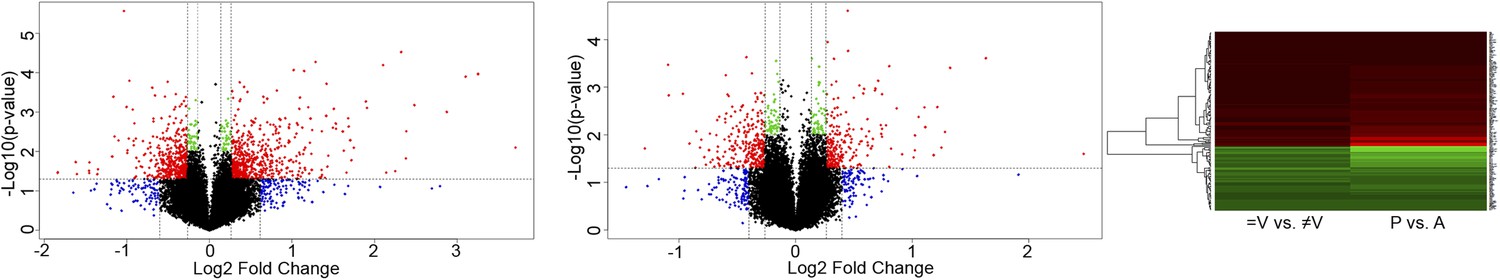
Volcano plots showing the correlation between p values and fold change of probes for each microarray experiment. The left graphs displays gene expression data from whole embryos (PMZ vs AMZ), and the second graph displays data from the anterior cut halves (cVg1-like and -unlike). Probes that pass a p value threshold of 0.05 together with a fold change cut-off of 1.2 (0.263 log2(FC)) are coloured red. Those that do not pass the p value threshold of 0.05 but pass the fold change cut-off of 1.2 (0.263 log2(FC)) are blue. Those that pass the p value threshold of 0.05 but not the fold change cut-off of 1.2 (0.263 log2(FC)) are green. The heat map on the right side of the figure uses hierarchical clustering to compare the 122 upregulated (red) and 78 downregulated (green) probes from the PMZ (P vs A) and the isolated anterior cut halves expressing cVg1 (=V vs ≠V).
Figure 2

Expression of ‘cVg1-like’ and ‘cVg1-unlike’ genes, verified by in situ hybridisation.
Embryos at stage X–XIII (the earliest stage at which differential expression was detected is shown) were processed using in situ hybridisation for genes co-regulated with cVg1 (‘cVg1-like’, Table 1A–B (A–O) and genes expressed at lower level in the cVg1-positive region than in its counterpart (‘cVg1-unlike’, Table 1C–D) (P–W), from the two microarray screens (see Table 1C–D). The expression of 23 genes (15 ‘cVg1-like’ and 8 ‘cVg1-unlike’) is shown here.
Figure 3
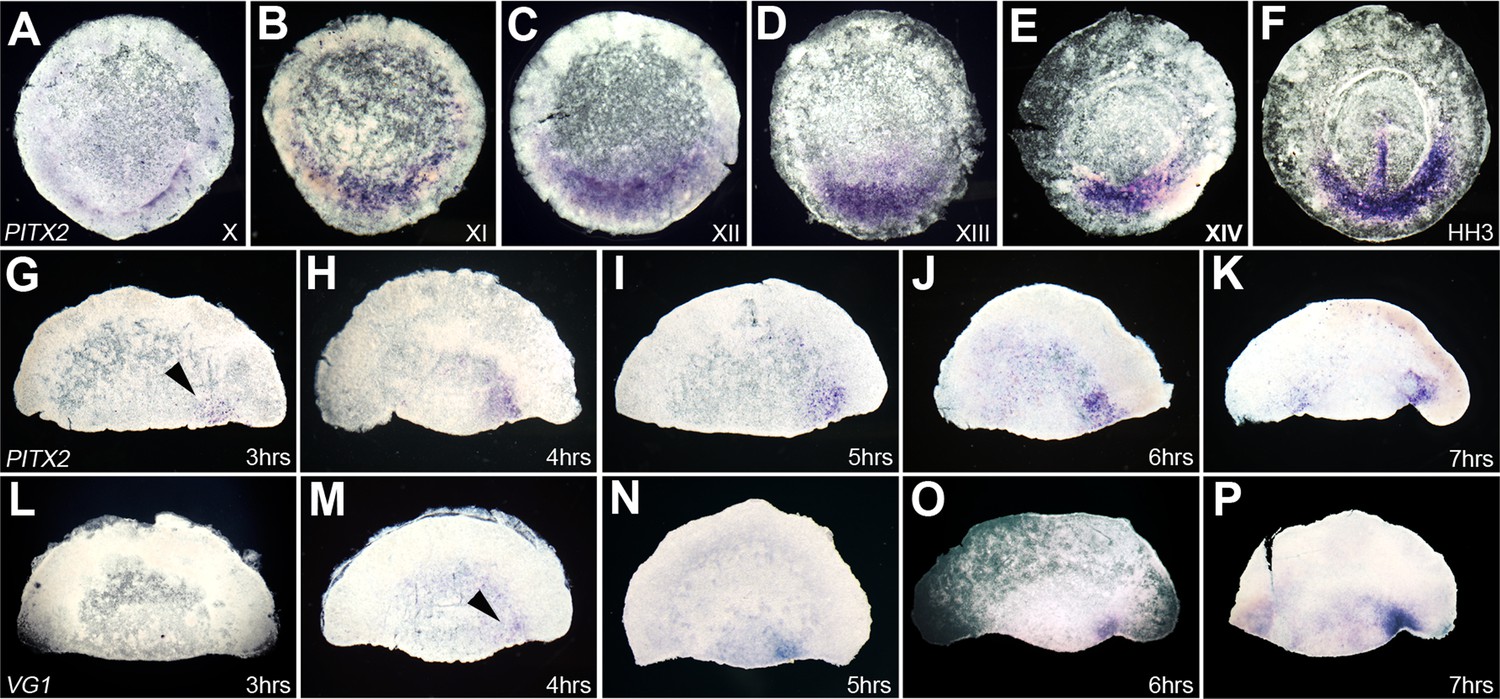
Time-course of expression of Pitx2 in whole embryos and in isolated anterior halves, and comparison with cVg1.
(A–F) Time-course of Pitx2 expression in whole embryos. Expression is restricted to the posterior marginal zone (PMZ) already at the time of laying (stage X); this intensifies over the subsequent stages. At primitive streak stages (HH2–3), expression is seen in the primitive streak itself as well as in the PMZ (F). (G–P) Comparison of the time-course of Pitx2 (G–K) and cVg1 (L–P) upregulation in isolated anterior halves. cVg1 is first detectable 4–5 hr after cutting (M), whereas Pitx2 can be detected an hour earlier (G). Both Pitx2 and cVg1 expression appears randomly on the left or the right corner of the marginal zone adjacent to the cut edge. The series chosen for this figure shows upregulation on the right side of all embryo fragments.
Figure 4 with 1 supplement
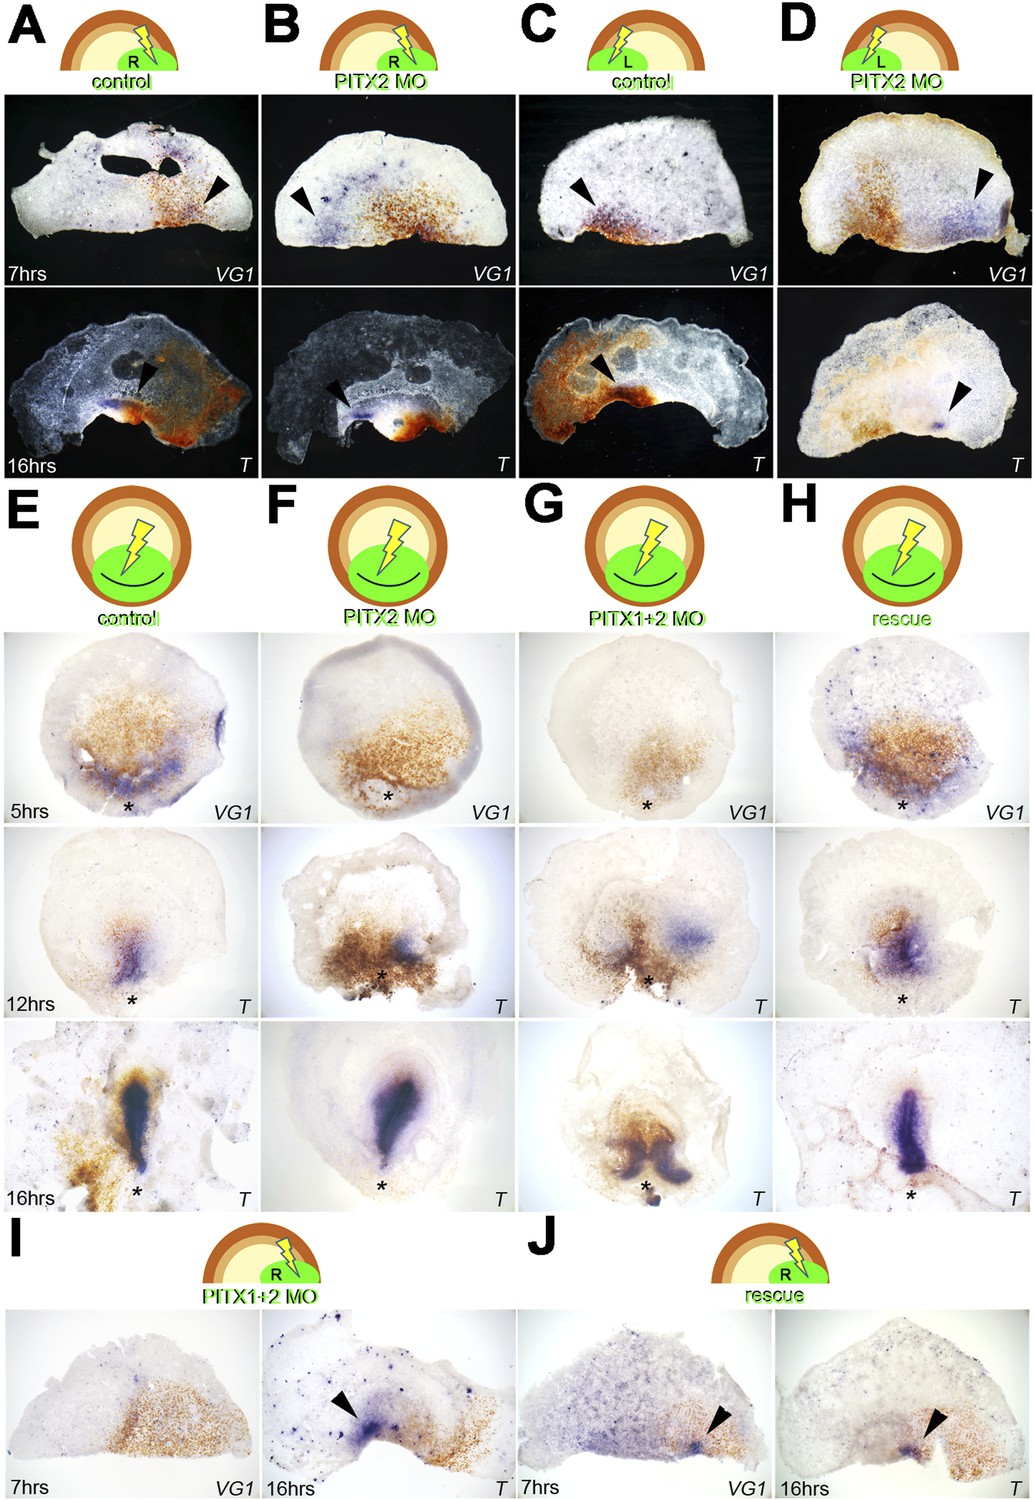
Pitx2 is required for cVg1 expression and for axis formation.
(A–D) A morpholino (MO) targeting Pitx2 applied to one side of the marginal zone of an isolated anterior half shifts axis formation to the opposite marginal zone. (A–B) The experiment done on the right side (A = control-MO, B=Pitx2-MO), (C–D) the equivalent done on the left marginal zone. The top row shows diagrams of the experiment, the middle row shows embryo fragments 7 hr after electroporation/cutting, hybridised for cVg1 (purple) and stained with anti-fluorescein (in the MO, brown), and the lower row shows fragments processed for Brachyury (T) in purple and fluorescein in brown. (E–F) In whole embryos, Pitx2-MO has a transient effect. At 5 hr, cVg1 expression is lost, at 12 hr a primitive streak (T-expressing) is sometimes seen especially at the edge of the electroporated domain, but by 16 hr embryos appear essentially normal. (E) Shows embryos electroporated with control-MO, F are embryos transfected with Pitx2-MO. (G–H). Embryos electroporated with MOs targeting both Pitx2 and Pitx1 do not recover: at 5 hr, no cVg1 is seen; at 12–16 hr there is a high proportion of embryos with either no streak or two T-expressing streaks arising from outside the MO-electroporated domain (as shown in G). This effect can be rescued by co-electroporation of Pitx2 with the mixture of Pitx1-MO/Pitx2-MO (H). (I–J) Likewise, in isolated anterior half-embryos, the effects of electroporation of the Pitx1-MO/Pitx2-MO combination (I) can be rescued by co-electroporation with Pitx2 alone (J): cVg1 expression is now seen on the electroporated side. Arrowheads point to sites of expression.
-
Figure 4—source data 1
Numbers of embryos displaying different types of results in the Pitx loss-of-function experiments illustrated in the main Figure.
Each type of experiment is summarised in a separate sub-table, where each row refers to a particular column (A–J) and row (first, second, and third) of panels in Figure 4. The table columns show each type of result obtained: ‘Vg1 R’ refers to embryos showing cVg1 expression on the right side, ‘streak L’ when there is a Brachyury-expressing primitive streak on the left, ‘streak L/R’ when there are two streaks (one arising from each side), etc.
- https://doi.org/10.7554/eLife.03743.014
Figure 4—figure supplement 1

Pitx1 is expressed posteriorly in normal embryos, and upregulated in Pitx2 morphants.
The upper row of images show embryos at stages X, XI and XII processed for in situ hybridisation for Pitx1. The left lower embryo shows upregulation of Pitx1 (blue), 5 hr after electroporation of Pitx2-MO (brown from anti-fluorescein staining). The right lower image shows lack of effect of similar electroporation of a control-MO.
Figure 5 with 1 supplement
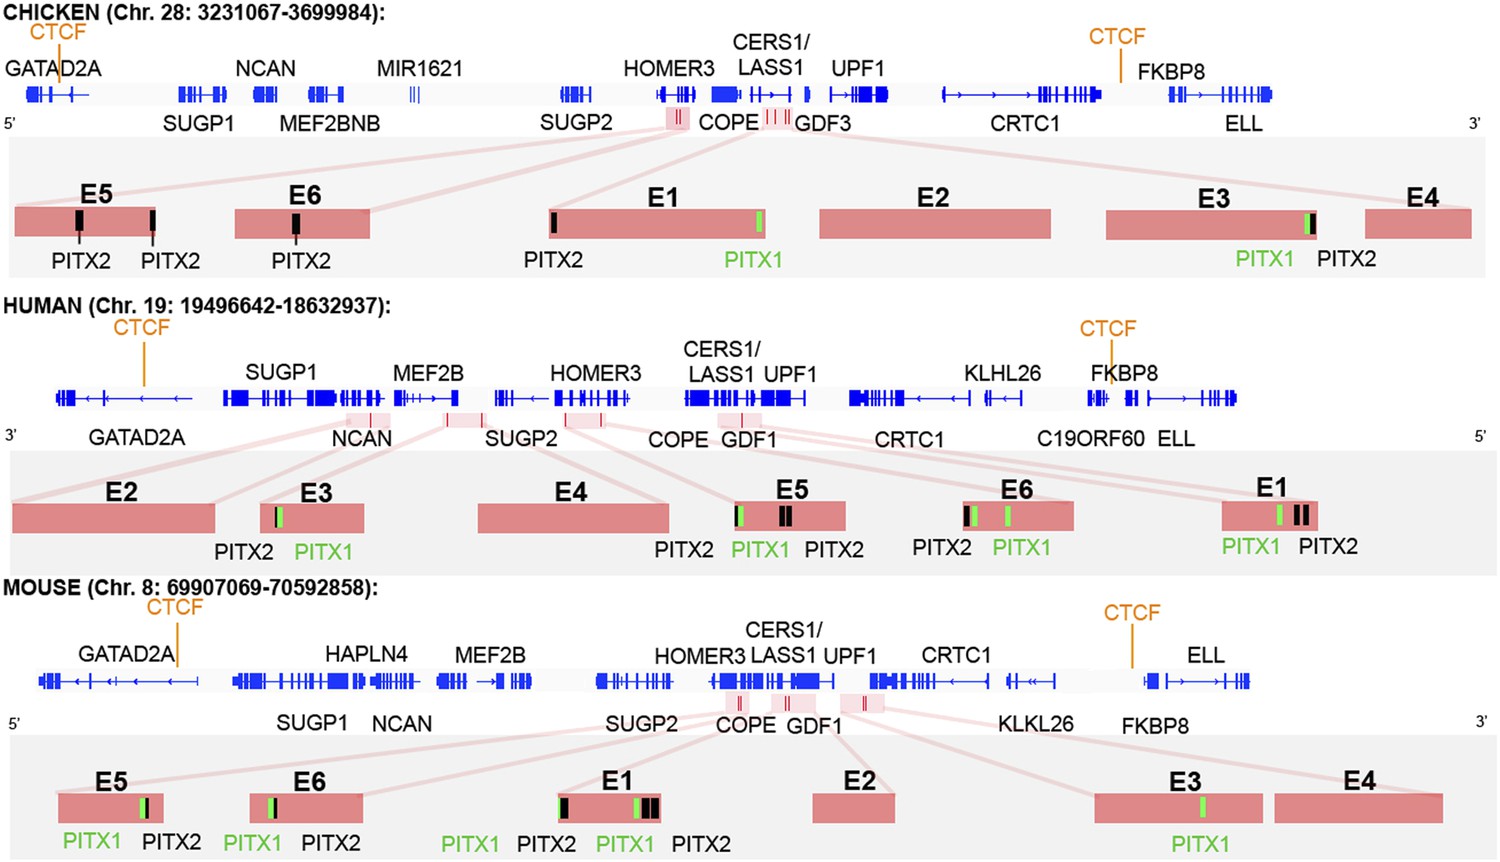
CTCF insulator analysis, enhancer identification and synteny of the cVg1 locus.
The chicken cVg1 locus with computationally predicted conserved CTCF-binding sites in chick, human, and mouse is shown (genes represented in blue). This putative insulator region lies ∼200 kB upstream and ∼100 kB downstream of cVg1/GDF3 and harbours other genes such as CERS1/Lass1, COPE, DDX49 and HOMER3 upstream and UPF1 downstream of cVg1. Six putative enhancer regions (E1–E6), predicted using DREiVe, are displayed in pink. In chick, E1 (galGal4 genomic coordinates: chr28:3502783-3504834) and E2 (chr28:3504993-3508041) lie in the first intron of the bicistronic CERS1/Lass1 gene. E3 (chr28:3510154-3511032) and E4 (chr28:3,511,413-3,511,725) lie in intron 4 of CERS1/Lass1 and E5 (chr28:3471200-3471520) and E6 (chr28:3,471,946-3,472,230) respectively lie in introns 1 and 2 of HOMER3. E1 and E3 each contain conserved Pitx1 (black) and Pitx2 (green) binding sites. E2 and E4 do not contain any Pitx sites and E5 and E6 contain Pitx2-binding sites but no Pitx1-binding sites. The orthologous regions of human (chromosome 19) and mouse (chromosome 8) genomes are also shown. Note that the corresponding human region has been inverted, and that although all six elements are found within it, these appear in different order and are associated with different introns and intergenic regions than in chick and mouse.
Figure 5—figure supplement 1
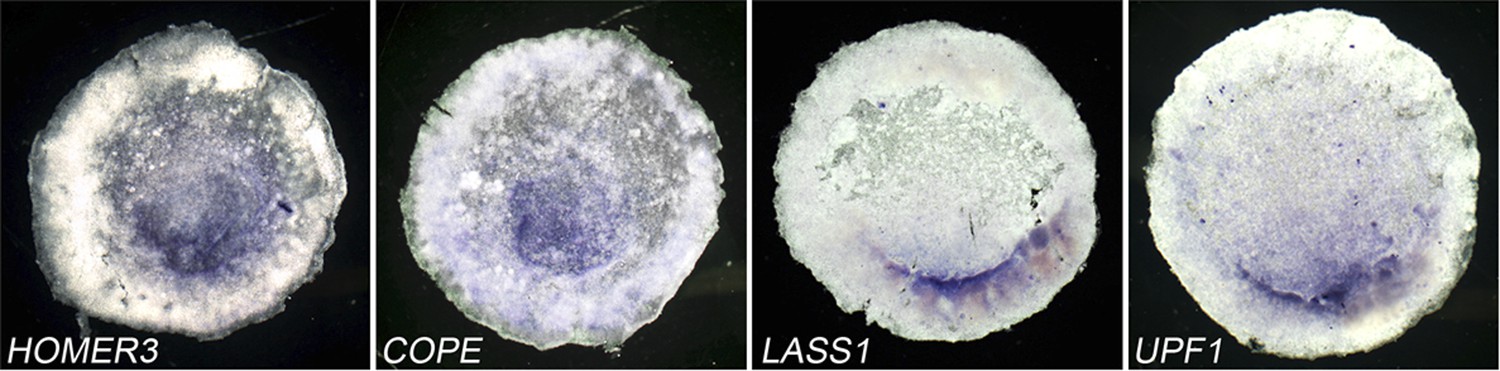
Expression of genes adjacent to cVg1/GDF3 on chick chromosome 28.
Expression of Lass1/CERS1, HOMER3, COPE and UPF1 is shown. All are expressed posteriorly although the patterns are not quite identical to each other.
Figure 6
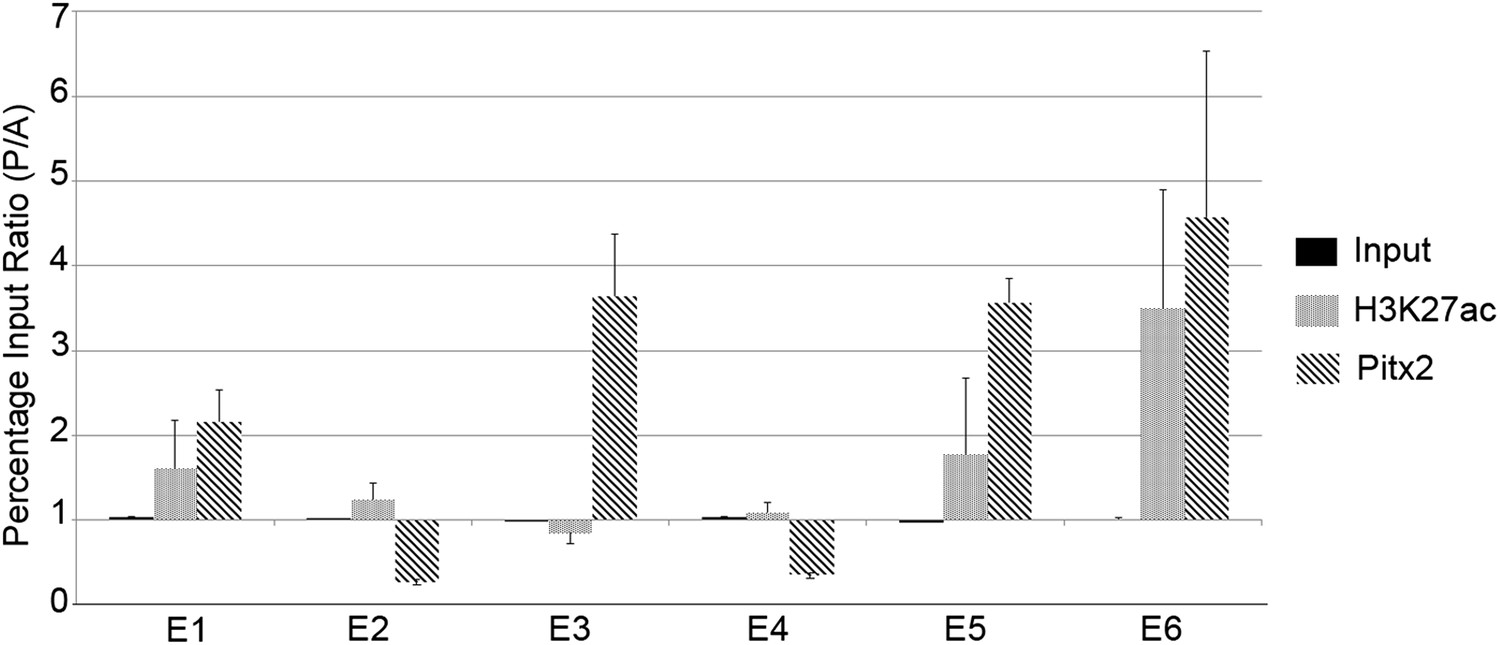
Chromatin immunoprecipitation to test for active histone marks and Pitx2 binding to predicted enhancers.
Relative immunoprecipitation around each of the putative six enhancers by an antibody to Pitx2 (diagonal hatching) or an antibody to acetyl-lysine-27 of Histone-H3 (grey shading), expressed as a ratio of the amount precipitated from posterior and anterior marginal zone (PMZ and AMZ) chromatin. Primers were used to target each of the putative enhancers and precipitated chromatin measured by the quantitative polymerase chain reaction (qPCR). Each data bar represents the average of at least three true biological replicates and the error bars indicate standard error of the mean. Amplification from input DNA from each of the same samples is also shown (solid black shading). Note that enhancers that contain Pitx2-binding sites (E1, E3, E5, and E6) are precipitated much more strongly from the PMZ than the AMZ.
Figure 7 with 1 supplement
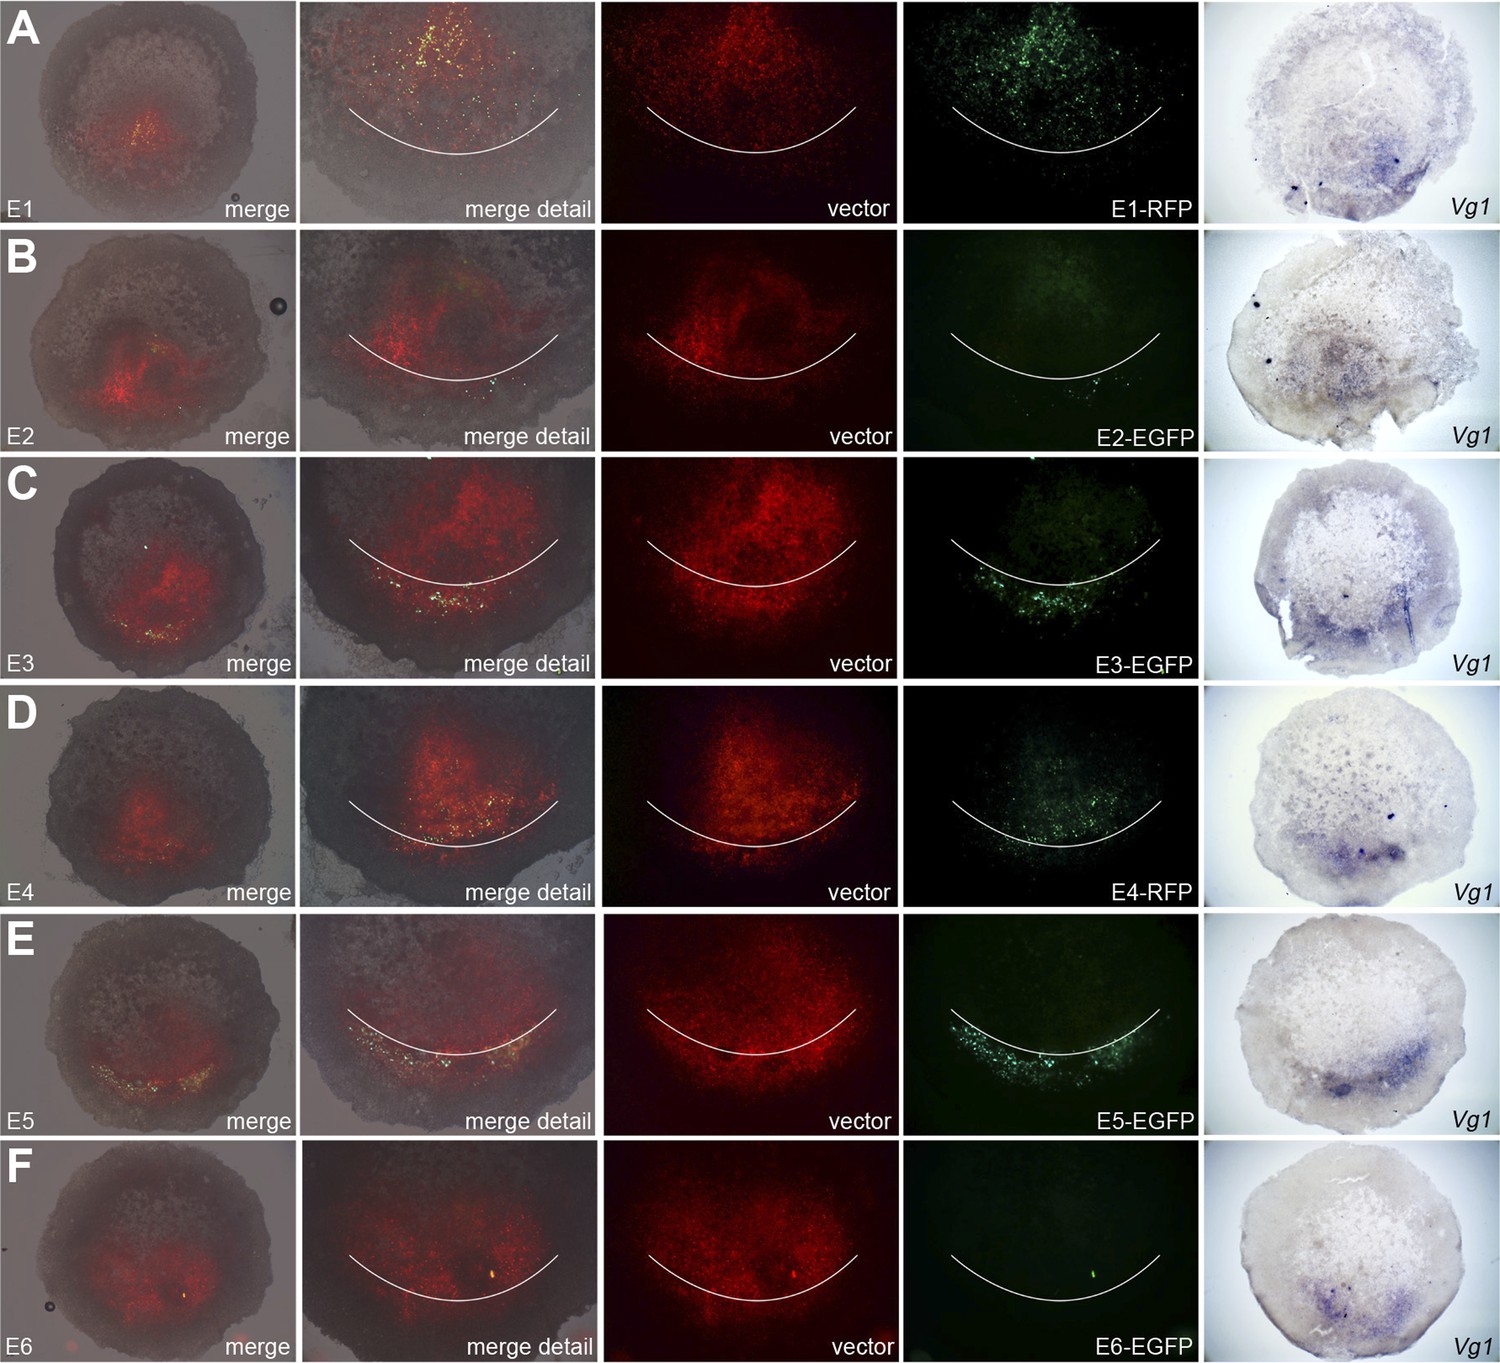
Enhancers E3 and E5 drive expression in the posterior marginal zone of whole embryos.
Embryos were electroporated with a construct containing a candidate enhancer (E1–E6), a minimal promoter (TK) and a fluorescent reporter (GFP or RFP), together with a ubiquitous marker (pCAβ-EGFP or DS-RedExpress) to reveal the electroporated area. After 5–9 hr culture the embryos were observed by fluorescence (first 4 columns) and then fixed and processed to reveal cVg1 expression by in situ hybridisation (last column). The position of Koller's sickle is marked with a curved white line. Enhancers E3 and E5 faithfully recapitulate cVg1 expression in the posterior marginal zone (PMZ), whereas E1 drives expression inside the embryo (but not in the PMZ) and the remaining enhancers show little or no detectable activity. In all cases, the electroporated area appears red and the activity of the specific enhancer construct in green.
Figure 7—figure supplement 1
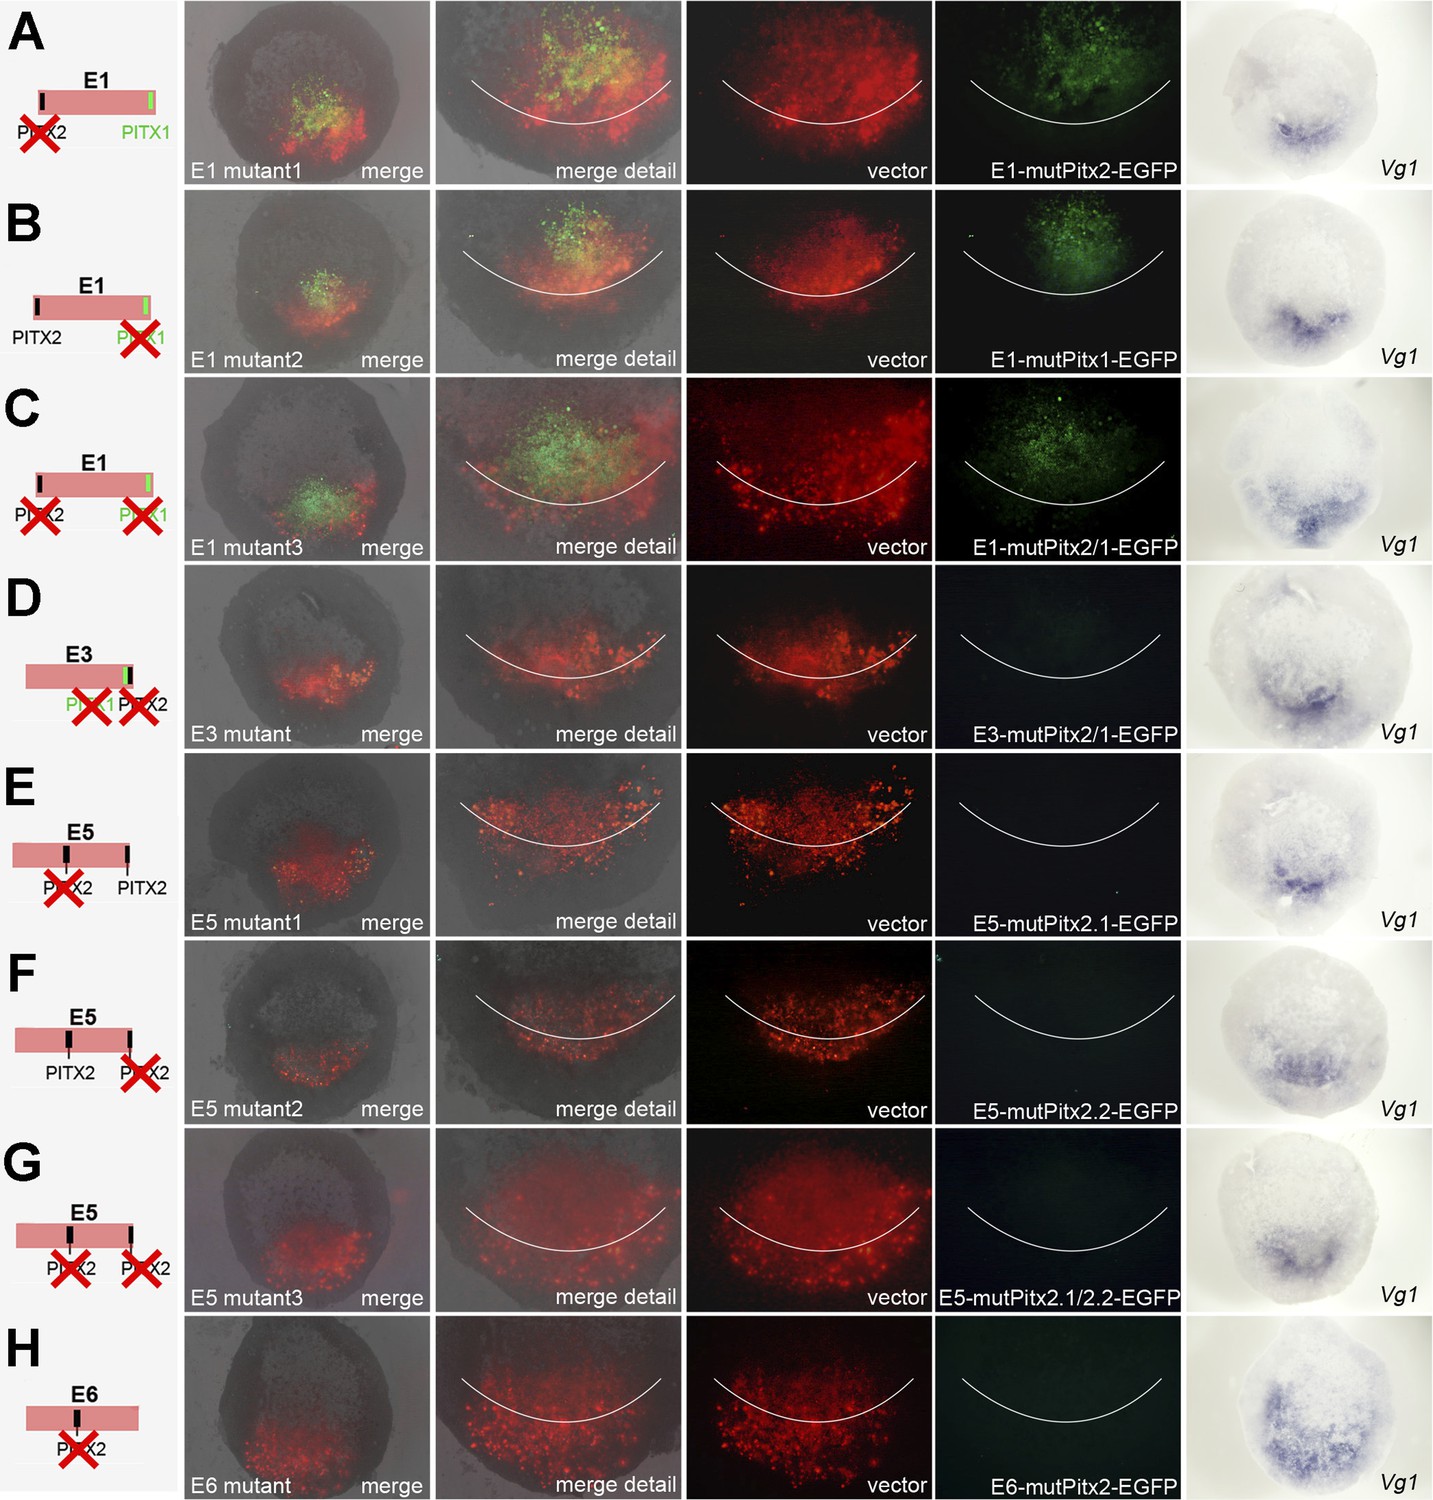
Effects of mutations in Pitx-binding sites on activity of cVg1 enhancers in whole embryos.
Each of the enhancers containing Pitx1- or Pitx2-binding sites was mutated either singly or, for those enhancers containing more than one discrete site, both together. The mutation is shown diagrammatically on the left column. In columns 2–5, the area electroporated (DS-RedExpress reporter) appears in red and expression driven by the specific enhancer construct in green. The last column shows cVg1 expression revealed by in situ hybridisation in the same embryos. Enhancer E1 is unaffected by mutation of either Pitx1- or Pitx2-binding sites, and continues to be active inside the embryo but not in the PMZ. E6 is also unchanged by mutation of the Pitx2-binding site (no expression is seen from the intact reporter, see main Figure 7). The activity of enhancers and E3, E5 is destroyed by mutation of any of the Pitx1/2-binding sites.
Figure 8 with 1 supplement
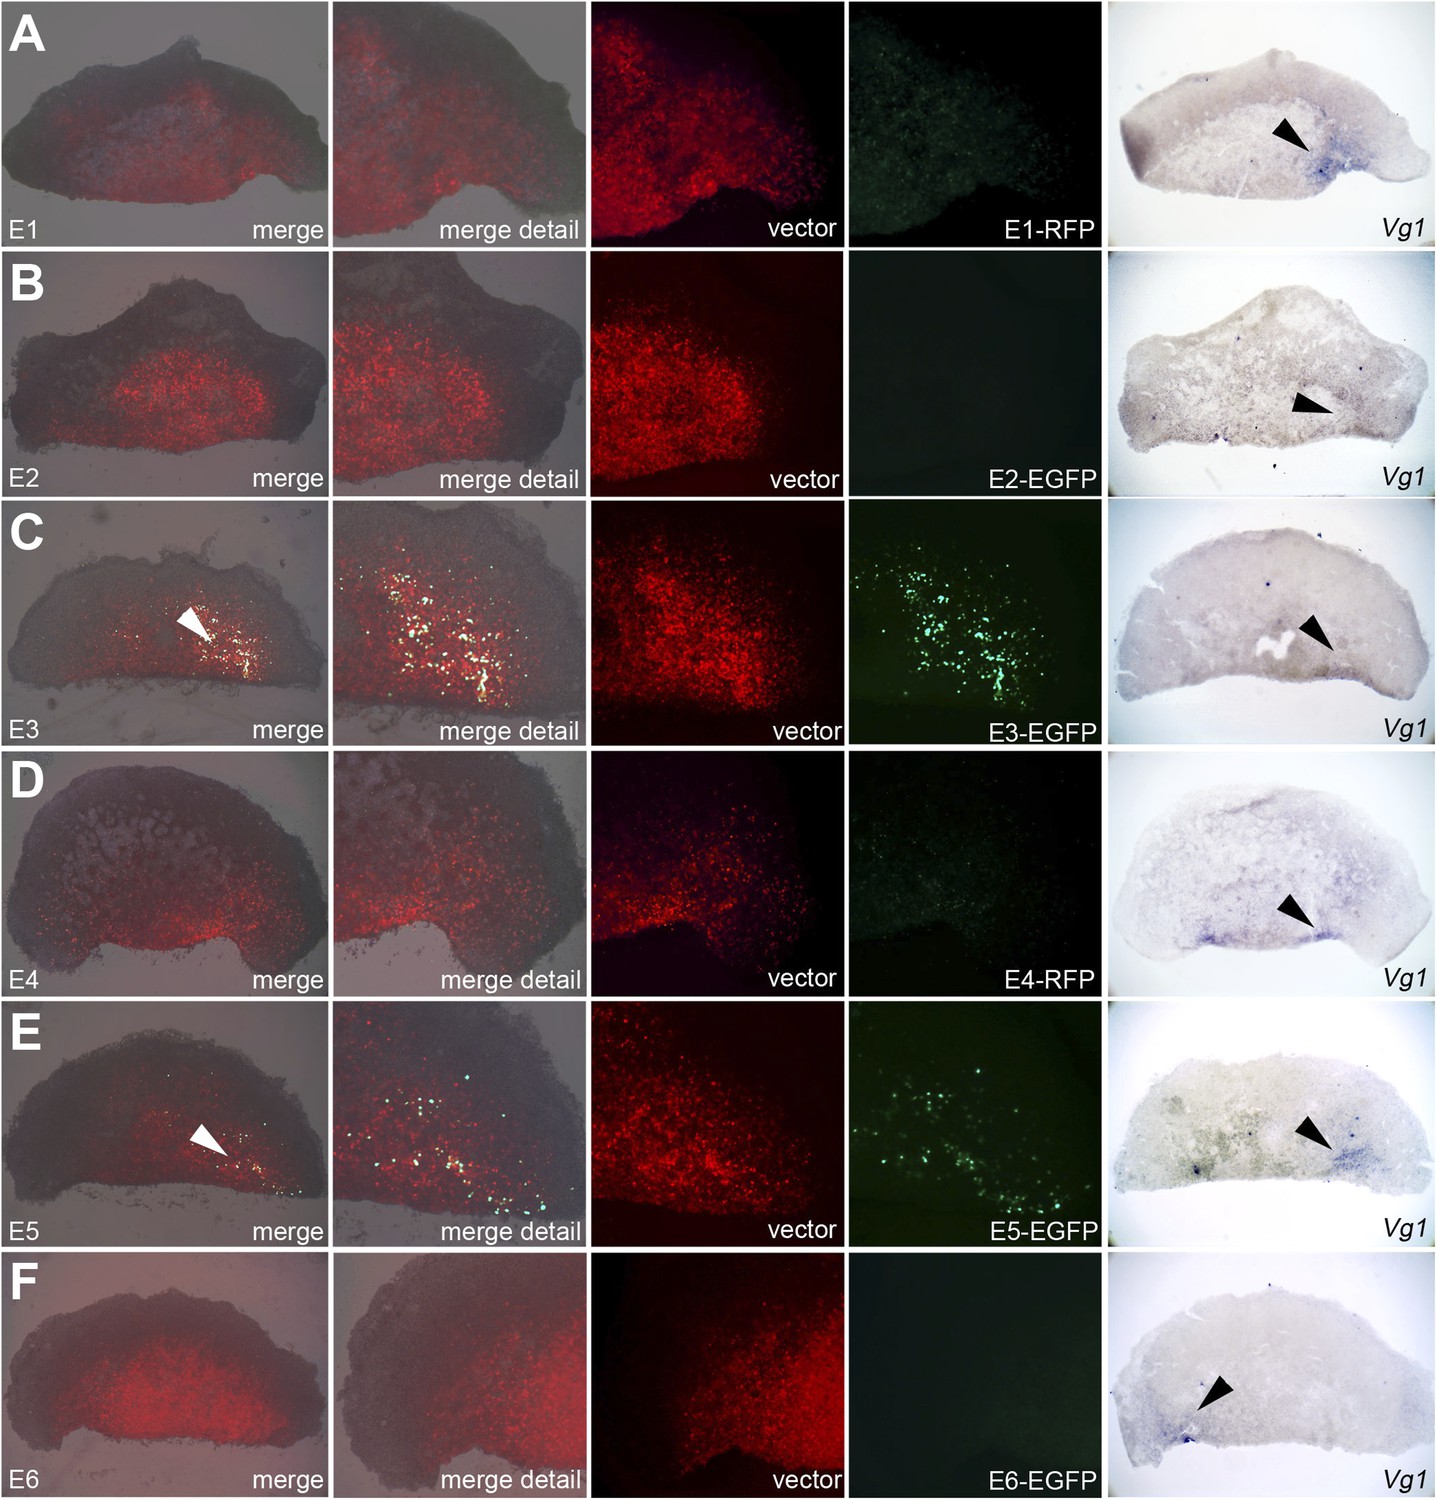
Enhancers E3 and E5 drive expression in the cVg1-expressing corner of the marginal zone at the cut edge of isolated anterior half-embryos.
Embryos were electroporated with the same vectors as described in Figure 7, then bisected. The anterior half was then cultured for 5–7 hr and viewed under fluorescence (first 4 columns), then fixed and processed for cVg1 expression (last column). Enhancers E3 and E5 drive expression of the reporter at the cVg1-expressing edge of isolated anterior half-embryos. Note that unlike what is found in whole embryos, Enhancer E1 does not appear to drive expression in the area pellucida of the isolated anterior half.
Figure 8—figure supplement 1
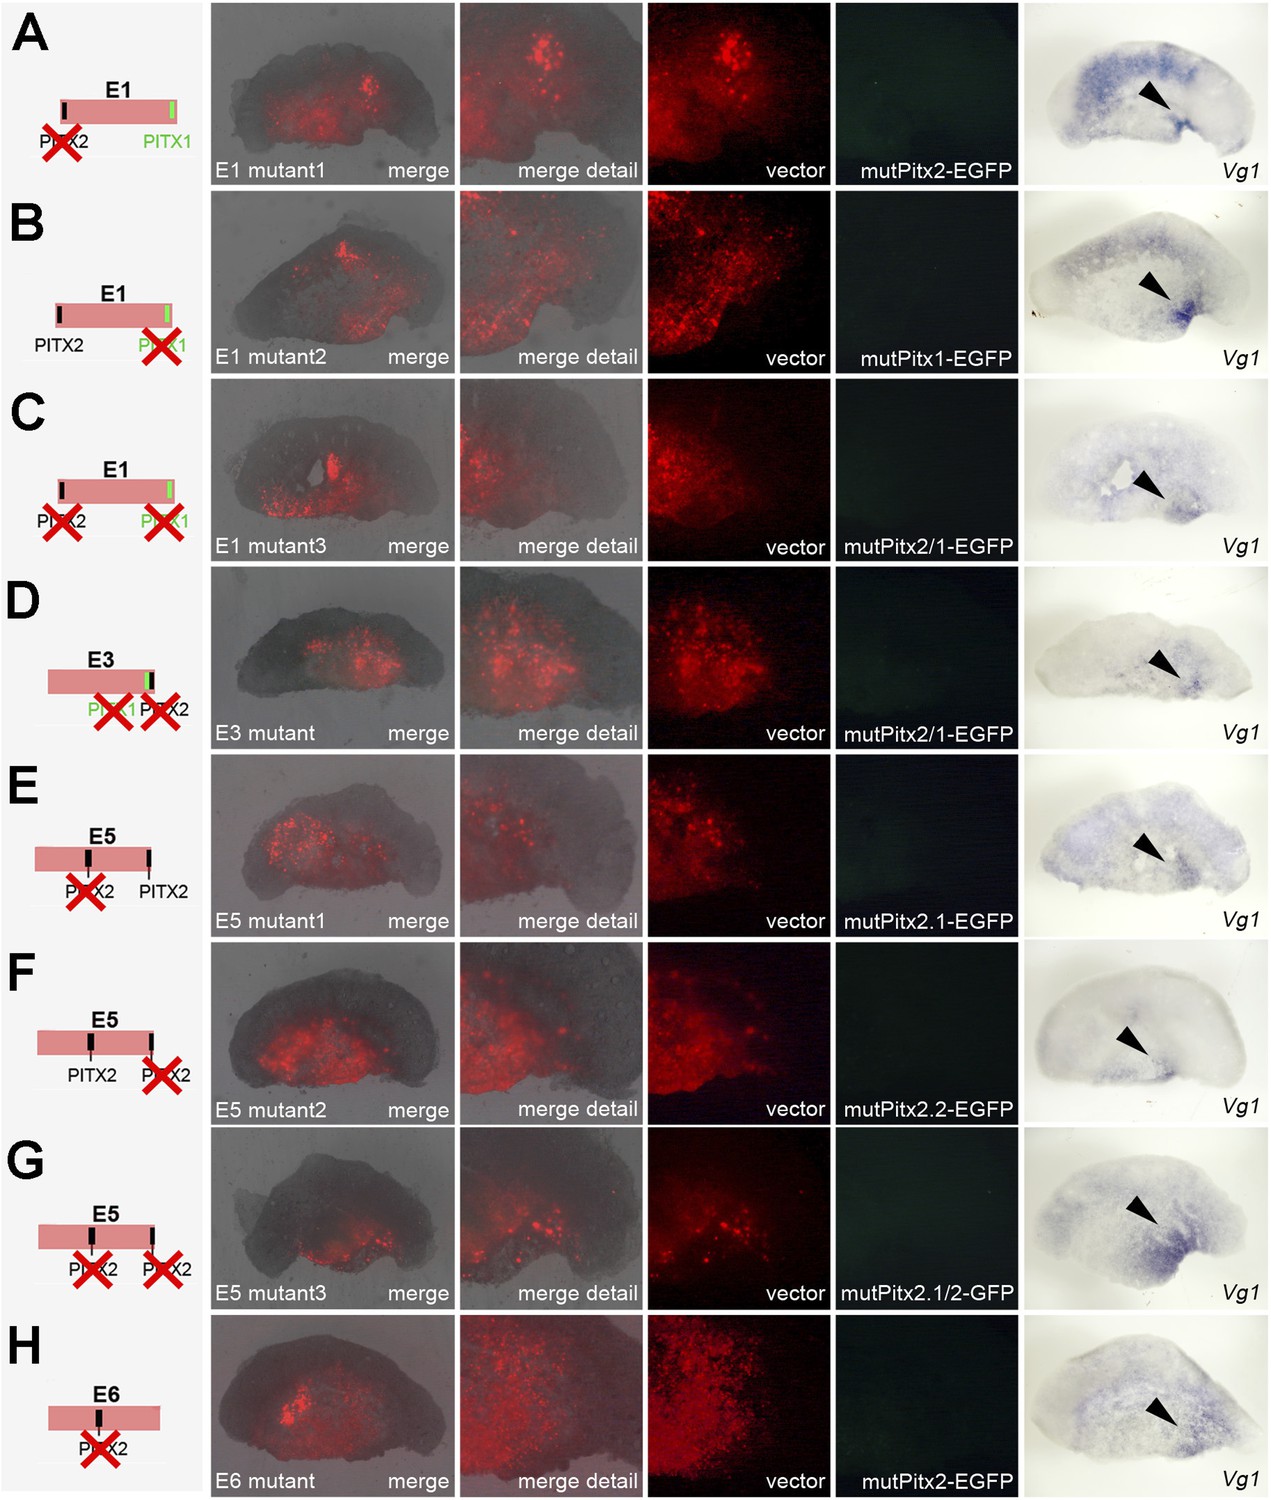
Effects of mutations in Pitx-binding sites on activity of cVg1 enhancers in isolated anterior halves.
Each of the enhancers containing Pitx1- or Pitx2-binding sites was mutated either singly or, for those enhancers containing more than one discrete site, both together. The mutation is shown diagrammatically on the left column. Details as in Figure 7—figure supplement 1. The specific activity of E3 and E5 is destroyed by mutation of any of the Pitx-binding sites.
Tables
Table 1
Genes identified from the screens, sorted according to their ranking in PMZ>AMZ in whole embryos
| Posterior vs anterior | Anterior half, Vg1-like | ||||||
|---|---|---|---|---|---|---|---|
| Gene symbol | Probe ID | Fold change | p Value | Rank | Fold change | p Value | Rank |
| ADMP | Gga.354.1.S1_at | 1 | 2 | ||||
| PITX2 | Gga.3398.2.S1_a_at | 2 | 8 | ||||
| PITX2 | Gga.3398.1.S1_a_at | 3 | 4 | ||||
| THPO | GgaAffx.21801.1.S1_at | 4 | 7 | ||||
| ST6-GAL2 | Gga.14379.1.S1_at | 5 | 3 | ||||
| T | Gga.3772.1.S1_a_at | 6 | 1 | ||||
| PKDCC | Gga.12157.1.S1_at | 7 | 33 | ||||
| PITX2 | Gga.3398.1.S1_at | 8 | 6 | ||||
| MIXL1 | Gga.426.1.S1_s_at | 9 | 5 | ||||
| n/a | Gga.2705.1.S1_at | 10 | 63 | ||||
| GDF3 | Gga.4324.2.S1_a_at | 11 | 21 | ||||
| PMEPA1 | Gga.6268.1.S1_at | 12 | 12 | ||||
| PMEPA1 | GgaAffx.12721.1.S1_at | 13 | 19 | ||||
| TBX6 | Gga.466.1.S1_at | 14 | 13 | ||||
| FGF8 | Gga.661.1.S1_at | 15 | 22 | ||||
| Ovoinhibitor | Gga.6976.1.S1_at | 16 | 50 | ||||
| ELK3 | Gga.4498.1.S1_s_at | 17 | 43 | ||||
| LITAF | Gga.3383.1.S2_at | 18 | 25 | ||||
| LITAF | Gga.3383.1.S1_at | 19 | 17 | ||||
| n/a | Gga.13092.1.S1_at | 20 | 66 | ||||
-
List of the top 20 common upregulated probes expressed in both the PMZ of whole embryo and isolated anterior cut halves. Entries in red are probes that pass a fold change cut-off of 1.2 as well as a p value cut-off of 0.05; those in blue pass the fold change cut off of 1.2 but not the p value cut-off of 0.05; and those in black pass the p value cut-off but not the fold change. Common genes are ranked according to the fold change of genes expressed in the PMZ (Spearman's rank Rho = 0.72, p = 0.00048).
Table 2
Genes identified from the screens, sorted according to their ranking in cVg1-like > -unlike in isolated anterior halves
| Anterior half, Vg1-like | Posterior vs anterior | ||||||
|---|---|---|---|---|---|---|---|
| Gene symbol | Probe ID | Fold change | p Value | Rank | Fold change | p Value | Rank |
| T | Gga.3772.1.S1_a_at | 1 | 6 | ||||
| ADMP | Gga.354.1.S1_at | 2 | 1 | ||||
| ST6GAL2 | Gga.14379.1.S1_at | 3 | 5 | ||||
| PITX2 | Gga.3398.1.S1_a_at | 4 | 3 | ||||
| MIXL1 | Gga.426.1.S1_s_at | 5 | 9 | ||||
| PITX2 | Gga.3398.1.S1_at | 6 | 8 | ||||
| THPO | GgaAffx.21801.1.S1_at | 7 | 4 | ||||
| PITX2 | Gga.3398.2.S1_a_at | 8 | 2 | ||||
| DENND5B | Gga.16679.1.S1_at | 9 | 27 | ||||
| WNT8A | Gga.886.1.S1_at | 10 | 53 | ||||
| CHRD | Gga.490.1.S1_at | 11 | 30 | ||||
| PMEPA1 | Gga.6268.1.S1_at | 12 | 12 | ||||
| TBX6 | Gga.466.1.S1_at | 13 | 14 | ||||
| HOXB1 | Gga.18352.1.S1_at | 14 | 73 | ||||
| AREGB | GgaAffx.6867.1.S1_at | 15 | 85 | ||||
| SOHO-1 | Gga.770.1.S1_at | 16 | 106 | ||||
| LITAF | Gga.3383.1.S1_at | 17 | 19 | ||||
| MLLT6 | Gga.11449.1.S1_at | 18 | 32 | ||||
| PMEPA1 | GgaAffx.12721.1.S1_at | 19 | 13 | ||||
| FAM19A1 | Gga.11944.2.S1_a_at | 20 | 41 | ||||
-
List of the top 20 common upregulated probes expressed in both the PMZ of whole embryo and isolated anterior cut halves. Entries in red are probes that pass a fold change cut-off of 1.2 as well as a p value cut-off of 0.05; those in blue pass the fold change cut off of 1.2 but not the p value cut-off of 0.05; and those in black pass the p value cut-off but not the fold change. Common genes are ranked according to the fold change of genes in the anterior cut halves (Spearman's rank Rho = 0.73, p = 0.00036).
Table 3
Genes identified from the screens, sorted according to their ranking in AMZ > PMZ in whole embryos
| Posterior vs anterior | Anterior half, Vg1-like | ||||||
|---|---|---|---|---|---|---|---|
| Gene symbol | Probe ID | Fold change | p Value | Rank | Fold change | p Value | Rank |
| LPL | Gga.4248.1.S1_at | 1 | 69 | ||||
| UPK1B | Gga.17532.1.S1_at | 2 | 15 | ||||
| UPK1B | Gga.17532.1.S1_s_at | 3 | 2 | ||||
| SPOCK3 | GgaAffx.6009.1.S1_at | 4 | 24 | ||||
| SLC1A3 | GgaAffx.25896.1.S1_at | 5 | 47 | ||||
| SLC5A1 | Gga.8594.1.S1_at | 6 | 1 | ||||
| BASP1 | Gga.3179.1.S1_at | 7 | −1.170 | 0.0079 | 75 | ||
| ID3 | Gga.4048.1.S1_at | 8 | 34 | ||||
| ATP13A4 | GgaAffx.12270.1.S1_at | 9 | 71 | ||||
| DIO3 | Gga.552.1.S1_at | 10 | 12 | ||||
| UPK1B | Gga.12930.1.S1_at | 11 | 3 | ||||
| COL4A2 | Gga.3104.1.S1_at | 12 | 58 | ||||
| SLC1A3 | GgaAffx.25896.1.S1_s_at | 13 | 60 | ||||
| LRP2 | GgaAffx.23355.1.S1_at | 14 | 55 | ||||
| EFNB2 | Gga.13001.1.S1_s_at | 15 | 42 | ||||
| --- | Gga.15960.1.S1_at | 16 | 29 | ||||
| --- | Gga.18649.1.A1_at | 17 | 43 | ||||
| GABRA1 | Gga.17167.1.S1_at | 18 | 20 | ||||
| GLRA3 | GgaAffx.6806.1.S1_at | 19 | 10 | ||||
| DIO2 | Gga.1819.1.S1_at | 20 | 25 | ||||
-
List of the top 20 downregulated probes common to both the PMZ of whole embryo and isolated anterior cut halves. Entries in red are probes that pass a fold change cut-off of −1.2 as well as a p value cut-off of 0.05; those in blue pass the fold change cut off of −1.2 but not the p value cut-off of 0.05; and those in black pass the p value cut-off but not the fold change cut-off. Common genes are ranked according to the fold change of genes in the PMZ (Spearman's rank Rho = −0.02, p = 0.93).
Table 4
Genes identified from the screens, sorted according to their ranking in Vg1-unlike > Vg1-like in isolated anterior halves
| Anterior half, Vg1-like | Posterior vs anterior | ||||||
|---|---|---|---|---|---|---|---|
| Gene symbol | Probe ID | Fold change | p Value | Rank | Fold change | p Value | Rank |
| SLC5A1 | Gga.8594.1.S1_at | 1 | 6 | ||||
| UPK1B | Gga.17532.1.S1_s_at | 2 | 3 | ||||
| UPK1B | Gga.12930.1.S1_at | 3 | 11 | ||||
| EDNRB | Gga.3306.1.S1_s_at | 4 | 32 | ||||
| FSTL4 | Gga.13574.1.S1_at | 5 | 51 | ||||
| GABARB2 | Gga.17131.1.S1_at | 6 | 45 | ||||
| KCNAB1 | Gga.4971.1.S1_at | 7 | 72 | ||||
| MYLK | Gga.6776.1.S1_at | 8 | 30 | ||||
| CBLN4 | GgaAffx.4848.1.S1_s_at | 9 | 40 | ||||
| GLRA3 | GgaAffx.6806.1.S1_at | 10 | 19 | ||||
| SLC14A2 | Gga.7955.1.S1_at | 11 | 22 | ||||
| DIO3 | Gga.552.1.S1_at | 12 | 10 | ||||
| KCNMA1 | Gga.19342.1.S1_at | 13 | 63 | ||||
| GRB10 | GgaAffx.8324.2.S1_at | 14 | 76 | ||||
| UPK1B | Gga.17532.1.S1_at | 15 | 2 | ||||
| CALD1 | GgaAffx.21386.1.S1_s_at | 16 | 33 | ||||
| MAFA | Gga.974.1.S1_at | 17 | 29 | ||||
| OLFML3 | Gga.1150.2.S1_a_at | 18 | 62 | ||||
| --- | Gga.18986.1.S1_at | 19 | 48 | ||||
| GABRA1 | Gga.17167.1.S1_at | 20 | 18 | ||||
-
List of the top 20 downregulated probes common to both the PMZ of whole embryo and isolated anterior cut halves. Entries in red are probes that pass a fold change cut-off of −1.2 as well as a p value cut-off of 0.05; those in blue pass the fold change cut off of −1.2 but not the p value cut-off of 0.05; and those in black pass the p value cut-off but not the fold change cut-off. Common genes are ranked according to the fold change of genes in the anterior cut halves (Spearman's rank Rho = 0.17, p = 0.44).
Table 5
Construction of mutations introduced to destroy Pitx-binding sites
| Enh PITX site | Mutated bases |
|---|---|
| E1 PITX2 | GCTGGATACTTCTT |
| E1 PITX1 | TGGTTGATTGAAAG |
| E3 PITX2 | GGGTGATAATGGCC |
| E3 PITX1 | AGGGTGATAATGGC |
| E5 PITX2 1 | TAAAACTAAACTGC |
| E5 PITX2 2 | AGAAAATAATAAAT |
| E6 PITX2 | TGTCTATACTCCTC |
-
The mutations (highlighted in red) introduced into the sequences of Pitx-binding sites in enhancers E1, E3, E5 and E6.
Table 6
Primers used for construction of mutations in Pitx-binding sites
| Primer sequence | Primer name |
|---|---|
| aggggtttggttTCgaGttgaaagcgtgtacttctcacccattgaaactgccaggtctgt | Enh1PitX1MutF |
| ctttcaaCtcGAaaccaaacccctcccatcacacacacaaactctactgcttcttcaaacca | Enh1PitX1MutR |
| agggggctggTCatGacttcttgcaggtgccccaaaggcagggcca | Enh1PitX2MutF |
| aagaagtCatGAccagccccctacccgaccctgctgcacagggaat | Enh1PitX2MutR |
| ggccattaCtcGAaccctgctccctctgccctggcag | Enh3PitX2MutF |
| ctgccagggcagagggagcagggtTCgaGtaatggcc | Enh3PitX2MutR |
| agtgcagtttCagGAttttactttatagtttttttattcctacttgccatgaaagtggagaacat | Enh5PitX2MutF |
| taaaaTCctGaaactgcacttaacatagcgattacaaaacactcttggttagagtagcaacacaa | Enh5PitX2MutR |
| tgggctttcctatttattCatGAtttcttacagtagacaagaagattcacatttgtttgtgtttcatagctagag | Enh5PitX22MutF |
| tgtaagaaaTCatGaataaataggaaagcccaaatgttacaagcttcattgggcctccattgctggaagaaaaga | Enh5PitX22MutR |
| ataacaaaggggaggagtCatGAagacattgattctaatttgttctacatttcagtttattagcaaagtgaca | Enh6PitX2MutF |
| aatcaatgtctTCatGactcctcccctttgttatttcattttatgtgctttctaattcatcttcaattaaga | Enh6PitX2MutR |
-
This table shows the primer combinations used to generate the mutations indicated in Table 5.
Download links
A two-part list of links to download the article, or parts of the article, in various formats.
Downloads (link to download the article as PDF)
Open citations (links to open the citations from this article in various online reference manager services)
Cite this article (links to download the citations from this article in formats compatible with various reference manager tools)
The transcription factor Pitx2 positions the embryonic axis and regulates twinning
eLife 3:e03743.
https://doi.org/10.7554/eLife.03743


