Calmodulin-controlled spatial decoding of oscillatory Ca2+ signals by calcineurin
- The Johns Hopkins University School of Medicine, United States
- The Johns Hopkins University, United States
Figures
Figure 1
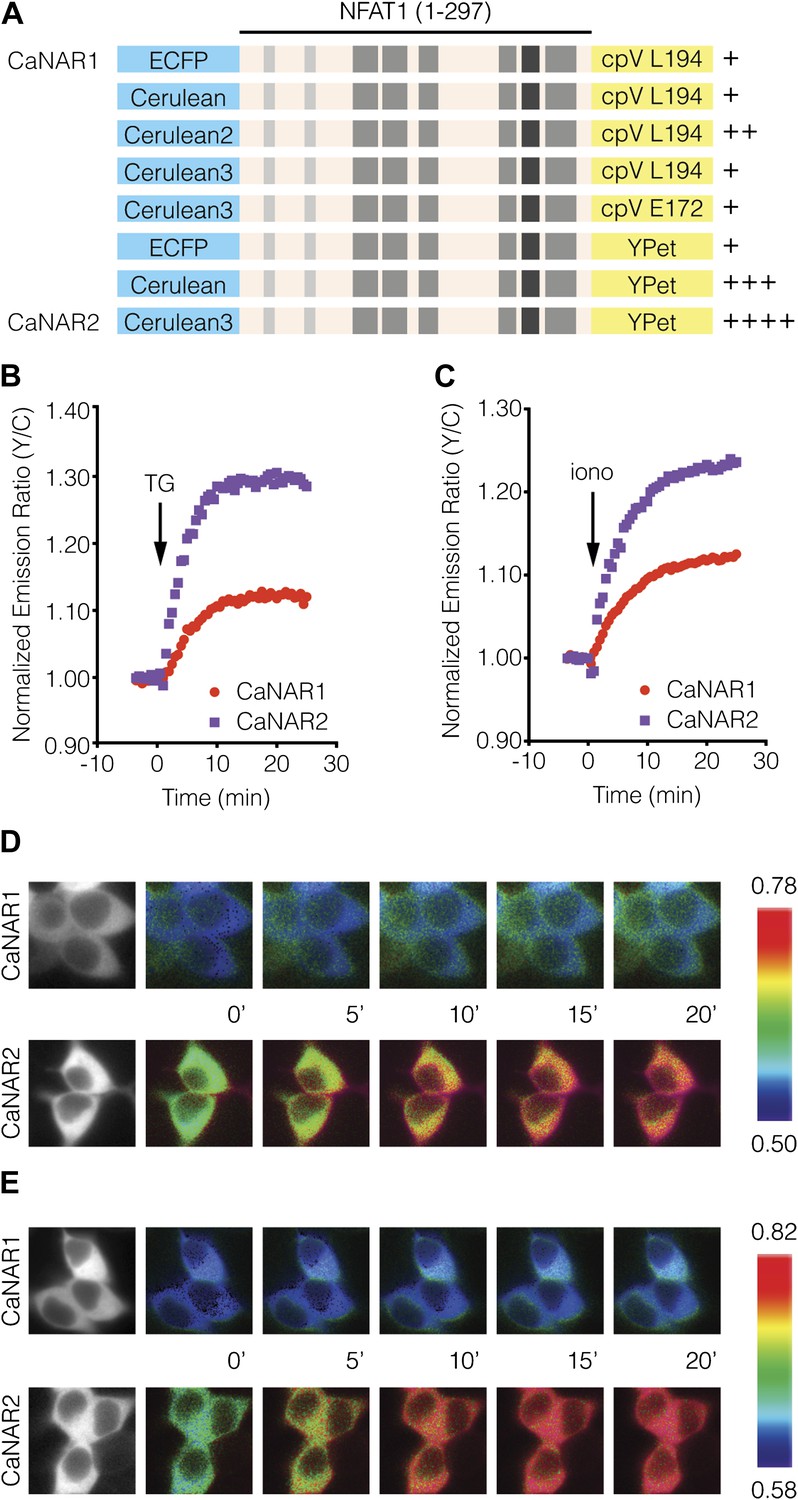
Development and characterization of CaNAR2.
(A) Schematic depicting the CaNAR variants tested. FRET pair optimization was performed by replacing the original ECFP and circularly permuted Venus (cpV) L194 of CaNAR1 (top) with Cerulean, Cerulean2, Cerulean3, cpV E172, or YPet. The responses from each construct are indicated as follows: +, ∼5–10%; ++, ∼10–15%; +++, ∼15–20%; ++++, >20%. (B and C) Representative time-courses comparing the yellow/cyan (Y/C) emission ratio changes from CaNAR1 and CaNAR2 in HEK293 cells treated with (B) 1 μM thapsigargin (TG) or (C) 1 μM ionomycin (iono). CaNAR2 exhibits an at least twofold greater response in each condition. (D and E) Pseudocolored images showing the responses of CaNAR1 and CaNAR2 to (D) 1 μM TG or (E) 1 μM iono in HEK293 cells. Warmer colors correspond to higher FRET ratios. Cyan fluorescence images (left) show the cellular distribution of CaNAR1 and CaNAR2 fluorescence.
Figure 2 with 1 supplement
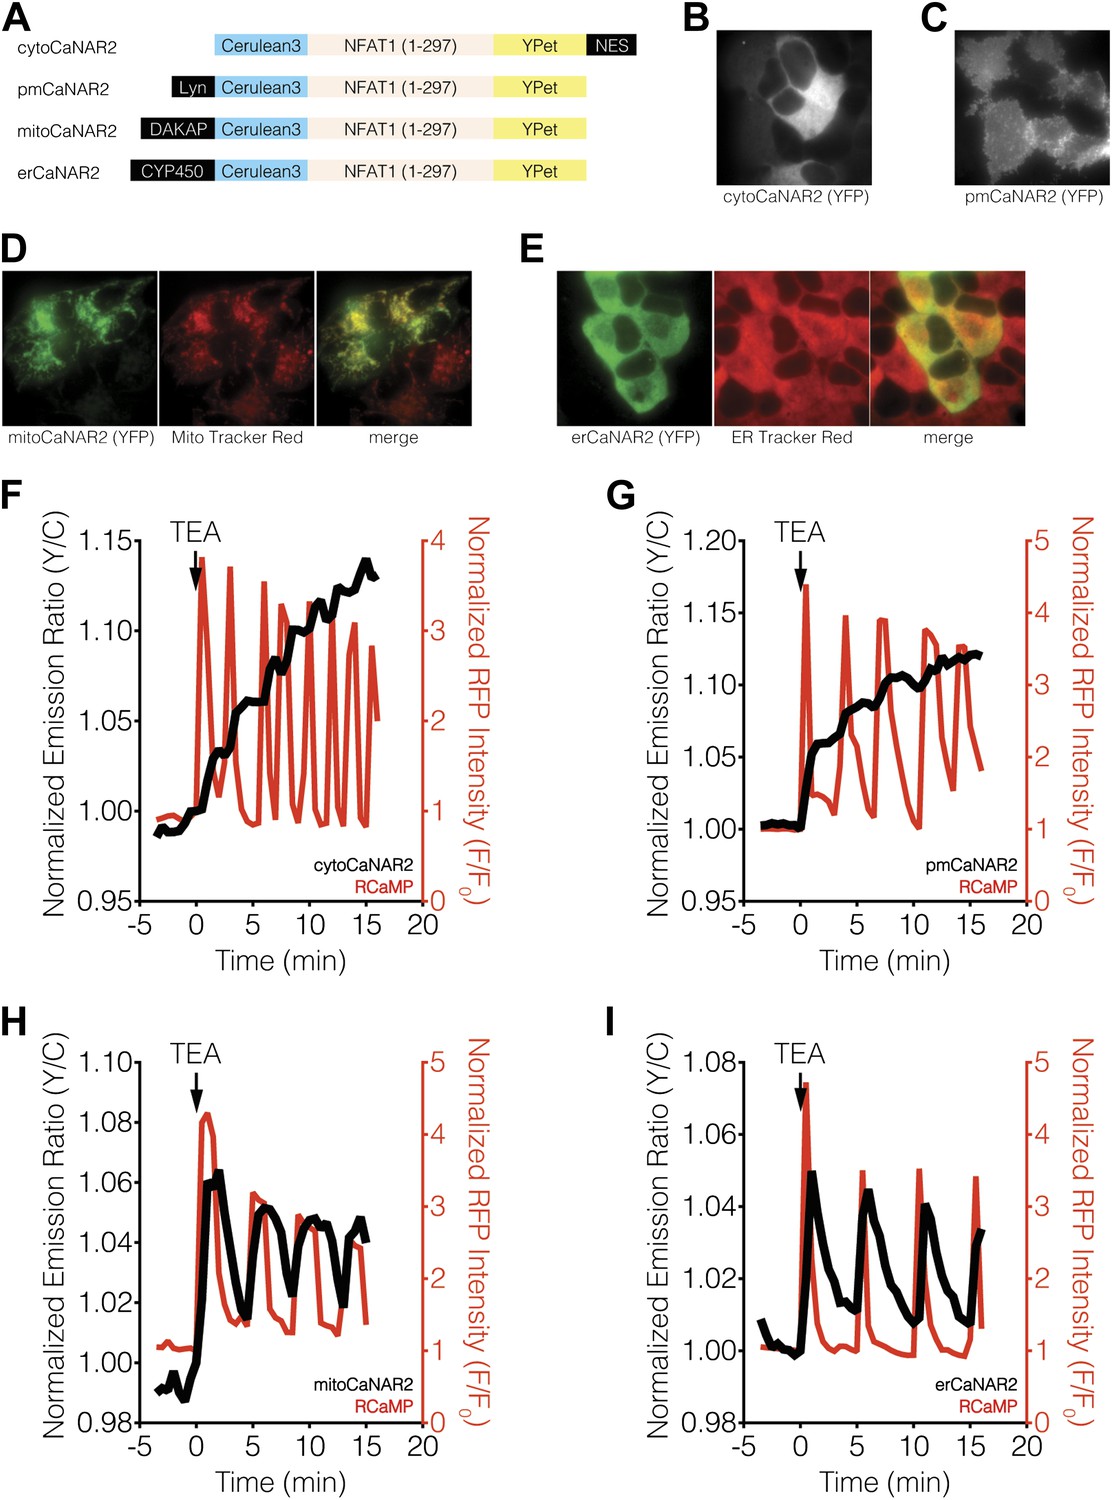
Subcellular calcineurin activity dynamics in response to Ca2+ oscillations in MIN6 cells.
(A) Schematic illustrating the domain structures of the subcellularly targeted variants of the CaNAR2 biosensor. (B and C) Yellow fluorescence images showing the biosensor distribution in transiently transfected MIN6 cells expressing (B) cytoCaNAR2 and (C) pmCaNAR2. (D and E) Fluorescence images showing the localization of mitoCaNAR2 and erCaNAR2. MIN6 cells expressing (D) mitoCaNAR2 or (E) erCaNAR2 were stained with MitoTracker Red or ER-Tracker Red, respectively. Image series corresponds to biosensor fluorescence (YFP, left), dye fluorescence (middle), and merged (right). (F–I) Representative time-courses showing the yellow/cyan (Y/C) emission ratio changes from (F) cytoCaNAR2 (n = 29), (G) pmCaNAR2 (n = 22), (H) mitoCaNAR2 (n = 11), and (I) erCaNAR2 (n = 15) (black curves), along with the red fluorescence intensity changes from RCaMP (red curves), in MIN6 cells stimulated with 20 mM TEA.
Figure 2—figure supplement 1
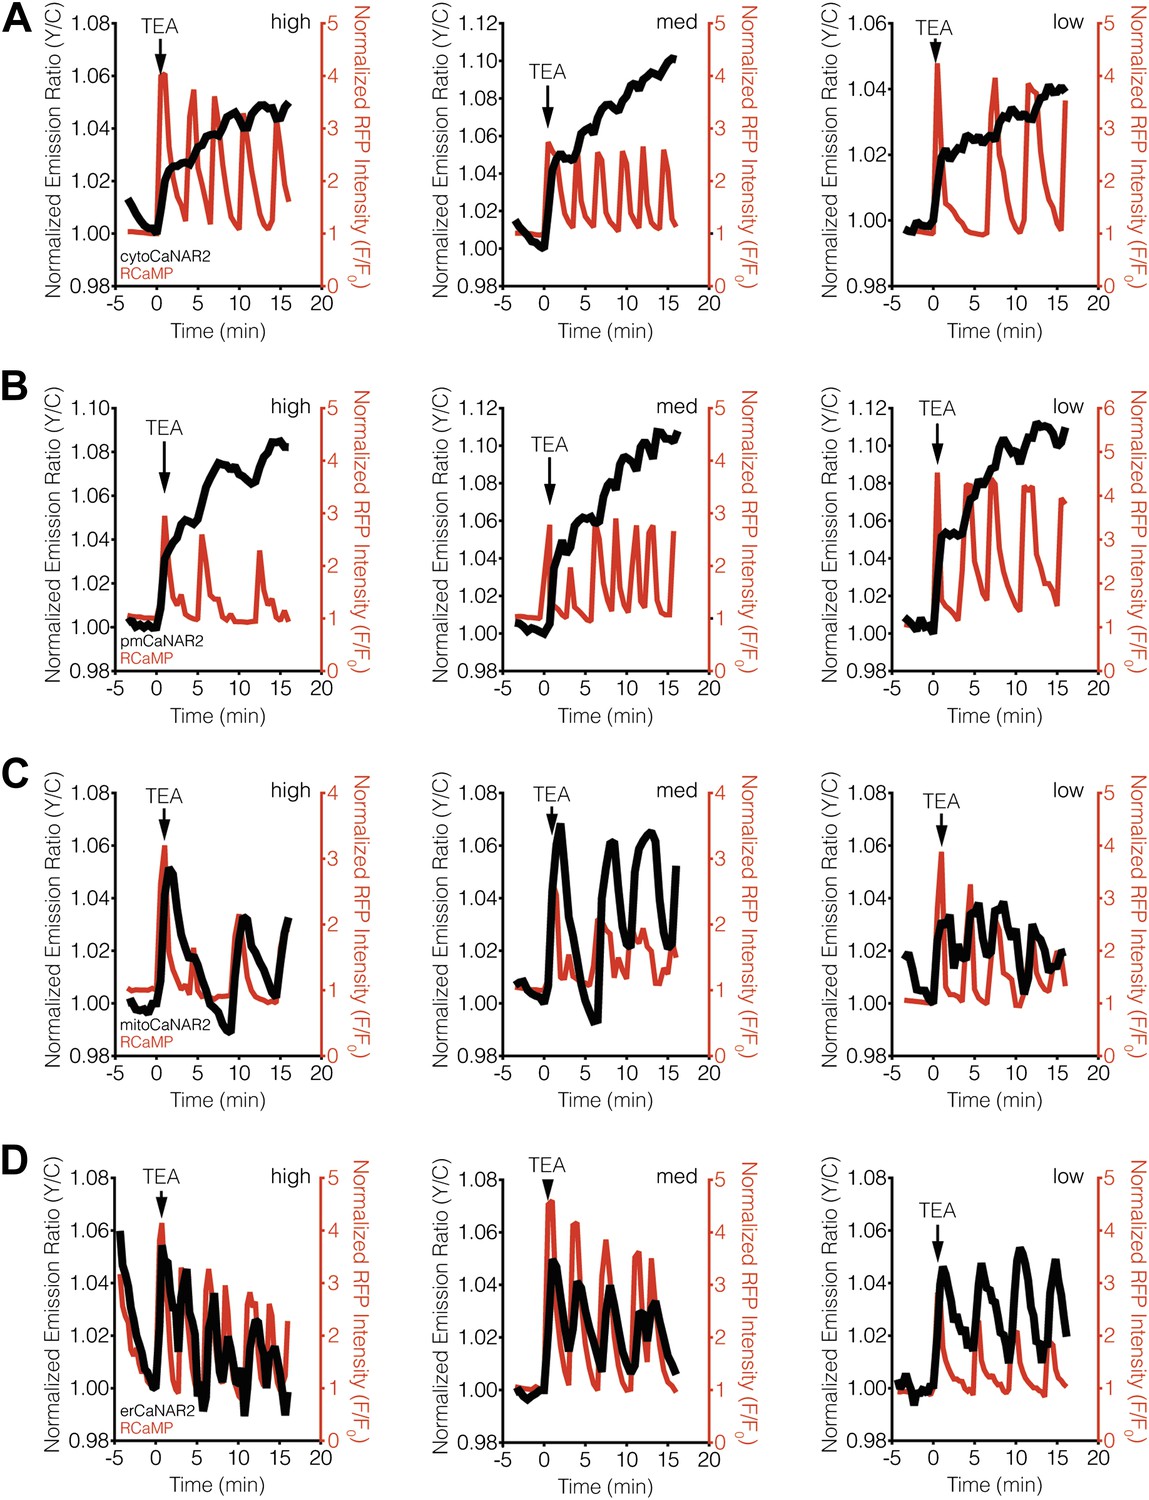
CaNAR expression levels do not affect subcellular calcineurin response dynamics.
(A) Representative time-courses showing the TEA-stimulated response in MIN6 cells expressing high (1812), medium (521), or low (42) levels of cytoCaNAR2. (B) Representative time-courses showing the TEA-stimulated response in MIN6 cells expressing high (1441), medium (485), or low (158) levels of pmCaNAR2. (C) Representative time-courses showing the TEA-stimulated response in MIN6 cells expressing high (658), medium (384), or low (91) levels of mitoCaNAR2. (D) Representative time-courses showing the TEA-stimulated response in MIN6 cells expressing high (969), medium (599), or low (120) levels of erCaNAR2. Values in parentheses correspond to background-subtracted YFP intensities.
Figure 3
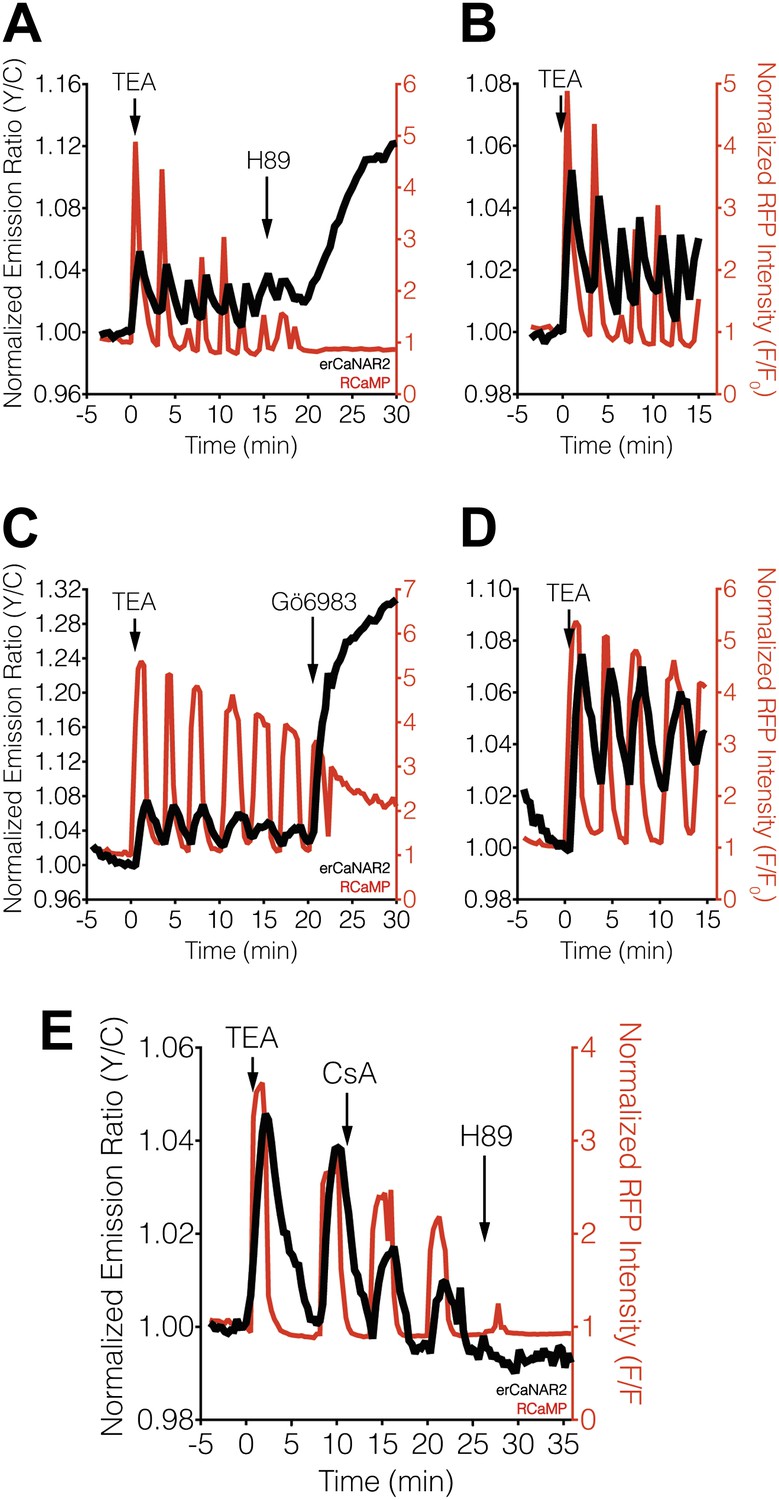
Effect of PKA and PKC inhibition on TEA-induced ER calcineurin activity oscillations.
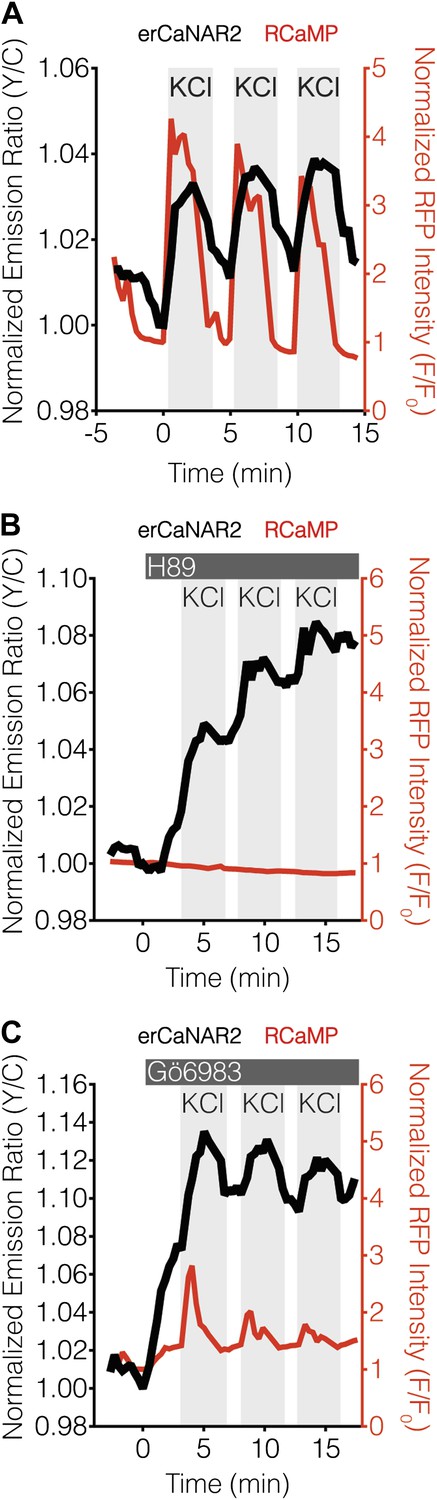
(A) Representative time-course showing the effect of 20 μM H89 treatment on the TEA-stimulated responses from erCaNAR2 (black curve) and RCaMP (red curve) in MIN6 cells (n = 11). (B) Expanded time-course showing the TEA-stimulated responses from (A). (C) Representative time-course showing the effect of 10 μM Gö6983 on the TEA-stimulated responses from erCaNAR2 (black curves) and RCaMP (red curve) in MIN6 cells (n = 6). (D) Expanded time-course showing the TEA-stimulated responses from (C). (E) Representative time-course showing the responses from erCaNAR2 (black curve) and RCaMP (red curve) in MIN6 cells treated with 20 mM TEA, 6 μM cyclosporin A (CsA), and 20 μM H89 at the indicated times (n = 3).
Figure 4 with 1 supplement
PKA antagonizes ER calcineurin activity in MIN6 cells.
(A) Manual induction of Ca2+ oscillations in MIN6 cells via repeated addition and washout of 15 mM KCl. Addition of KCl rapidly increases the responses from RCaMP (red curve) and erCaNAR2 (black curve), which are then both reversed upon washout. Repeating this process generates oscillatory responses. (B) Representative time-course showing the effect of 20 μM H89 treatment on the KCl-induced erCaNAR2 (black curve) and RCaMP (red curve) response in MIN6 cells (n = 5). H89 was added prior to the initial KCl treatment, and the H89 concentration in the experiment was maintained by re-addition of 20 μM H89 after washing out KCl. Although RCaMP did not detect Ca2+ responses in this experiment, Ca2+ spikes could clearly be seen using a high-affinity Ca2+ probe (Figure 4—figure supplement 1). (C) Representative time-course showing the effect of 10 μM Gö6983 treatment on the KCl-induced erCaNAR2 (black curve) and RCaMP (red curve) response in MIN6 cells (n = 4). Gö6983 was added prior to the initial KCl treatment, and the Gö6983 concentration in the experiment was maintained by re-addition of 10 μM Gö6983 after washing out KCl.
Figure 4—figure supplement 1
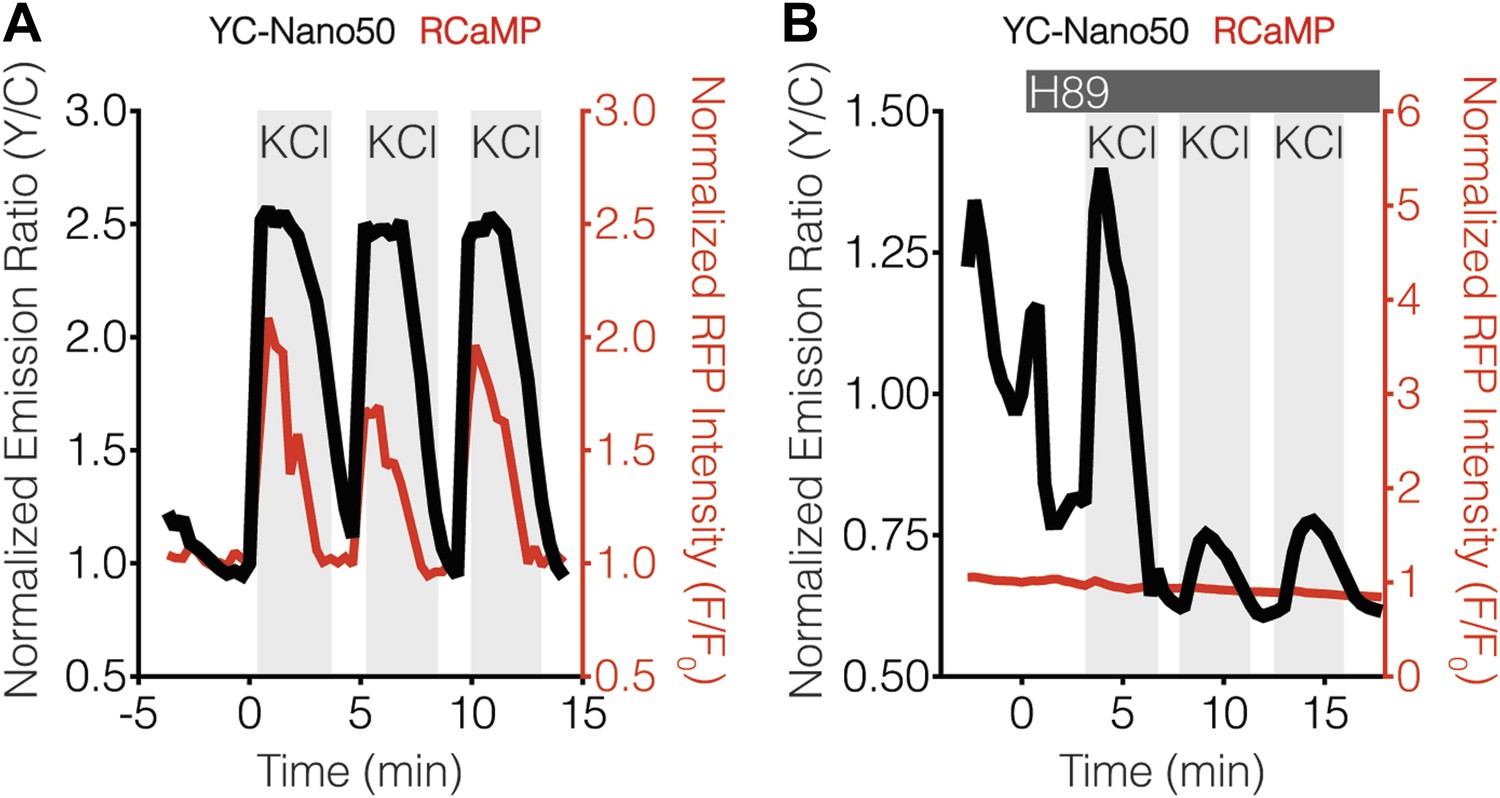
YC-Nano50 detects KCl-induced Ca2+ influx in the presence of H89.
Representative curves showing the responses of both YC-Nano50 (black curves) and RCaMP (red curves) to repeated addition and wash-out of KCl in the (A) absence and (B) presence of 20 μM H89 treatment. H89 was added prior to the initial KCl treatment, and the H89 concentration in the experiment was maintained by re-addition of 20 μM H89 after washing out KCl. H89 abolishes the RCaMP response, whereas YC-Nano50 is still able to detect KCl-induced Ca2+ spikes.
Figure 5 with 1 supplement
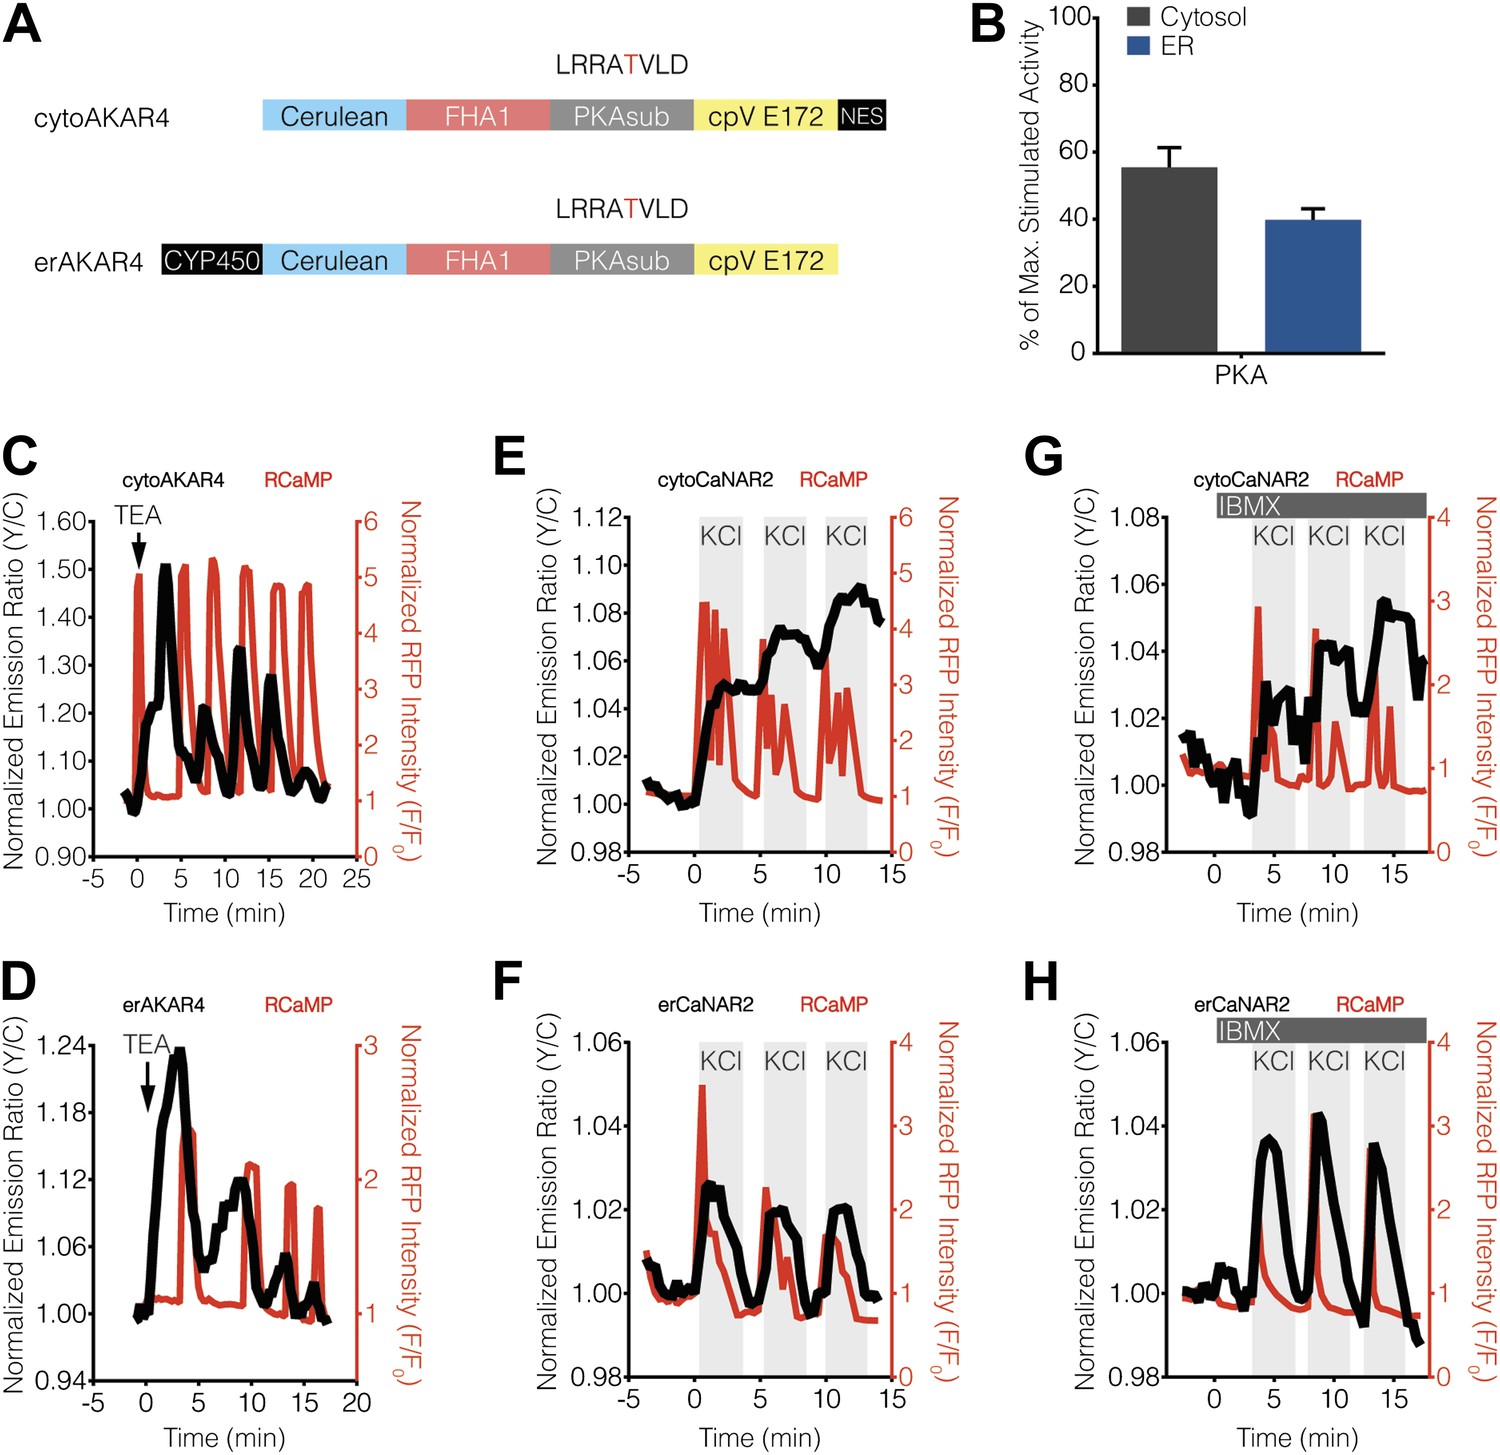
Characterization of cytosolic and ER-localized PKA activity in MIN6 cells.
(A) Schematic illustrating the domain structures of cyto- and erAKAR4. (B) Comparison of fractional PKA activity levels in the cytosol and ER of MIN6 cells. To determine the relative fraction of PKA activity being induced by TEA stimulation in each subcellular compartment, the FRET ratio change from each TEA-induced cytoAKAR4 or erAKAR4 response was divided by the maximum FRET ratio change observed upon co-stimulation with 50 μM Fsk and 100 μM IBMX. Data shown are presented as mean ± SEM, with n = 36 and 34 for cytoAKAR4 and erAKAR4, respectively. (C and D) Representative time-courses showing the responses from (C) cytoAKAR4 and (D) erAKAR4 (black curves), along with RCaMP (red curves), in MIN6 cells treated with 20 mM TEA. (E-H) Effect of maximal PKA activity on subcellular CaNAR2 responses. Representative time-courses showing the KCl-induced cytoCaNAR2 response in the (E) absence (n = 26) or (G) presence (n = 14) of 100 μM IBMX treatment in MIN6 cells, and representative time-courses showing the KCl-induced erCaNAR2 response in the (F) absence (n = 18) or (H) presence (n = 8) of 100 μM IBMX treatment in MIN6 cells. IBMX was added prior to the initial KCl treatment, and the IBMX concentration in the experiment was maintained by re-addition of 100 μM IBMX after washing out KCl.
Figure 5—figure supplement 1
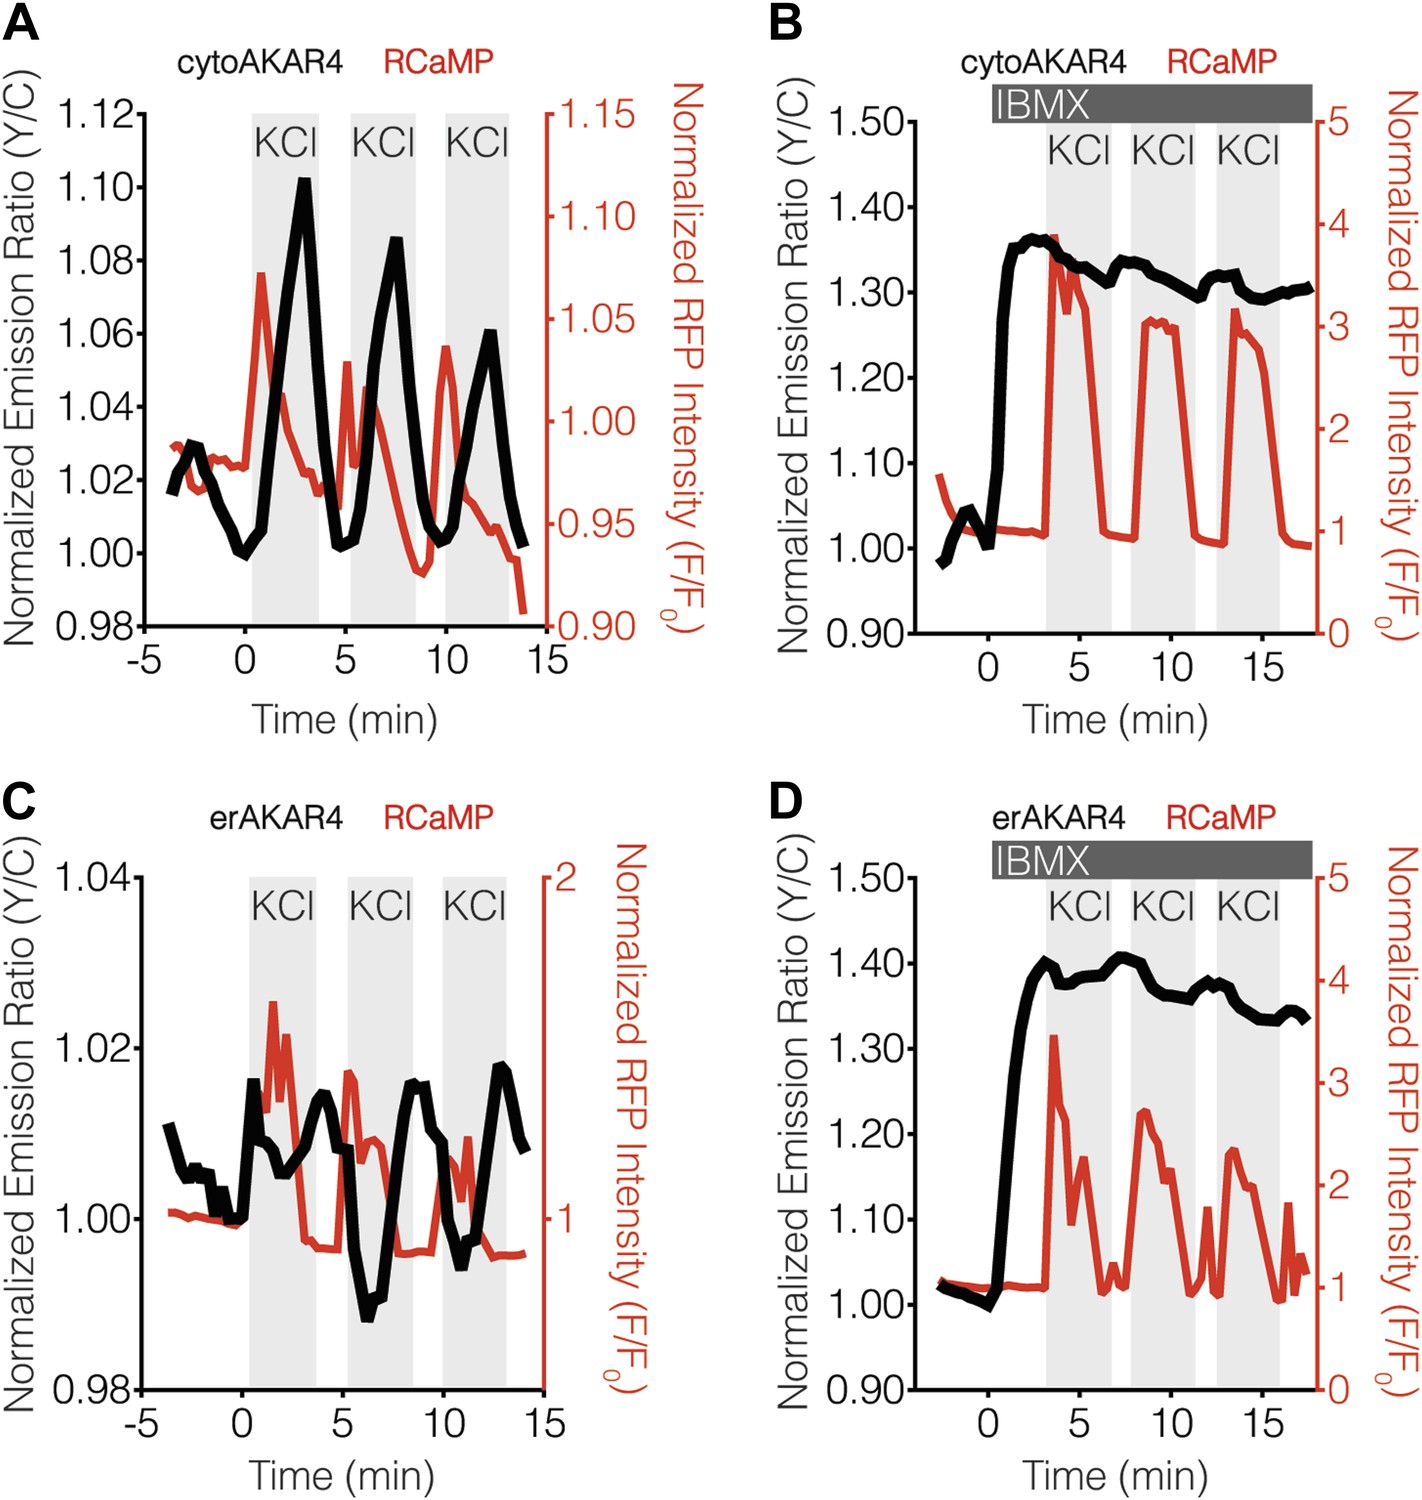
Blocking oscillatory PKA activity in the cytosol and at the ER surface in MIN6 cells.
(A and B) Representative time-courses showing the KCl-induced cytoAKAR4 response in the absence (A) or presence (B) of 100 μM IBMX treatment in MIN6 cells. (C and D) Representative time-courses showing the KCl-induced erCaNAR2 response in the absence (C) or presence (C) of 100 μM IBMX treatment in MIN6 cells. IBMX was added prior to the initial KCl treatment, and the IBMX concentration in the experiment was maintained by re-addition of 100 μM IBMX after washing out KCl.
Figure 6
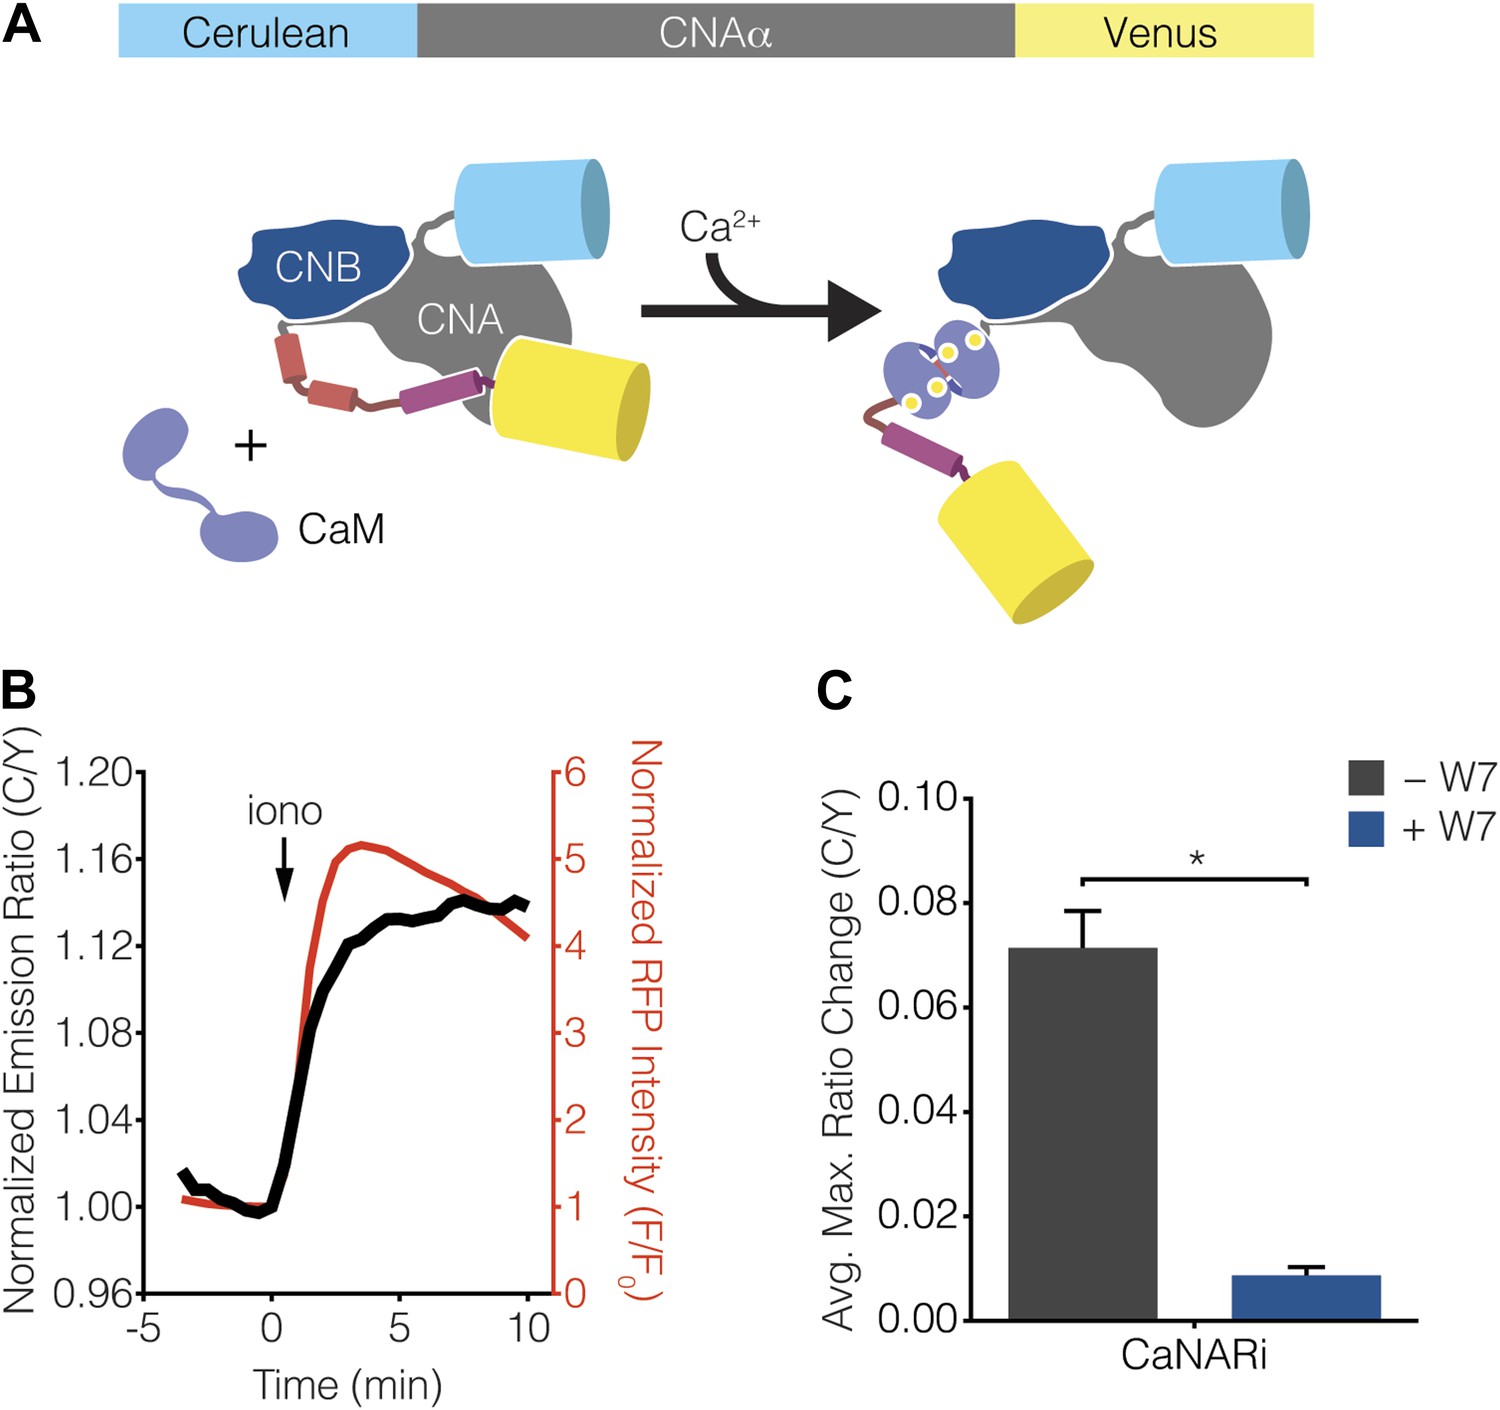
Development of CaNARi, a FRET-based reporter of calcineurin activation.
(A) Schematic illustrating the domain structure of CaNARi and the proposed Ca2+/CaM-induced molecular switch. (B) Representative time-course showing the cyan/yellow (C/Y) emission ratio change from CaNARi (black curve), along with the RCaMP response (red curve), in HEK293 cells treated with 1 μM ionomycin (iono). (C) Summary of C/Y emission ratio responses from CaNARi in HEK293 cells stimulated using 1 μM iono with (+W7, n = 18) or without (−W7, n = 21) pretreating for 30 min with 50 μM of the CaM antagonist W7. Data shown are presented as mean ± SEM. *p < 0.0001.
Figure 7 with 1 supplement

Ca2+ oscillations induce uniform subcellular calcineurin activation patterns.
(A) Schematic illustrating the domain structures of the subcellularly targeted CaNARi variants. (B) Summary of the C/Y emission ratio responses from each subcellularly targeted CaNARi variant. Data shown are presented as mean ± SEM, with n = 16, 13, 10, and 12 for cytoCaNARi, pmCaNARi, mitoCaNARi, and erCaNARi, respectively. (C–F) Representative time-courses showing the responses from (C) cytoCaNARi, (D) pmCaNARi, (E) mitoCaNARi, and (F) erCaNARi (black curves), along with the response from RCaMP (red curves), in MIN6 cells treated with 20 mM TEA.
Figure 7—figure supplement 1
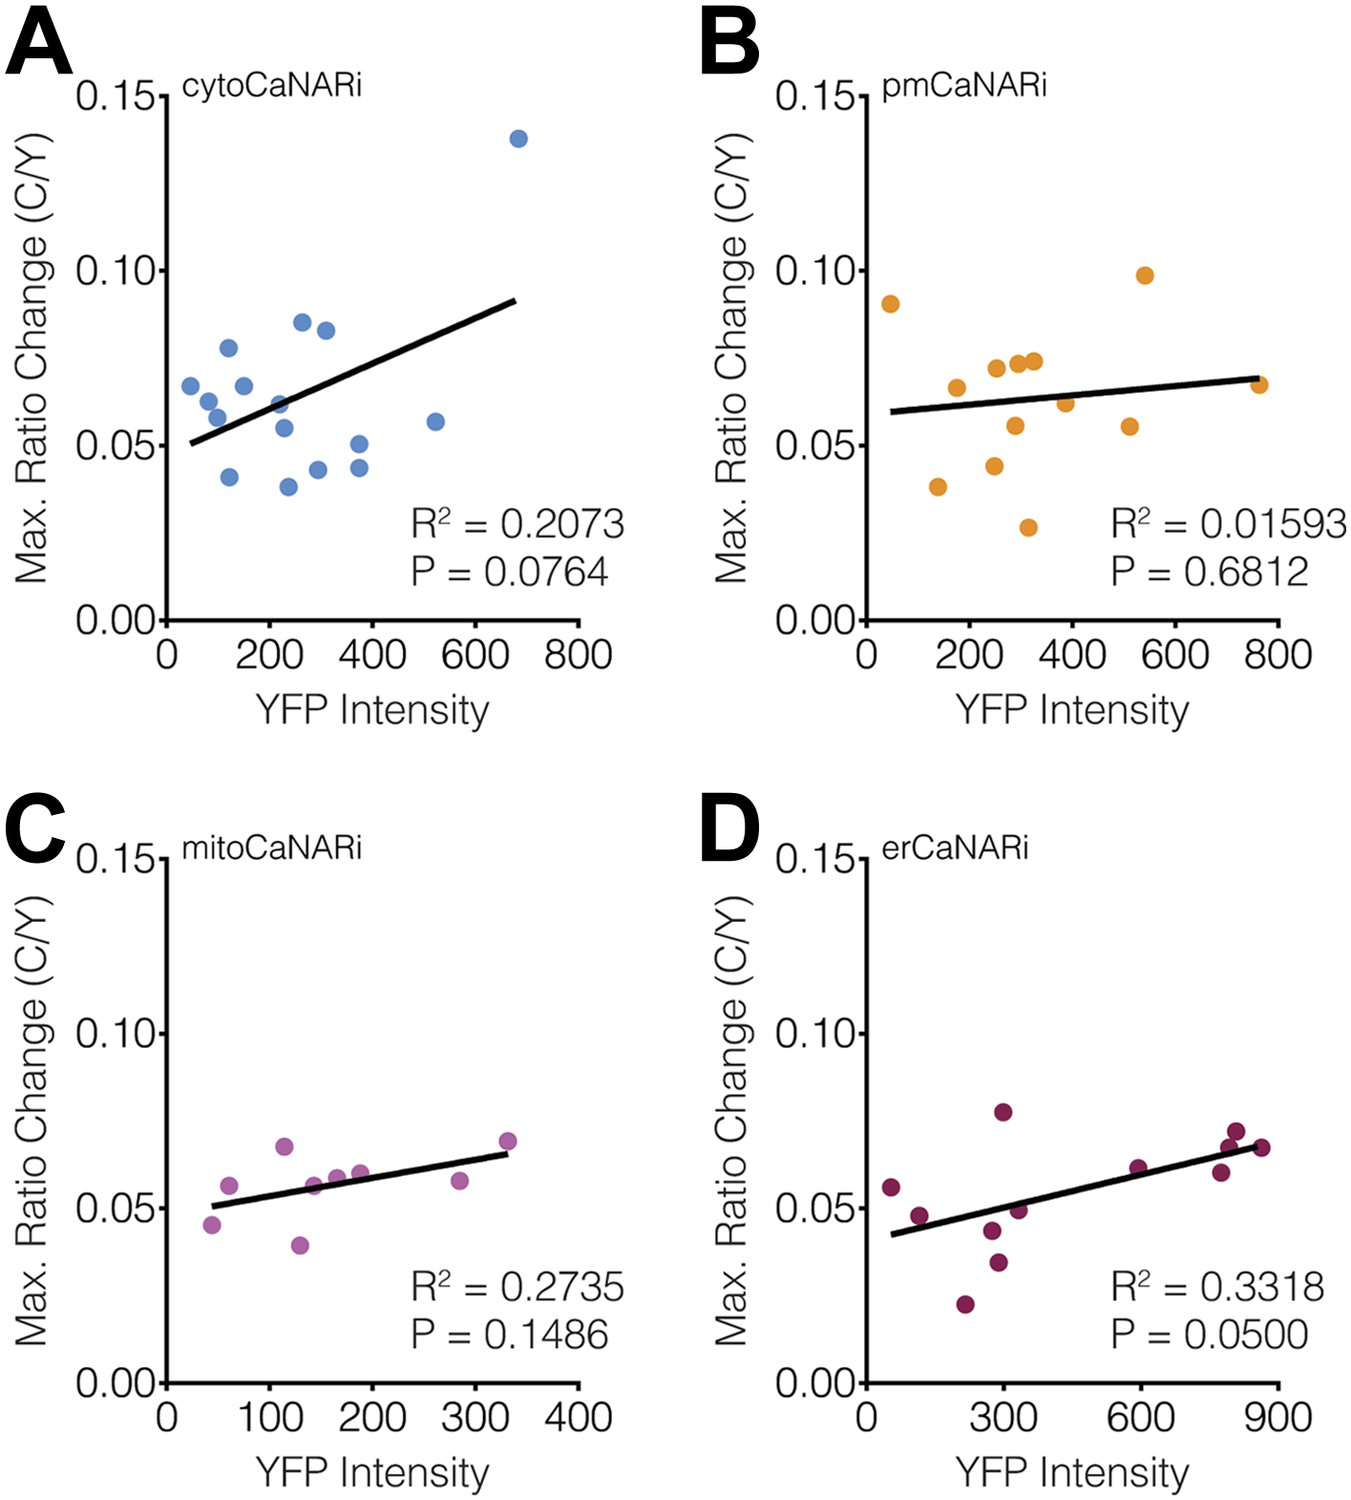
Subcellular CaNARi responses are not affected by the reporter expression level.
Scatter plots showing the maximum C/Y FRET ratio change vs YFP intensity (i.e., reporter expression level) for (A) cytoCaNARi, (B) pmCaNARi, (C) mitoCaNARi, and (D) erCaNARi. Weakly positive correlations were detected using linear regression analyses, though none were statistically significant.
Figure 8
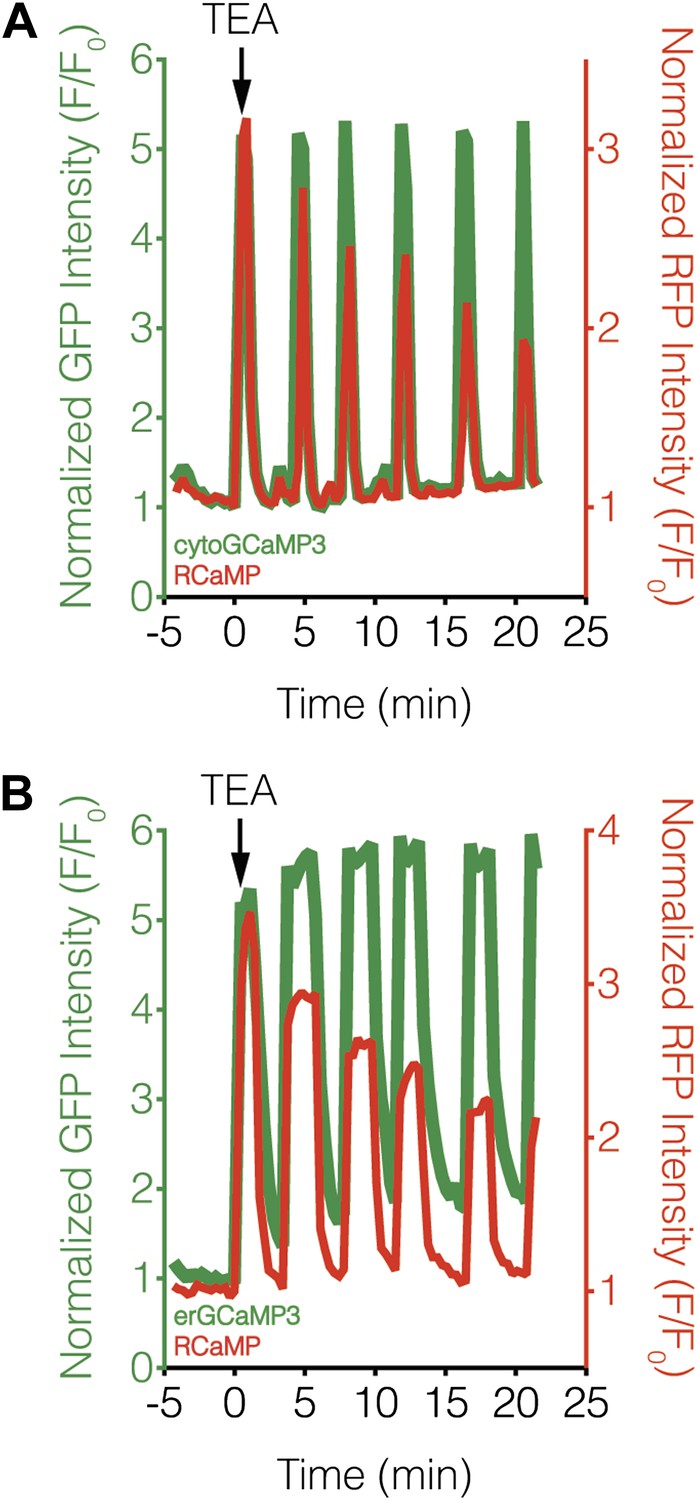
Subcellular Ca2+ dynamics match global Ca2+ dynamics in MIN6 cells.
Representative curves showing the response from (A) cytoGCaMP3 (n = 23) or (B) erGCaMP3 (n = 38) (green curves) and RCaMP (red curves) in MIN6 cells treated with 20 mM TEA. (A) To compare the Ca2+ dynamics in different subcellular compartments in MIN6 cells, GCaMP3 and RCaMP were first co-expressed in the cytosol. TEA stimulation induced completely overlapping responses from both probes, indicating that they have similar properties, though the RCaMP response amplitude often decreased over time. (B) GCaMP3 was then targeted to the ER surface while RCaMP was kept in the cytosol. Upon TEA stimulation, the GCaMP3 response again tracked closely with the RCaMP response, with no noticeable differences in the timing of Ca2+ increases or decreases between the ER and cytosol. The basal GCaMP response drifted upwards at the ER surface, but this did not affect the overall dynamics of the Ca2+ oscillations.
Figure 9 with 1 supplement
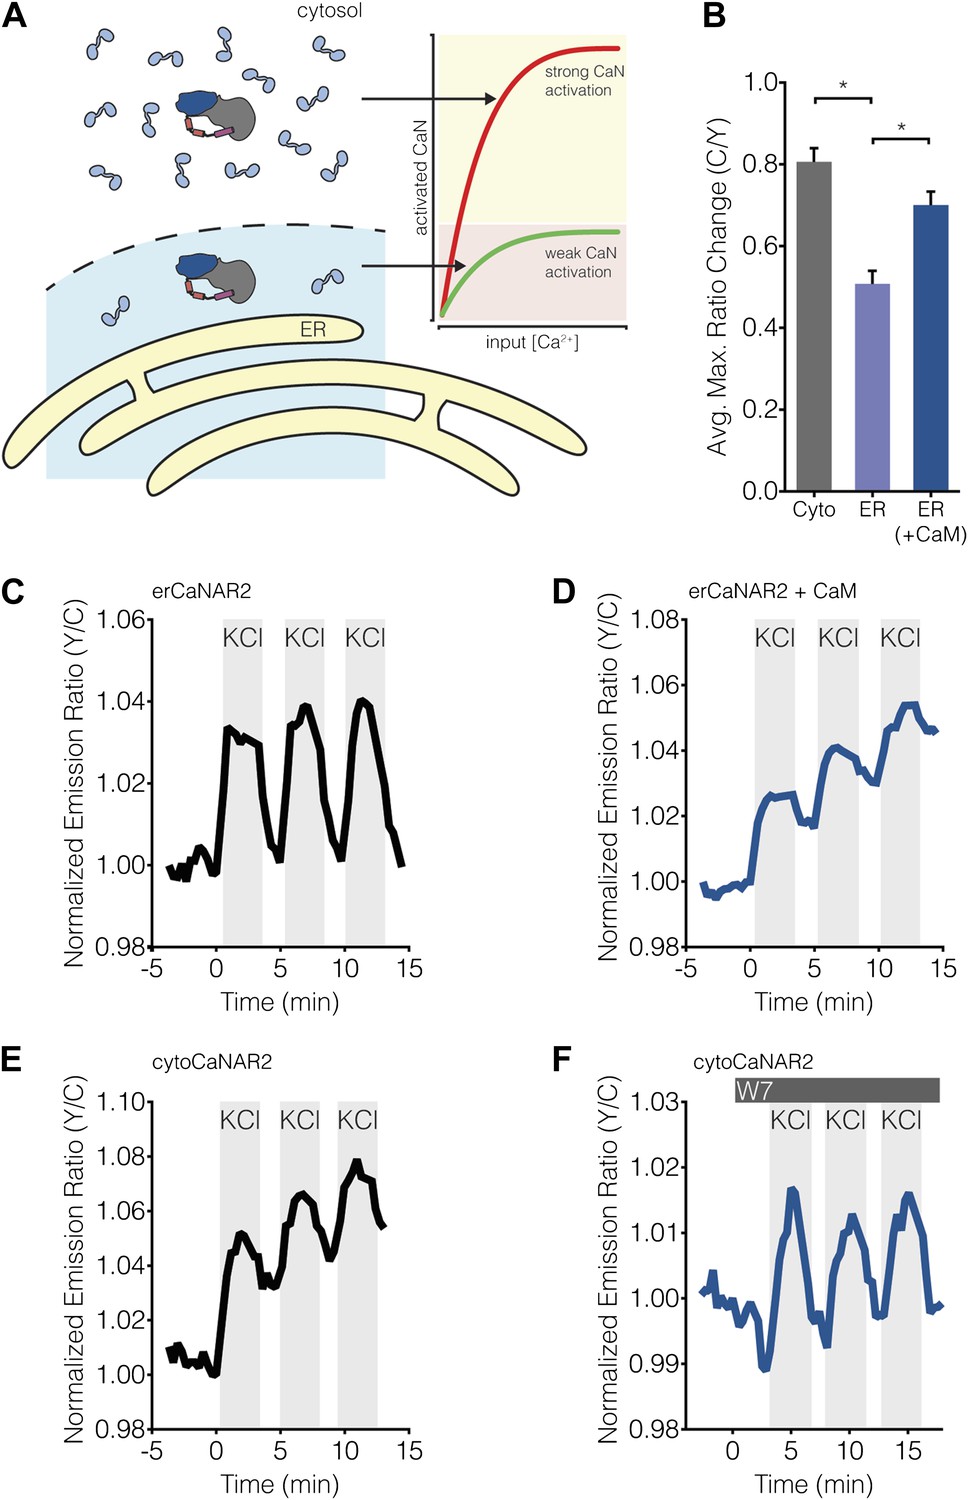
Subcellular Ca2+/CaM levels determine local calcineurin activity dynamics.
(A) Model for the regulation of subcellular calcineurin activity in MIN6 cells by local variations in free Ca2+/CaM levels. As depicted in this illustration, CaM is predicted to be relatively abundant in the cytosol, thereby leading to strong activation of calcineurin (CaN) in the cytosol (red curve). Conversely, CaM is predicted to be present in much lower quantities near the ER surface, thereby leading to weaker levels of calcineurin activation at any given Ca2+ concentration in this part of the cell (green curve). (B) Summary of the C/Y emission ratio responses of BSCaM-2 expressed in the cytosol (Cyto) and at the ER surface without (ER) or with (ER+CaM) the overexpression of CaM in MIN6 cells. To achieve maximal levels of free Ca2+/CaM, cells were treated with 5 mM CaCl2 and 5 μM ionomycin. Data shown are presented as mean ± SEM, with n = 31, 33, and 34 for Cyto, ER, and ER+CaM, respectively. *p < 0.0001. (C and D) Representative time-courses showing the KCl-induced responses from erCaNAR2 in the (C) absence (n = 18) and (D) presence (n = 7) of CaM overexpression in MIN6 cells. (E and F) Representative time-courses showing the KCl-induced responses from cytoCaNAR2 in the (E) absence (n = 26) and (F) presence (n = 23) of 20 μM W7 treatment in MIN6 cells. W7 was added prior to the initial KCl treatment, and the W7 concentration in the experiment was maintained by re-addition of 20 μM W7 after washing out KCl.
Figure 9—figure supplement 1
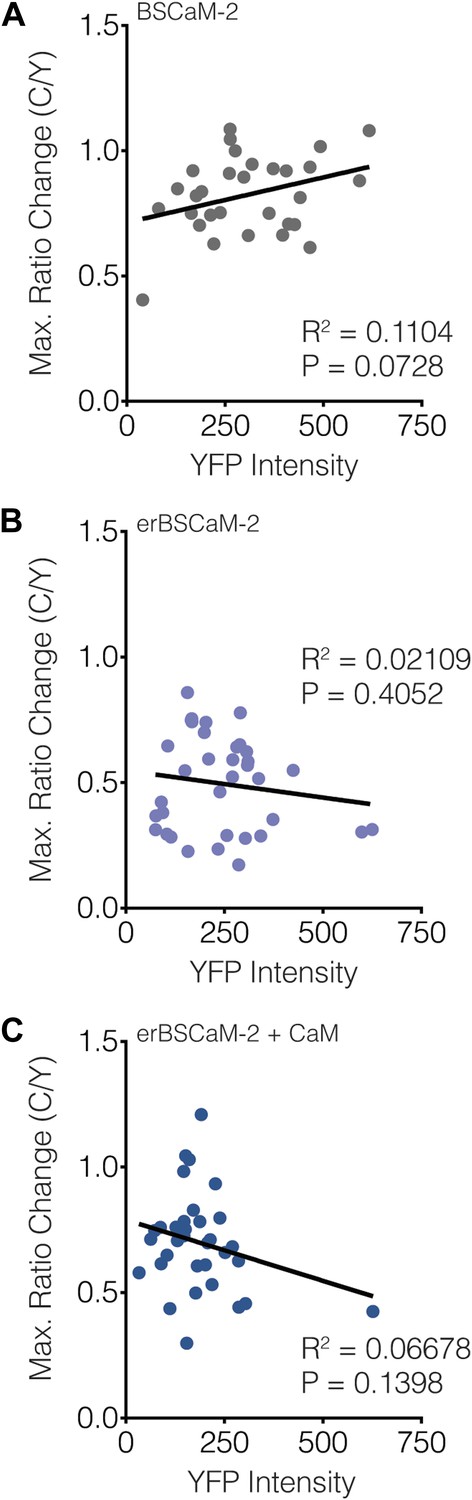
Subcellular BSCaM-2 responses are not affected by the reporter expression level.
Scatter plots showing the maximum C/Y FRET ratio change vs YFP intensity (i.e., reporter expression level) for (A) BSCaM-2, (B) erBSCaM-2, and (C) erBSCaM-2 + CaM, which correspond to ‘Cyto’, ‘ER’, and ‘ER+CaM’ in Figure 9B. Very weak positive or negative correlations were detected using linear regression analyses, though none of the correlations were statistically significant.
Download links
A two-part list of links to download the article, or parts of the article, in various formats.
Downloads (link to download the article as PDF)
Open citations (links to open the citations from this article in various online reference manager services)
Cite this article (links to download the citations from this article in formats compatible with various reference manager tools)
Calmodulin-controlled spatial decoding of oscillatory Ca2+ signals by calcineurin
eLife 3:e03765.
https://doi.org/10.7554/eLife.03765


