TORC2-dependent protein kinase Ypk1 phosphorylates ceramide synthase to stimulate synthesis of complex sphingolipids
- University of California, Berkeley, United States
Figures
Figure 1

A three-part screen to identify likely Ypk1 substrates.
(A) The three-part screening strategy to identify Ypk1 substrates is shown schematically as a flow chart. Numbers indicate the number of hits/considered genes at each step in the screen. (B) The bioinformatic approach towards identifying Ypk1 substrates is schematized as a flowchart with each filter as a box. Genes were first filtered by MOTIPS on the basis of having likely phosphorylatable Ypk1 motifs. Subsequently, substrates were filtered by having many Ypk1 motifs or having a Ypk1 site known to be phosphorylated in published data sets. Lastly, genes were filtered by requiring the gene to have a published chemical sensitivity like Ypk1 does, or a published interaction with Ypk1, Ypk1 regulators (TORC2 or PP2A) or sphingolipid biosynthetic machinery. (C) A possible explanation for Ypk1 synthetic dosage lethality interactions is shown. Normally, the cell has enough kinase activity to buffer overexpression of a substrate (Substrate 2), so that essential substrates are regulated and normal growth is unperturbed. However, concurrent decrease in kinase activity coupled with substrate overexpression causes loss of regulation of essential substrate(s) (Substrate 1) leading to observable growth defects. (D) ypk1-as ypk2Δ (yAM135–A) cells were transformed with PGAL1-GFP (negative control), PGAL1-Orm1 or PGAL1-Orm2 (known Ypk1 substrates, positive SDL controls) plasmids. Overnight cultures were then serially diluted onto either dextrose (to repress substrate overexpression) or galatose (to induce substrate overexpression) containing media with increasing concentrations of the Ypk1-as inhibitor 3-MB-PP1. (E) GST-Orm1(1–85) (pFR203) and GST-Fps1(1–255) (pBT6) were purified from E. coli and incubated with [γ-32P]ATP and Ypk1-as, purified from S. cerevisiae, in the absence or presence of 3-MB-PP1. The products were then resolved by SDS/PAGE and analyzed as described in ‘Materials and methods’.
Figure 2
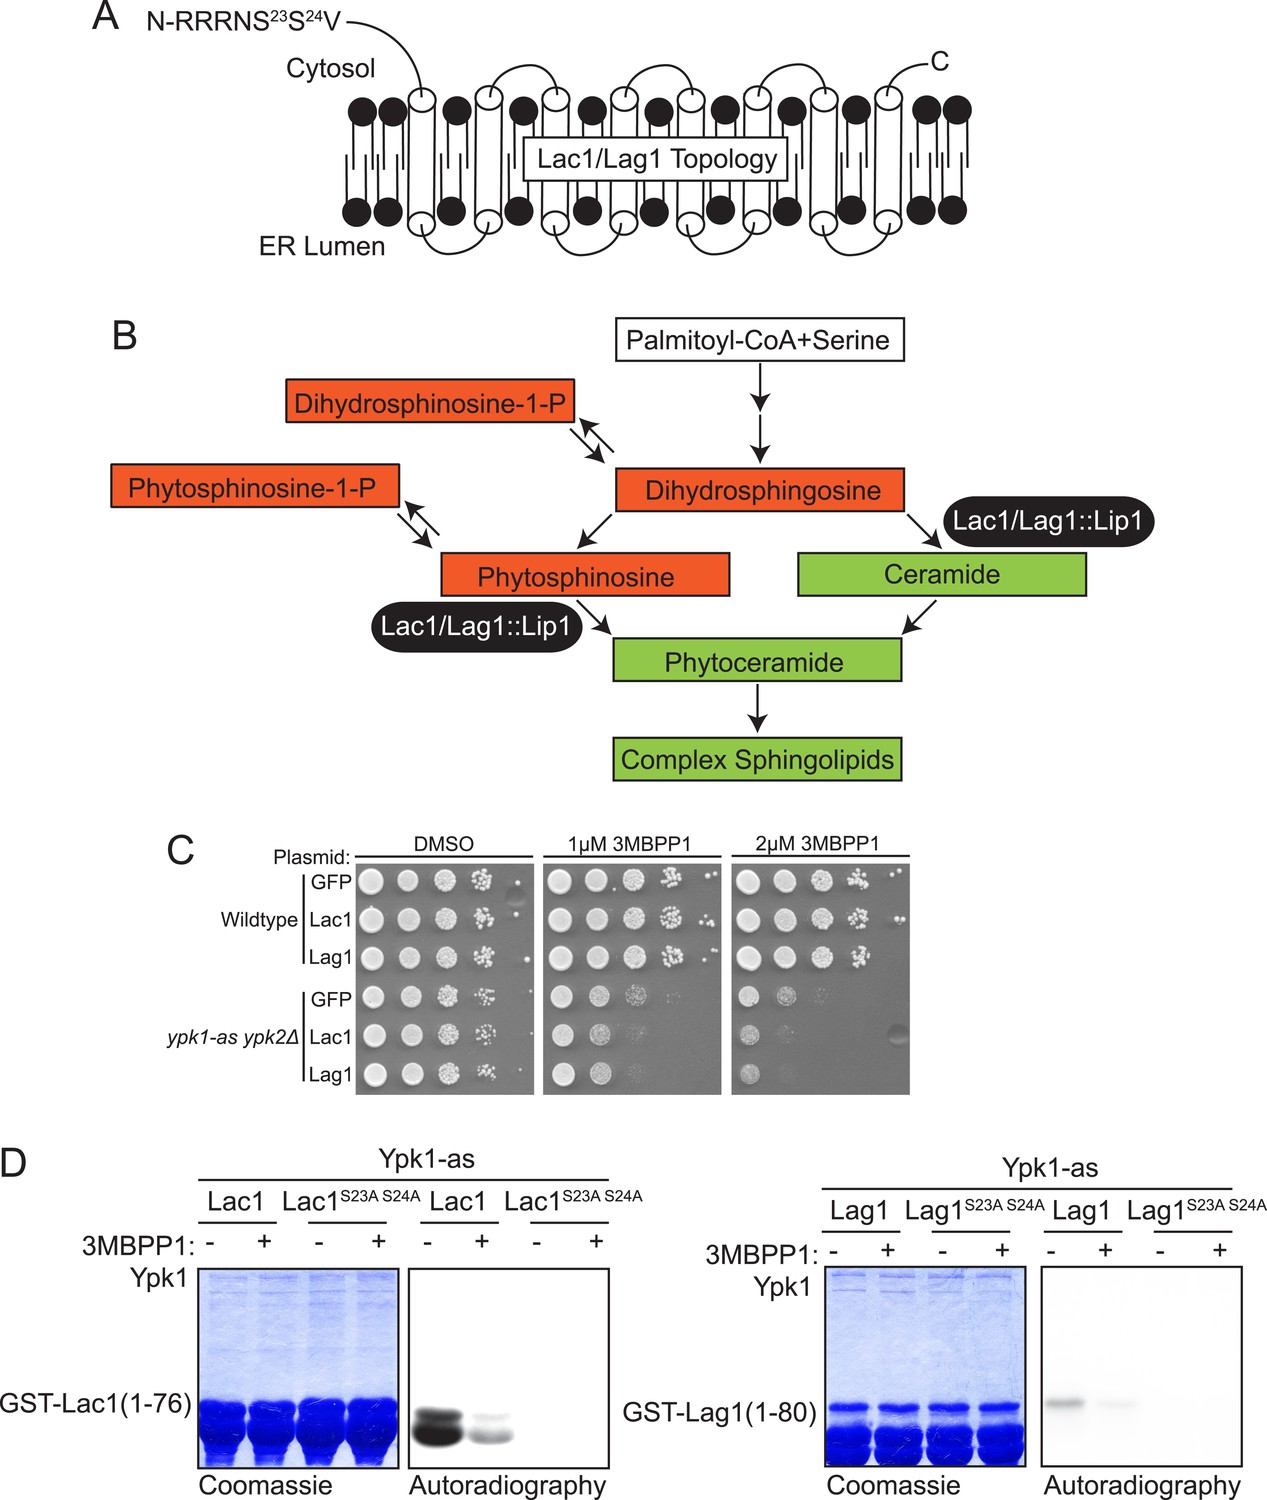
Lac1 and Lag1, subunits of ceramide synthase, were identified by the screen.
(A) A diagram of the membrane topology of Lac1 and Lag1 derived from (Kageyama-Yahara and Riezman, 2006); Lac1 and Lag1 are experimentally determined to have eight transmembrane domains. The N terminus of these proteins is cytosolic and therefore accessible for Ypk1 phosphorylation. (B) Diagram of yeast de novo sphingolipid biosynthesis derived from (Dickson, 2008). Metabolites appear as boxes and enzymes as ovals. Metabolites in green are those directly produced or derived from ceramide synthase while those in red are alternative products at the ceramide synthase branch point. (C) SDL results for Lac1 and Lag1. ypk1-as ypk2Δ (yAM135–A) or wildtype (BY4741) cells were transformed with PGAL1-GFP (negative control), PGAL1-Lac1 or PGAL1-Lag1 plasmids. The SDL assay was then performed as described in ‘Materials and methods’. (D) GST-Lac1(1–76) (pAX131), GST-Lag1(1–80)(pFR29), GST-Lac1(1–76)(S23A S24A)(pAX132) and GST-Lag1(1–80)(S23A S24A)(pAX133) were purified from E. coli and Ypk1-as kinase assays were performed as in Figure 1D.
Figure 3

Ypk1 phosphorylates Lac1 and Lag1 at S23 and S24 in vivo.
(A) 3xHA-Lac1 (yAM165–A) 3xHA-Lac1(S23A S24A) (yAM166–A), 3xFLAG-Lag1 (yAM159–A) and 3xFLAG-Lag1(S23A S24A) (yAM163–A) strains were grown to mid-exponential phase in YPD. Cells were then harvested and whole-cell extracts were prepared. Extracts were split and one fraction was then treated with calf intestinal phosphatase. The extracts resolved by Phos-tag SDS-PAGE and immunoblotted with anti-HA, -FLAG or -Pgk1 (loading control) antibodies. P-Lac1 and P-Lag1 indicate the band corresponding to S23 S24 phosphorylation. * indicates a non-specific band that appears in HA blots of yeast whole cell extracts. (B) Wildtype (BY4741), ypk1Δ (JTY6142) and ypk2Δ (yAM120–A) strains were transformed with a plasmid centromeric plasmid encoding 3xHA-Lac1 expressed under control of its endogenous promoter (pAX136). Cells were grown to mid-exponential phase and then treated with a sublethal dose of myriocin (0.625 μM) or methanol (vehicle) for 2 hr. Cell extracts were then prepared, resolved by Phos-tag SDS-PAGE and blotted as above in (A). (C) TOR2 (yKL04) or tor2-as (yKL05) strains were transformed with a 3xHA-Lac1 expressing plasmid (pAX136). Cells were grown to mid-exponential phase and treated with 1 μM BEZ-235 for the indicated times. Cell extracts were then prepared, resolved by Phostag SDS-PAGE and blotted as above in (A).
Figure 4
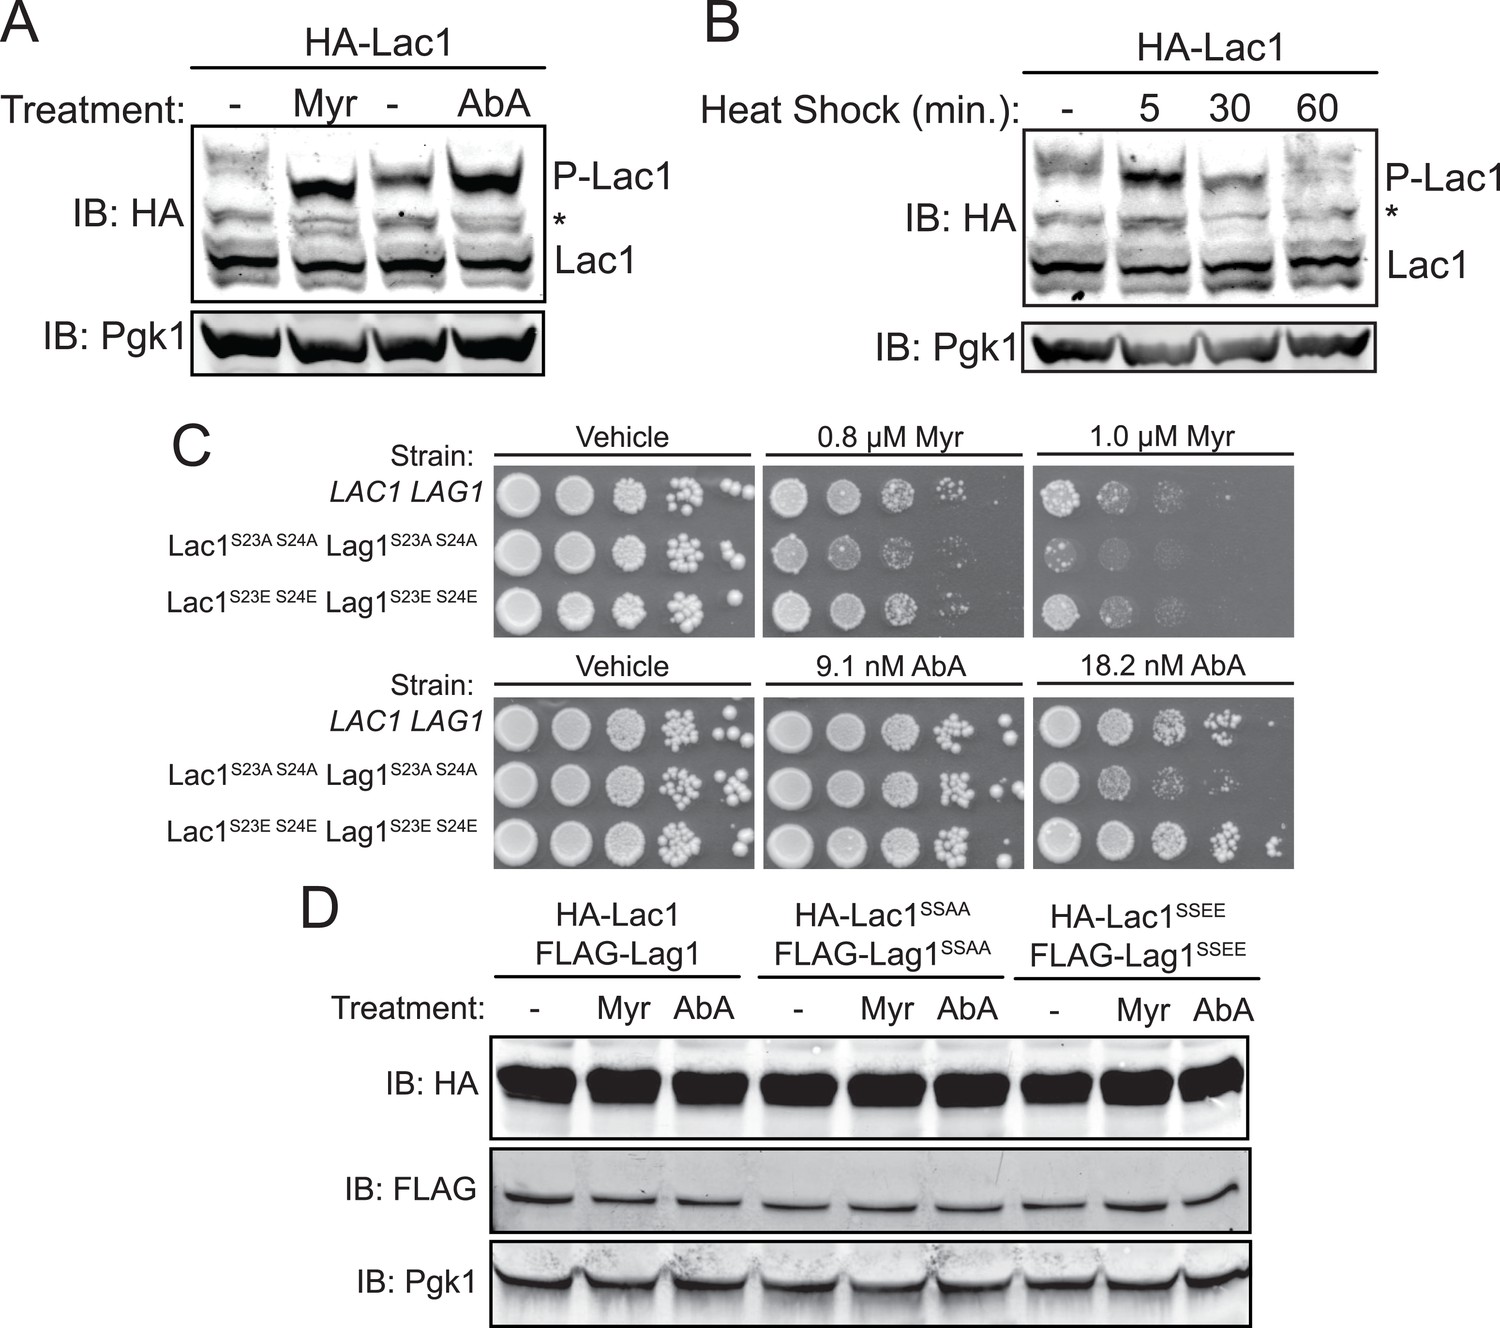
Enhanced Ypk1 phosphorylation of Lac1 and Lag1 under sphingolipid and heat stress.
(A) 3xHA-Lac1 (yAM165–A) cells were grown to early exponential phase in YPD. Cultures were then treated with sublethal doses of myriocin (0.625 μM) or methanol (vehicle) or aureobasidin A (1.8 μM) or ethanol (vehicle) for 2 hr. (B) 3xHA-Lac1 (yAM165–A) cells were grown to exponential phase in YPD at 30°C. A sample of this culture was then harvested. The remaining culture was then moved to 42°C to initiate heat shock and samples were harvested at the indicated time points. Whole cell extracts were prepared from each sample, resolved by Phos-tag SDS-PAGE, and immunoblotted as in Figure 3. P-Lac1 indicates the band corresponding to S23 S24 phosphorylation. * indicates a non-specific band that appears in HA blots of yeast whole cell extracts. (C) LAC1 LAG1 (yAM205–A), Lac1SSAA Lag1SSAA (yAM207B) and Lac1SSEE Lag1SSEE (yAM210) were grown to exponential phase in YPD. Serial dilutions of each culture were made and spotted on YPD plates containing vehicle or the indicated concentration of myriocin or aureobasidin A. Cells were allowed to grow for 3 days at 30°C prior to imaging. (D) 3xHA-Lac1::HIS3 3xFLAG-Lag1::LEU2 (yAM168) 3xHA-Lac1(S23A S24A)::HIS3 3xFLAG-Lag1(S23A S24A)::LEU2 (Lac1SSAA Lag1SSAA) (yAM184) and 3xHA-Lac1(S23E S24E)::HIS3 3xFLAG-Lag(S23E S24E)1::LEU2 (Lac1SSEE Lag1SSEE) (yAM192–A) cells were grown to mid-exponential phase and then treated with 1.0 μM myriocin or 18.2 nM aureobasidin A for 2 hr. Whole cell extracts were prepared from each sample, resolved by SDS-PAGE, and immunoblotted as indicated.
Figure 5
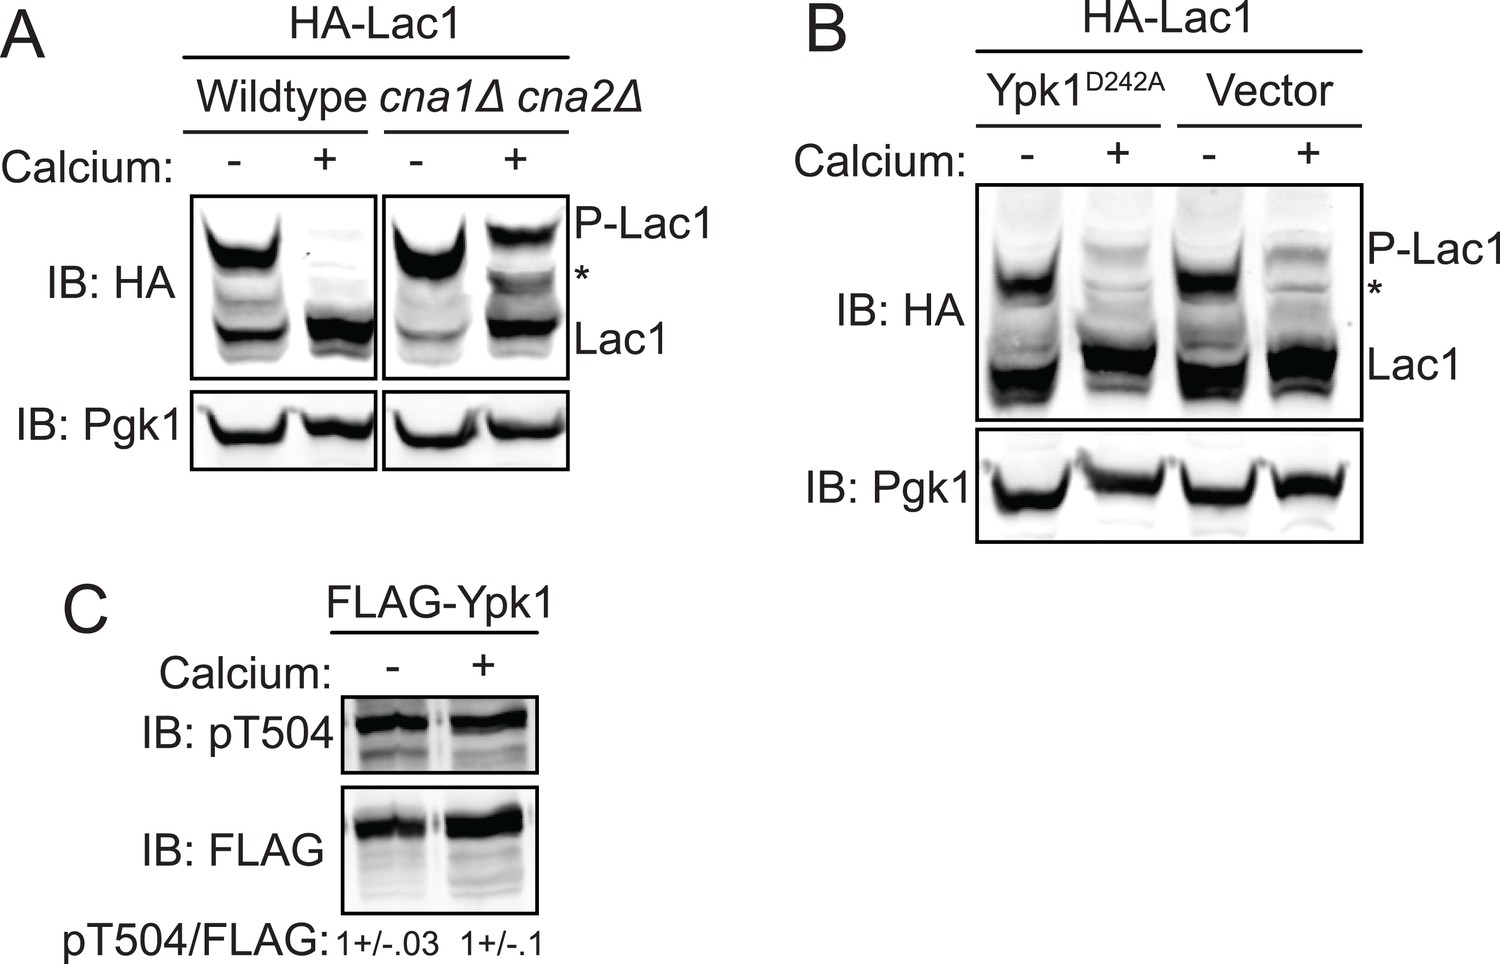
Activation of calcineurin leads to rapid dephosphorylation of Lac1 and Lag1 without affecting Ypk1 function.
(A) Wildtype (BY4741) or cna1Δ cna2Δ (JTY5574) strains were transformed with a centromeric plasmid encoding 3xHA-Lac1 expressed under control of its endogenous promoter (pAX136). Cultures were grown to mid-exponential phase in selective media and then treated with 200 mM CaCl2 for 10 min to activate calcineurin. Cultures were then harvested and whole cell extracts were prepared from each sample, resolved by Phos-tag SDS-PAGE, and immunoblotted as in Figure 3. (B) 3xHA-Lac1 (yAM165-A) cells were transformed with a centromeric plasmid encoding the hyperactive TORC2 independent Ypk1D242A allele expressed under its own promoter (pFR273) or vector (pRS316). Cultures were grown in selective media to mid-exponential phase before treatment with 200 mM CaCl2 for 10 min. Cultures were then harvested and whole cell extracts were prepared from each sample, resolved by Phos-tag SDS-PAGE, and immunoblotted as above. (C) 3xFLAG-Ypk1 (YDB379) cells were grown to mid-exponential phase in YPD. Cultures were treated with or without 200 mM CaCl2 for 10 min. Cells were then harvested and whole extracts prepared. Extracts were resolved by SDS-PAGE and blotted with anti-pSGK(T256), which recognizes Ypk1 T504 activation loop phosphorylation (Roelants et al., 2010) and anti-FLAG antibody (Ypk1 loading control). The blot is representative of triplicate samples and the quantitation of the ratio of pT504/FLAG from these replicates is shown below the blot.
Figure 6

Ypk1 phosphorylation of Lac1 and Lag1 stimulates ceramide synthase activity.
(A) Cultures of LAC1 LAG1 (yAM205–A), Lac1SSAA Lag1SSAA (yAM207B) and Lac1SSEE Lag1SSEE (yAM210) strains were grown to mid-exponential phase and then harvested. Sphingolipids were extracted and analyzed as described in ‘Materials and methods’. Values represent the mean of three independent experiments (each performed in triplicate) and error bars represent SEM. (B) Triplicate exponentially-growing cultures of LAC1 LAG1 (yAM205–A), Lac1SSAA Lag1SSAA (yAM207–B) and Lac1SSEE Lag1SSEE (yAM210) were grown overnight and duplicate cultures were diluted to OD600 = 1.0. Complex sphingolipids were labeled and analyzed by thin layer chromatography (TLC) as in ‘Materials and methods’. A representative TLC plate is shown with the origin at the bottom of the image. The assigned identity of species as IPCs and MIPCs was confirmed by pharmacological or genetic inhibition of the production of these species in control cultures (data not shown). Quantification of total complex sphingolipids was performed in ImageJ by integrating the Phosphorimager screen intensity across the lane for each sample and normalized to 1 for the wild-type ceramide synthase samples. (C) Upper, ceramide synthase was purified by FLAG immunopurification from 3xHA-Lac1::HIS3 3xFLAG-Lag1::LEU2 (yAM168) 3xHA-Lac1(S23A S24A)::HIS3 3xFLAG-Lag1(S23A S24A)::LEU2 (Lac1SSAA Lag1SSAA) (yAM184) and 3xHA-Lac1(S23E S24E)::HIS3 3xFLAG-Lag(S23E S24E)1::LEU2 (Lac1SSEE Lag1SSEE) (yAM192–A) cells. Immunoprecipitates were then split into three fractions and in vitro ceramide synthase assays (60 min reactions) were performed in triplicate. A small sample of each ceramide synthase assay was resolved by SDS-PAGE and immunoblotted. The signal intensity quantified from the immunoblot was then used to normalize ceramide synthase activity in each sample. Lower, ceramide synthase was immunopurified from 3xHA-Lac1::HIS3 3xFLAG-Lag1::LEU2 (yAM168) 3xHA-Lac1(S23A S24A)::HIS3 or 3xFLAG-Lag1(S23A S24A)::LEU2 (Lac1SSAA Lag1SSAA) (yAM184) cells as above except cultures were treated with 1.0 μM myriocin or methanol (vehicle) prior to harvesting. Values represent the mean of three independent experiments (each performed in triplicate) and error bars represent SEM. Statistical significance of values (Student's t test): *p = <0.05, **p = <0.009; and, ***p < 0.0009.
Figure 7
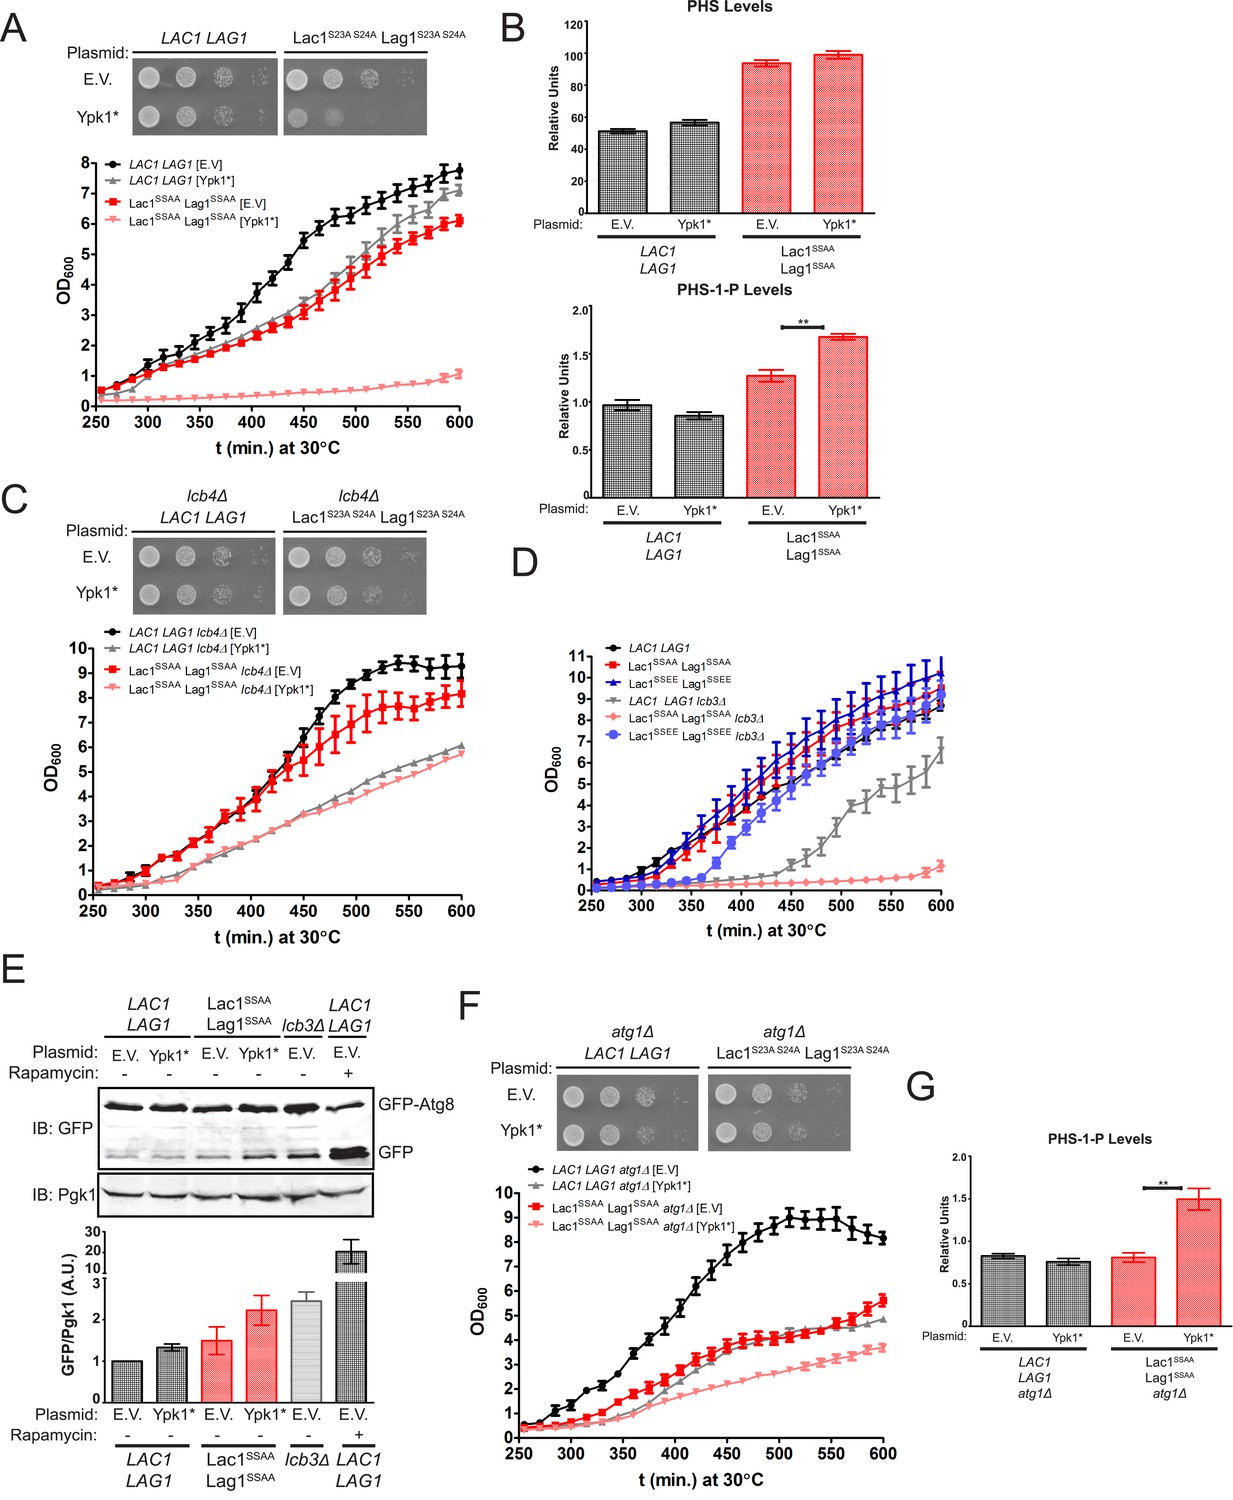
Failure of Ypk1 to upregulate ceramide synthase causes LCBP accumulation that triggers autophagy.
(A) LAC1 LAG1 (yAM205–A) or Lac1SSAA Lag1SSAA (yAM207–B) were transformed with PYPK1-Ypk1D242A (shown as Ypk1*) (pFR273) or empty vector pRS316 (EV). Transformants were grown to exponential phase in synthetic complete medium and then diluted to OD600 = 0.1 and grown in microtiter plates (lower) or on agar plates (upper). For liquid cultures, each was grown in at least quadruplicate and the error bars indicate the SEM of replicates at each time point. (B) Cells from (A) were grown to mid-exponential phase in selective synthetic complete media and then harvested. Sphingolipids were extracted and analyzed as described in ‘Materials and methods’. Values represent the mean of three independent experiments (each performed in triplicate) and error bars represent SEM. (C) LAC1 LAG1 lcb4Δ (yAM237) or Lac1SSAA Lag1SSAA lcb4Δ (yAM238–A) were transformed with Ypk1* (pFR273) and growth experiments performed as in (A). (D) Liquid growth assays were performed as in (A) for LAC1 LAG1 (yAM205–A), Lac1SSAA Lag1SSAA (yAM207–B), Lac1SSEE Lag1SSEE (yAM210), LAC1 LAG1 lcb3Δ (yGT12), Lac1SSAA Lag1SSAA lcb3Δ (yGT13) and Lac1SSEE Lag1SSEE lcb3Δ (yGT14) strains. (E) LAC1 LAG1 (yAM205–A) or Lac1SSAA Lag1SSAA (yAM207–B) or LAC1 LAG1 lcb3Δ (yGT12) strains were transformed with Ypk1* (pFR273) or pRS316 (EV) and additionally PTPI1-GFP-Atg8. Growing cultures treated with vehicle or 2 μg/ml rapamycin for 2 hr and then harvested and whole extracts prepared. Extracts were resolved by SDS-PAGE and blotted with anti-GFP to detect GFP-Atg8 and free GFP arising from GFP-Atg8 autophagic processing and anti-Pgk1 antibody. The blot is representative of triplicate samples and the quantitation of the ratio of free GFP/Pgk1 from these replicates is shown below the blot. (F) LAC1 LAG1 atg1Δ (yAM239–A) or Lac1SSAA Lag1SSAA atg1Δ (yAM240–A) sensitivity to Ypk1* was measured as in (A). (G) Cells from (F) were grown to mid-exponential phase in selective synthetic complete media and then harvested. Sphingolipids were extracted and analyzed as described in (B).
Figure 8
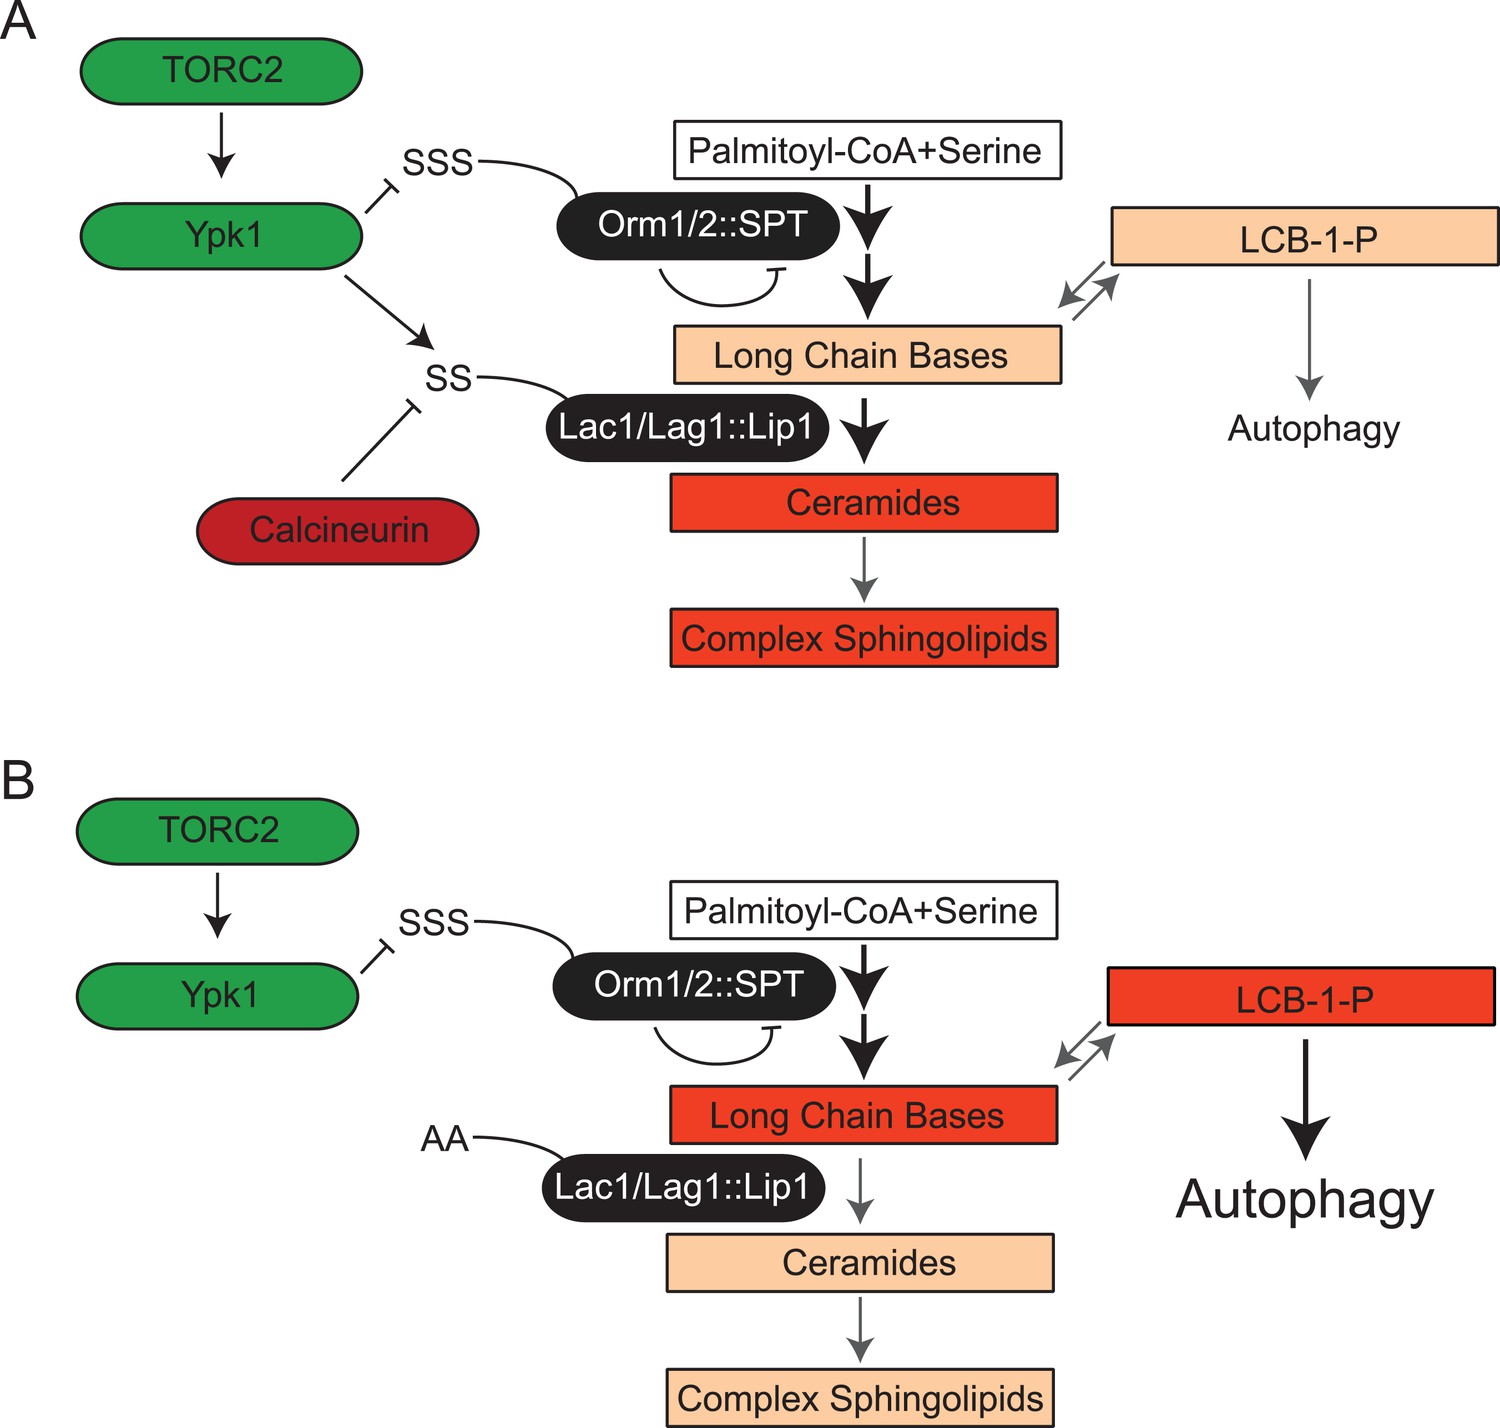
TORC2-Ypk1 signaling globally activates sphingolipid synthesis, selectively directs flux toward ceramide metabolites, and prevents LCBP cross-talk to the autophagy pathway.
(A) Diagram of yeast de novo sphingolipid biosynthesis shown is derived from (Dickson, 2008). Enzymes are in ovals. Metabolites are in boxes. Increased color intensity indicates level of metabolite increase in response TORC2-Ypk1 activation. TORC2-Ypk1 signaling globally activates de novo sphingolipid biosynthesis via derepression of the SPT complex (Roelants et al., 2011; Berchtold et al., 2012; Sun et al., 2012), potentially increasing levels of all metabolites. However, Ypk1 also upregulates ceramide synthesis via phosphorylation of Lac1 and Lag1, thus primarily directing this increased flux towards ceramides and away from LCBs and LCBPs. (B) In the absence of Ypk1 mediated ceramide biosynthesis regulation, increased sphingolipid flux raises LCB and LCBP levels. This slows cell growth by activating autophagy. Thus, TORC2-Ypk1 signaling not only activates sphingolipid biosynthesis in response to stress, but also insulates this flux towards ceramides to prevent metabolite mediated crosstalk to the autophagy machinery.
Tables
Table 1
Known Ypk1 substrates and potential substrates predicted by MOTIPS listed under GO Slim terms*
| Gene | MOTIPS sites | Chemical Sensitivity/YeastMine Interaction(s) | SDL score | Ypk1 dosage rescue | In vitro substrate |
|---|---|---|---|---|---|
| Known Ypk1 Substrates | |||||
| GPD1/YDL022W* | 24P | YeastMine | +++ | N/A | + |
| FPK1/YNR047W | 37, 200, 244, 436, 481 | YeastMine | + | N/A | + |
| FPK1(D621A) [Kinase-dead mutant] | 37, 200, 244, 436, 481 | YeastMine | ++ | N/A | + |
| ORM1/YGR038W | 52, 53 | YeastMine | +++ | N/A | + |
| ORM2/YLR350W | 47, 48 | YeastMine | ++++ | N/A | + |
| Cytoskeleton Organization | |||||
| AVO1/YOL078W | 552P,597,1078 | YeastMine | − | N/A | N/A |
| AVO2/YMR068W | 273P, 305, 407 | YeastMine | − | N/A | N/A |
| BEM2/YER155C | 83, 168, 1810, 1813 | Myr, YeastMine | − | N/A | N/A |
| BNI1/YNL271C | 119, 1138P, 1533 | AbA, Casp, YeastMine | − | N/A | N/A |
| CDH1/YGL003C | 51, 195, 213P | AbA, YeastMine | TOXIC | − | N/A |
| ENT1/YDL161W | 160P | YeastMine | − | N/A | N/A |
| GIC2/YDR309C | 90, 312, 345P | Myr, AbA | − | N/A | N/A |
| LSB3/YFR024C-A | 262P | YeastMine | − | N/A | N/A |
| PAL1/YDR348C | 49P, 391, 436 | AbA, Casp | ++++ | N/A | − |
| SLA1/YBL007C | 445, 447P, 449P, 477 | YeastMine | − | N/A | N/A |
| TSC11/YER093C | 19P, 97, 188 | YeastMine | N/A | N/A | N/A |
| YHR097C | 58, 288P, 294P | Myr | +++ | N/A | +/− |
| YSC84/YHR016C | 274, 374P | Myr, YeastMine | − | N/A | N/A |
| Biological Process Unknown | |||||
| COM2/YER130C | 251, 370, 380 | Myr, YeastMine | − | N/A | N/A |
| ECM3/YOR092W* | 312, 350 | Myr, AbA, YeastMine | − | N/A | N/A |
| ICS2/YBR157C | 14, 95, 136, 172P | Myr | − | N/A | N/A |
| JIP4/YDR475C | 348, 352, 592, 649 | Myr, AbA | N/A | N/A | N/A |
| KKQ8/YKL168C | 83, 113, 144, 146, 212, 293 | YeastMine | − | N/A | N/A |
| RTS3/YGR161C* | 30, 238P | YeastMine | − | N/A | N/A |
| SEG1/YMR086W | 56, 118P, 217, 634, 752P | Myr | + | N/A | N/A |
| YDR186C | 334P, 540P, 542P, 620, 715P | YeastMine | − | N/A | N/A |
| YHR080C | 401, 513, 667 | YeastMine | − | N/A | N/A |
| YNR014W | 54, 115, 156, 197 | YeastMine | +++ | N/A | + |
| YPK3/YBR028C | 72, 73, 90P | Myr, Casp | − | N/A | N/A |
| Transcription from RNA Polymerase II Promoter | |||||
| EPL1/YFL024C | 24, 28, 61 | YeastMine | − | N/A | N/A |
| FKH1/YIL131C | 404 | Myr, YeastMine | TOXIC | − | − |
| GAL11/YOL051W | 1003P | Myr, YeastMine | − | N/A | N/A |
| HCM1/YCR065W* | 80 | AbA, YeastMine | − | N/A | N/A |
| HOT1/YMR172W* | 387, 520, 586 | Myr | − | N/A | N/A |
| RLM1/YPL089C* | 20 | Myr | TOXIC | − | N/A |
| SMP1/YBR182C* | 20, 107 | YeastMine | TOXIC | + | + |
| SSN2/YDR443C | 608P | Myr | − | N/A | N/A |
| YHP1/YDR451C* | 180, 182 | Myr | − | N/A | N/A |
| Mitotic Cell Cycle | |||||
| BCK2/YER167W | 12, 38, 373, 430 | YeastMine | TOXIC | − | N/A |
| ESC2/YDR363W | 114, 143, 145 | YeastMine | − | N/A | N/A |
| PTK2/YJR059W | 59P, 82, 91, 171, 275 | Myr, YeastMine | + | N/A | N/A |
| SET3/YKR029C | 236, 405, 428 | YeastMine | − | N/A | N/A |
| SWI4/YER111C | 816P | Myr, YeastMine | − | N/A | N/A |
| VHS2/YIL135C | 316, 318, 325P | Myr, Casp | − | N/A | N/A |
| ZDS1/YMR273C* | 78, 370 | AbA, YeastMine | − | N/A | N/A |
| ZDS2/YML109W | 183, 267, 345 | YeastMine | − | N/A | N/A |
| Protein Phosphorylation | |||||
| HAL5/YJL165C | 17P, 217P, 233 | YeastMine | − | N/A | N/A |
| KIN1/YDR122W | 652, 791P, 879, 986P | YeastMine | + | N/A | N/A |
| KIN2/YLR096W | 665P, 818, 1020 | Myr | − | N/A | N/A |
| KSP1/YHR082C | 594, 827P, 884P | Myr, AbA, YeastMine | TOXIC | − | N/A |
| NPR1/YNL183C | 125P, 255P, 257P, 317P | YeastMine | ++++ | N/A | − |
| SKY1/YMR216C | 383P | Myr, YeastMine | − | N/A | N/A |
| YAK1/YJL141C | 128P, 206, 240 | Myr, Casp, YeastMine | − | N/A | N/A |
| YPL150W | 371P, 452, 890 | YeastMine | − | N/A | N/A |
| Lipid Metabolic Process | |||||
| ADR1/YDR216W | 180, 230P, 756 | Myr, AbA | − | N/A | N/A |
| CDC1/YDR182W* | 9 | N/A | − | N/A | + |
| CKI1/YLR133W | 14P, 25P, 30P | Myr, AbA, YeastMine | − | N/A | N/A |
| GPT2/YKR067W | 27, 652 | Myr | +++ | N/A | + |
| LAC1/YKL008C* | 23, 24 | Myr, YeastMine | +++ | N/A | + |
| LAG1/YHL003C | 24P | Myr, YeastMine | +++ | N/A | + |
| LCB3/YJL134W | 16P | Myr, YeastMine | − | N/A | + |
| Cellular Ion Homeostasis and Transport | |||||
| AVT3/YKL146W | 55, 59P, 172, 174 | Myr, AbA, YeastMine | − | N/A | N/A |
| CCH1/YGR217W† | 146, 148, 347 | YeastMine | − | N/A | + |
| FPS1/YLL043W | 147, 181, 185, 570P | Myr, YeastMine | +++++ | N/A | + |
| MNR2/YKL064W | 165, 620, 621, 826 | AbA | − | N/A | N/A |
| NHA1/YLR138W* | 544, 830 | Myr, YeastMine | − | N/A | N/A |
| PPZ1/YML016C | 122, 203, 250P | Myr, YeastMine | TOXIC | − | N/A |
| Translation | |||||
| DED1/YOR204W | 84, 576P | YeastMine | − | N/A | N/A |
| HCR1/YLR192C* | 223 | Myr, AbA, YeastMine | − | N/A | N/A |
| HEF3/YNL014W* | 898 | Myr, AbA, YeastMine | − | N/A | N/A |
| RPL3/YOR063W | 24P, 337 | Myr, AbA, YeastMine | − | N/A | N/A |
| SUI2/YJR007W* | 58 | Myr | − | N/A | N/A |
| TEF1/YPR080W* | 72P | Myr | − | N/A | N/A |
| Cell Wall Organization or Biogenesis | |||||
| BPH1/YCR032W | 1334, 1336, 1963 | Casp | − | N/A | N/A |
| CSR2/YPR030W | 61, 103, 525, 987 | Myr | − | N/A | N/A |
| ROM2/YLR371W | 76P, 193p, 396 | YeastMine | − | N/A | N/A |
| SSD1/YDR293C | 164P, 482P, 503 | Myr, AbA, YeastMine | TOXIC | − | N/A |
| Golgi Vesicle Transport | |||||
| BRE5/YNR051C | 398P | Myr, YeastMine | +++ | N/A | − |
| EXO84/YBR102C | 76, 313, 494, 554 | YeastMine | − | N/A | N/A |
| MUK1/YPL070W | 173, 184P, 185P | Myr | +++ | N/A | +/− |
| RGP1/YDR137W | 220, 364P, 450, 452 | YeastMine | − | N/A | N/A |
| Signaling | |||||
| IRA2/YOL081W | 882, 884, 1578, 1745, 3069 | YeastMine | N/A | N/A | N/A |
| GIS3/YLR094C* | 249, 333 | Myr, AbA | − | N/A | N/A |
| MDS3/YGL197W | 757, 824, 842, 851, 1204 | Myr, AbA, YeastMine | +++ | N/A | − |
| SYT1/YPR095C | 277P, 410, 728 | YeastMine | N/A | N/A | N/A |
| DNA Replication | |||||
| CDC13/YDL220C | 314, 333P | YeastMine | TOXIC | − | N/A |
| CTI6/YPL181W | 155, 216P | Myr, YeastMine | − | N/A | N/A |
| RIM4/YHL024W | 93, 429, 525, 607 | YeastMine | − | N/A | N/A |
| Endocytosis | |||||
| ALY2/YJL084C | 166P, 201, 225, 803 | Myr | − | N/A | N/A |
| ROD1/YOR018W | 563, 617, 807, 823 | Myr | +++ | N/A | +/− |
| ROG3/YFR022W | 425, 584, 718 | YeastMine | − | N/A | N/A |
| Other | |||||
| FRT1/YOR324C | 167, 201, 203, 228P, 385 | Myr, YeastMine | − | N/A | N/A |
| HER1/YOR227W | 28P, 102p, 157P | Myr, AbA | TOXIC | − | + |
| YSP2/YDR326C | 326, 518, 1237 | Myr, YeastMine | +++ | N/A | + |
| RNA Catabolic Process | |||||
| JSN1/YJR091C | 174, 275P, 600 | YeastMine | − | N/A | N/A |
| PUF2/YPR042C | 55, 143, 246, 902 | Myr | N/A | N/A | N/A |
| Cytokinesis | |||||
| CYK3/YDL117W | 159, 207P, 746 | AbA, YeastMine | +++ | N/A | − |
| Chromosome Segregation | |||||
| DSN1/YIR010W | 240, 250P | YeastMine | − | N/A | N/A |
| Peroxisome Organization | |||||
| PEX31/YGR004W | 432P | YeastMine | ++ | N/A | + |
| Pseudohyphal Growth | |||||
| PAM1/YDR251W | 471, 553P, 625 | Myr, AbA, Casp, YeastMine | − | N/A | N/A |
| Response to Starvation | |||||
| ATG21/YPL100W | 191, 237P | Myr | +++ | N/A | + |
-
*
Genes that are not bioinformatically predicted Ypk1 substrates, but contain Ypk1 motifs and were included in this study are marked with an asterisk. SDL assay results are listed for each bioinformatically predicted Ypk1 substrate. The scoring system reports growth phenotypes of the ypk1-as ypk2Δ strain transformed with the indicated PGAL1-SUBSTRATE plasmid upon overexpression on galactose with varying levels of 3-MB-PP1-imposed Ypk1-as inhibition. A growth phenotype is defined as at least 1 serial dilution spot less growth than YCpLG-GFP control at the given 3-MB-PP1 concentration. A strong growth phenotype is defined as no growth at the given 3-MB-PP1 concentration. (+++++) indicates a growth phenotype with no 3-MB-PP1. (++++) is a strong growth phenotype on 1 μM 3-MB-PP1. (+++) indicates a growth phenotype on 1 μM 3-MB-PP1. (++) is defined as no phenotype on 1 μM 3-MB-PP1, but a strong growth phenotype on 2 μM 3-MB-PP1. (+) indicates no phenotype on 1 μM 3-MB-PP1, but a detectable growth phenotype on 2 μM 3-MB-PP1. (−) indicates no growth phenotype at any concentration of 3-MB-PP1 tested. TOXIC indicates overexpression of the putative substrate on galactose-containing medium was deleterious to growth even in the wild-type control strain (BY4741). These toxic genes were then tested for Ypk1 dosage rescue (for details, see ‘Materials and methods’); here, (+) indicates that Ypk1 overexpression could at least partially rescue the overexpression toxicity of the indicated gene and (−) indicates that Ypk1 overexpression could not rescue the overexpression toxicity. Lastly, the results of testing the indicated purified predicted Ypk1 target as a substrtate in the in vitro protein kinase assay with purified Ypk1-as; here, (+) indicates that Ypk1-as- dependent (3-MB-PP1 inhibitable) incorporation was detectable for the substrate at a level comparable to incorporation into the positive control [the known Ypk1 substrate, GST-Orm1(1–85)]; (+/−) indicates that readily detectable Ypk1-as-dependent incorporation was found, but at a level lower than that seen for an equivalent amount of GST-Orm1(1–85) protein. (N/A) indicates that the indicated gene product was not tested in the indicated assay.
-
†
The SDL assay was performed with a plasmid constitutively overexpressing CCH1 under the TDH3 promoter [pBCT-CCH1H, (Iida et al., 2007)], as our efforts to generate a PGAL1-CCH1 vector failed.
Table 2
Saccharomyces cerevisiae strains used in this study
| Strain | Genotype | Source/reference |
|---|---|---|
| BY4741 | MATa his3Δ1 leu2Δ0 met15Δ0 ura3Δ0 | Research Genetics, Inc. |
| BY4742 | MATα his3Δ1 leu2Δ0 lys2Δ0 ura3Δ0 | Research Genetics, Inc. |
| yAM135-A | BY4741 Ypk1(L424A)::URA3-ypk2Δ::KanMX4 | This study |
| JTY6142 | BY4741 ypk1Δ::KanMX4 | Research Genetics, Inc. |
| yAM120-A | BY4741 ypk2Δ::KanMX4 | This study |
| yAM159-A | BY4741 3xFLAG-Lag1::LEU2 | This study |
| yAM163-A | BY4741 3xFLAG-Lag1(S23A S24A)::LEU2 | This study |
| yAM165-A | BY4742 3xHA-Lac1::HIS3 | This study |
| yAM166-A | BY4742 3xHA-Lac1 (S23A S24A)::HIS3 | This study |
| JTY5574 | BY4741 cna1Δ::KanMX4 cna2Δ::KanMX4 | M.S. Cyert, Stanford Univ. |
| YDB379 | BY4741 Ypk1-3xFLAG::natNT2 | J.S. Weissman, Univ. of California, San Francisco |
| yAM205-A | BY4742 Lac1::LEU2 Lag1::LEU2 | This study |
| yAM207-B | BY4742 Lac1(S23A S24A)::LEU2 Lag1(S23A S24A)::LEU2 | This study |
| yAM210 | BY4742 Lac1(S23E S24E)::LEU2 Lag1(S23E S24E)::LEU2 | This study |
| yGT12 | BY4742 LYS2+ Lac1::LEU2 Lag1::LEU2 lcb3Δ::natNT2 | This study |
| yGT13 | BY4742 LYS2+ Lac1(S23A S24A)::LEU2 Lag1(S23A S24A)::LEU2 lcb3Δ::natNT2 | This study |
| yGT14 | BY4742 LYS2+ Lac1(S23E S24E)::LEU2 Lag1(S23E S24E)::LEU2 lcb3Δ::natNT2 | This study |
| yAM168 | BY4741 3xHA-Lac1::HIS3 3xFLAG-Lag1::LEU2 | This study |
| yAM184 | BY4741 3xHA-Lac1(S23A S24A)::HIS3 3xFLAG-Lag1(S23A S24A)::LEU2 | This study |
| yAM192-A | BY4741 MET15+ 3xHA-Lac1(S23E S24E)::HIS3 3xFLAG-Lag1(S23E S24E)::LEU2 | This study |
| yKL4 | BY4741 TOR2+::Hygr | Kristin Leskoske, this lab |
| yKL5 | BY4741 Tor2(L2178A)::Hygr | Kristin Leskoske, this lab |
Table 3
Plasmids used in this study
| Plasmid | Description | Source/reference |
|---|---|---|
| pGEX6P-1 | GST tag, bacterial expression vector | GE Healthcare, Inc. |
| pGEX4T-1 | GST tag, bacterial expression vector | GE Healthcare, Inc. |
| YCpLG | CEN, LEU2, PGAL1 vector | (Bardwell et al., 1998) |
| BG1805 | 2 µm, URA3, PGAL1, C-terminal tandem affinity (TAP) tag vector | Open Biosystems, Inc. |
| pRS313 | CEN, HIS3, vector | (Sikorski and Hieter, 1989) |
| pRS316 | CEN, URA3, vector | (Sikorski and Hieter, 1989) |
| pRS416 | CEN, URA3, vector | (Sikorski and Hieter, 1989) |
| pBC111 | CEN, LEU2, vector | (Iida et al., 2007) |
| CHp282 | pRS416 PMET25-GFP | Chau Huynh, this laboratory |
| pLB215 | pRS416 PMET25-Ypk1 | (Niles et al., 2012) |
| pAX53 | pRS416 PMET25-Ypk1(K376A) | This study |
| pAX50 | BG1805 Ypk1(L424A) | This study |
| pFR203 | pGEX4T-1 Orm1(1-85) | (Roelants et al., 2011) |
| pBT6 | pGEX6P-1 Fps1(1-255) | This study |
| pBT7 | pGEX6P-1 Fps1(531-669) | This study |
| pBT12 | pGEX6P-1 Smp1 | This study |
| pAX55 | pGEX6P-1 Lcb3(1-79) | This study |
| pAX56 | pGEX6P-1 Cdc1(1-41) | This study |
| pAX58 | pGEX6P-1 Her1(1-224) | This study |
| pAX59 | pGEX6P-1 Rts3 | This study |
| pAX62 | pGEX6P-1 Fkh1 | This study |
| pAX63 | pGEX6P-1 Yhp1 | This study |
| pAX66 | pGEX6P-1 YNR014W | This study |
| pAX67 | pGEX6P-1 YHR097C | This study |
| pAX94 | pGEX6P-1 Mds3(545-1016) | This study |
| pAX131 | pGEX4T-1 Lac1(1-76) | This study |
| pAX132 | pGEX4T-1 Lac1(1-76)(S23A S24A) | This study |
| pFR291 | pGEX4T-1 Lag1(1-80) | This study |
| pAX133 | pGEX4T-1 Lag1(1-80)(S23A S24A) | This study |
| pAX134 | pGEX6P-1 Muk1(1-305) | This study |
| pAX215 | pGEX6P-1 Cyk3 | This study |
| pAX223 | pGEX6P-1 Gpt2(1-35) | This study |
| pAX224 | pGEX6P-1 Gpt2(570-743) | This study |
| pAX225 | pGEX6P-1 Bre5 | This study |
| pAX226 | pGEX6P-1 Npr1(1-437) | This study |
| pAX227 | pGEX6P-1 Pal1 | This study |
| pAX228 | pGEX6P-1 Ysp2(97-665) | This study |
| pAX229 | pGEX6P-1 Ysp2(1072-1282) | This study |
| pAX230 | pGEX6P-1 Atg21 | This study |
| pAX231 | pGEX6P-1 Pex31(250-462) | This study |
| pAX136 | pRS313 PLAC1-3xHA-Lac1 | This study |
| pFR273 | pRS316 PYPK1-Ypk1(D242A) | (Roelants et al., 2011) |
| pAX250 | pRS313 PTPI1-GFP-Atg8 | This study |
| pBCT-CCH1H | pBC111 PTDH3-Cch1 | (Iida et al., 2007) |
Download links
A two-part list of links to download the article, or parts of the article, in various formats.
Downloads (link to download the article as PDF)
Open citations (links to open the citations from this article in various online reference manager services)
Cite this article (links to download the citations from this article in formats compatible with various reference manager tools)
TORC2-dependent protein kinase Ypk1 phosphorylates ceramide synthase to stimulate synthesis of complex sphingolipids
eLife 3:e03779.
https://doi.org/10.7554/eLife.03779


