A clathrin coat assembly role for the muniscin protein central linker revealed by TALEN-mediated gene editing
- University of Pittsburgh School of Medicine, United States
- Washington University School of Medicine, United States
Figures
Figure 1
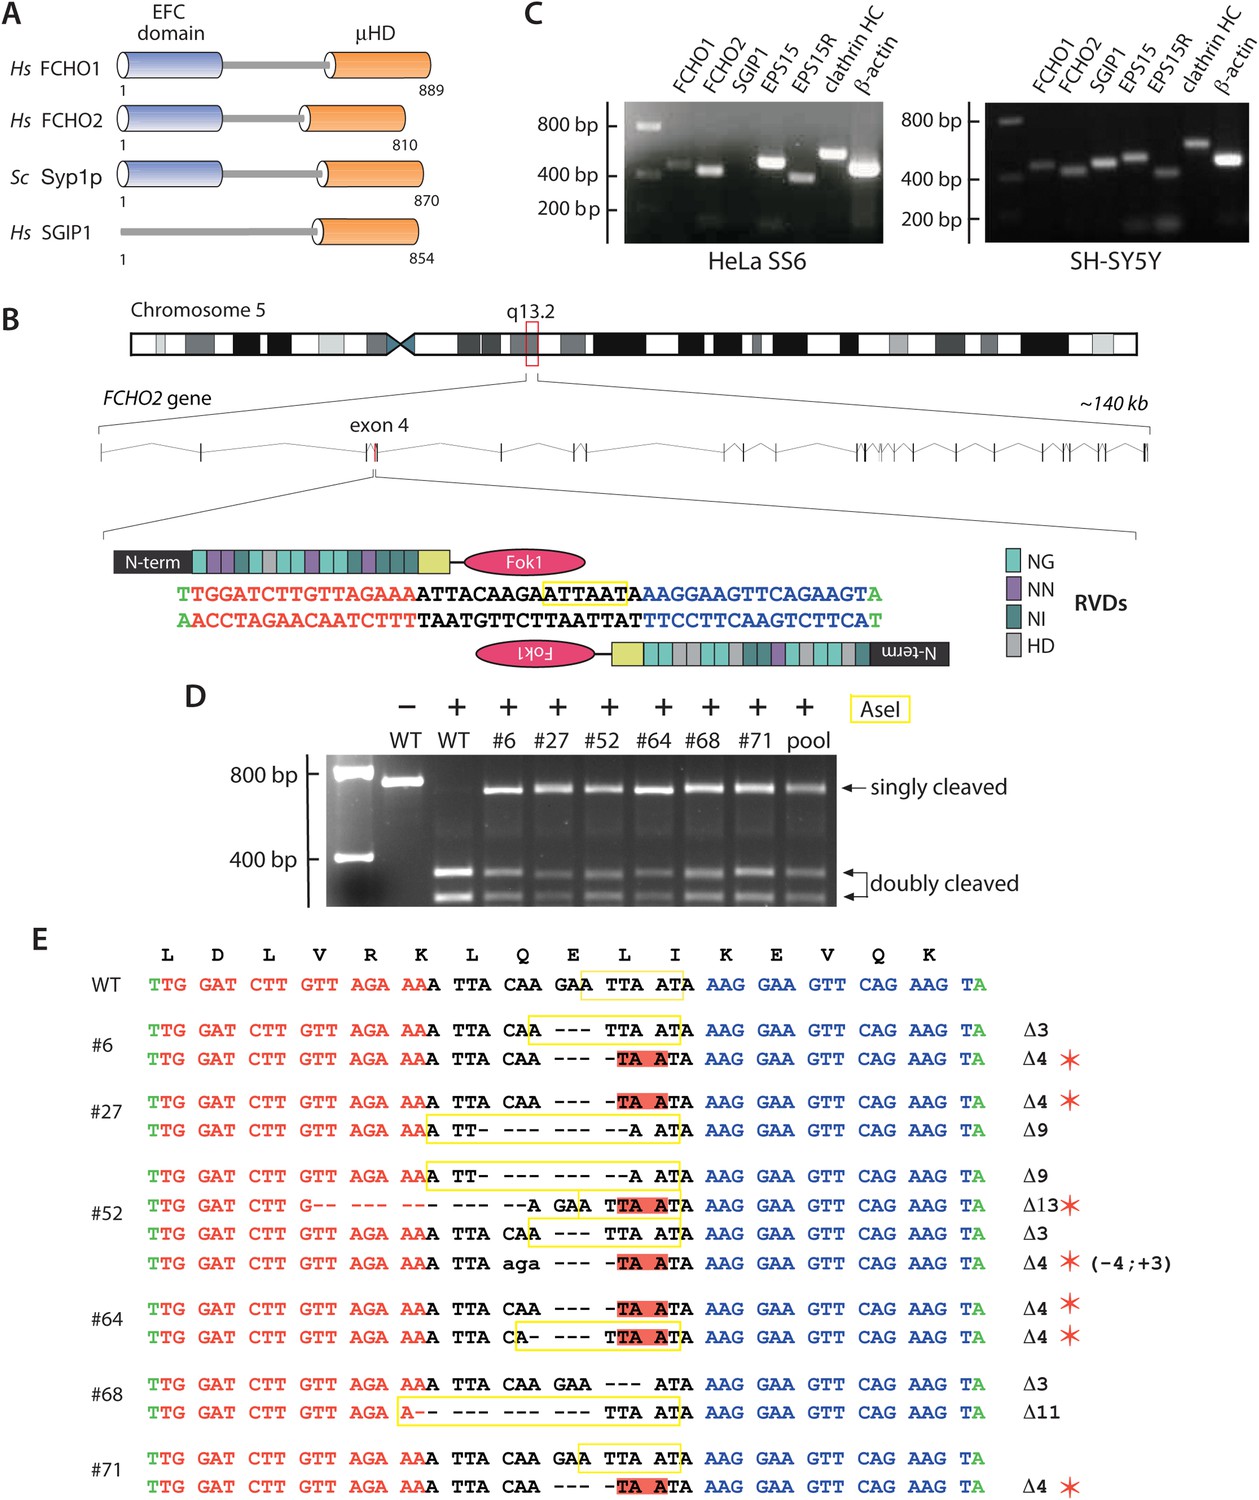
Gene editing the FCHO2 locus in HeLa cells.
(A) Domain arrangement of Homo sapiens (Hs) and S. cerevisiae (Sc) muniscin family proteins. The crescent-shaped EFC domain (Extended FCH (Fer/Cip4 homology) domain) is alternatively designated the F-BAR domain due to an overall structural homology of the α-helical anti-parallel EFC dimer to the BAR (Bin1/amphiphisin/Rvs) domain family of proteins. (B) Chromosomal location and genomic organization of the FCHO2 gene with pertinent details of TALEN design. The repeat variable di-residues (RVD) selective for the different deoxyribonucleotides are color-coded (single letter amino acid notation). The endogenous AseI recognition sequence within the targeted exon is boxed (yellow). (C) Gene-specific RT-PCR analysis of various endocytic protein and control mRNA transcripts in the parental HeLa SS6 and neuroblastoma SH-SY5Y cells. HC; heavy chain. (D) AseI restriction enzyme digestion of FCHO2 gene-specific PCR amplicons from genomic DNA extracted from wild-type (WT) and TALEN-treated clones. The undigested parental (HeLa) PCR product and digested PCRs are shown. The ‘pool’ designates a PCR reaction from a genomic DNA sample of TALEN-transfetced HeLa cells prior to clone selection. The AseI nuclease generates three PCR DNA fragments; the 55-bp band is not visible on these gels but causes the shift in the singly-cleaved product to 645 bp. (E) Genomic sequence analysis of TALEN clones. TALEN generated insertions (lower case letters) and deletions are indicated in relation to the WT nucleotide and amino acid sequences. AseI restriction sites are boxed (yellow) and in-frame stop codons are highlighted (red) and identified with a red asterisk.
Figure 2

FCHO2-nullizygous HeLa cells exhibit abnormal clathrin-coated structures at the plasma membrane.
(A) Whole cell lysates from wild-type (WT) HeLa SS6 cells and TALEN clones #6, #27, #52, #64, #68 and #71 were analyzed by SDS-PAGE. Duplicate immunoblots were probed with polyclonal antibodies directed against FCHO2, the AP-2 μ2 subunit and epsin 1. (B and C) Selected but representative confocal optical sections of HeLa SS6 cells either mock transfected (B) or transfected with FCHO2 transcript-targeting siRNA oligonucleotides (Umasankar et al., 2012) (C). Fixed cells were stained with a mAb directed against the AP-2 α subunit (AP.6, green) and affinity purified antibodies against DAB2 (red). (D–K) HeLa SS6 cells (D) or the indicated TALEN-treated clones (E–K) were fixed and stained with mAb AP.6 (green) and affinity purified antibodies directed EPS15 (red). Color-separated channels from a portion of the micrograph of clone #64 cells (H) are presented (I). Scale bar: 10 μm.
Figure 3
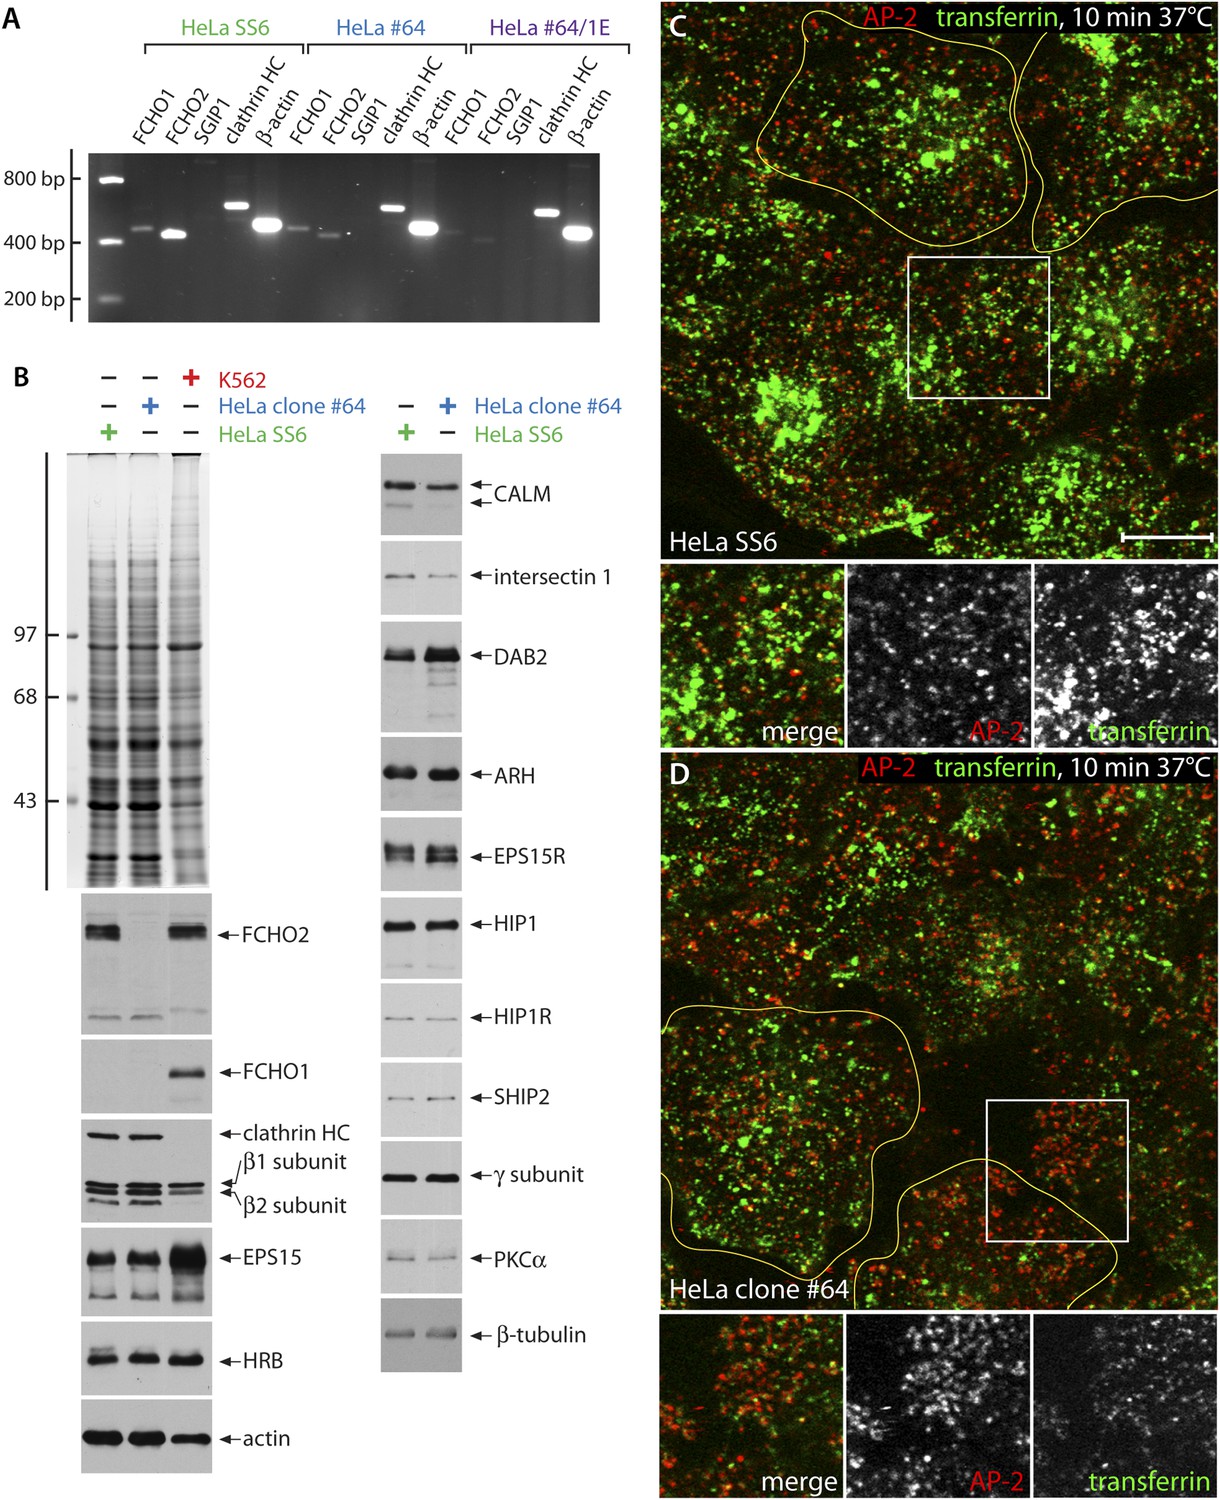
Characterization of FCHO2-null HeLa clone #64 cells.
(A) Semi-quantitiative RT-PCT analysis of muniscin protein transcripts in parental HeLa SS6, clone #64 and clone#64/1.E cells. The same PCR primers as in Figure 1C were used. HC; heavy chain. (B) Whole cell lysates from HeLa SS6, clone #64 and K562 cells were resolved by SDS-PAGE and either stained with Coomassie blue or transferred to nitrocellulose. Replicate blots were probed with antibodies specific for the indicated proteins. Positions of the molecular mass standards (in kDa) are indicated on the left. (C and D). After incubation at 37°C for 60 min in serum-free medium, cover slip-attached HeLa SS6 (C) or clone #64 cells (D) were pulsed for 10 min with Alexa Fluor488-labelled transferrin (green). After chilling on ice and washing with ice-cold PBS, the cells were fixed and stained for AP-2 (red) with the α-subunit specific mAb AP.6. Representative single confocal optical sections focused on a medial region, rich in transferrin-positive endosomal structures, are shown, with color-separated channels of the boxed regions shown below. Scale bar: 10 μm.
Figure 4 with 1 supplement
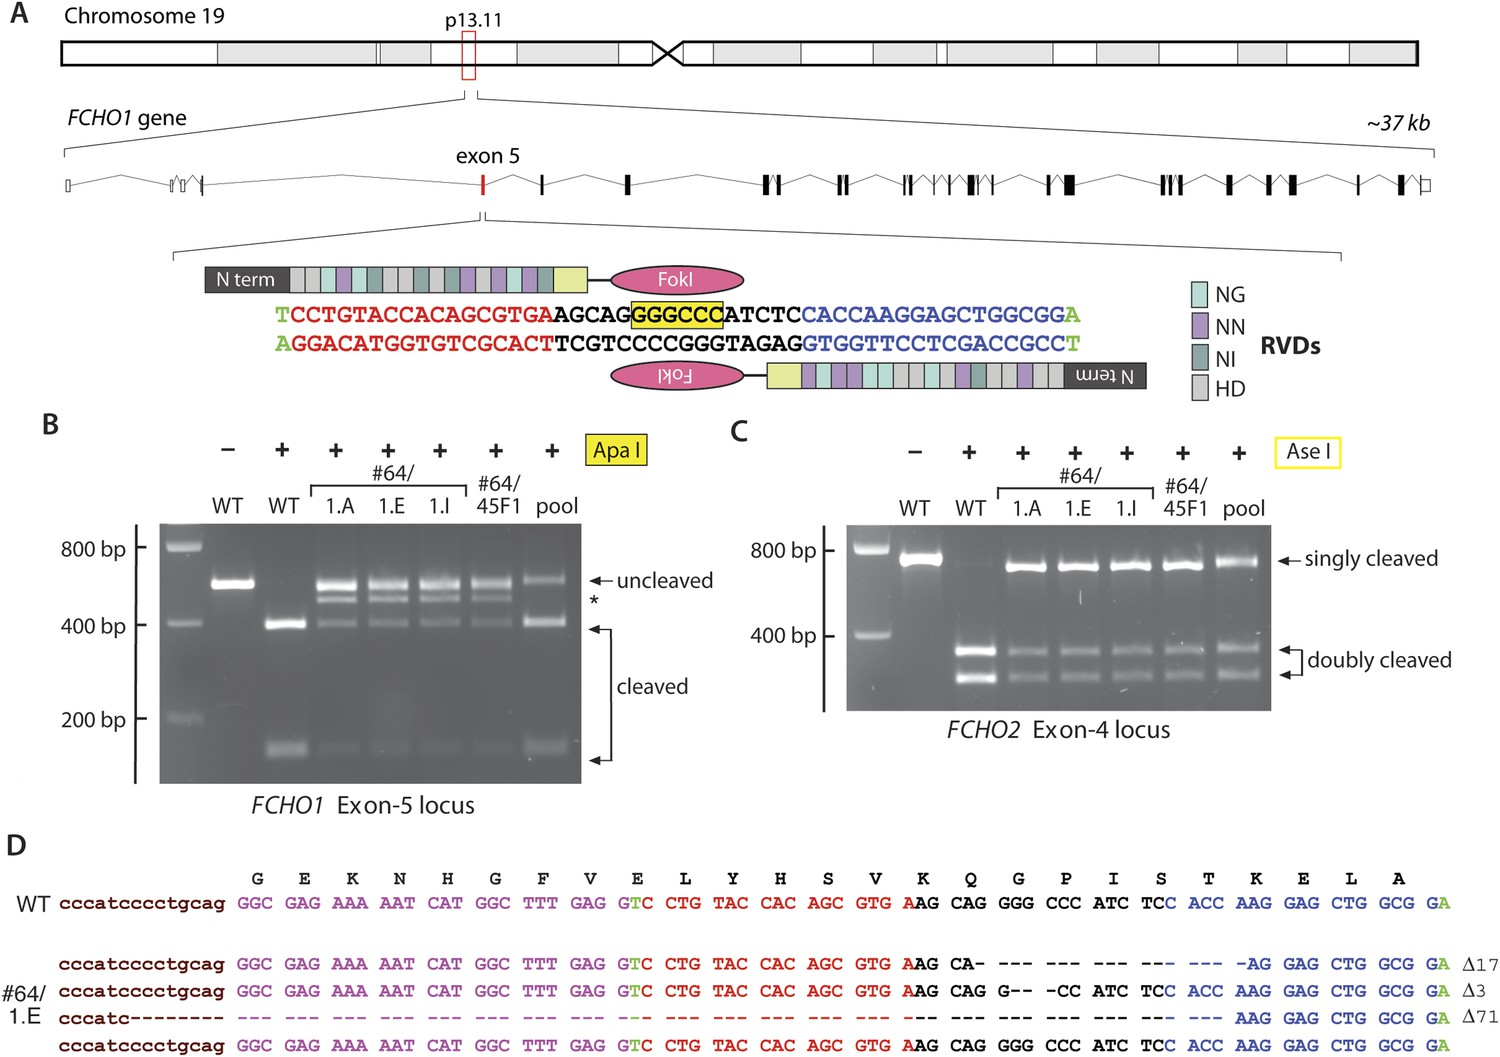
TALEN targeting of the FCHO1 locus in HeLa clone #64 cells.
(A) Chromosomal location and genomic organization of the FCHO1 gene with pertinent details of TALEN design. The repeat variable diresidues (RVD) selective for the different deoxynucleotides are color-coded (single letter amino acid notation). The position of the internal ApaI restriction site within the targeted exon is highlighted (yellow). (B) ApaI restriction digest analysis of exon-specific FCHO1 PCR products from parental wild-type (WT) HeLa SS6 and selected FCHO1-targeting TALEN pair transfected cell lines. The PCR product marked with an asterisk represents the 71-bp deletion allele in the #64/45F1 line and derived subclones. The pool PCR was prepared from genomic DNA isolated from the TALEN-transfected population of clone #64 HeLa cells before clone selection. (C) AseI digests of FCHO2 amplicons to verify the FCHO2−/− genotype of all the second- and third-round clones. (D) Sequencing results from PCR product amplified from genomic DNA extracted from clone #64/1.E cells. As indicated by the ApaI digest (B), all the clones derived from clone #64/45F1 have the identical genotype.
Figure 4—figure supplement 1
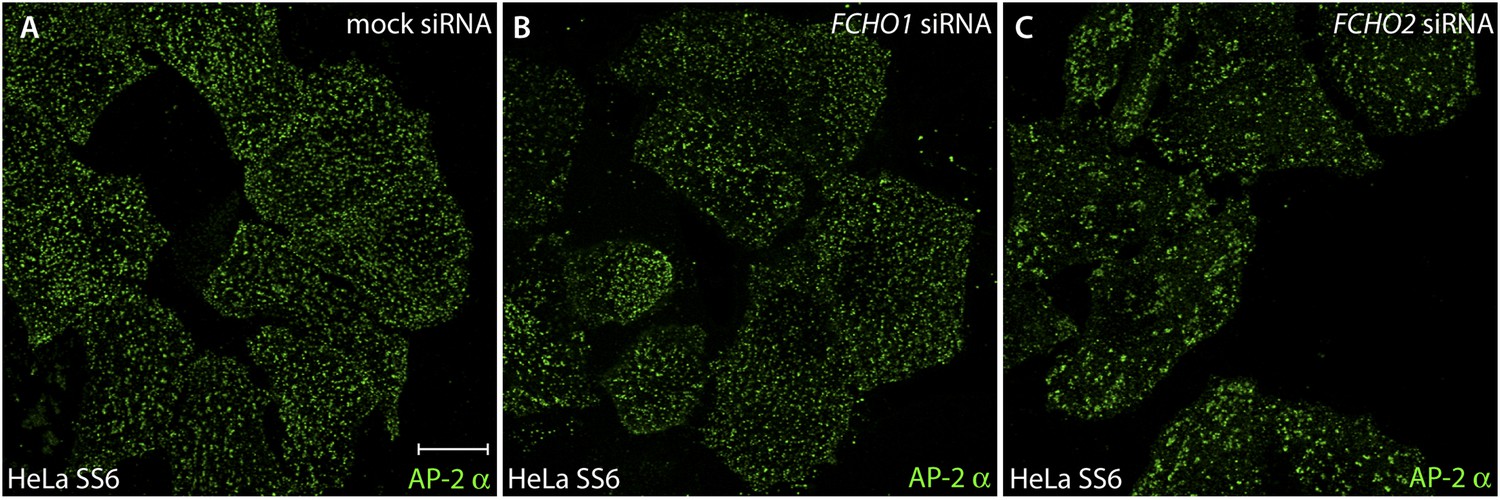
FCHO1 transcript silencing does not alter the arrangement of surface clathrin-coated structures.
(A–C) HeLa SS6 cells were either mock transfected (A) or transfected with siRNA oligonucleotides directed against the FCHO1 (B) or FCHO2 (C) mRNA (Umasankar et al., 2012). Silenced cells were fixed and stained with an antibody (mAb AP.6) against the α subunit of the AP-2 adaptor complex. Note that the randomly-scattered similarly-sized clathrin-coated structures typical of control HeLa SS6 cells are also present in FCHO1-silenced cells. The FCHO2-depleted cells exhibit the characteristic enlarged and more sparsely arrayed clathrin patches, analogous to FCHO2 gene-edited HeLa cone #64 cells. The efficacy of FCHO1 and FCHO2 transcript silencing using this siRNA protocol has been documented (Umasankar et al., 2012).
Figure 5
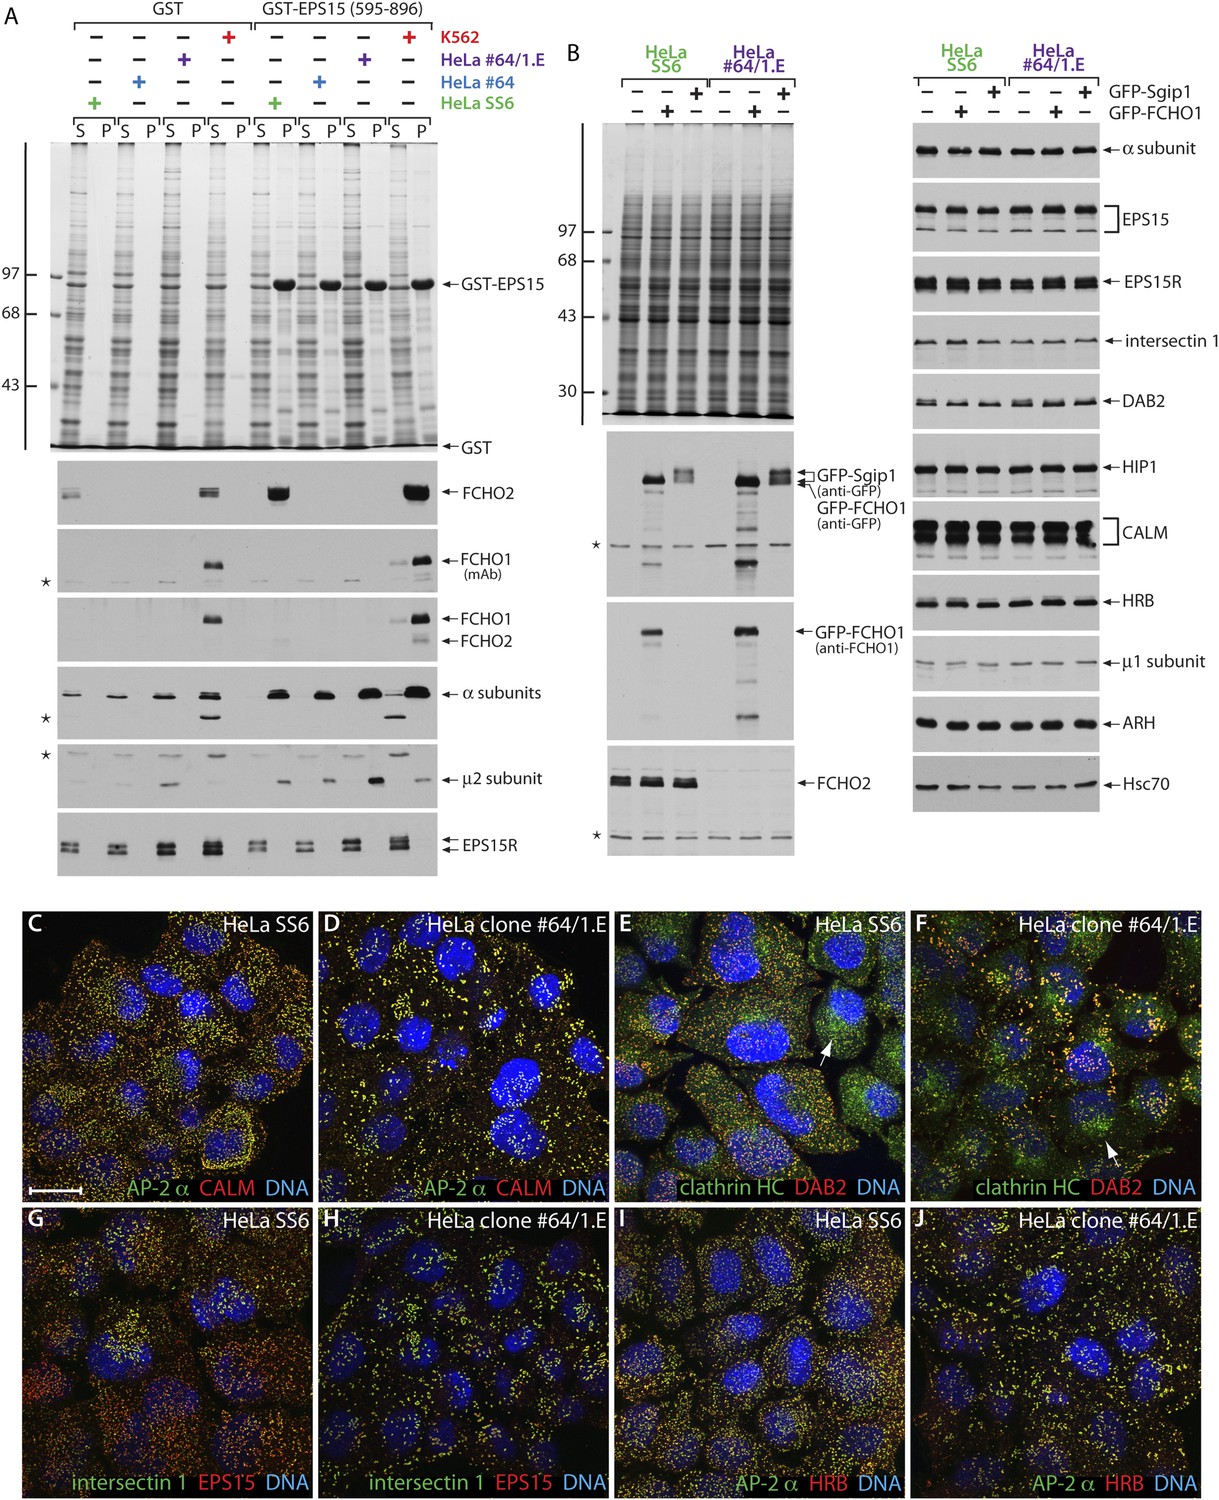
HeLa clone #64/1.E cells have undetectable levels of muniscin proteins.
(A) Samples of 100 μg of GST or GST-EPS15 (595–896) prebound to glutathione-Sepharose beads were incubated with cell lysates from HeLa SS6, clone #64, clone #64/1.E and K562 cells. After washing, aliquots of the supernatant (S) and pellet (P) fractions were resolved by SDS-PAGE and stained with Coomassie blue or replicates transferred to nitrocellulose. Positions of the molecular mass standards (in kDa) are shown. Results from both an anti-FCHO1 mAb directed against the μHD and an affinity-purified polyclonal raised against the EFC domain and weakly cross-reactive with FCHO2 are shown. (B) Parental HeLa SS6 or clone #64/1.E cells, mock transfected or transfected with plasmid DNA encoding GFP-FCHO1 or GFP-Sgip1 as indicated, were collected after 16 hr and whole cell lysates subject to SDS-PAGE analysis. Gels were either stained with Coommassie blue or transferred to nitrocellulose. Duplicate blots were probed with designated antibodies. Positions of the molecular mass standards (in kDa) are shown. (C–J) Representative images of HeLa SS6 (C, E, G, I) or HeLa clone #64/1.E (D, F, H, J) cells after immunolabeling with anti-AP-2 mAb AP.6, affinity-purified anti-CALM antibodies, anti-clathrin heavy chain (HC) mAb X22, affinity purified anti-DAB2 antibodies, anti-intersectin 1 mAb , affinity-purified anti-EPS15 antibodies, and anti-HRB serum. Arrows indicate the Golgi/endosomal population of clathrin present in both control and clone #64/1.E HeLa cells. Scale bar: 10 μm.
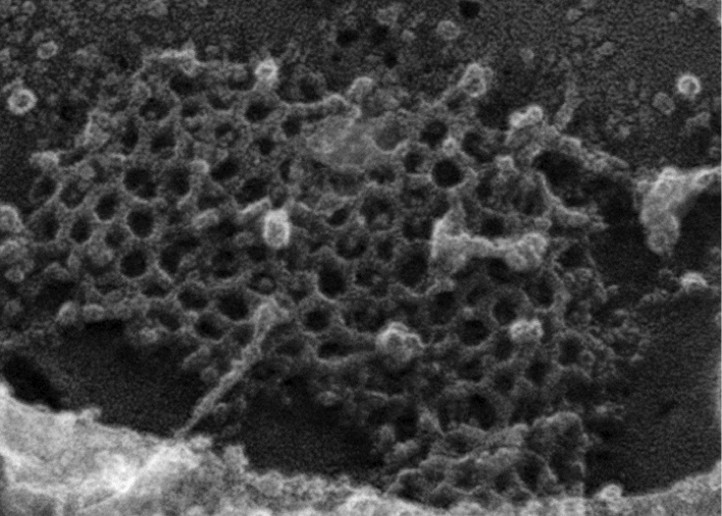
Figure 6 with 1 supplement

Ultrastructural analysis of gene-edited clone #64/1.E cell clathrin lattices.
(A–E) Selected but representative deep etch-EM replicas revealing the glass-attached ventral surface of control HeLa SS6 (A and B) or clone #64/1.E (C–E) cells. Polyhedral clathrin assemblies are pseudocolored purple. Higher magnification views of control (B) and 1.E (E) cells highlight irregular assembly of clathrin trimers in the absence of FCHO1 and FCHO2. The numerous surface-attached spherical buds in (D) are caveolae not clathrin-coated structures; they completely lack a characteristic polyhedral coat. Scale bars: 500 nm in A, C and D; 100 nm in B and E.
Figure 6—figure supplement 1
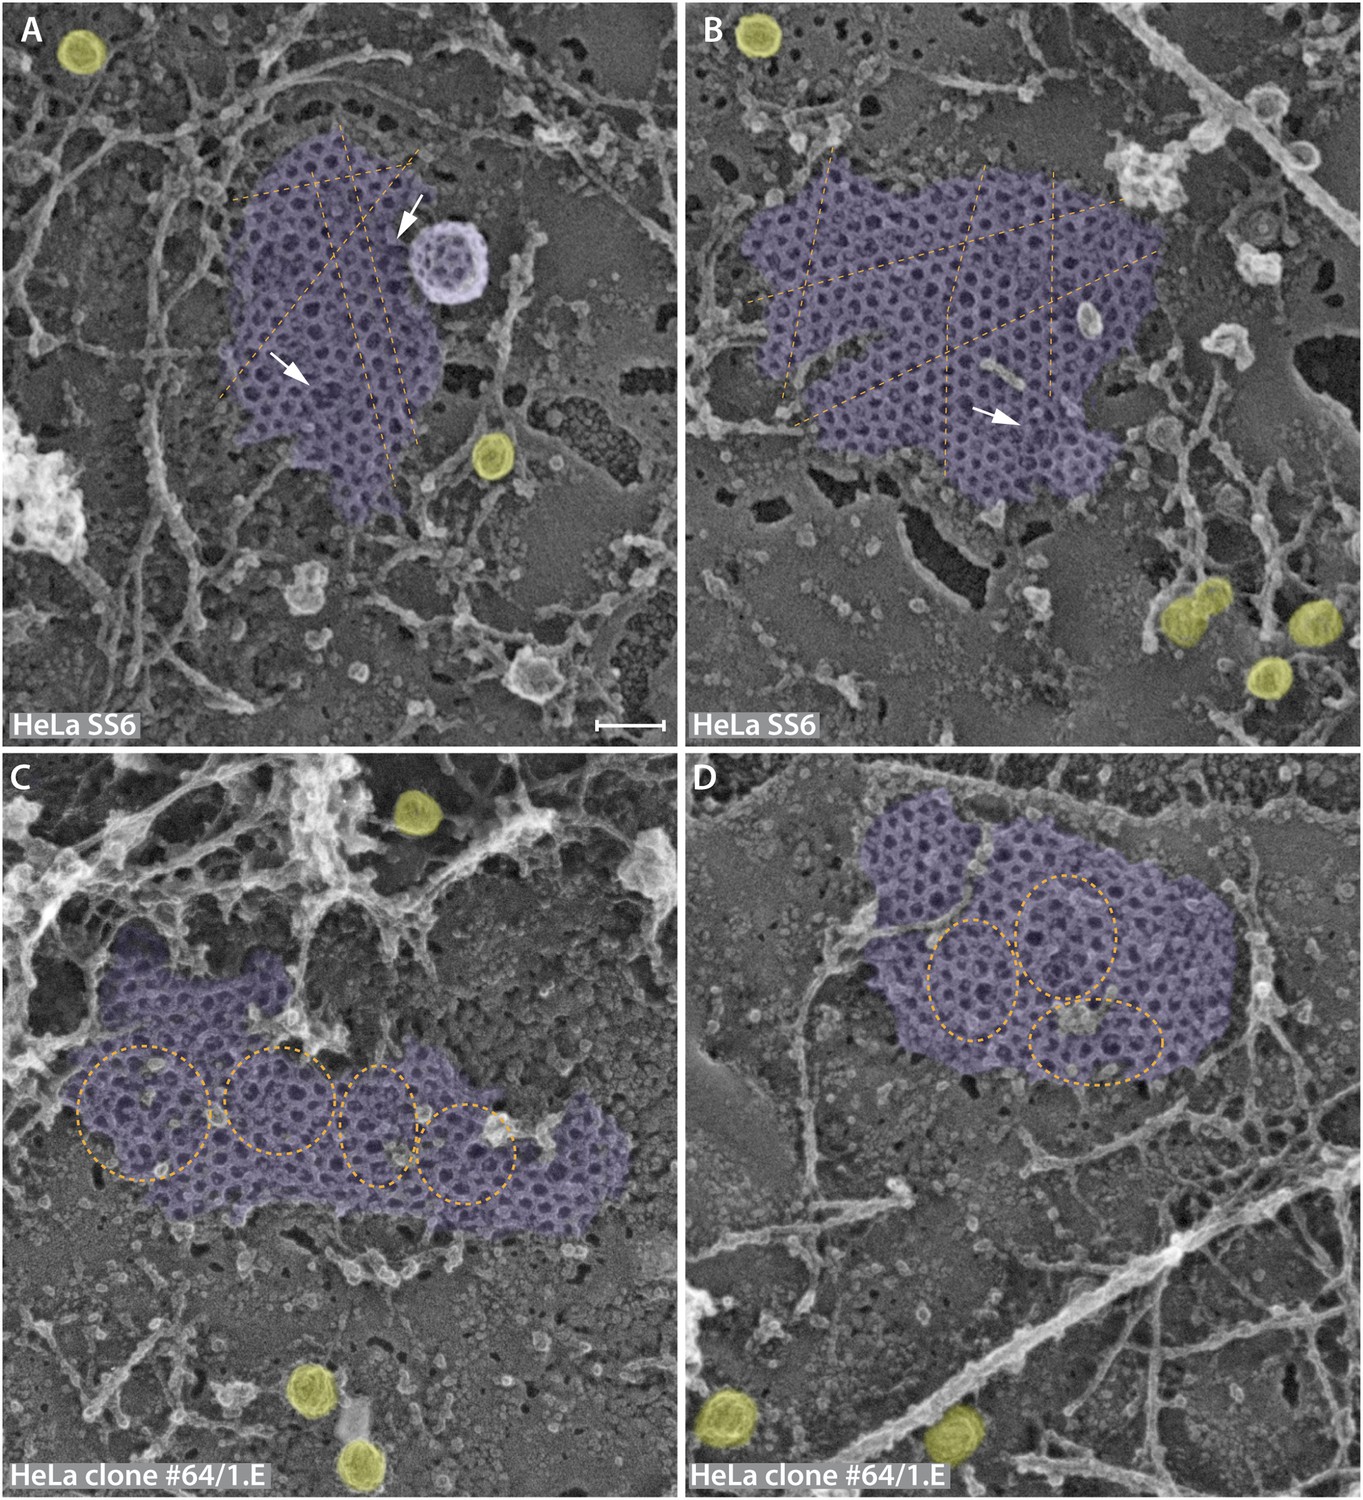
Lattice assembly defects in the FCHO1/2-depleted HeLa clone #64/1.E cell line.
(A–D) Similarly sized planar clathrin lattice regions from freeze-etch replicas of HeLa SS6 control (A and B) or HeLa clone #64/1.E cells (C and D) representative of the population of clathrin-coated structures in each cell line. Clathrin assemblages are pseudocolored purple while caveolae, with the characteristic striated surface, are colored yellow. The regular arrangement of parental flat lattices (A and B) is illustrated with superimposed broken lines (orange), highlighting the parallel arrangement of adjacent rows of clathrin polyhedra. By contrast, in the FCHO1/2-deficient clone #64/1.E cells (C and D) there are geometric abnormalities within the planar assemblies (orange spheres and ellipses) and linear columns of adjacent polyhedra are frequently twisted within the lattice. Areas of polygonal discontinuity do occur in the HeLa SS6 cell lattices, but these appear typically where the lattice begins to invaginate from the adjoining planar region or two planar sections adjoin (arrows). Scale bar: 100 nm.
Figure 7 with 1 supplement
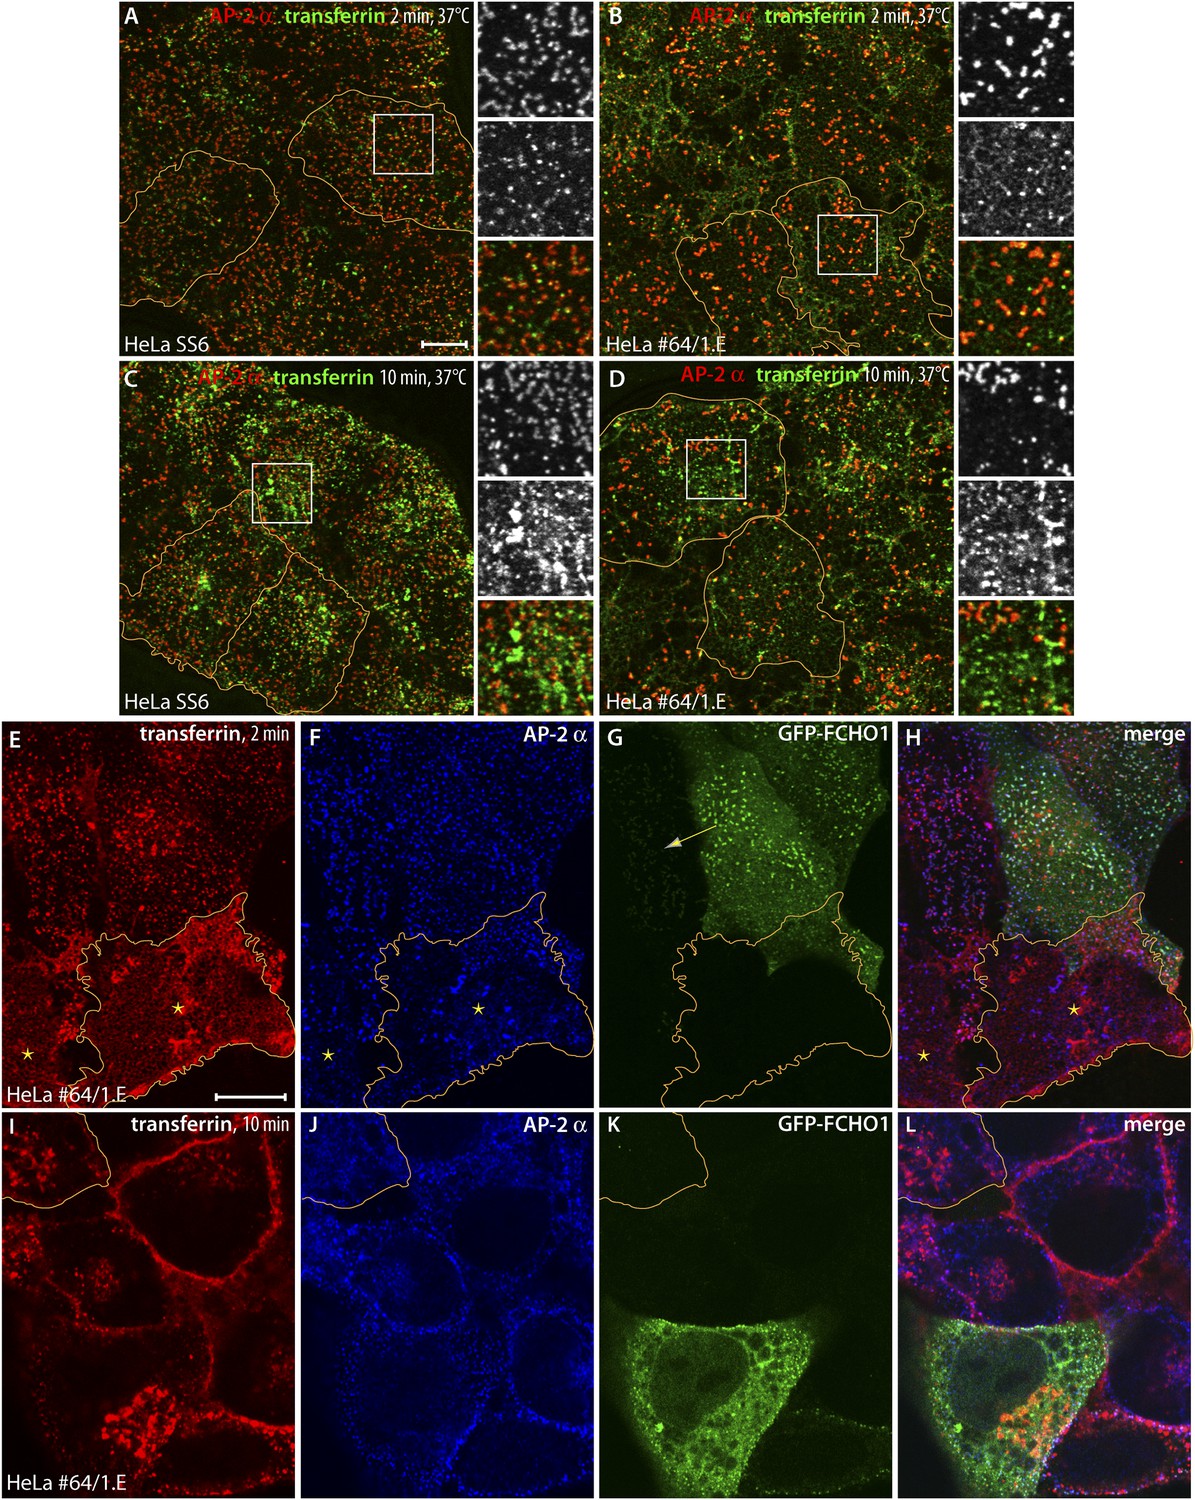
Clathrin-dependent cargo internalization in HeLa clone #64/1.E cells.
(A and B) Representative confocal optical sections of HeLa SS6 (A) or clone #64/1.E (B) cells incubated with 25 μg/ml Alexa Fluor488-conjugated transferrin (green) for 2 min at 37°C before washing on ice. Fixed cells were stained with the anti-AP-2 α subunit mAb AP.6 (red). The borders of some cells in the field are outlined (orange) and color-separated views of the boxed regions are shown on the right. Scale bar (for A–D): 10 μm. (C and D) Analogous images from control HeLa SS6 (C) or clone #64/1.E cells (D) after a 10-min pulse of transferrin. (E–H) Confocal image of adherent ventral region of HeLa clone #64/1.E cells transiently transfected with GFP-FCHO1 (1-889) (green) before addition of a 2-min pulse of 25 μg/ml Alexa Fluor568-labeled transferrin (red) as in A and B. Fixed cells were immunolabeled for AP-2 with mAb AP.6 (blue). A cell in each field is outlined (orange) and a low GFP-FCHO1 expressing cell (arrow) and adjacent untransfected FCHO1/2-depleted cells (asterisks) are indicated. Scale bar (for E–L): 10 μm. (I–L) Medial plane optical section of GFP-FCHO1 (1–889) transfected HeLa clone #64/1.E cells following a 10-min pulse of transferrin. The perimeter of a non-complemented clone #64/1.E cell is indicated (orange).
Figure 7—figure supplement 1
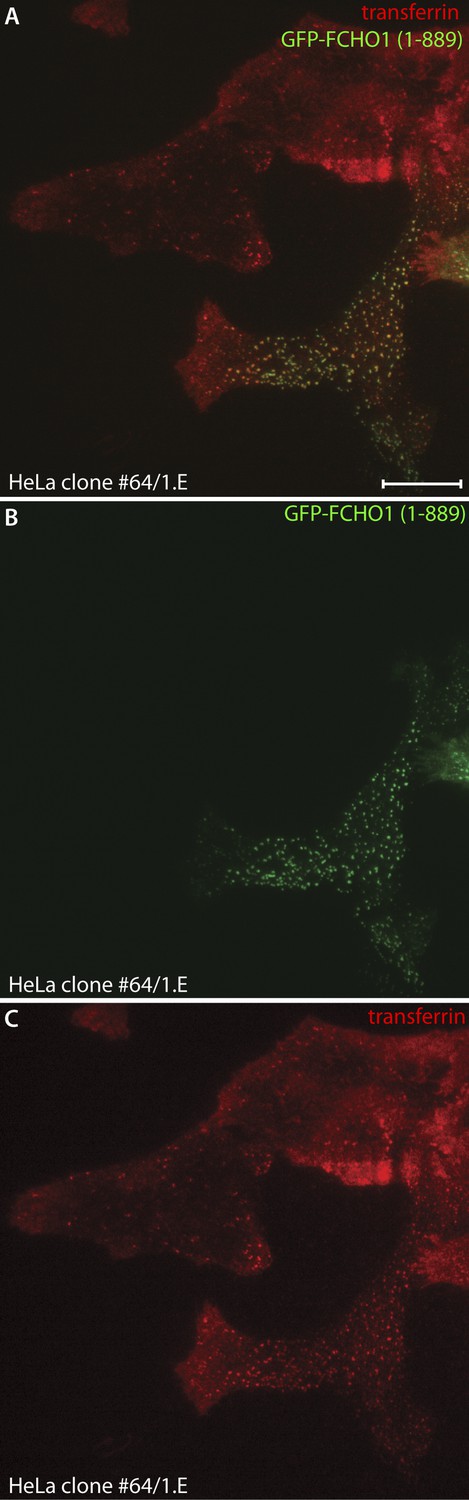
Reconstitution of transferrin capture within clathrin-coated structures in HeLa clone #64/1.E cells.
(A–C) HeLa clone 1.E cells transiently transfected with full-length GFP-FCHO1 (1–889) (green) were observed by total internal fluorescence microscopy after addition of 25 μg/ml Alexa Fluor568 transferrin (red). A single representative frame from the time-lapse sequence is shown. Compared with the gene-edited cells, FCHO1 expressing cells rapidly concentrate labeled transferrin at the more numerous reconstituted ventral clathrin assemblies. Scale Bar: 10 μm.
Figure 8 with 2 supplements
The muniscin unstructured linker sector regulates clathrin-coated structure topology.
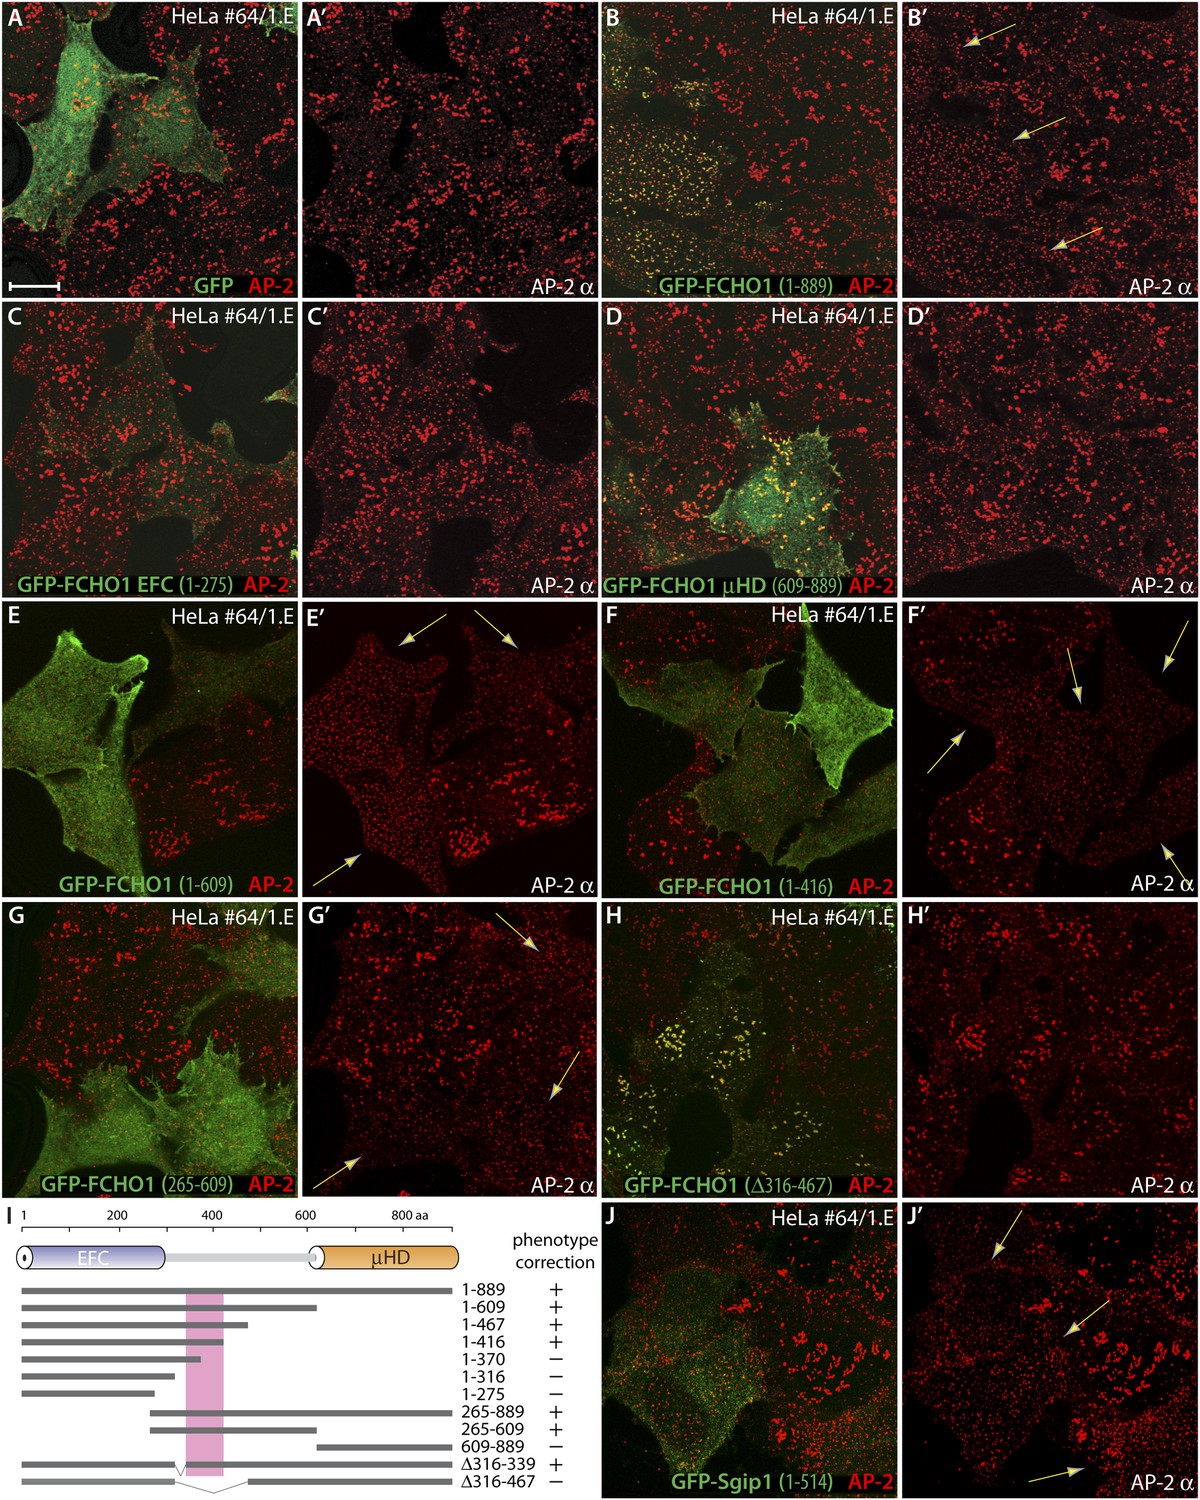
(A–H′) Representative single confocal optical sections of HeLa clone #64/1.E cells transiently transfected with GFP (A and A′), GFP-FCHO1 (1–889) (B and B′), GFP-FCHO1 EFC domain (1–275) (C and C′), GFP-FCHO1 μHD (609–889) (D and D′), GFP-FCHO1 (1–609) (E and E′), GFP-FCHO1 (1–416) (F and F′) GFP-FCHO1 (265–609) (G and G′) or GFP-FCHO1 (1–889; Δ316–467) (H and H′). Fixed cells were stained for AP-2 using the anti-AP-2 α-subunit mAb AP.6. Merged channel images (A–H) and the corresponding AP-2 α subunit channel alone (A′–H′) are shown. Transgene-dependent refashioning of the irregular 1.E cell clathrin-coated structures to a more uniformly dispersed pattern is indicated (arrows). Scale bar for all panels: 10 μm. (I) Cartoon diagram of the overall domain organization of FCHO1 with the relative locations of the various N-terminally-tagged truncation and deletion constructs tested shown schematically. The minimal region necessary to correct the surface clathrin morphology is boxed. (J–J′) Selected confocal section of HeLa clone #64/1.E cells transfected with GFP-Sgip1 (1–514) analyzed as in (A–H′).
Figure 8—figure supplement 1
Comparative expression of GFP-tagged FCHO1 protein fragments in HeLa cells.
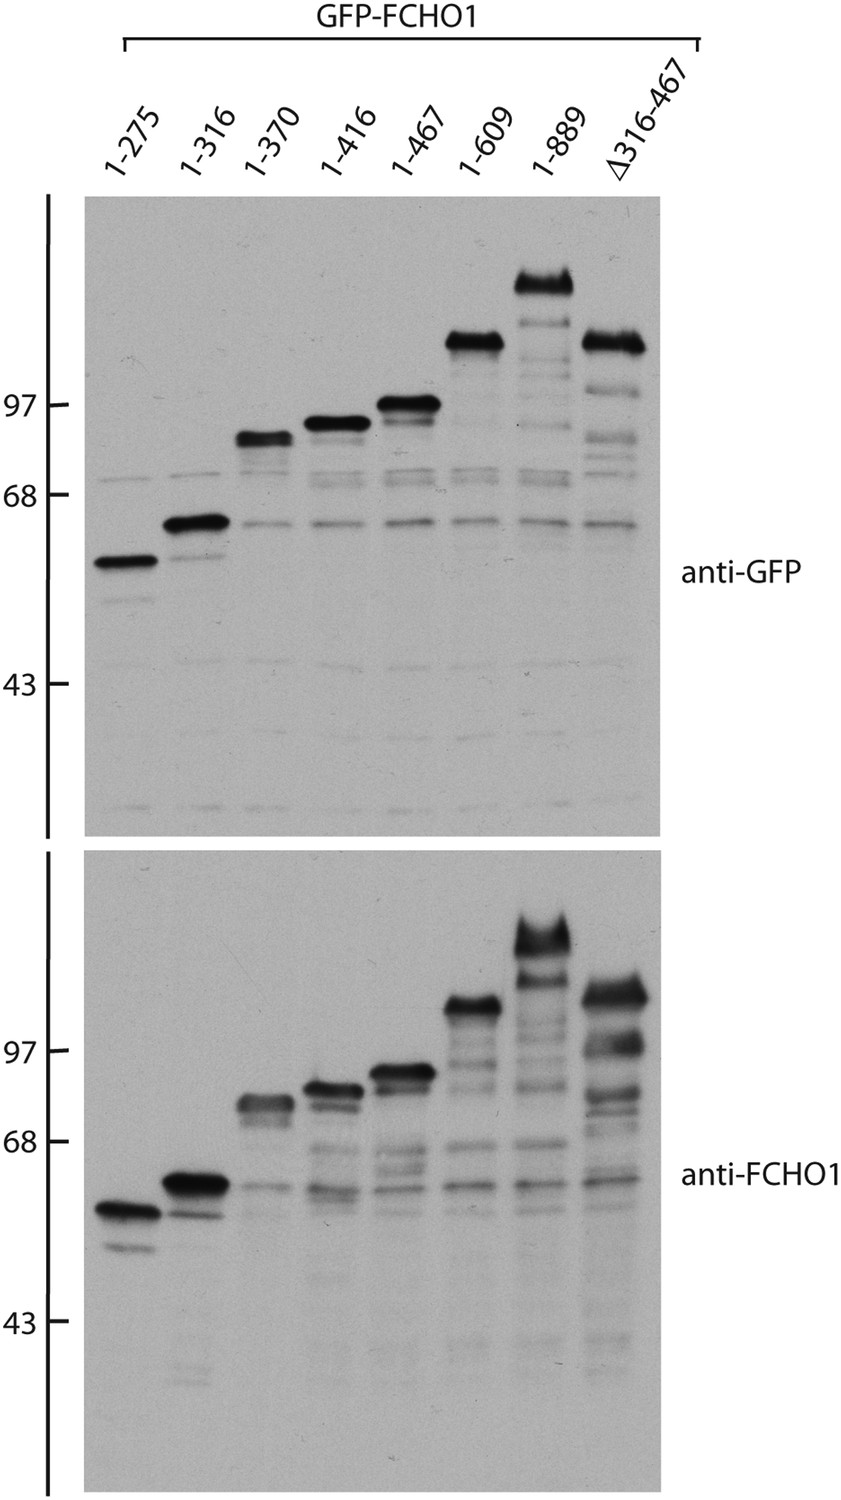
Total cell lysates from HeLa SS6 cells transiently transfected with the indicated GFP-tagged FCHO1 protein fusions were resolved by SDS-PAGE and transferred in duplicate to nitrocellulose. Blots were probed with either affinity-purified anti-GFP or affinity-purified anti-FCHO1 EFC domain antibodies. Positions of the molecular mass standards (in kDa) are shown on the left.
Figure 8—figure supplement 2
Oversized and clumped clathrin-coated structures in MCF-7 cells are normalized by ectopic FCHO1 or FCHO2 expression.
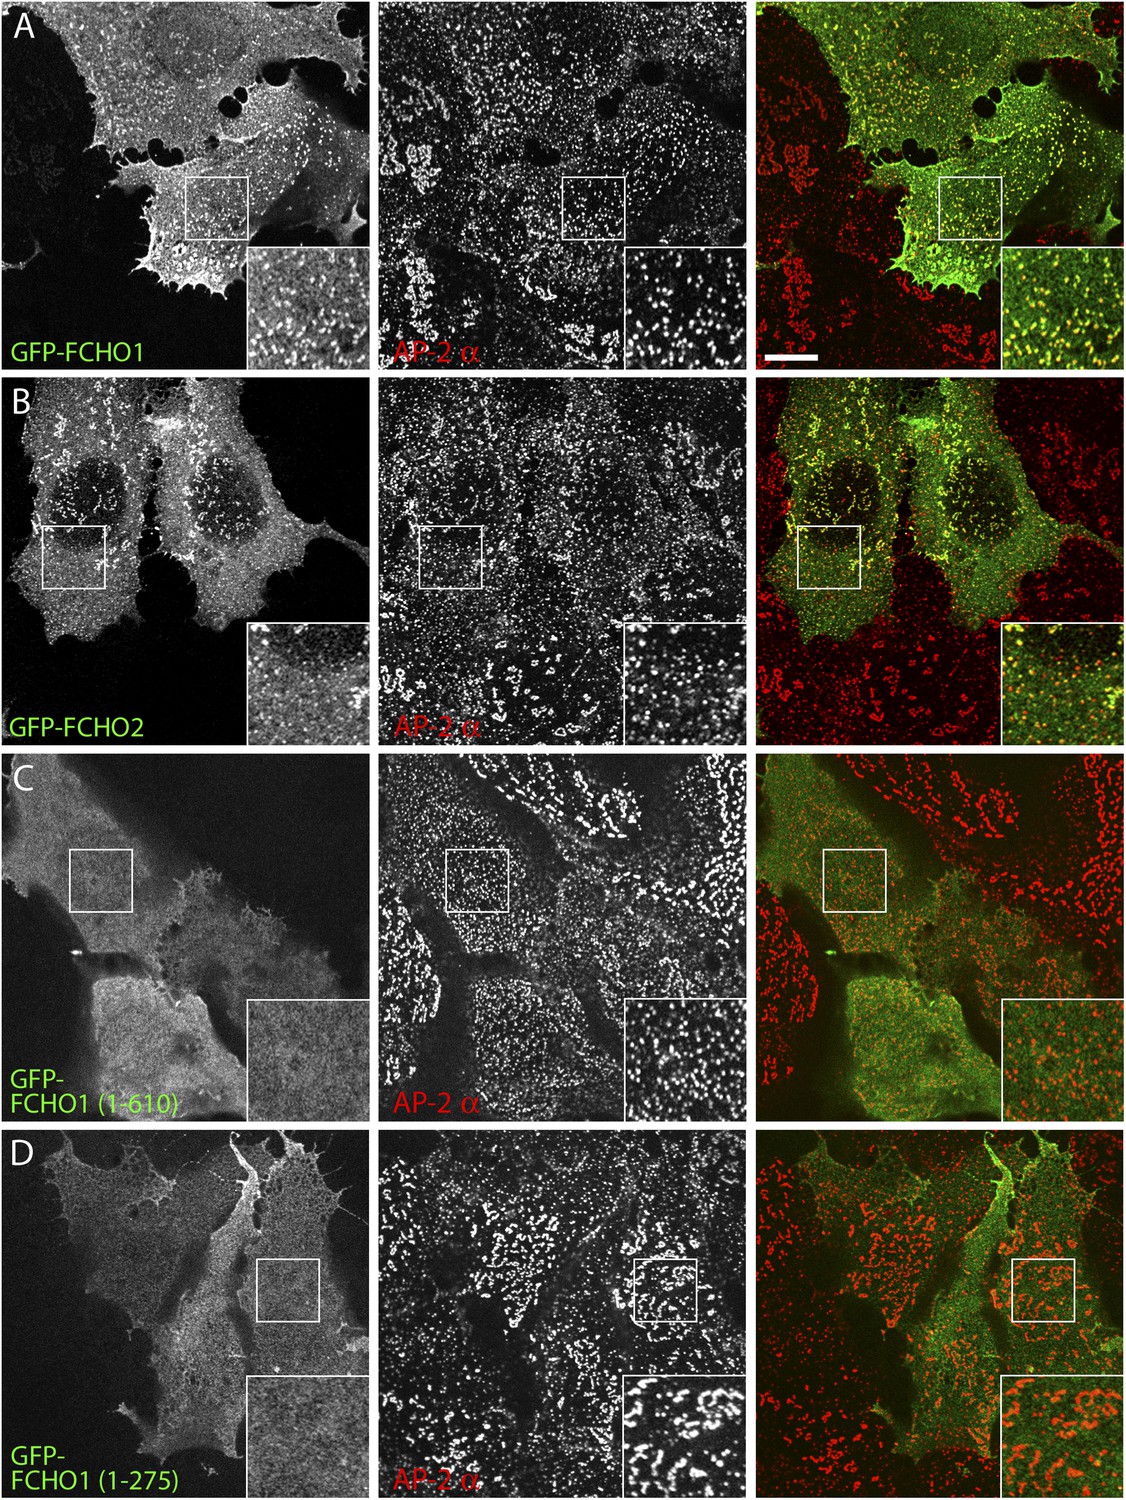
(A–D). MCF-7 cells transiently transfected with either fill-length GFP-tagged FCHO1 (residues 1–889) (A), GFP-FCHO2 (residues 1–810) (B), GFP-FCHO1 EFC + linker (residues 1–609) (C) or GFP-FCHO1 EFC domain (residues 1–275) (D) were fixed and stained with an antibody (mAb AP-6) against the α subunit of the AP-2 adaptor complex (red). Forced expression of FCHO1 or FCHO2 remodels the endogenous clathrin-coated structures into more uniform arrays, as visualized by AP-2 (A, B and C). Although full-length GFP-FCHO1 or FCHO2 (green) concentrate at AP-2 positive surface spots, GFP-FCHO1 EFC + linker fully corrects AP-2 patterning while being diffusely associated with the plasma membrane in a featureless manner (C) similar to the EFC domain alone (D). Enlarged views of the boxed regions are shown on the lower right. Scale bar: 10 μm.
Figure 9 with 1 supplement
Functionally significant phylogenetic conservation within the muniscin central linker domain.
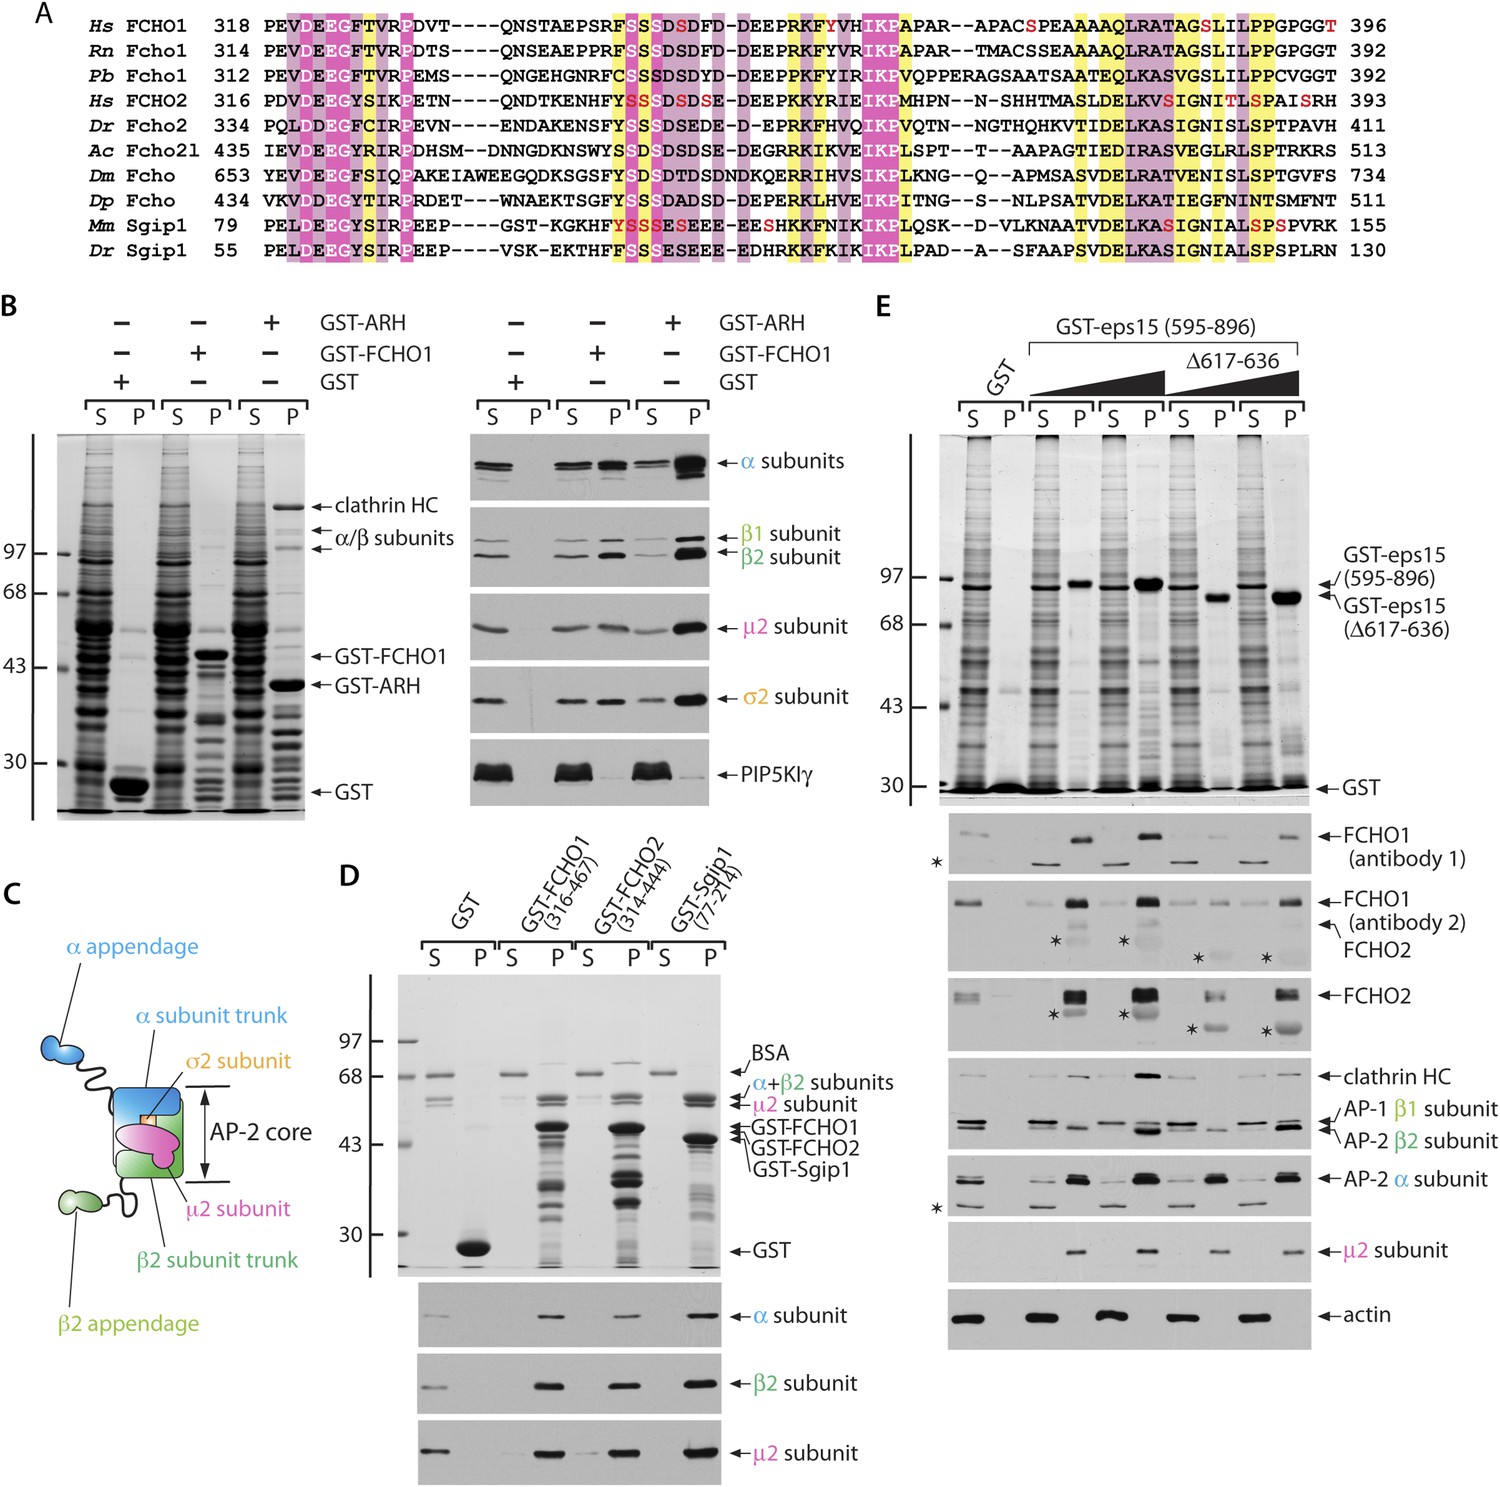
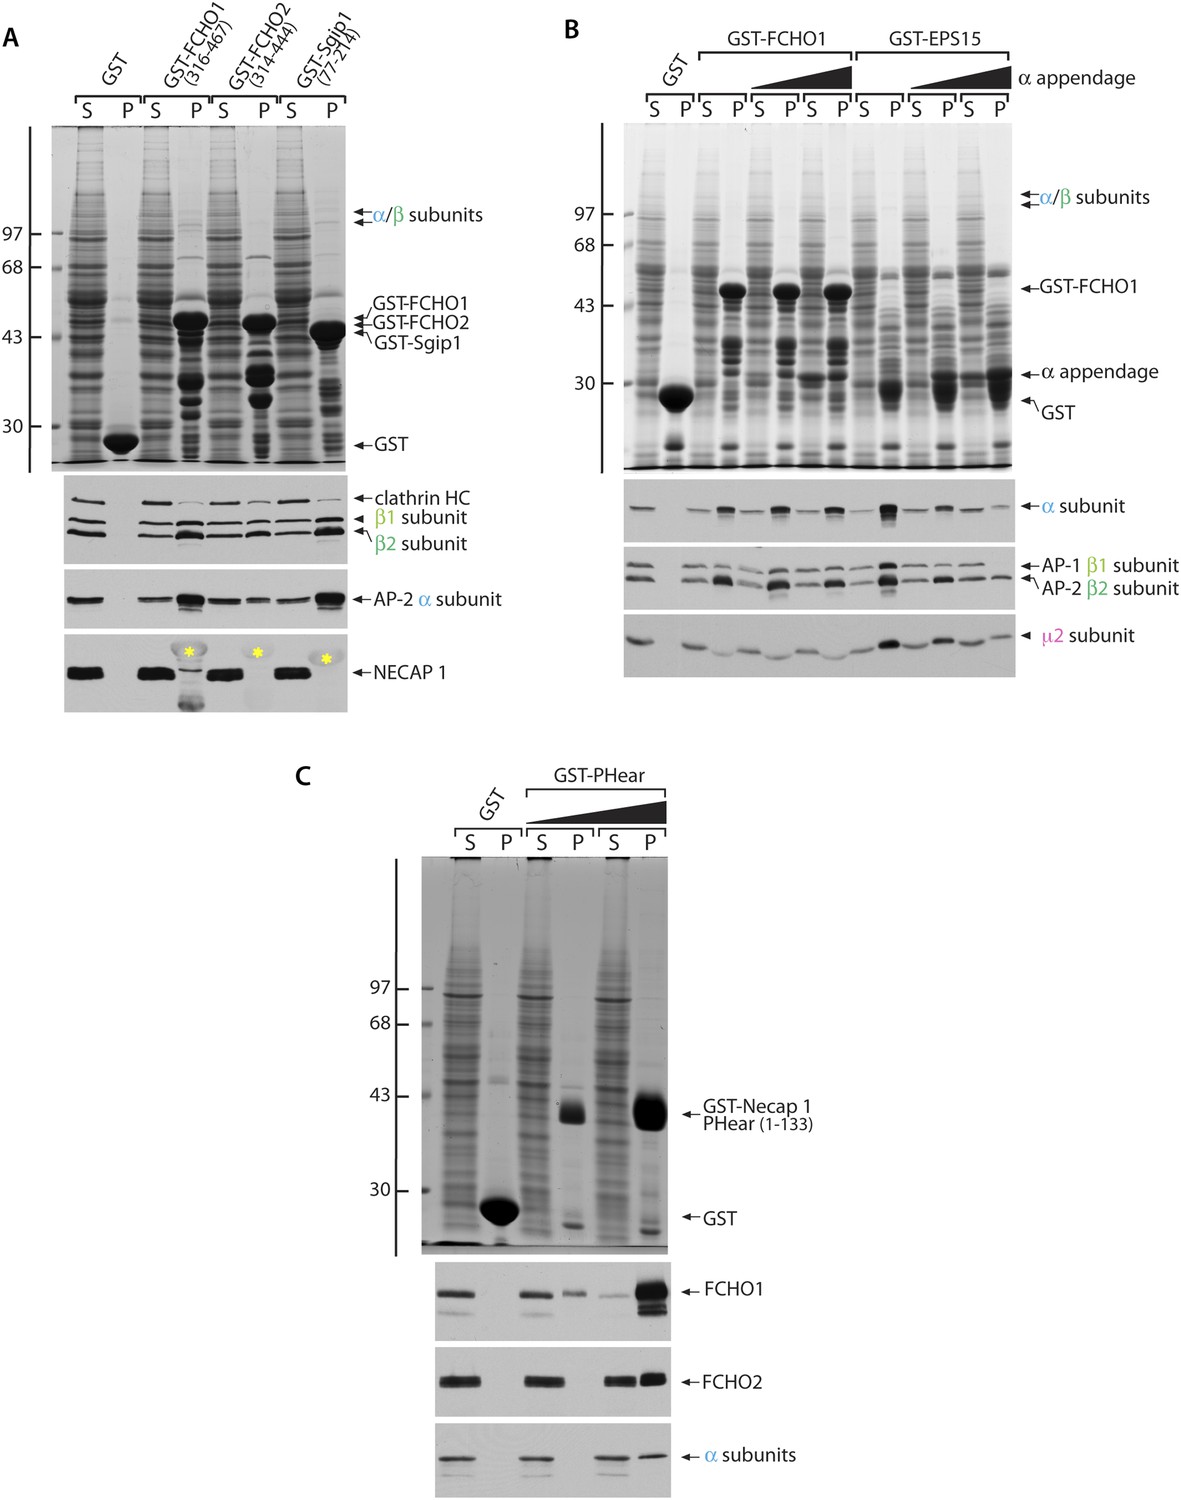
(A) Muniscin–AP-2 interactions. T-Coffee (Notredame et al., 2000) generated multiple sequence alignment of the phylogenetically conserved linker region within muniscin members. Amino acid regions of Fcho1 from selected species: Homo sapiens (Hs; NP_001154829), Rattus norvegicus (Rn; XP_006252925), Python bivittatus (Pb; XP_007436694), Fcho2: Hs (NP_620137), Danio rerio (Dr; NP_001018617), Fcho2-like (Fcho2l): Aplysia californica (Ac; XP_005111676), the single FCHO member in Drosophila melanogaster (Dm; NP_001097723), and Daphnia pulex (Dp; EFX87825), as well as Sgip1: Mus musculus (Mm; NP_659155) and Dr (XP_005165952) are shown with appropriate residues numbers indicated. Identical residues are highlighted in magenta, highly similar residues in pale pink and conservatively substituted amino acids in yellow. The location of mass-spectrometry authenticated phosphosites (Hornbeck et al., 2012) are shown (red font). (B) Samples of 100 μg of GST, GST-FCHO1 (316–467) or GST-ARH (180–308) immobilized on glutathione-Sepharose were incubated with rat brain cytosol, washed and samples of each supernatant (S) and pellet (P) fraction separated by SDS-PAGE. Replicate gels were either stained with Coomassie blue (left) or immunoblotted with the designated antibodies (right). The positions of the molecular mass standards (in kDa) are indicated on the left. (C) Schematic illustration of the overall chain and domain composition of the AP-2 adaptor complex. (D) Samples of 100 μg of GST, GST-FCHO1 (316–467), GST-FCHO2 (314–444) or GST-Sgip1 (77–214) immobilized on glutathione-Sepharose were used in pull-down assays with the purified AP-2 heterameric core complex as in (B). The identity of the large subunit trunk polypeptides (α and β2 subunits) and the myc-tagged μ2 subunit is confirmed on immunoblots with mAb clone 8, mAb 100/1 and mAb clone 31, respectively. (E) Aliquots of 100 μg of GST or either 25 μg or 100 μg of GST-EPS15 (595–896) or GST-EPS15 (595–896/Δ617–636) immobilized on glutathione-Sepharose were incubated with soluble lysate from K562 cells. After washing, portions of the supernatant and pellet fractions were analyzed as in (B). FCHO1 antibody 1 is a mAb while antibody 2 is an affinity-purified antibody that also recognizes FCHO2 weakly. Non-specific cross-reactive bands are indicated with asterisks; reactivity of the GST-EPS15 fusion proteins with the anti-FCHO1 and anti-FCHO2 antibody preparations is also indicated with asterisks. Notice the decreased FCHO1 and FCHO2 binding upon deletion of the minimal μHD sequence within the EPS15 C-terminal region that correlates with reduced clathrin association.
Figure 9—figure supplement 1
Cytosolic AP-2 and the Necap 1 PHear domain (residues 1–133) bind to FCHO1 and FCHO2.
(A) Samples of ∼200 μg of GST, GST-FCHO1 (316–467), GST-FCHO2 (314–740) or GST-Sgip1 (77–214) immobilized on glutathione-Sepharose were used in pull-down assays as in with rat brain cytosol as in Figure 9B. HC; heavy chain. The anti-Necap 1 antibody has extensive non-specific reactivity with the GST-fusion proteins (yellow asterisks) but, compared with the GST control, there is little loss of the Necap 1 from the supernatants after incubation with GST-muniscin linker fusions, as is seen for AP-2 subunits. Thus Necap 1 interacts only weakly with the FCHO1 linker segment. (B) Sample of ∼200 μg of GST, GST-FCHO1 (316–467) or GST-EPS15 (595–740) immobilized on glutathione-Sepharose were used in pull-down assays with rat brain cytosol alone or supplemented with 5 μM or 25 μM purified AP-2 α appendage. The marked recovery of the α appendage together with the GST-EPS15 fusion is not paralleled in the GST-FCHO1 linker pellets, and competition with soluble intact AP-2 is not evident. The reduced apparent abundance of the μ2 subunit in the pellet fractions from the GST-FCHO1 linker pull-down assays is due to comigration of the μ2 subunit with the GST fusion protein. (C) Samples of 250 μg of GST or 50 μg or 250 μg of GST-Necap 1 PHear domain (residues 1–133) immobilized on glutathione-Sepharose were incubated with K562 cell Triton X-100 lysate. After washing, aliquots of the supernatant (S) and pellet (P) fractions were resolved by SDS-PAGE and either stained with Coomassie blue (top) or transferred to nitrocellulose in replicate. Blots were probed with affinity-purified antibodies directed against FCHO1 or FCHO2 or with a mAb (C-8) the α subunit of AP-2. FCHO1, FCHO2 and AP-2 all show dose-dependent interactions with the Necap 1 PHear domain (Ritter et al., 2004, 2007, 2013), although FCHO1 clearly displays the highest apparent affinity. In general, FCHO2 shows a weaker capacity to correct the clathrin distribution phenotype in HeLa clone #64/1.E cells, which is correlated with poorer binding to AP-2 and Necap 1.
Figure 10
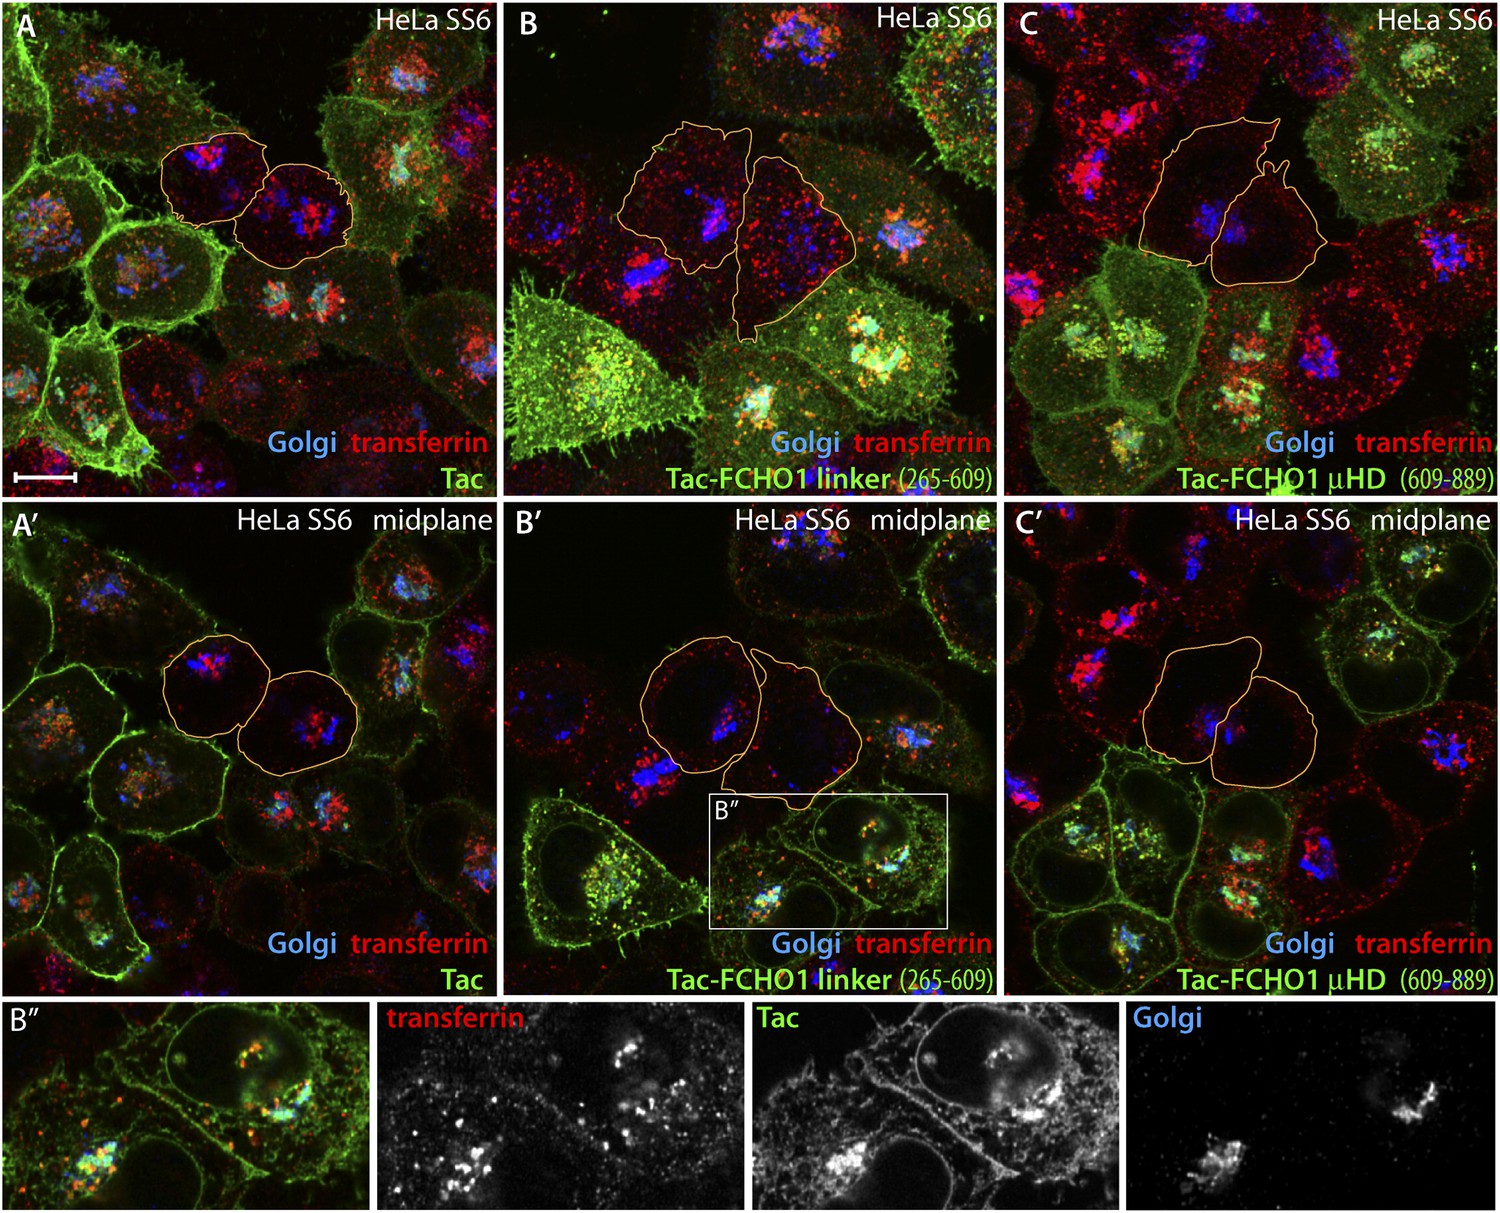
Trafficking of exogenous Tac and Tac-FCHO1 fusion proteins in HeLa cells.
(A–A′) Maximal projection (A) and a selected medial plane (A′) of deconvolved confocal image z-stacks of HeLa SS6 cells transiently transfected with a Tac-encoding plasmid. Prior to fixation, the transfected cell population was pulsed with 25 μg/ml Alexa Fluor568 transferrin (red) for 10 min. Fixed cells were then stained with a mAb (7 G7B6) directed against the lumenal domain of Tac (green), anti-GPP130 antibodies (blue). Relative accumulation of the Tac protein in the Golgi (cyan color) and transferrin-positive endosomes (yellow) varies in different individual transfected cells. The cell perimeter of two selected, non-transfected cells is outlined (orange). Scale bar (for all panels): 10 μm. (B–C) Maximal projection (B and C) or selected medial planes (B′ and C′) from deconvolved z-stacks acquired from HeLa SS6 cells transfected with either a Tac-FCHO1 linker (residues 265–610; B, B′) or a Tac-FCHO1 μHD (residues 609–889; C, C′). Fixed cells were processed identically to (A). Accumulation of he Tac-FCHO1 chimeras in the ER, as marked by nuclear envelope staining, is also apparent in some cells. The cell perimeter of two selected, non-transfected cells in each panel is outlined (orange). (B″) Enlargements of the color-separated channels from the boxed region in B′ showing the colocalization of the transfected Tac-FCHO1 linker fusion with both the Golgi marker GPP130 and internalized transferrin.
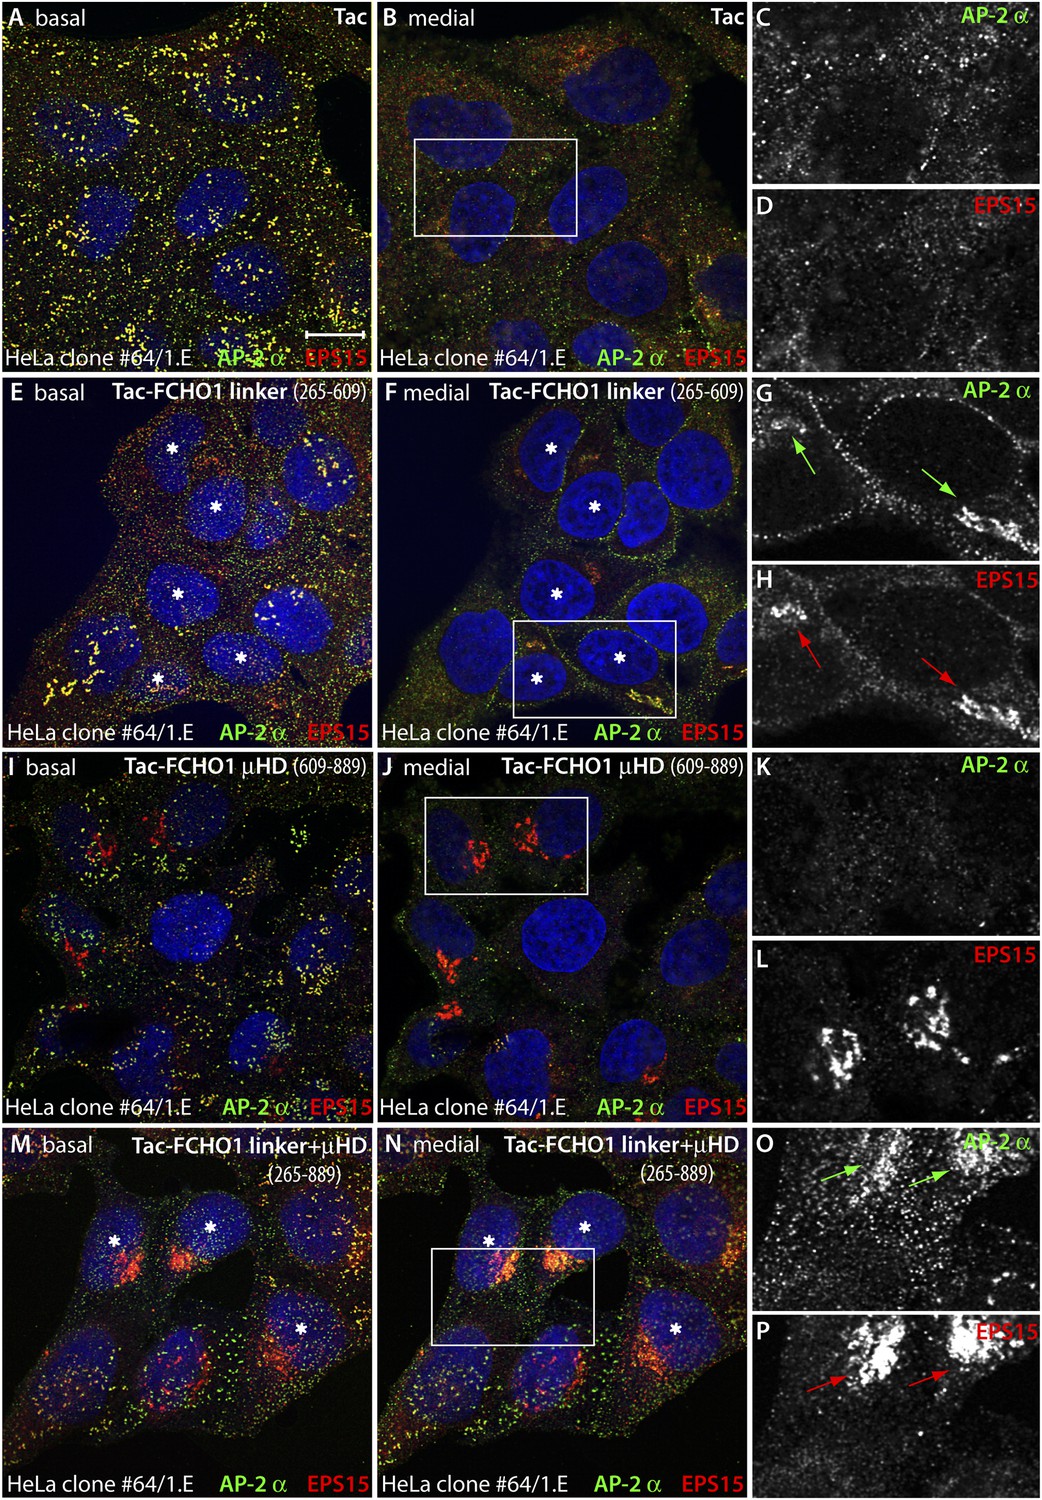
Figure 11
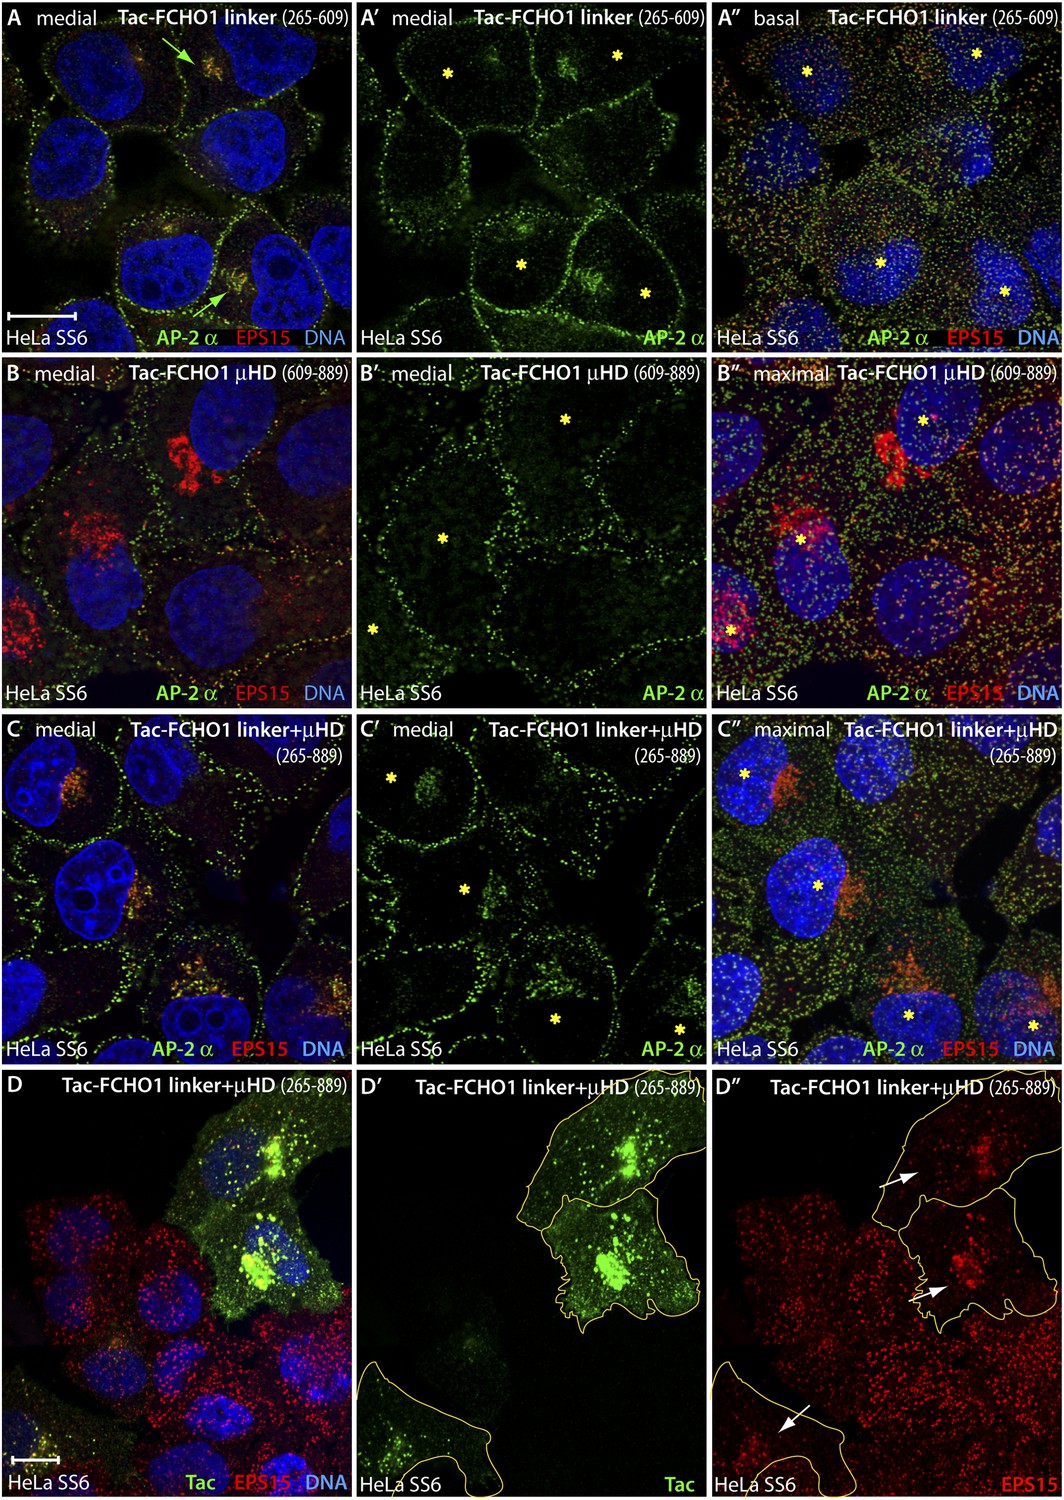
An artificial transmembrane FCHO1 linker protein misrecruits AP-2 onto internal membrane structures.
(A–A″) Selected medial (A and A′) or basal (A″) optical sections of deconvolved confocal z-stacks collected from HeLa SS6 cells transiently transfected with Tac-FCHO1 linker (residues 265–609). Fixed cells were stained with anti-AP-2 α subunit mAb AP.6 (green) and affinity purified anti-EPS15 antibodies (red) and mounted in Hoechst 33342 to label DNA (blue) prior to imaging. Aberrant accumulation of AP-2 and EPS15 adjacent to the nucleus (arrows) in Tac-transfected cells (asterisks) correlates with smaller clathrin-coated puncta in the basal optical section of the same cell population (A″). Scale bar (for A–C″): 10 μm. (B–C″) Chosen middle (B, B′, C and C′) or maximal projection (B″ and C″) optical sections of HeLa SS6 cells transfected with Tac-FCHO1 μHD (residues 609–889) or Tac-FCHO1 linker + μHD (residues 265–889) and prepared analogously to (A–A″). The Tac-fused μHD produces dramatic relocalization of EPS15 (B), diminishing this protein in surface AP-2-positive puncta (B″) yet AP-2 does not relocate similarly. With ectopic expression of the FCHO linker + μHD, prominent accumulation of irregular intracellular AP-2 and EPS15 in a juxtanuclear locations again correlates with diminished surface clathrin spots, which are again relatively deficient in EPS15 because of the massive deposition of this endocytic pioneer component upon intracellular membranes. (D–D″) Single ventral optical section of HeLa SS6 cells transfected with Tac-FCHO1 linker + μHD (residues 265–889) and stained with anti-Tac mAb (7 G7B6; green) and affinity-purified anti-EPS15 antibodies (red). Relocalization of EPS15 occurs only in Tac overexpressing cells (arrows), and the dose-dependent massing of EPS15 in the perinuclear region limits the amount of EPS15 present in surface clathrin-coated structures. The limiting membrane of the Tac-expressing cells is delineated (orange). Scale bar: 10 μm.
Figure 12
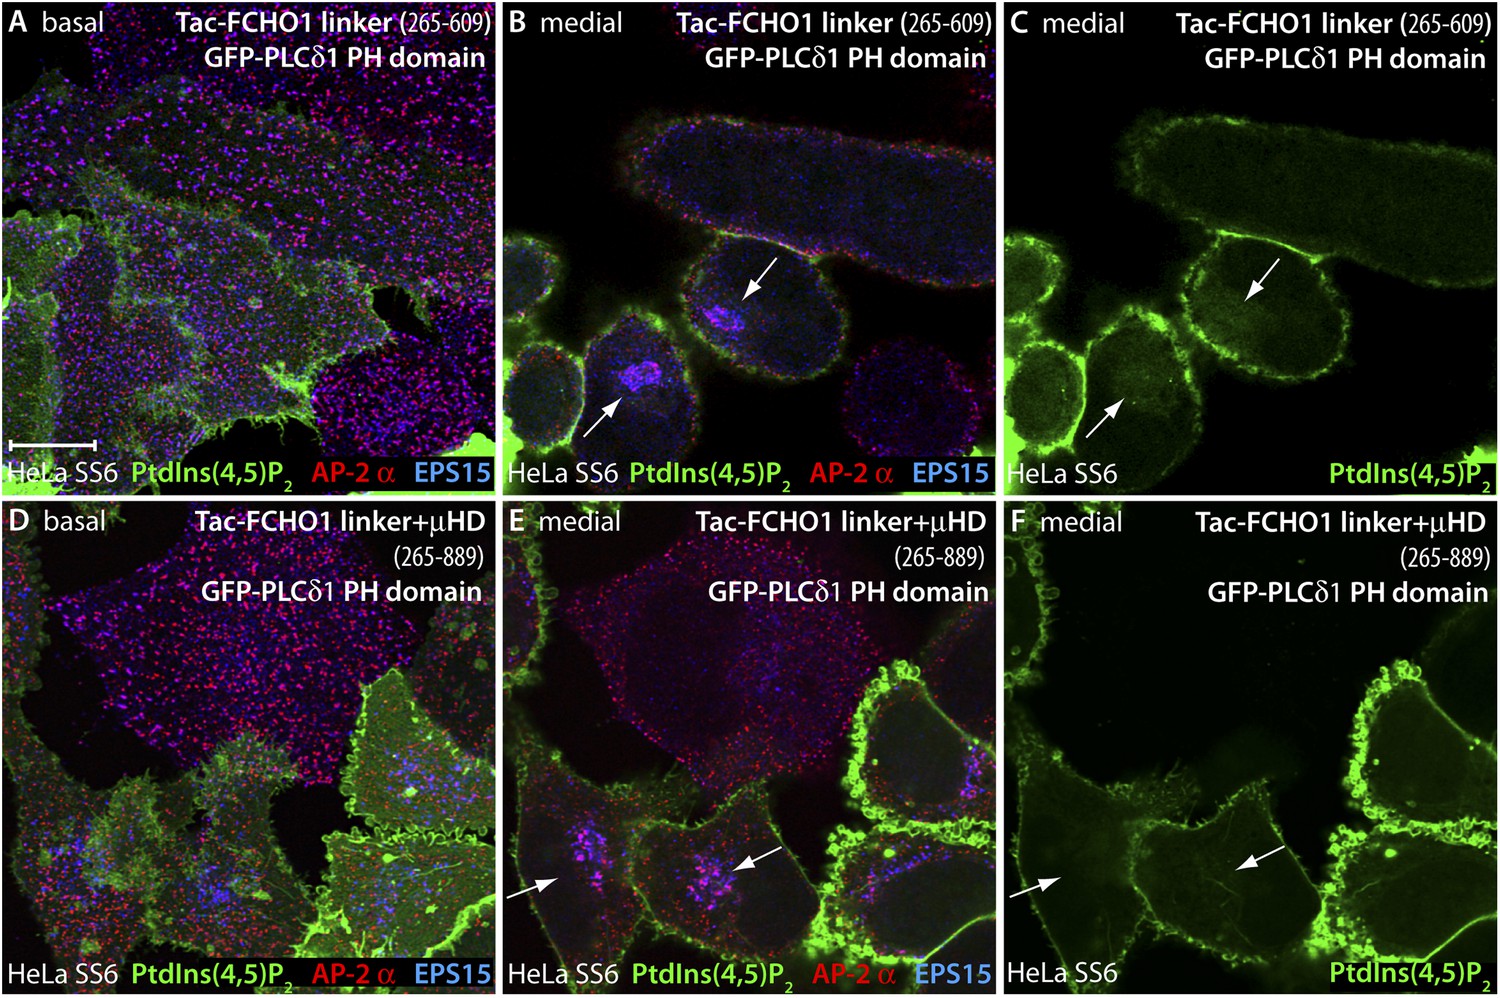
PtdIns(4,5)P2 is not enriched at sites of intracellular AP-2 accumulation.
(A–F) HeLa SS6 cells cotransfected with a mixture of either Tac-FCHO1 linker (residues 265–609) (A–C) or Tac-FCHO1 linker + μHD (residues 265–889) (D–F) and GFP-PLCδ1 PH domain encoding plasmids were fixed and stained with anti-AP-2 α subunit mAb AP.6 (red) and affinity purified anti-EPS15 antibodies (blue). The GFP fluorescence in the medial region of the Tac-linker expressing cells (C) represents the soluble pool of this fluorescent lipid probe adjacent to the nucleus. Note also the decrease in size and more regular arrangement of the AP-2- and EPS15-positive clathrin coated surface structures in the Tac-linker (A) and Tac-linker + μHD (D) expressing cells, identified by mislocalized deposition in a juxtanuclear position (arrows). Scale bar: 10 μm.
Figure 13 with 1 supplement
Forced expression of the Tac-FCHO1 linker fusion restores clathrin coat distribution in gene-edited HeLa cells.
(A–P) Basal (A, E, I, M) and medial (B, F, J, N) confocal sections from deconvolved z-image stacks from HeLa clone #64/1.E cells immunolabeled with antibodies against AP-2 (mAb AP.6; green) and EPS15 (red) and Hoechst 33342 for DNA (blue). The clone #64/1.E cells were short-term transfected with Tac (A–D), Tac-FCHO1 linker (residues 265–609) (E–H), Tac-FCHO1 μHD (residues 609–889) (I–L) or Tac-FCHO1 linker + μHD (residues 265–889) (M–P) before fixation. Tac-expressing cells, identified by recruitment of AP-2/EPS15 onto internal membranes (asterisks) are indicated, and enlarged, color-separated views of the rectangular regions in the medial sections are presented on the right. Scale Bar: 10 μm.
Figure 13—figure supplement 1
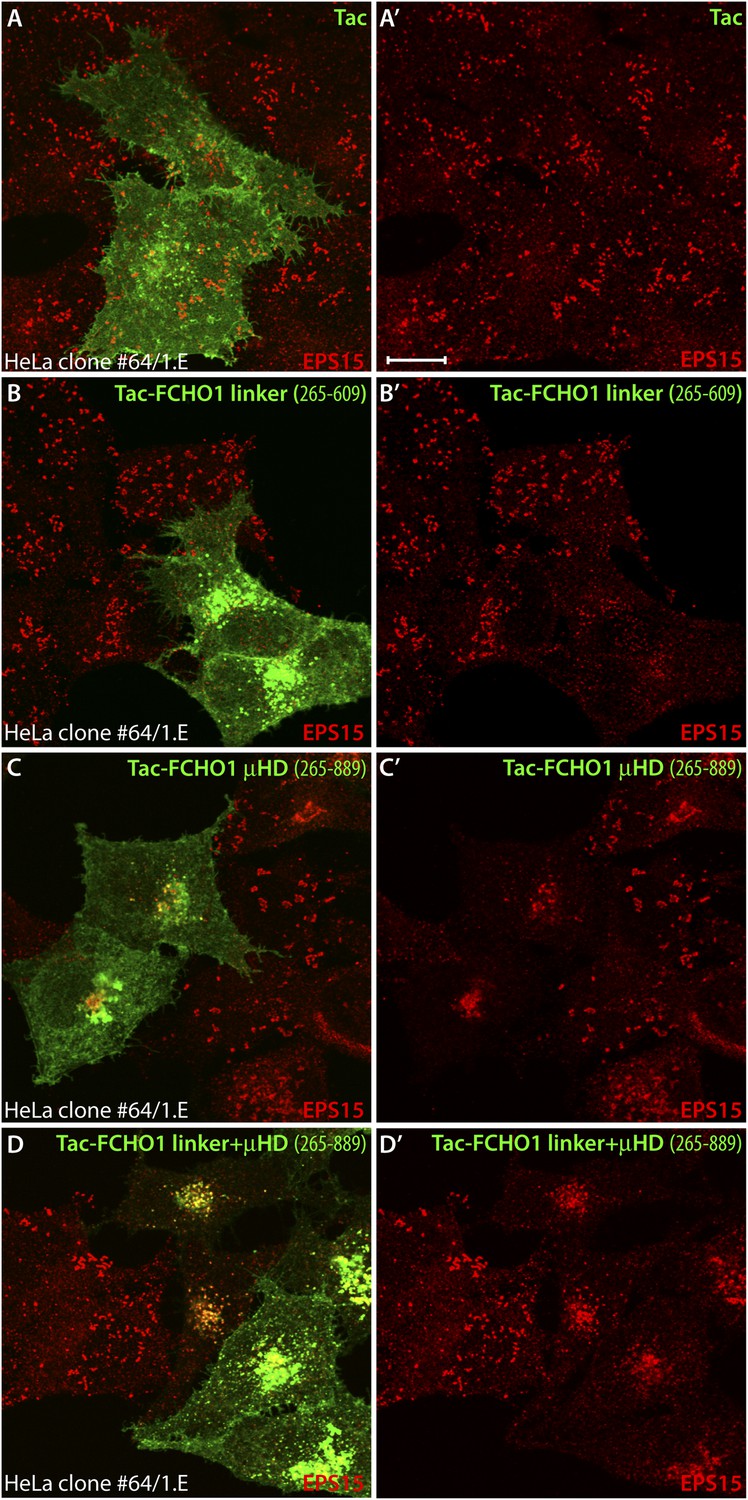
Mislocalized EPS15 in Tac-linker expressing HeLa clone #64/1.E cells overlaps with intracellular Tac.
(A–D) HeLa clone #64/1.E cells were short-term transfected with Tac (A), Tac-FCHO1 linker (residues 265–609) (B), Tac-FCHO1 μHD (residues 609–889) (C) or Tac-FCHO1 linker + μHD (residues 265–889) (D). Fixed cells were stained with an anti-Tac mAb (7 G7B6) (green) and an affinity-purified antibody against EPS15 (red). Single representative optical sections at the basal surface of the cells are shown with merged color overlay (A–D) and the EPS15 signal (A′–D′). Scale bar: 10 μm.
Figure 14
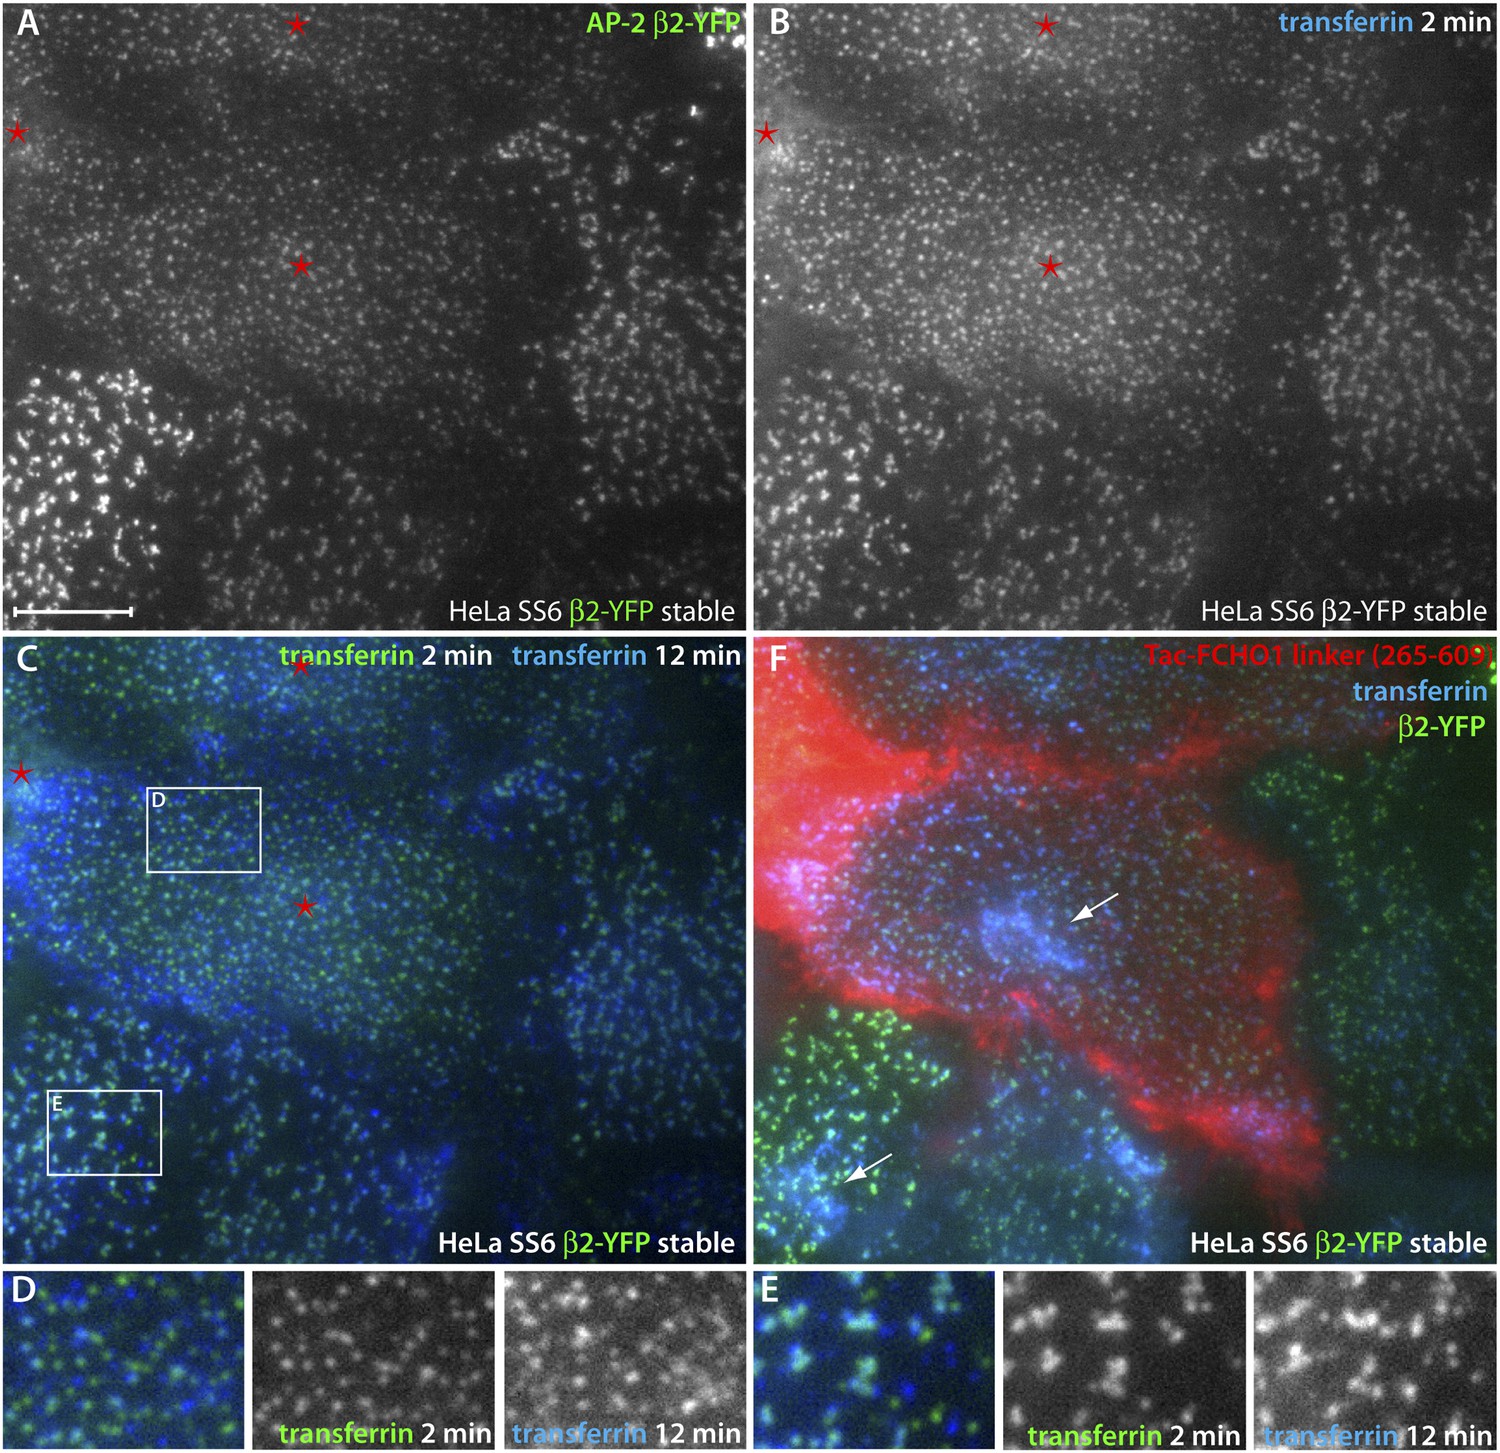
Direct regulation of coat morphology and cargo packaging by the FCHO1 linker domain.
(A and B) Color channel separated total internal reflection images of HeLa SS6 cells stably expressing β2-YFP (A) and pulsed for 2 min with 25 μg/ml Alexa Fluor647 transferrin (B). The cells were previously transfected with Tac-FCHO1 linker (265–609) and Tac-expressing cells are indicated (asterisks). (C) Comparison of individual frames from the transferrin channel at 2 min and 12 min by pseudocoloring the initial fame green and overlaying the last frame colored blue. The Tac-expressing cells with the rearranged β2-YFP spots are indicated (asterisks). (D and E) Enlarged, color-channel separated views of the labeled boxed regions in (C). (F) After completion of time-resolved image acquisition, Alexa Fluor546-conjugated anti-Tac mAb 7 G7B6 was added to identify unambiguously the Tac-transfected cells. Following incubation with the anti-Tac, a final image was collected. Internalized transferrin within endosomes visible in the total internal reflection field is indicated (arrows). Scale bar: 10 μm.
Author response image 1
Additional files
-
Supplementary file 1
List of various constructs used in this study and the sets of specific primers, restriction sites, plasmids and the methods of cloning used to design these constructs.
- https://doi.org/10.7554/eLife.04137.024
Download links
A two-part list of links to download the article, or parts of the article, in various formats.
Downloads (link to download the article as PDF)
Open citations (links to open the citations from this article in various online reference manager services)
Cite this article (links to download the citations from this article in formats compatible with various reference manager tools)
A clathrin coat assembly role for the muniscin protein central linker revealed by TALEN-mediated gene editing
eLife 3:e04137.
https://doi.org/10.7554/eLife.04137


