miR-128 regulates neuronal migration, outgrowth and intrinsic excitability via the intellectual disability gene Phf6
- Charité-Universitätsmedizin Berlin, Germany
- Heinrich Heine University, Germany
Figures
Figure 1 with 2 supplements
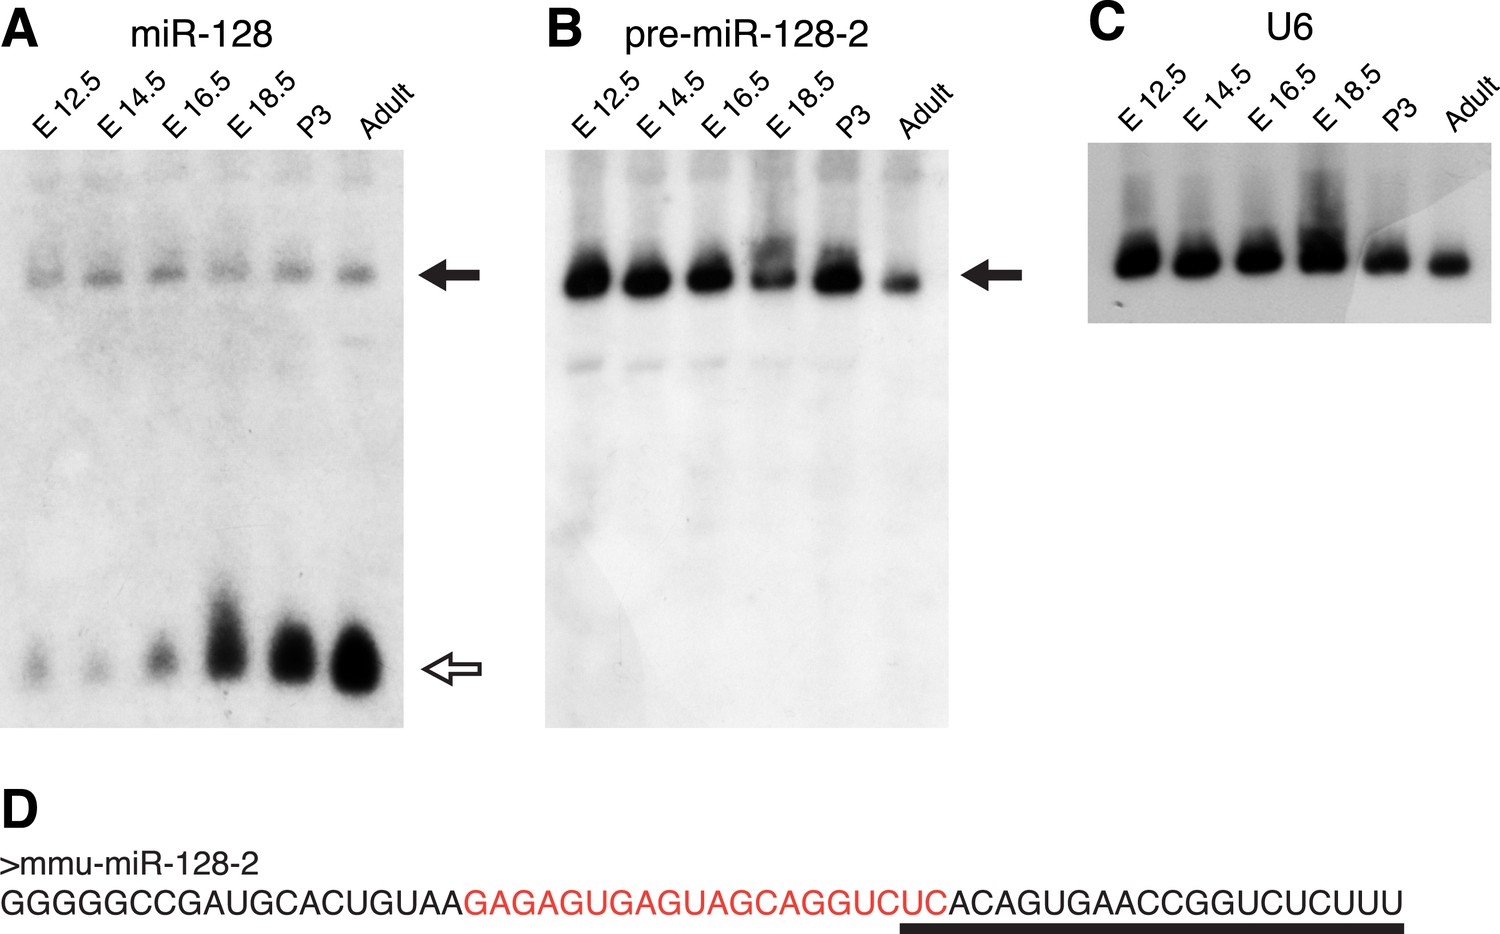
pre-miR-128-2 expression precedes miR-128.
Northern blots of RNA from embryonic and adult mouse brains. RNA from the stages indicated above each lane was hybridized with probes specific for miR-128 (A); pre-miR-128-2 (B); and U6 (C) as loading control. The position of precursor RNAs is indicated with a filled arrow, the ∼21 nt miRNA with an open arrow. The portion of the filter corresponding to ∼15 to 100 nt is shown. The pre-miR-128-2 sequence is depicted in (D), showing the 21 nt mature sequence that is targeted by the anti-miR-128 LNA probe (underlined) and the sequence complementary to the anti-precursor hybridization probe (red).
Figure 1—figure supplement 1
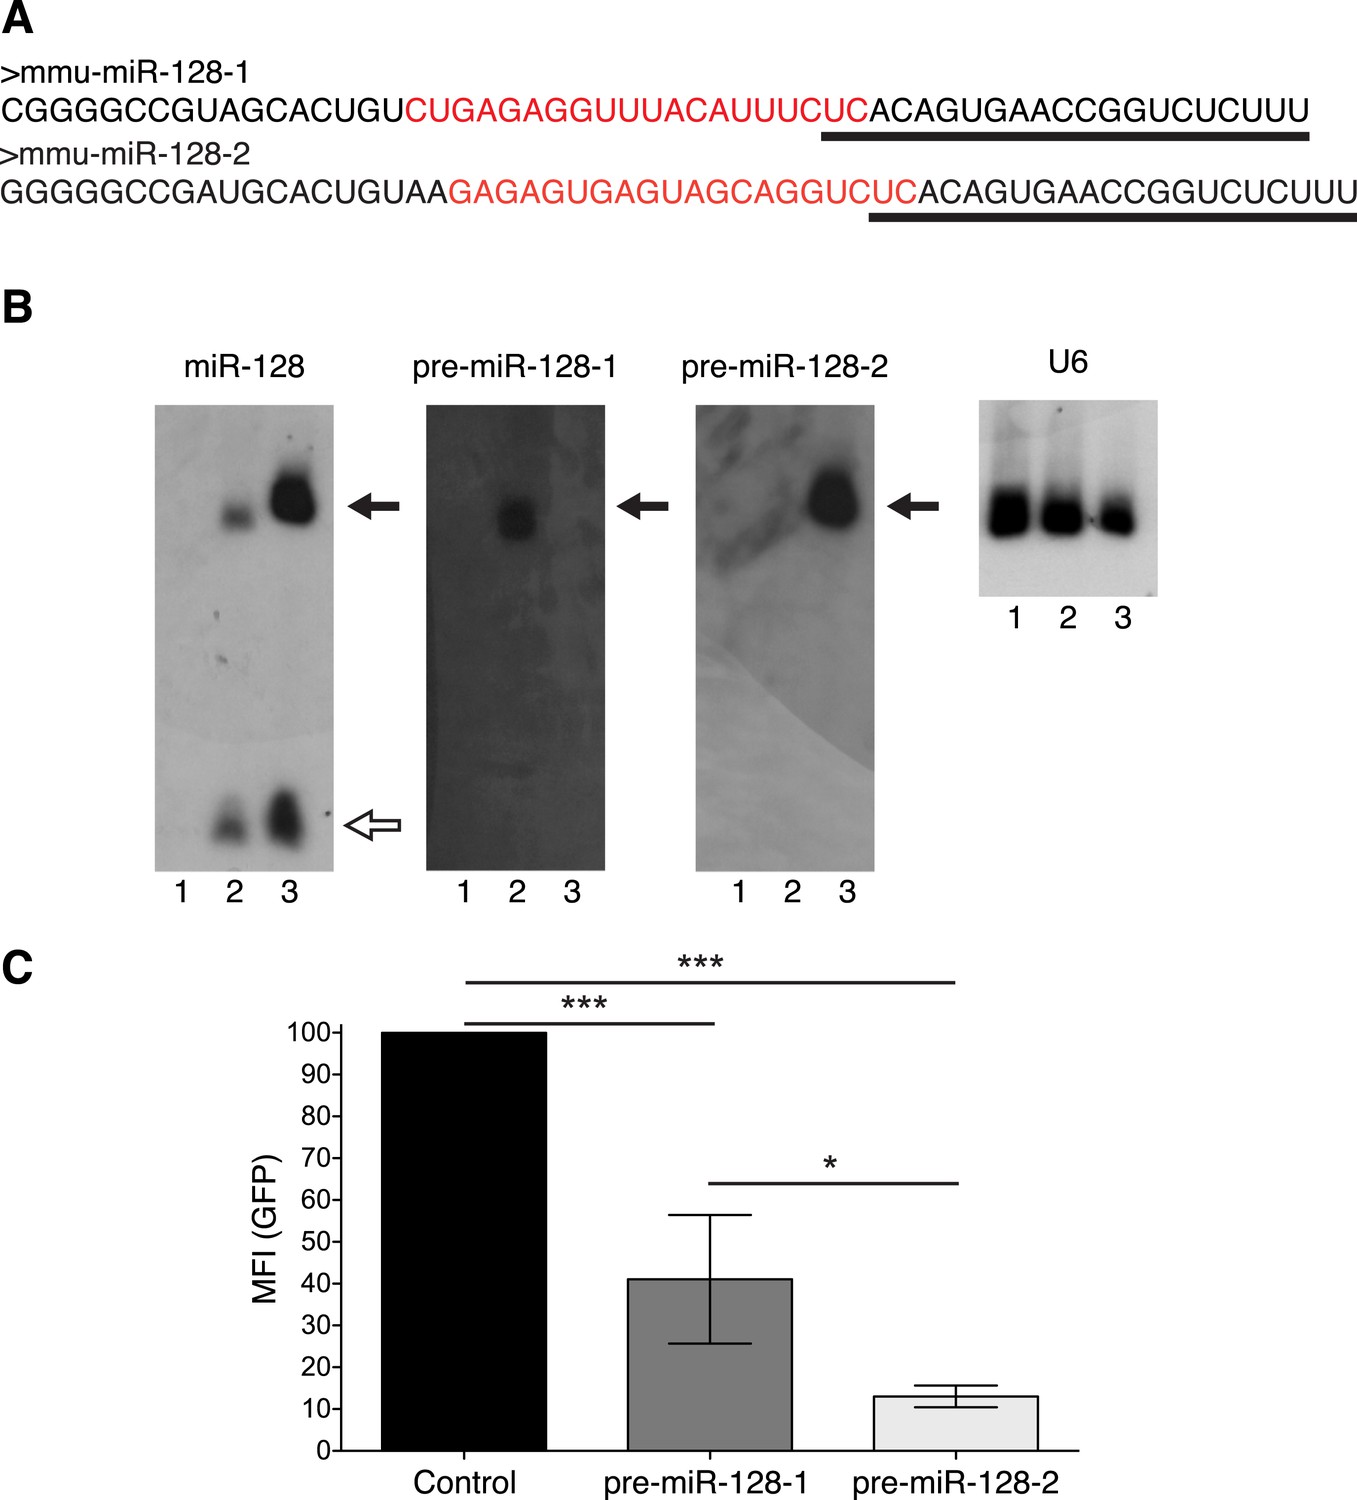
Relative activity of pre-miR-128-1-RED and pre-miR-128-2-RED expression constructs.
(A) The sequences of pre-miR-128-1 (top) and pre-miR-128-2 (bottom) are depicted, showing the mature 21 nt miRNA sequence as recognized by the anti-miR-128 LNA probe (underlined) and the sequence complementary to the anti-precursor hybridization probe (red). (B) Northern blots of RNA from HEK-293 cells transfected with Intron-RED empty vector (Lane 1), pre-miR-128-1-RED (Lane 2) or pre-miR-128-2-RED (Lane 3). The filter was hybridized with probes specific for mature miR-128, pre-miR-128-1, pre-miR-128-2 or U6 RNA as loading control, as indicated above each panel. The position of precursor RNAs is indicated with a filled arrow, the 21 nt miR-128 with an open arrow. The portion of the filter corresponding to approximately 15–100 nt is shown. The pre-miR-128-1-RED expression vector produces less miR-128 than the pre-miR-128-2-RED vector, each probe shows the expected specificity. (C) HEK-293 cells were co-transfected with a GFP-based sensor vector containing four perfectly complementary binding sites for miR-128 and either Intron-RED control vector, pre-miR-128-1-RED or pre-miR-128-2-RED expression vectors, as indicated. Both pre-miR-128-RED expression constructs repress the miR-128 sensor but pre-miR-128-1-RED shows less activity than pre-miR-128-2-RED.
Figure 1—figure supplement 2
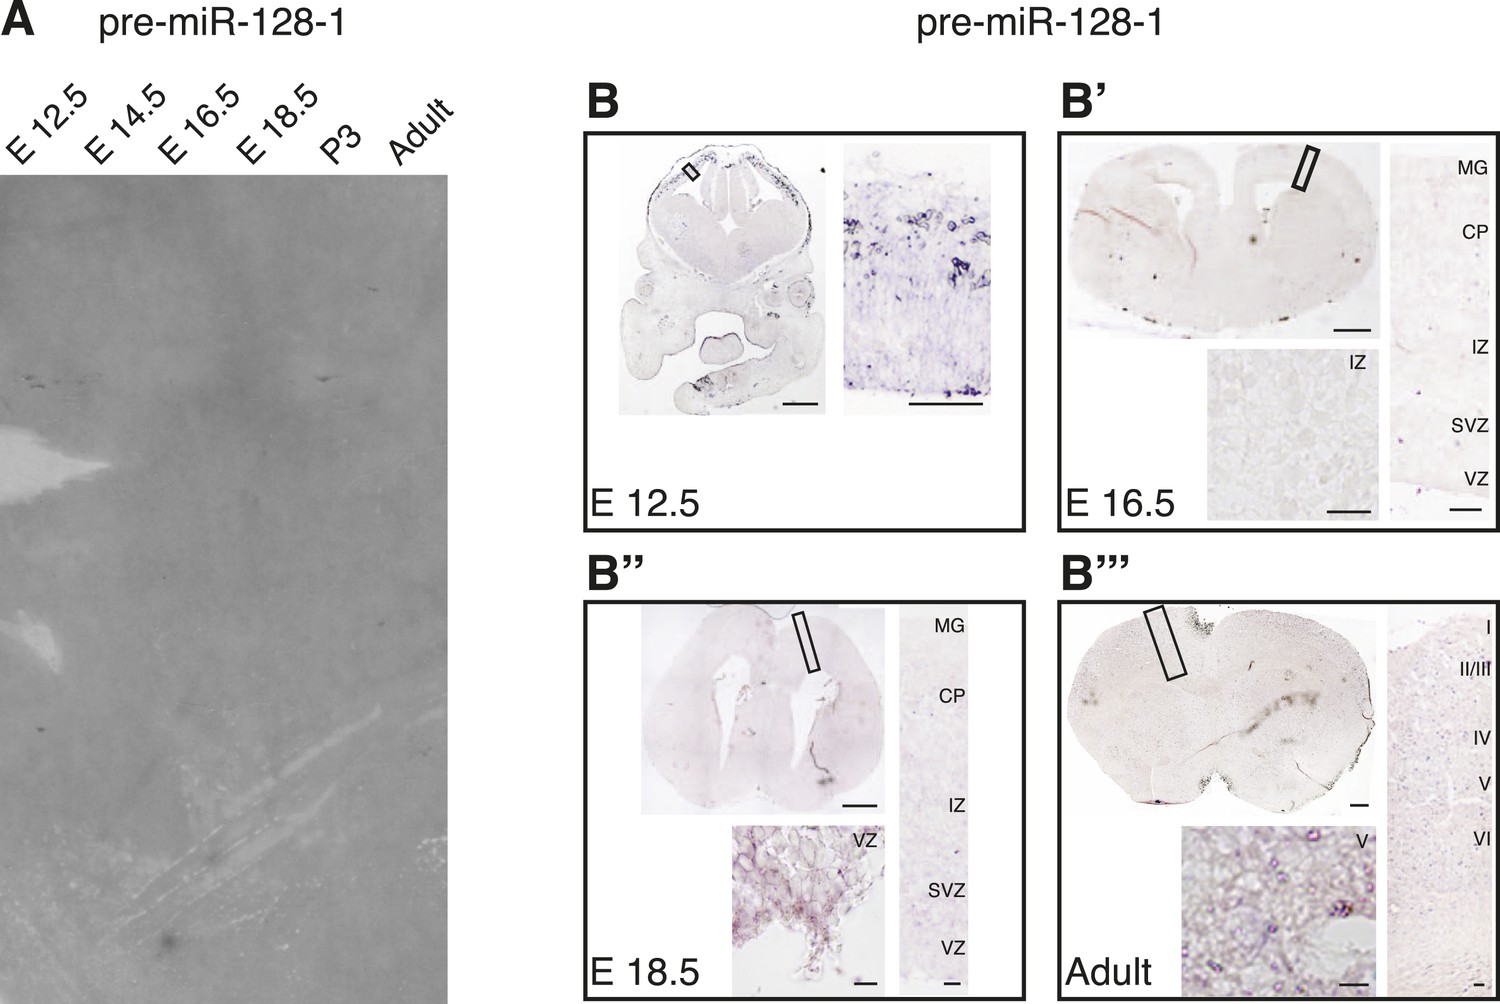
Levels of pre-miR-128-1 are below detection level in Northern blot and in situ hybridization assays.
(A) Northern blot as in Figure 1A–C, the membrane in this case was hybridized with the pre-miR-128-1 probe (described in Figure 1—figure supplement 1). Developmental stage of the RNA is indicated above each lane. (B–B″′) In situ hybridization using the pre-miR-128-1 probe (see Figure 1—figure supplement 1) of embryonic day 12.5 (B), 16.5 (B′), 18.5 (B″) and Adult (B″′) brains. The obtained signal does not exceed background at any time point examined.
Figure 2 with 3 supplements
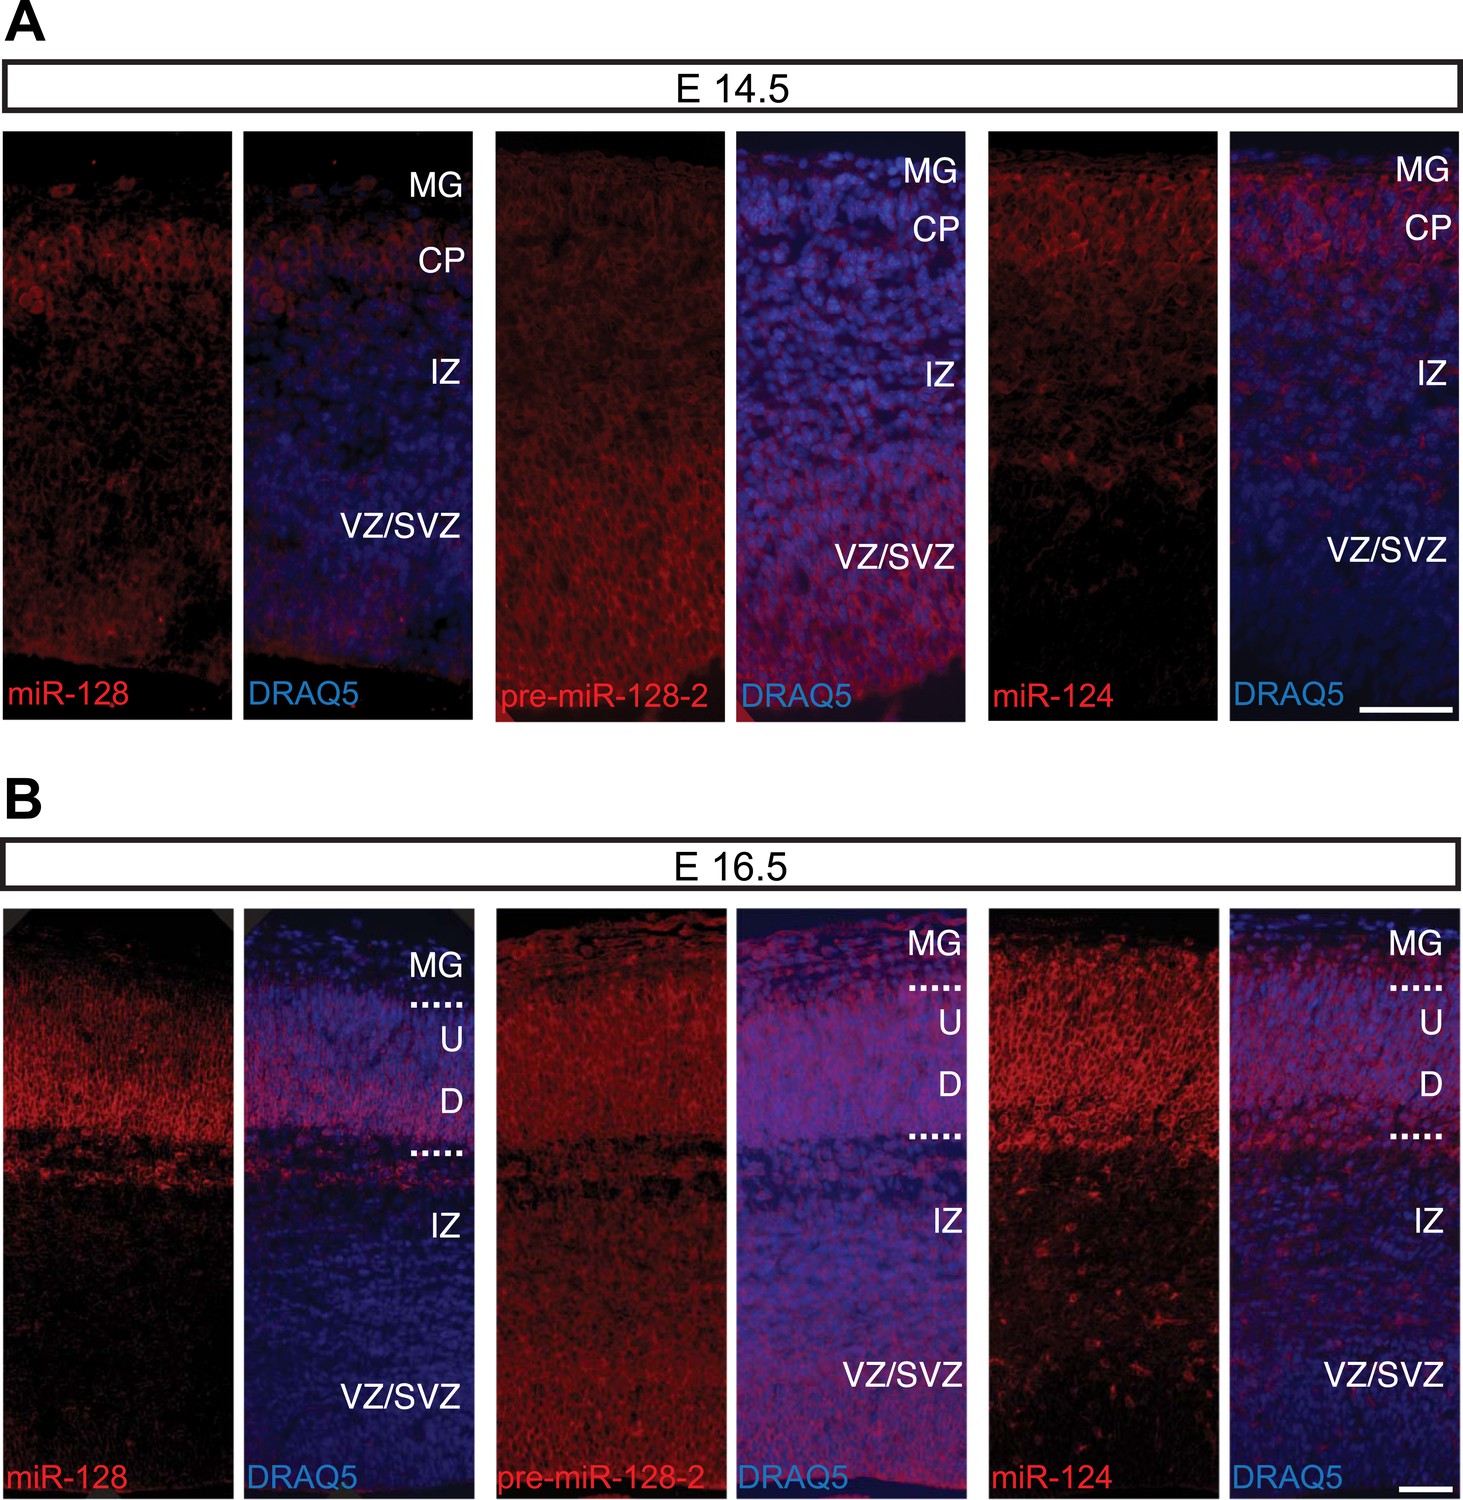
Post-transcriptional regulation determines the developmental expression pattern of miR-128.
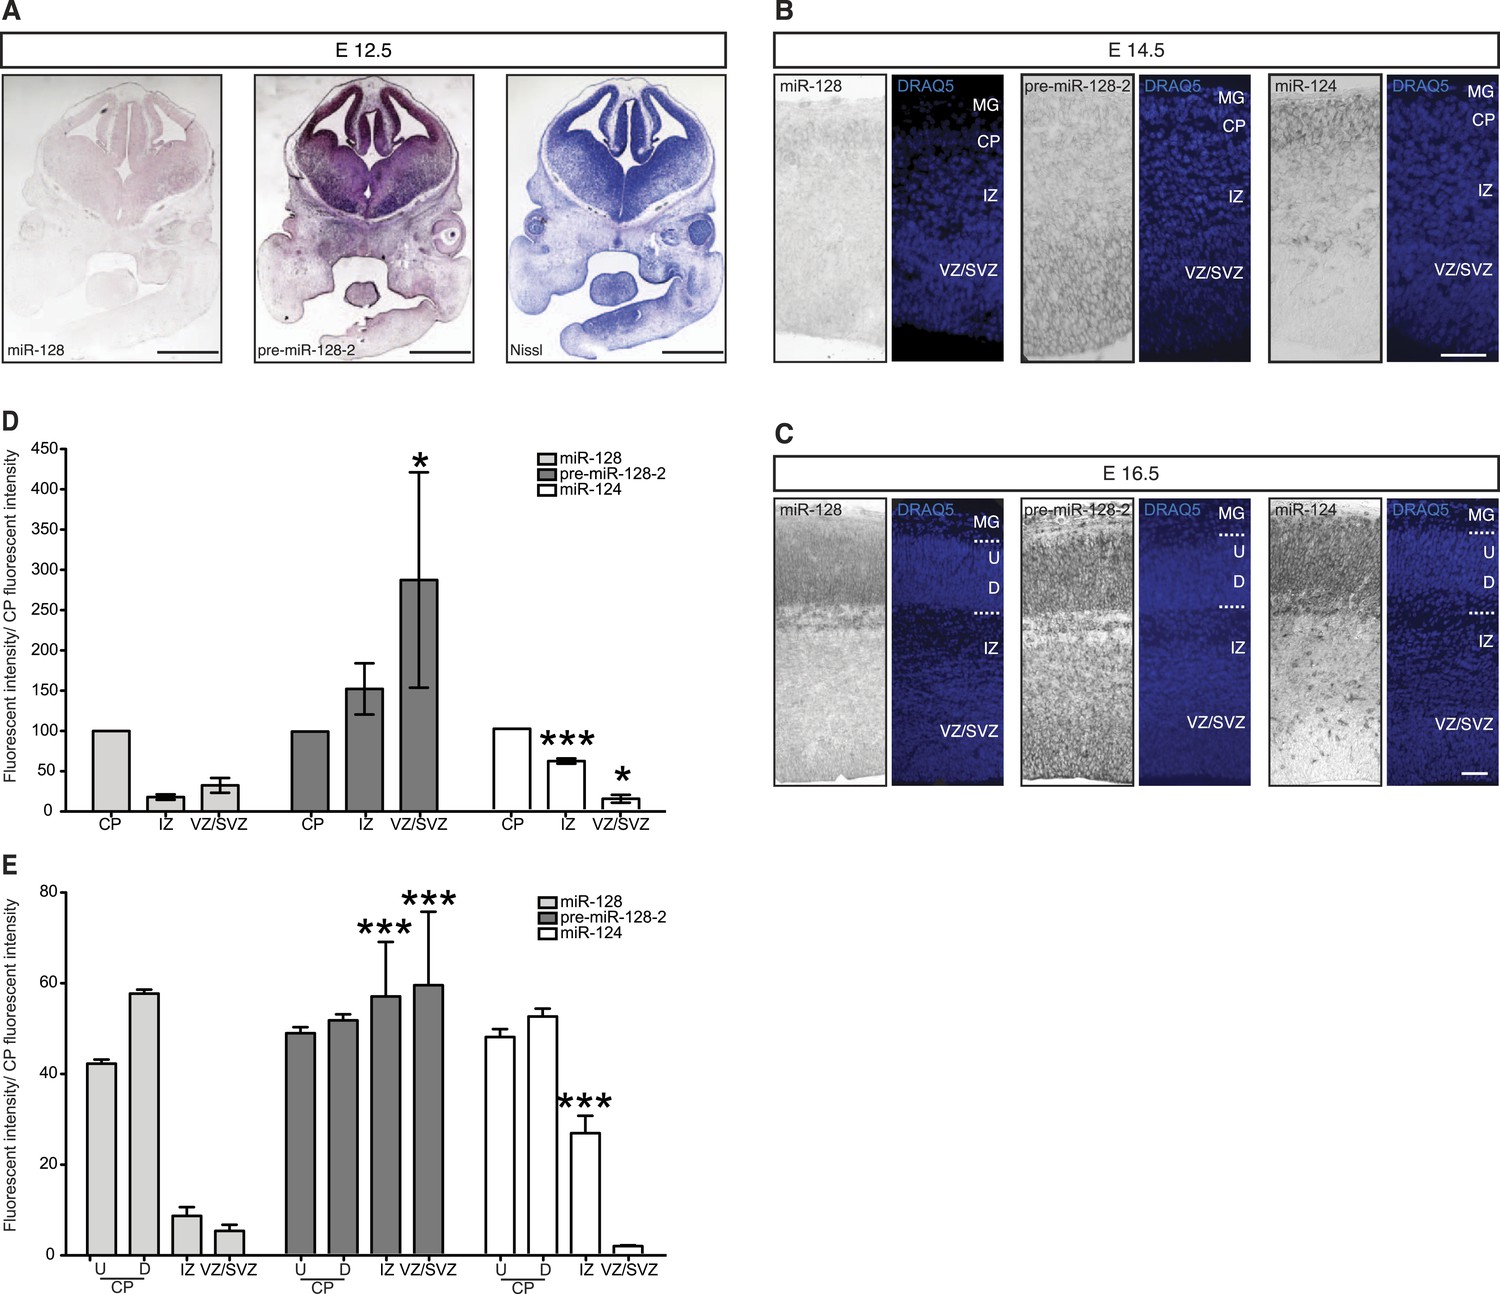
(A) Coronal section at E12.5 displaying embryonic telencephalon (scale bar 500 µm). Precursor staining is apparent throughout the dorsal and ventral telencephalon (middle) in the absence of miR-128 signal (left). Nissl staining is presented for comparison (right). (B and C) Coronal sections at E14.5 (B) and E16.5 (C) displaying the developing cortex stained for miR-128, pre-miR-128-2, or miR-124, as indicated. DRAQ5 staining of each section is provided for orientation. miR-128 expression is restricted to the CP at E14.5 and E16.5 (left panels) whereas pre-miR-128-2 is expressed ubiquitously from the MG to the VZ (middle panels). At E16.5 miR-128 expression within the CP shows a shallow gradient: stronger in the deep (D) compared to the upper layers (U). miR-124 (right) expression is detected in the CP and in some cells in the IZ. Nuclear staining is obtained with DRAQ5. Scale bar 100 µm. (D) Quantification of microRNA expression at E14.5 in VZ/SVZ and IZ normalized to CP (as described in ‘Materials and methods’). miR-128 (gray bars) expression is highest in the CP with a reduction in the IZ (fourfold) and VZ/SVZ (twofold). pre-miR-128-2 (dark bars) expression is higher in the VZ/SVZ (almost threefold) and in IZ (1.5-fold) relative to the CP. miR-124 (white bars) is expressed in the CP and in the IZ (≈60% of the CP intensity), single positive neurons are detectable. (E) Quantification of microRNA expression at E16.5 as in (D) except the CP has been divided into upper (U) and deeper (D) regions using DRAQ5. miR-128 (gray bars) is expressed mainly within the CP with ninefold lower expression in the VZ/SVZ and IZ and is enriched in deeper compared to upper layer neurons in the CP. pre-miR-128-2 (dark bars) expression is higher in the VZ/SVZ and IZ (1.5-fold) compared to the CP and it is evenly distributed between upper and deeper layers. Relative distribution of miR-124 is similar to E14.5, with the IZ 10-fold higher than the VZ/SVZ. Representative false color images used for quantification are shown in Figure 2—figure supplement 3. Three brains per condition were analyzed. One-way ANOVA comparing miR-128 and either pre-miR-128-2 or miR-124 was performed with Bonferroni post-test. *p < 0.05, ***p < 0.001. MG: marginal zone, CP: cortical plate, IZ: intermediate zone, SVZ: subventricular zone, VZ: ventricular zone, U: upper cortical plate, D: deeper cortical plate.
Figure 2—figure supplement 1
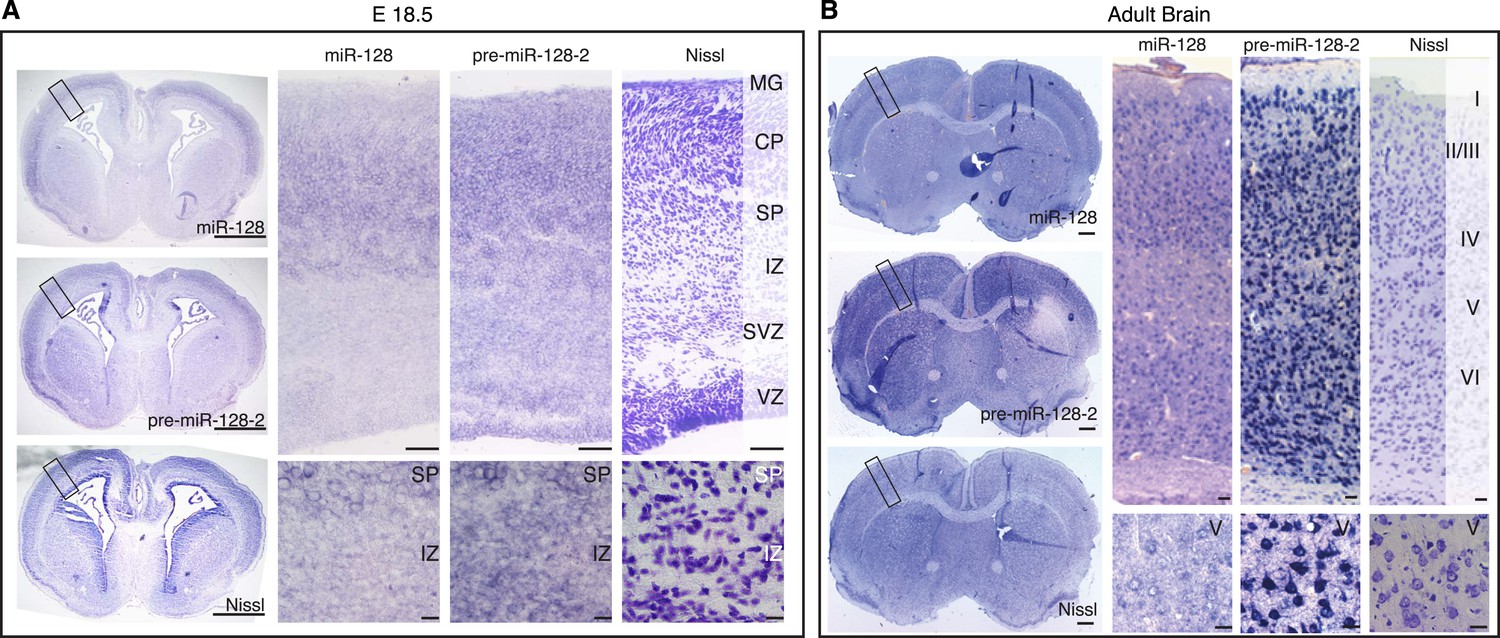
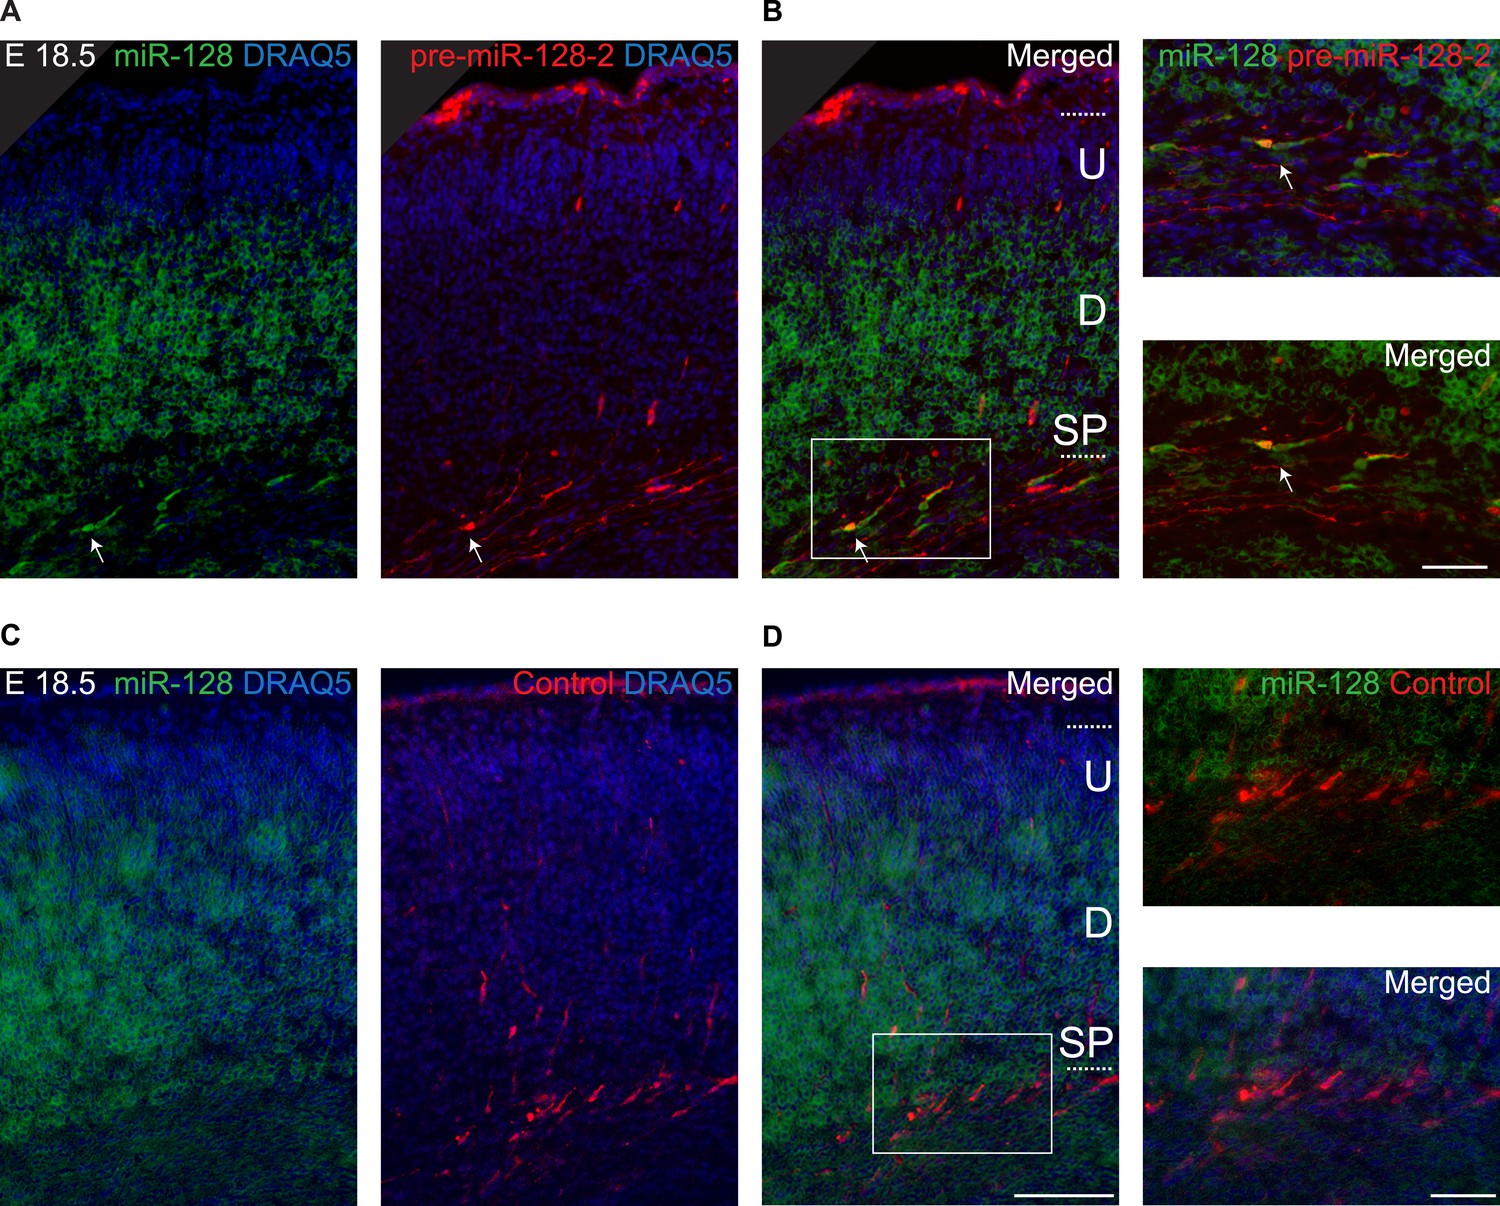
Differential expression of miR-128 and pre-miR-128-2 in developing and adult cortex.
(A, B) Cortical sections from E18.5 (A) and adult (B) brains stained for miR-128 or pre-miR-128-2 as indicated. Nissl staining is provided for comparison. An overview is provided for each section (left side of panel), followed by a representative view of the cortex and higher magnification view of regions of interest (scale bars 500 µm, 50 µm and 10 µm, respectively). Individual cells in the IZ (A) and Layer V (B) differentially stain for pre-miR-128-2 compared to miR-128. MG: marginal zone, CP: cortical plate, SP: subplate, IZ: intermediate zone, SVZ: subventricular zone, VZ: ventricular zone.
Figure 2—figure supplement 2
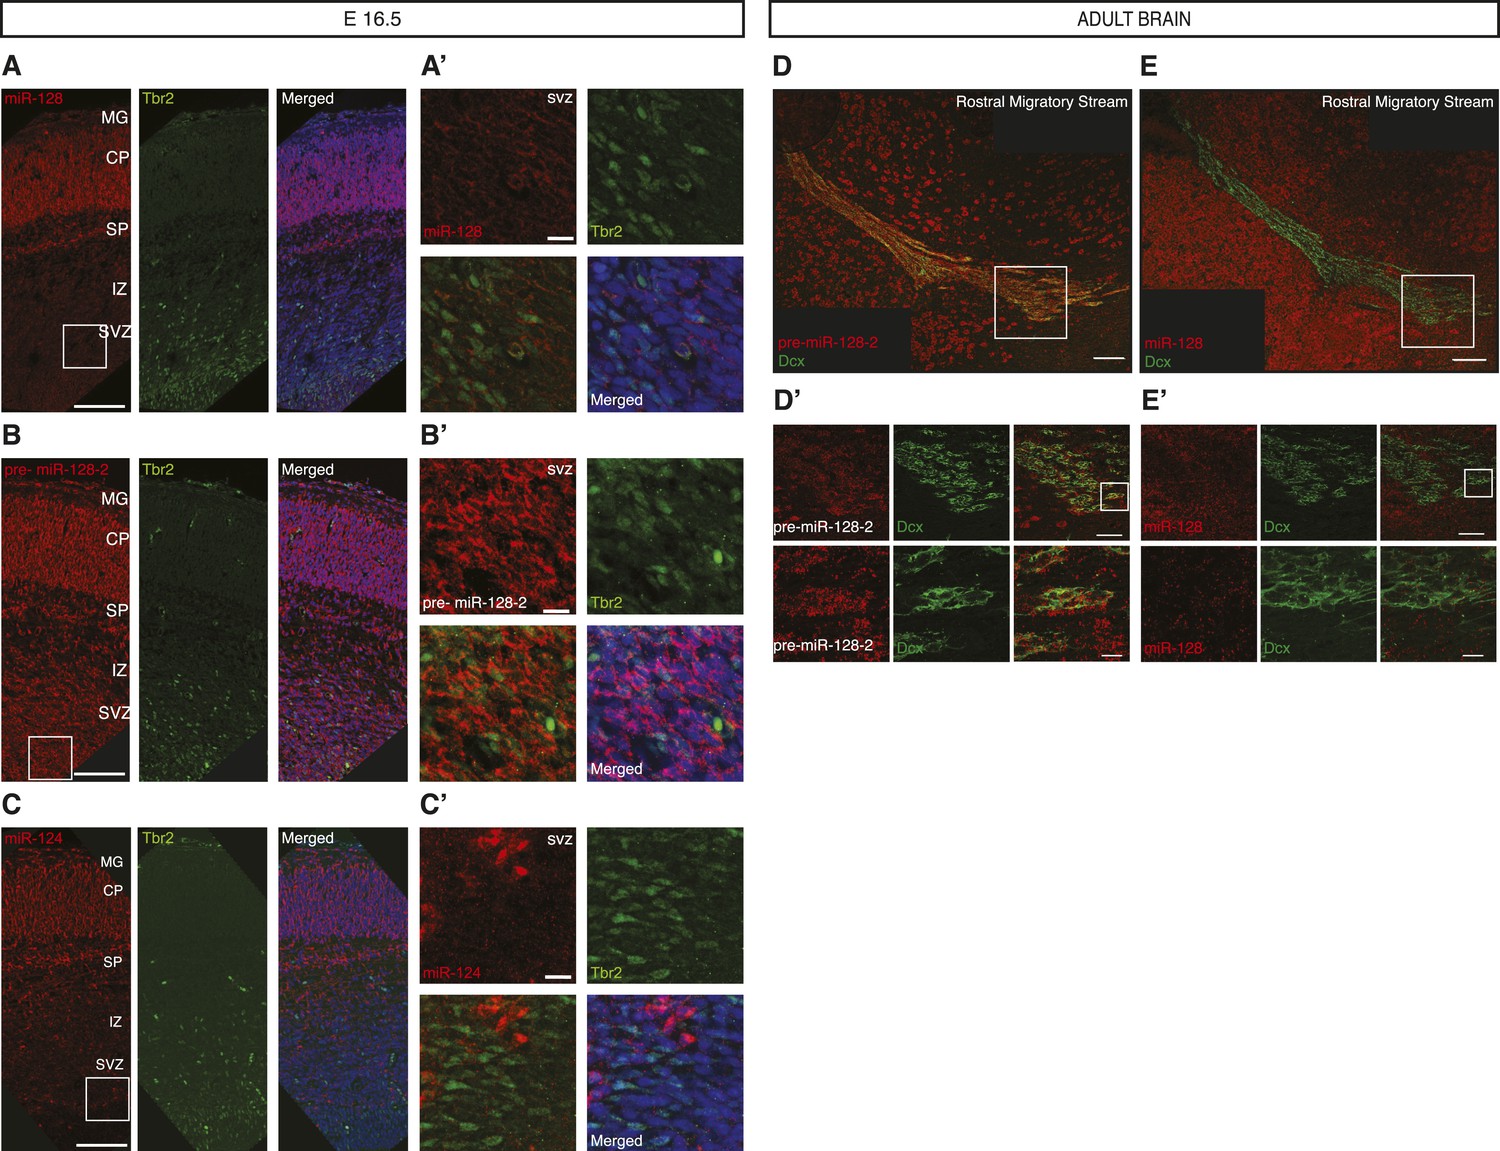
Post-transcriptional regulation of miR-128 during embryonic and adult neural migration.
(A, B and C) Fluorescent LNA probe in situ hybridization of E16.5 cortical sections shown in red for miR-128 (A, left) pre-miR-128-2 (B, left) and miR-124 (C, left) and co-stained for the basal progenitor marker Tbr2 in green (A, B and C middle). Merged view with nuclei stained with DRAQ5 in blue is shown for comparison (A, B and C, right). Scale bar represents 100 μm. (A′ B′ and C′) Boxed regions in A, B and C are shown at higher magnification; scale bar represents 10 μm. Staining as for (A, B and C) as indicated, red and green channel merge is shown at lower left. Tbr-2+ intermediate progenitors in the SVZ co-stain for pre-miR-128-2 but not miR-128 or miR-124. miR-128 does not specifically stain the IZ, miR-124+ cells in the IZ are Tbr2−. MG: marginal zone, CP: cortical plate, SP: subplate, IZ: intermediate zone, SVZ: subventricular zone, VZ: ventricular zone. (D and E) Merged view of adult brain sagittal sections hybridized as above for pre-miR-128-2 (D, red) and miR-128 (E, red) and co-stained for the migrating neuroblast marker Doublecortin (Dcx, green). Scale bar 100 μm. (D′ and E′): Boxed areas from the RMS in D and E are shown in serial magnification. Scale bars represent 50 μm (first row) and 10 μm (second row). Individual channels are shown as indicated, with a merged view on the right. Dcx+ neuroblasts stain for pre-miR-128-2 but not miR-128.
Figure 2—figure supplement 3
Differential staining of miR-128 and pre-miR-128-2 in corticogenesis.
(A and B). Depicted are the false color renderings of the images in Figure 2B,C used to measure the fluorescence intensity in the VZ/SVZ, IZ and CP (Figure 2D,E).
Figure 3 with 1 supplement
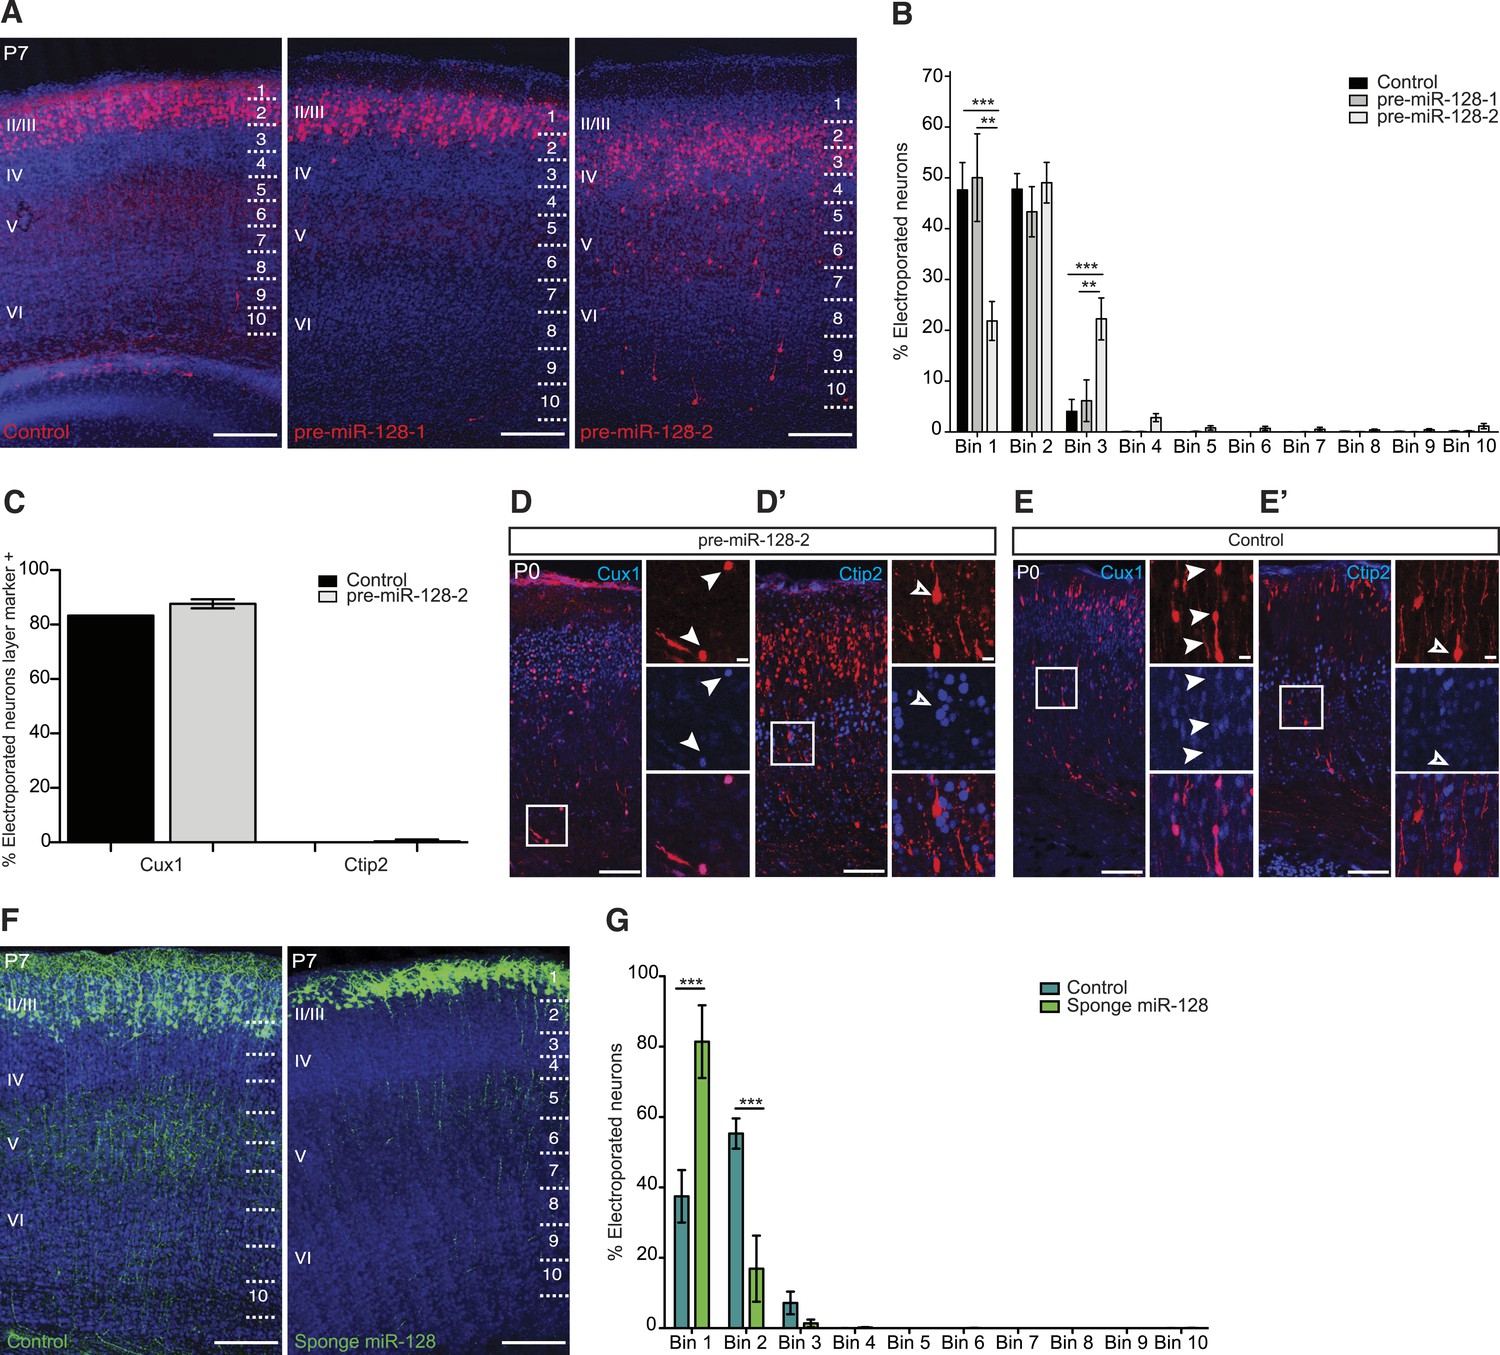
miR-128 misexpression impairs neuronal migration.
(A) Representative brain sections of P7 mice showing intron-RED control (left), pre-miR-128-1-RED (middle), pre-mir-128-2-RED (right) after in utero electroporation at E15.5. Sections were processed for staining with DRAQ5 to reveal nuclei and anti-RFP antibody to reveal electroporated cells. On the right side of each picture the position of the bins used to assess migration is shown (see ‘Materials and methods’). Scale bars represent 50 µm. (B) Percent of total counted neurons present in each bin is plotted. Data are from 3 to 4 mice per condition. Two-way ANOVA with Bonferroni post-test, error bars represent Standard deviation. *p < 0.05 **p < 0.01, ***p < 0.001. Electroporation of pre-miR-128-2 (white bars) but not pre-miR-128-1 (gray bars) caused a shift from uppermost layers (Bin 1) to lower layers (Bin 3) compared to control (black bars). (C) Quantification of P0 electroporated neurons expressing the upper layer marker Cux1 or the layer V marker Ctip2. Electroporation of pre-miR-128-2-RED (gray bars) does not change the cell fate compared to control (black bars). (D–E′) Representative brain sections of P0 mice, analyzed in (C), stained for dsRed to show pre-miR-128-2-RED electroporated cells (red, D and D′) and Intron-RED (red, E and E′). In (D) and (E) sections were co-stained for the layer II-IV marker Cux1 in blue. In (D′) and (E′) sections were co-stained for the layer V marker Ctip2 in blue. Neighboring images show higher magnification views of boxed regions of interest. In (D) and (E) from top to bottom: pre-miR-128-2 (red, D) or control (red, E), Cux1 (blue) and merged view. In (D′) and (E′) from top to bottom: pre-miR-128-2 (red, D′) or control (E′), Ctip2 (blue) and merged view. Scale bars 20 μm or 5 μm. Arrowheads in (D and E) mark dsRED+/Cux1+ migrating cells. Empty arrowhead in (D′ and E′) marks a dsRED+/Ctip2- cell situated in layer V. (F) Representative brain sections of P7 mice showing the control eGFP construct (left) and the miR-128 sponge (right) after in utero electroporation at E15.5. Sections were processed for staining with DRAQ5 to reveal nuclei and anti-GFP antibody to reveal electroporated cells. On the right side of each picture the position of the bins used to assess migration is shown (see ‘Materials and methods’). Scale bar represents 50 µm. (G) Percent of total counted neurons present in each bin is plotted. Data are from 3 to 5 mice per condition. Two-way ANOVA with Bonferroni post-test, error bars represent Standard deviation ***p < 0.001. Electroporation of the miR-128 sponge caused a shift from Bins 2–3 to Bin 1 (light green bars) compared to control (dark green bars).
Figure 3—figure supplement 1
Ectopic miR-128-2 is processed to miR-128 after in utero electroporation.
(A) miR-128 in situ hybridization using colorimetric NBT/BCIP detection (left, false colored in green) on E18.5 brains after electroporation at E15.5 with pre-miR-128-2-RED after antibody staining for dsRed (middle, red). Nuclei were stained with DRAQ5 (blue). A merged view of miR-128 expression (green) and electroporated neurons (red) is on the right side of the panel. (B) Magnification of the boxed region in (A). Electroporated neurons (red) are the only cells expressing mature miR-128 (green) in the IZ. Arrows in (A) and (B) denote exemplary miR-128+/dsRed+ neurons. (C) miR-128 hybridization as in A (left, false colored in green) on control E18.5 brains after electroporation at E15.5 with Intron-RED and antibody staining for dsRed (red, middle). Nuclei were stained with DRAQ5 (blue). A merged view of miR-128 expression (green) and electroporated neurons (red) is on the right side of the panel. (D) Magnification of the boxed region in (C). Control electroporated neurons (red) in the IZ do not express mature miR-128 (green). Scale bar 50 µm. U: upper cortical plate, D: deeper cortical plate, SP: subplate.
Figure 4

Neurons misexpressing miR-128 show impaired radial morphology.
(A and B) P0 sections from littermates electroporated at E15.5 with control Intron-RED (A) or pre-miR-128-2-RED (B) expression constructs. Sections were stained for dsRed to reveal electroporated cells, rendered in black and white. Red lines indicate the boundaries of the deep layers of the cortical plate, as determined by nuclear staining (not depicted). (C) Reconstructed migrating neurons sampled from the deep layers (red lines in A and B). Upper row shows Intron-RED control neurons, bottom row shows pre-miR-128-2-RED electroporated neurons. (D) Box plot of total branch (upper graph) and filopodia (lower graph) number per reconstructed neuron. (58 neurons from 3 Intron-RED brains and 67 neurons from 5 pre-miR-128-2-RED brains were analyzed, significance determined with an unpaired Student’s t test *p < 0.05, **p < 0.01).
Figure 5 with 3 supplements
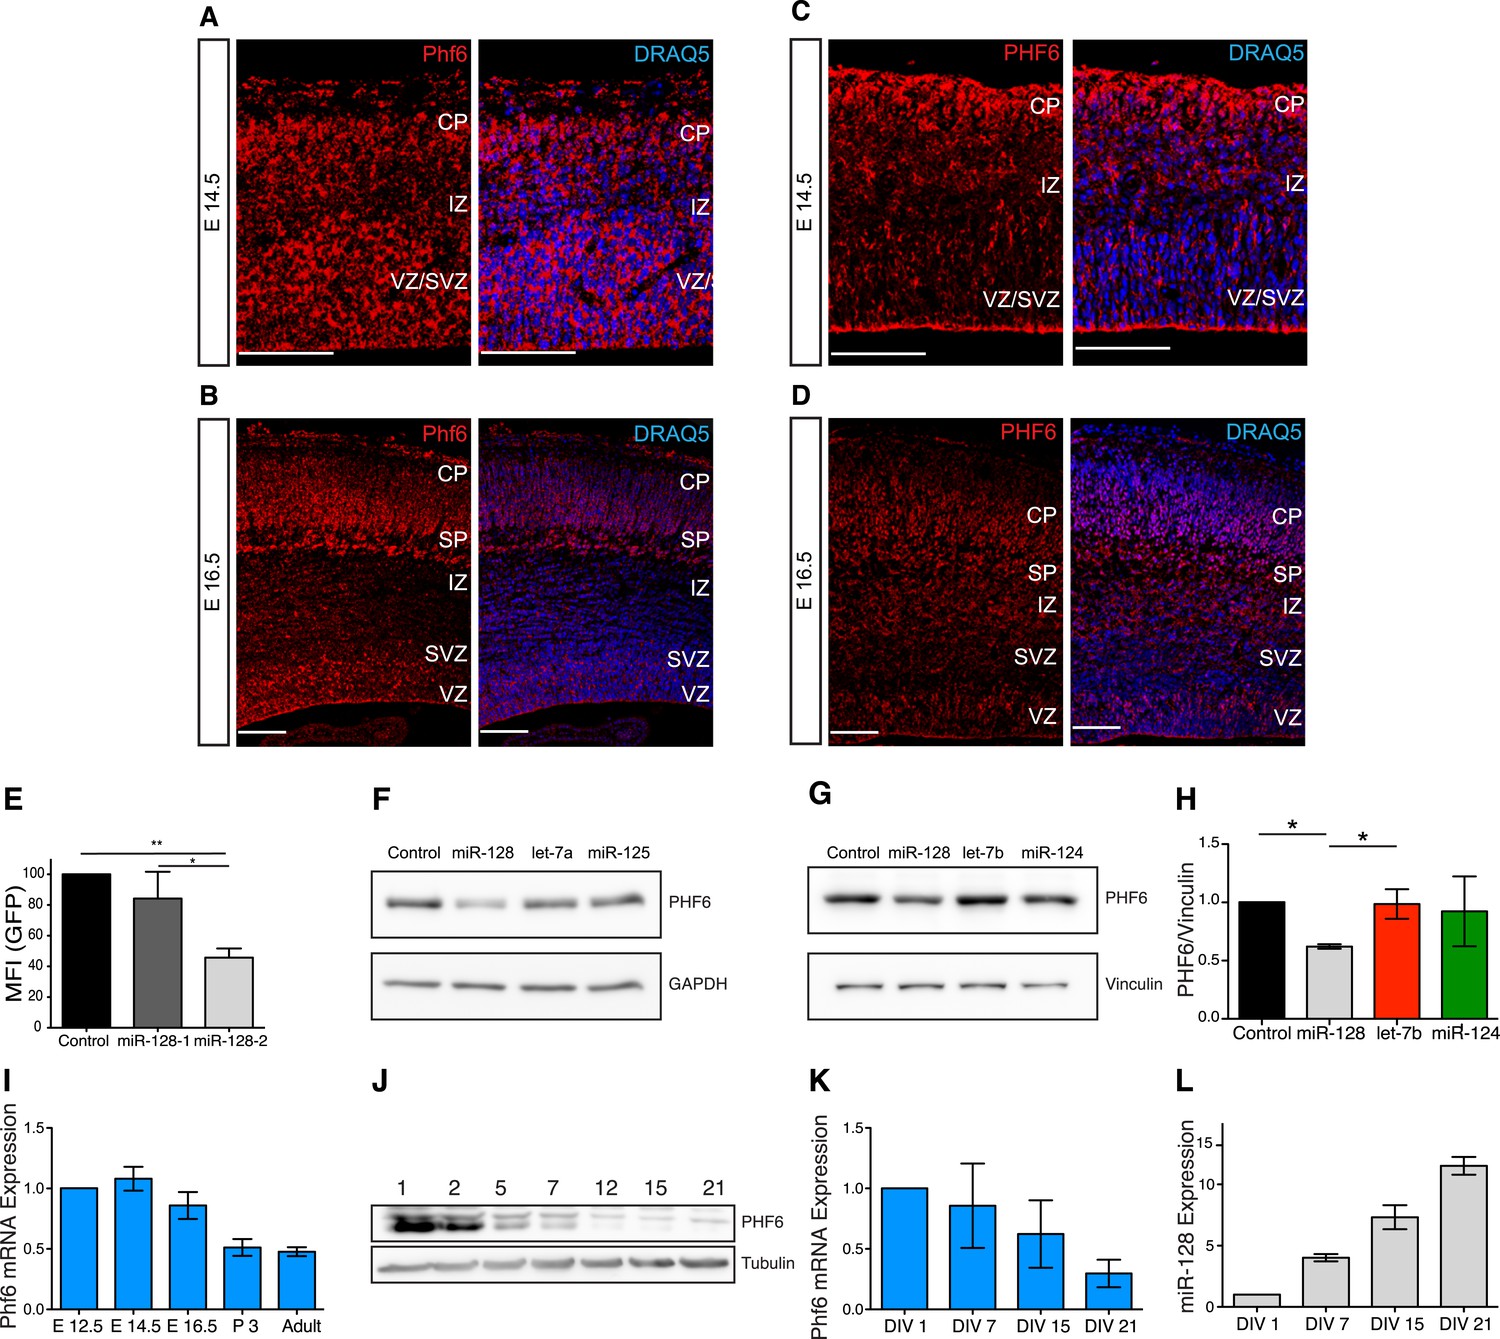
Regulation of PHF6 by miR-128.
(A and C) Phf6 mRNA (A) and protein (C) expression domains in E14.5 brain are comparable, both the mRNA and the protein are present in the VZ, SVZ, and IZ. The nuclear marker DRAQ5 allows the visualization of the brain subregions. Antibody specificity is documented in Figure 5—figure supplement 3A. (B and D) Phf6 mRNA (B) and protein (D) in E16.5 brain section are found in the CP, IZ as well as the SVZ and VZ. mRNA and protein expression patterns are comparable. The nuclear marker DRAQ5 allows the visualization of brain subregions. Scale bar 50 µm. CP: cortical plate, SP: subplate, IZ: intermediate zone, SVZ: subventricular zone, VZ ventricular zone. (E) Reporter assay on the Phf6 3′UTR, cloned in an eGFP plasmid. pre-miR-128-RED expression constructs and Intron-RED control were co-transfected with the GFP-Phf6-3′UTR sensor plasmid in HEK-293 cells. The GFP Mean Fluorescent Intensity (MFI) of miR-128/Phf6-3′UTR expressing cells is normalized to the GFP MFI of control/Phf6-3′UTR expressing cells. One-Way ANOVA with Bonferroni post-test, error bars represent Standard deviation *p < 0.01, **p < 0.05. (F) Representative Western blot of extracts from HeLa cells transfected with scrambled control, miR-128, let-7b or miR-125 synthetic miRNA mimics, as indicated. miR-128 has three, miR- let-7b and miR-125 no predicted binding sites in the Phf6 3′UTR. Upper panel shows signal for endogenous PHF6 protein, lower panel GAPDH as loading control. (G) Representative Western blot of extracts from HEK-293 cells transfected with scrambled control, miR-128, let-7b or miR-124 synthetic miRNA mimics, as indicated. miR-128 has three, miR-124 one and let-7b no predicted binding sites in the Phf6 3’UTR. Upper panel shows signal for endogenous PHF6 protein, lower panel Vinculin as loading control as indicated to the right. (H) Quantification of PHF6 protein levels relative to Vinculin, as shown in (F). miR-128 expression reduced PHF6 protein levels approximately 50% compared to the let-7b control (average of 3 independent experiments, *p < 0.01 One-Way ANOVA, error bars represent Standard deviation). (I) qRT-PCR for Phf6 mRNA from staged mRNA samples between E12.5 and Adult. Phf6 expression was normalized to the reference mRNA Oaz1. Average of three independent experiments, error bars show Standard deviation. (J) Western blot of PHF6 protein levels in primary cortical neurons cultured for the indicated days in vitro (DIV). (K) qRT-PCR for Phf6 mRNA performed on primary cortical neurons, DIV as indicated. Phf6 expression was normalized to the reference mRNA GAPDH. (Average of three independent experiments, error bars represent Standard deviation). (L) TaqMan qPCR for miR-128 was performed on the same RNA samples as in Panel J. Expression level was normalized to sno135 RNA (Average of three independent experiments, error bars represent Standard deviation).
Figure 5—figure supplement 1
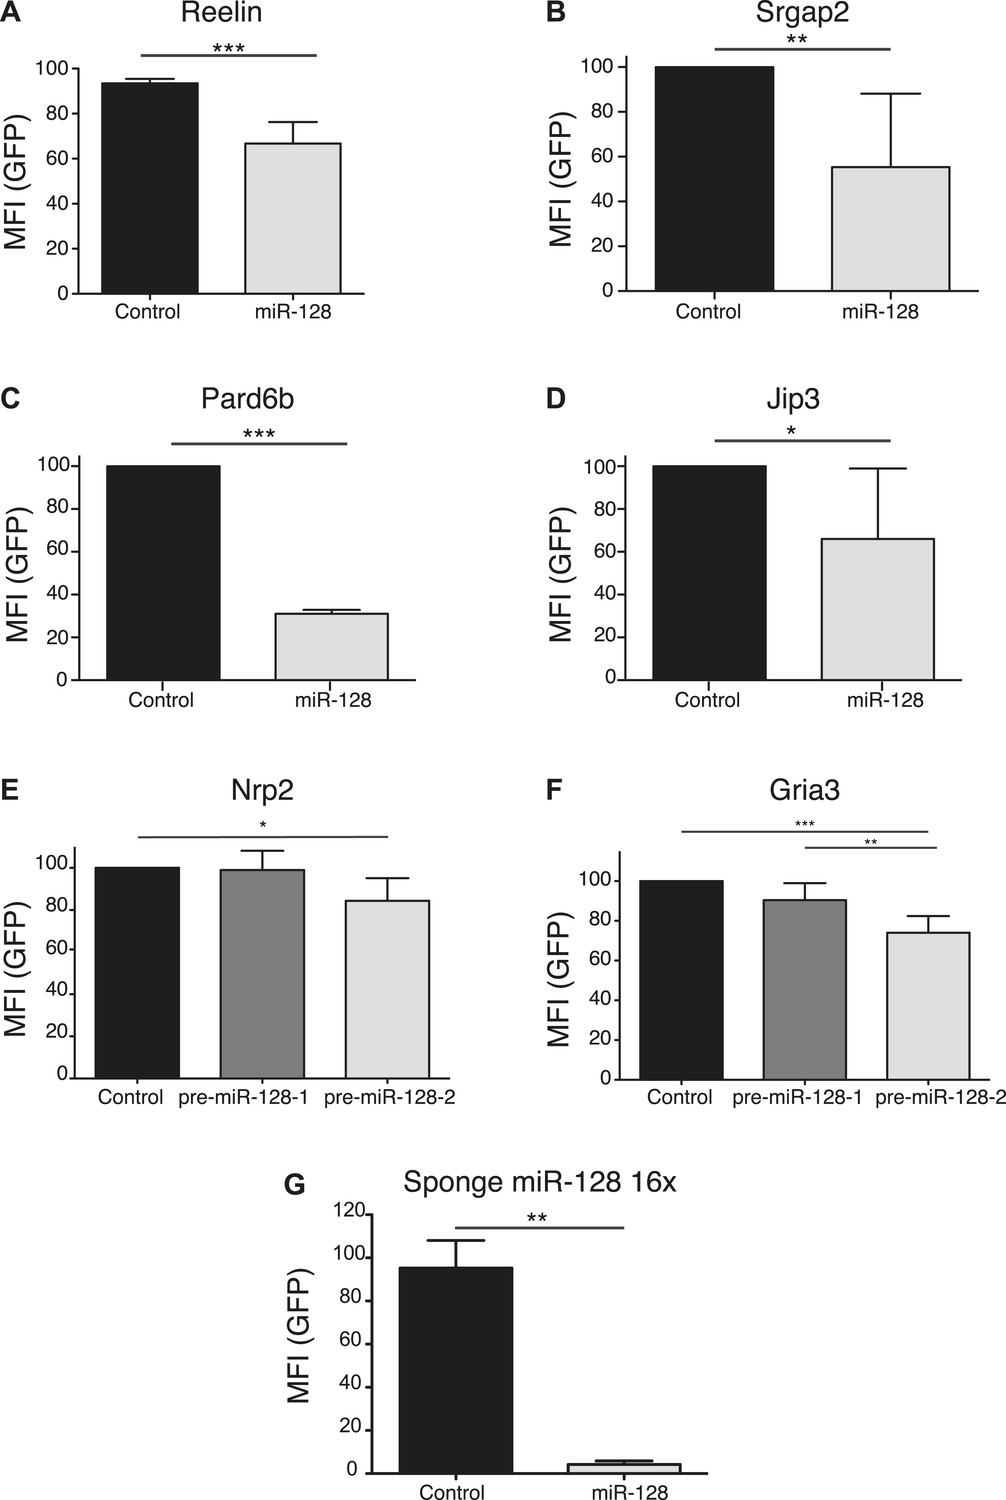
Validation of miR-128 targets using a reporter assay.
(A–F) Reporter assay using 3′UTR's from putative miR-128 targets, cloned in a modified eGFP plasmid (GFP-3'UTR). miR-128 synthetic miRNA mimic (A, B, C, D) or pre-miR-128-RED expression constructs (E, F) and Their respective controls were co-transfected with the GFP-3′UTR reporter plasmid in N2A cells (B, C, D), or HEK-293 cells (A, E, F). The GFP mean fluorescent intensity (MFI) of miR-128/GFP-3′UTR expressing cells is normalized to the GFP MFI of Control/GFP-3′UTR expressing cells. (G) Reporter assay to validate the ability of the miR-128 sponge construct to recruit miR-128. Synthetic miR-128 or a scrambled negative control miRNA (Ambion) were co-transfected with the miR-128 sponge in HEK-293 cells. The GFP mean fluorescent intensity (MFI) of miR-128/ miR-128 sponge cells is normalized to the GFP MFI of control miRNA/miR-128 sponge- expressing cells. Average of three independent experiments, *p < 0.01, **p < 0.05, ***p < 0.001 Student’s T-test (A, B, C, D) One-way ANOVA (E, F, G), error bars represent Standard deviation).
Figure 5—figure supplement 2
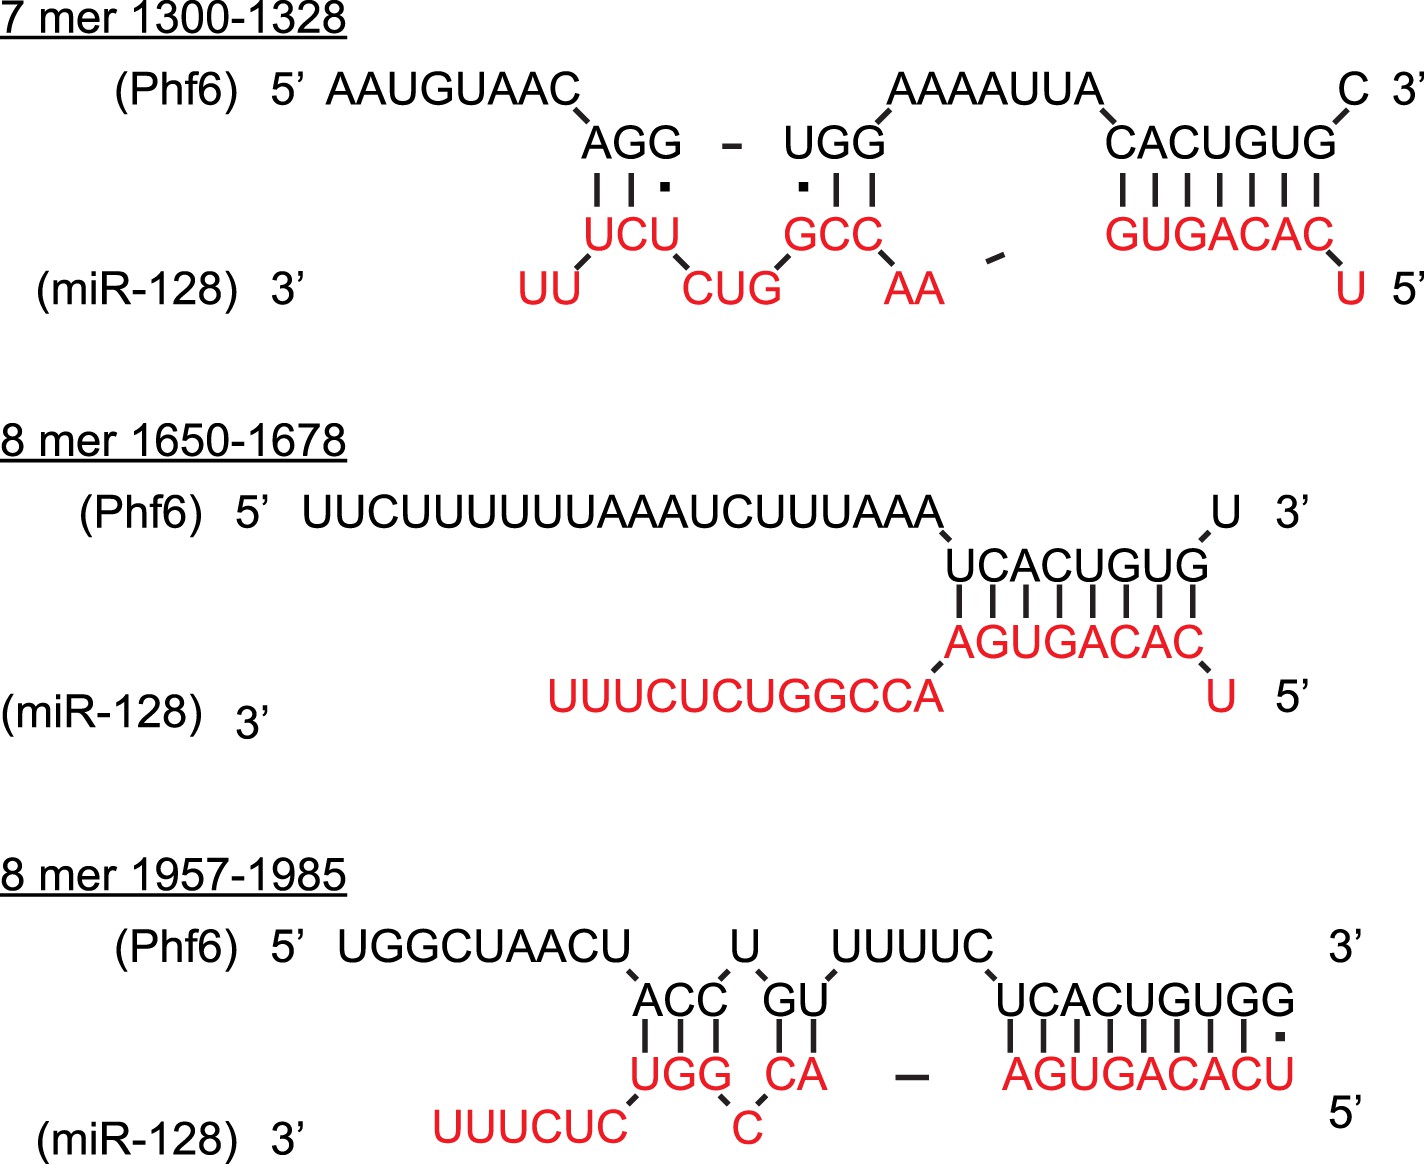
Multiple, conserved binding sites for miR-128 in the Phf6 3′UTR.
Predicted binding sites for miR-128 in the mouse Phf6 3′UTR, shown in black (adapted from Diana MicroT-CDS). The sequence of mature miR-128 is in red. Watson–Crick pairs are shown with vertical bars and wobble pairs with dots.
Figure 5—figure supplement 3
Western blot detection of Phf6.
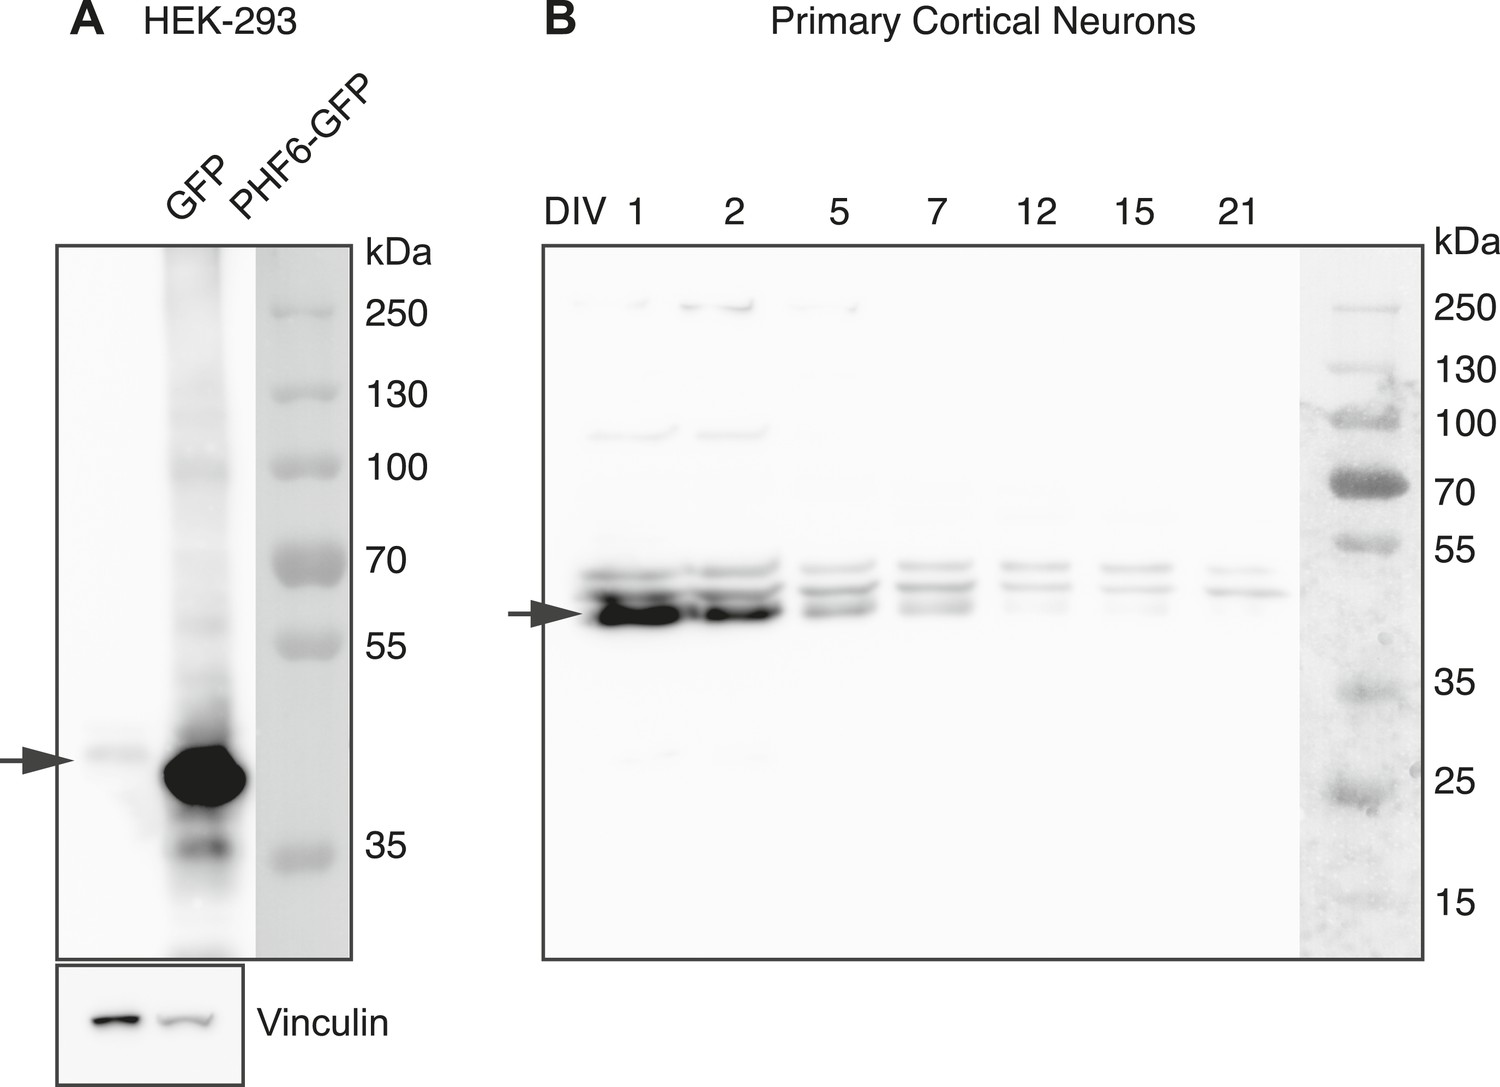
(A) Western blot of HEK-293 transfected with GFP empty vector (Lane 1) or PHF6-GFP plasmid (Lane 2). The blot was probed with the anti-PHF6 antibody from Bethyl used for immunohistochemistry in Figure 5. (1:4000). An arrow indicates the endogenous PHF6 protein in Lane 1, detected as a single band. Phf6 overexpression is confirmed in Lane 2. (B) The complete image of the western blot shown in Figure 5I using PHF6 antibody. The specific band is marked with an arrow (left). The detection antibody recognizes additional non-specific bands.
Figure 6

PHF6 rescues the migration defect caused by pre-miR-128-2.
(A and B) Brain sections of P7 mice electroporated at E15.5 with pre-miR-128-2-RED (A) or pre-miR-128-2-RED plus PHF6-GFP expression constructs (B). Sections were stained for dsRed and GFP to reveal electroporated cells. The position of bins used to quantify migration is shown on the right. Scale bar represents 50 µm. Cortical layers are labeled on the left, as determined by nuclear staining (not depicted). (C) Number of neurons in each bin was determined and expressed as the per cent contained in upper layers (Bin 1–4) vs deeper layers (Bin 5–10). (Five mice analyzed per condition. Significance determined by Two-way ANOVA with Bonferroni post-test **p < 0.01, error bars represent the Standard deviation).
Figure 7 with 2 supplements
miR-128 and PHF6 regulate dendritic complexity and intrinsic excitability.
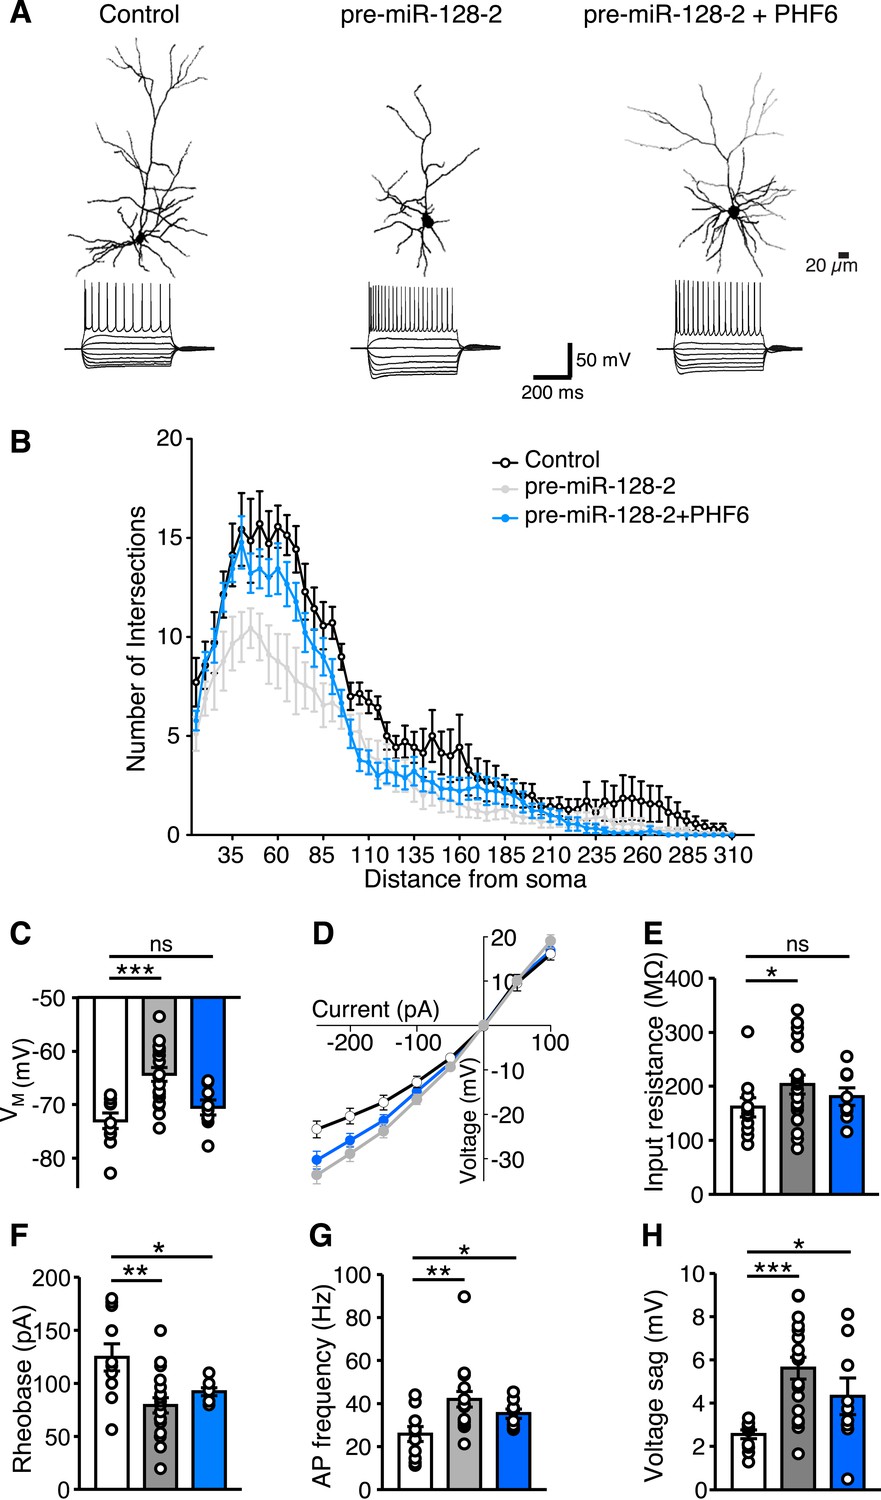
(A) Cells from electroporations using Intron-RED (left), pre-miR-128-2-RED (middle), or pre-miR-128-2-RED plus PHF6-GFP (right) were recorded and filled. Representative reconstructed neurons (top) and their voltage responses to a family of current pulses (bottom) are shown. Compared to Intron-RED control, AP discharge is increased by pre-miR-128-2-RED and intermediate upon co-expression of pre-miR-128-2-RED and PHF6-GFP. (B) Sholl analysis of filled and reconstructed neurons, from Intron-RED (open circles, n = 7 cells), pre-miR-128-2-RED (gray, n = 9 cells), and pre-miR-128-2-RED plus PHF6-GFP (blue, n = 9 cells) electroporated neurons. Error bars represent standard error of the mean. (C, E–H) Summary bar charts of intrinsic physiological properties: Membrane potential (VM C), Input resistance (RI E), Rheobase (F), Action Potential (AP) frequency (G) and voltage sag (H). Colors as in (B), bars are overlain by data from individual cells. (D) Current–voltage relationship for the three groups of electroporated neurons, color scheme as in (B). Note the steep curve for pre-miR-128-2-RED neurons, and partially recovered RI relationship for PHF6 rescue neurons. Statistics: ns – p > 0.05, *p < 0.05, **p < 0.01, ***p < 0.001, Two-way ANOVA for graph in (B) and Mann–Whitney non-parametric test for graphs in C, E–H.
Figure 7—figure supplement 1
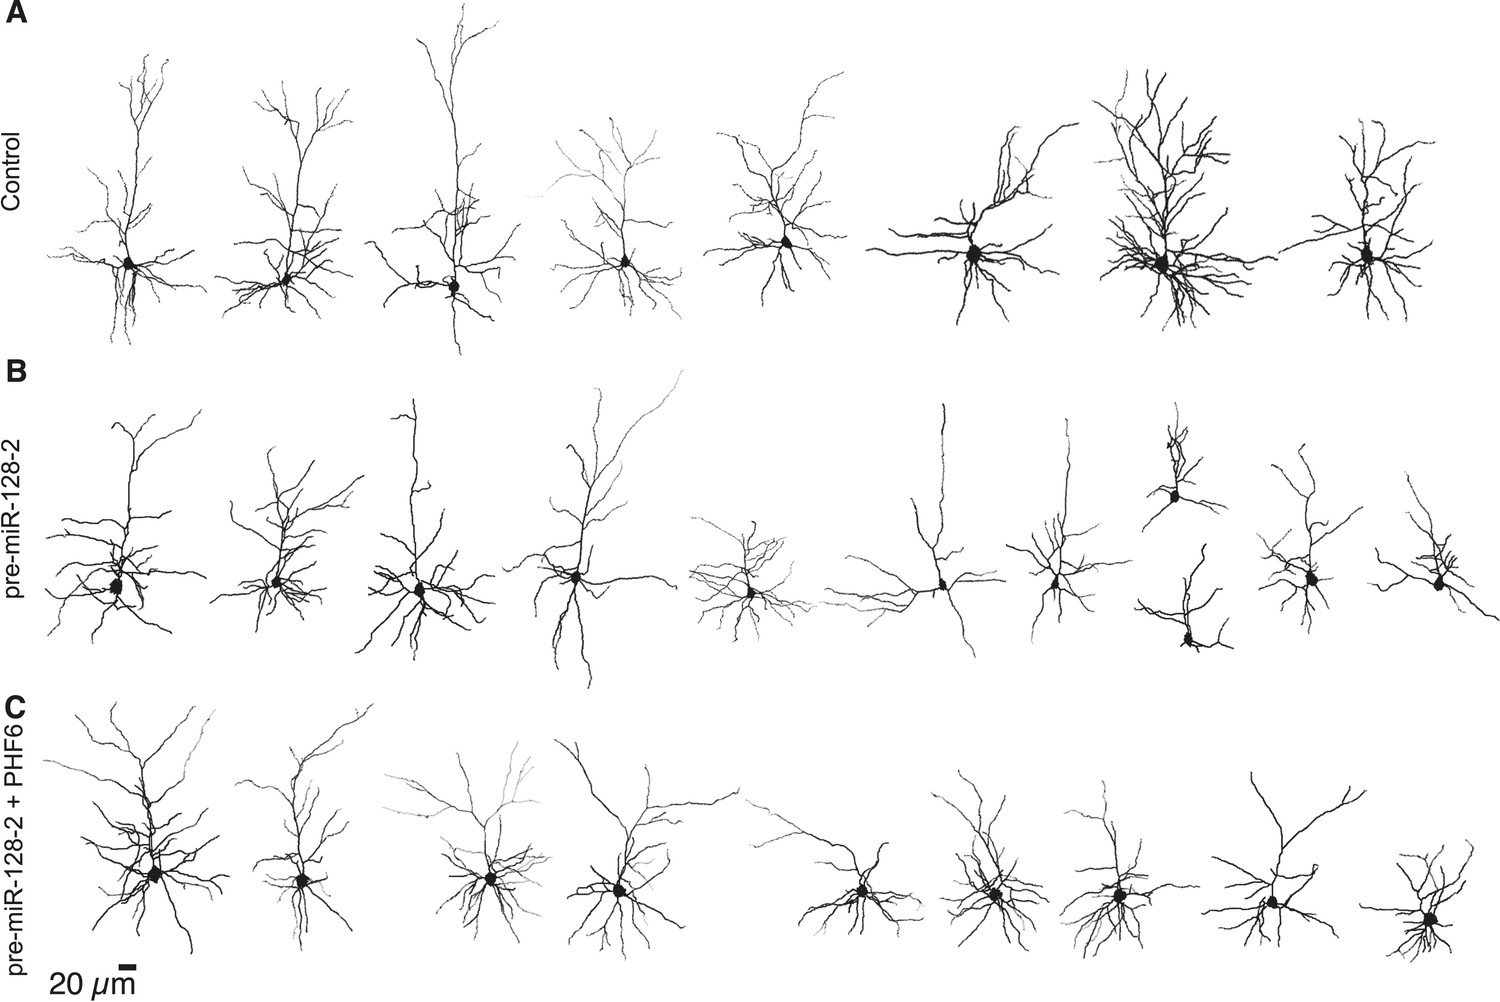
Reconstructed neurons used to perform Sholl analysis at P15.
(A–C) Reconstruction of P15 layer II/III neurons expressing Intron-RED (A), pre-miR-128-2-RED (B) or pre-miR-128-2-RED plus PHF6-GFP (C). Reconstruction was done on Z-stack images of biocytin-filled cells, here rendered in 2-D. The same neurons were also analyzed for their electrophysiological properties.
Figure 7—figure supplement 2
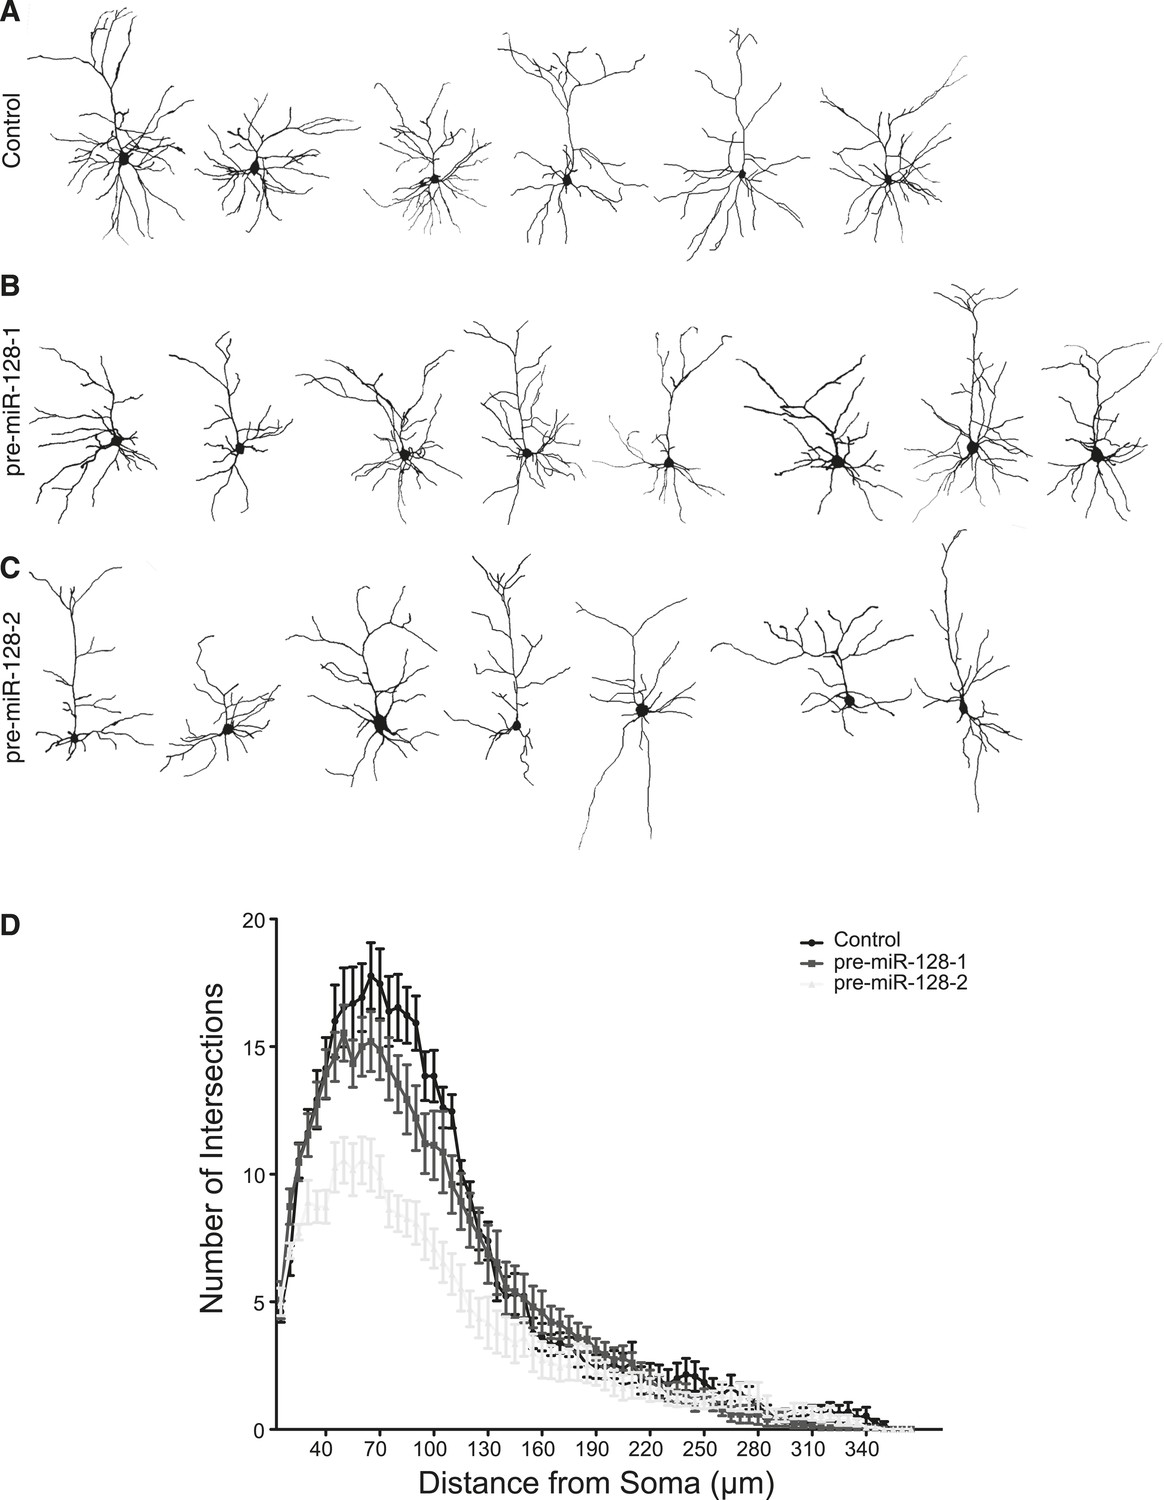
pre-miR-128-2 but not pre-miR-128-1 affects dendritic arbor complexity.
(A–C) Layer II/III neurons at P21 were reconstructed after antibody staining for dsRed after electroporation at E15.5 with Intron-RED (A), pre-miR-128-1-RED (B), or pre-miR-128-2-RED (C). (D) Sholl analysis on 3-D reconstructed neurons. Dendritic arbor complexity of Intron-RED (black), pre-miR-128-1-RED (gray) and pre-miR-128-2-RED (light gray) electroporated neurons is graphed. pre-miR-128-2-RED led to significantly less ramification between 35 µm and 120 µm from the soma compared to either control (Intron-RED or pre-miR-128-1-RED). Significance was tested with Two-way ANOVA, error bars represent Standard error of the mean.
Author response image 1
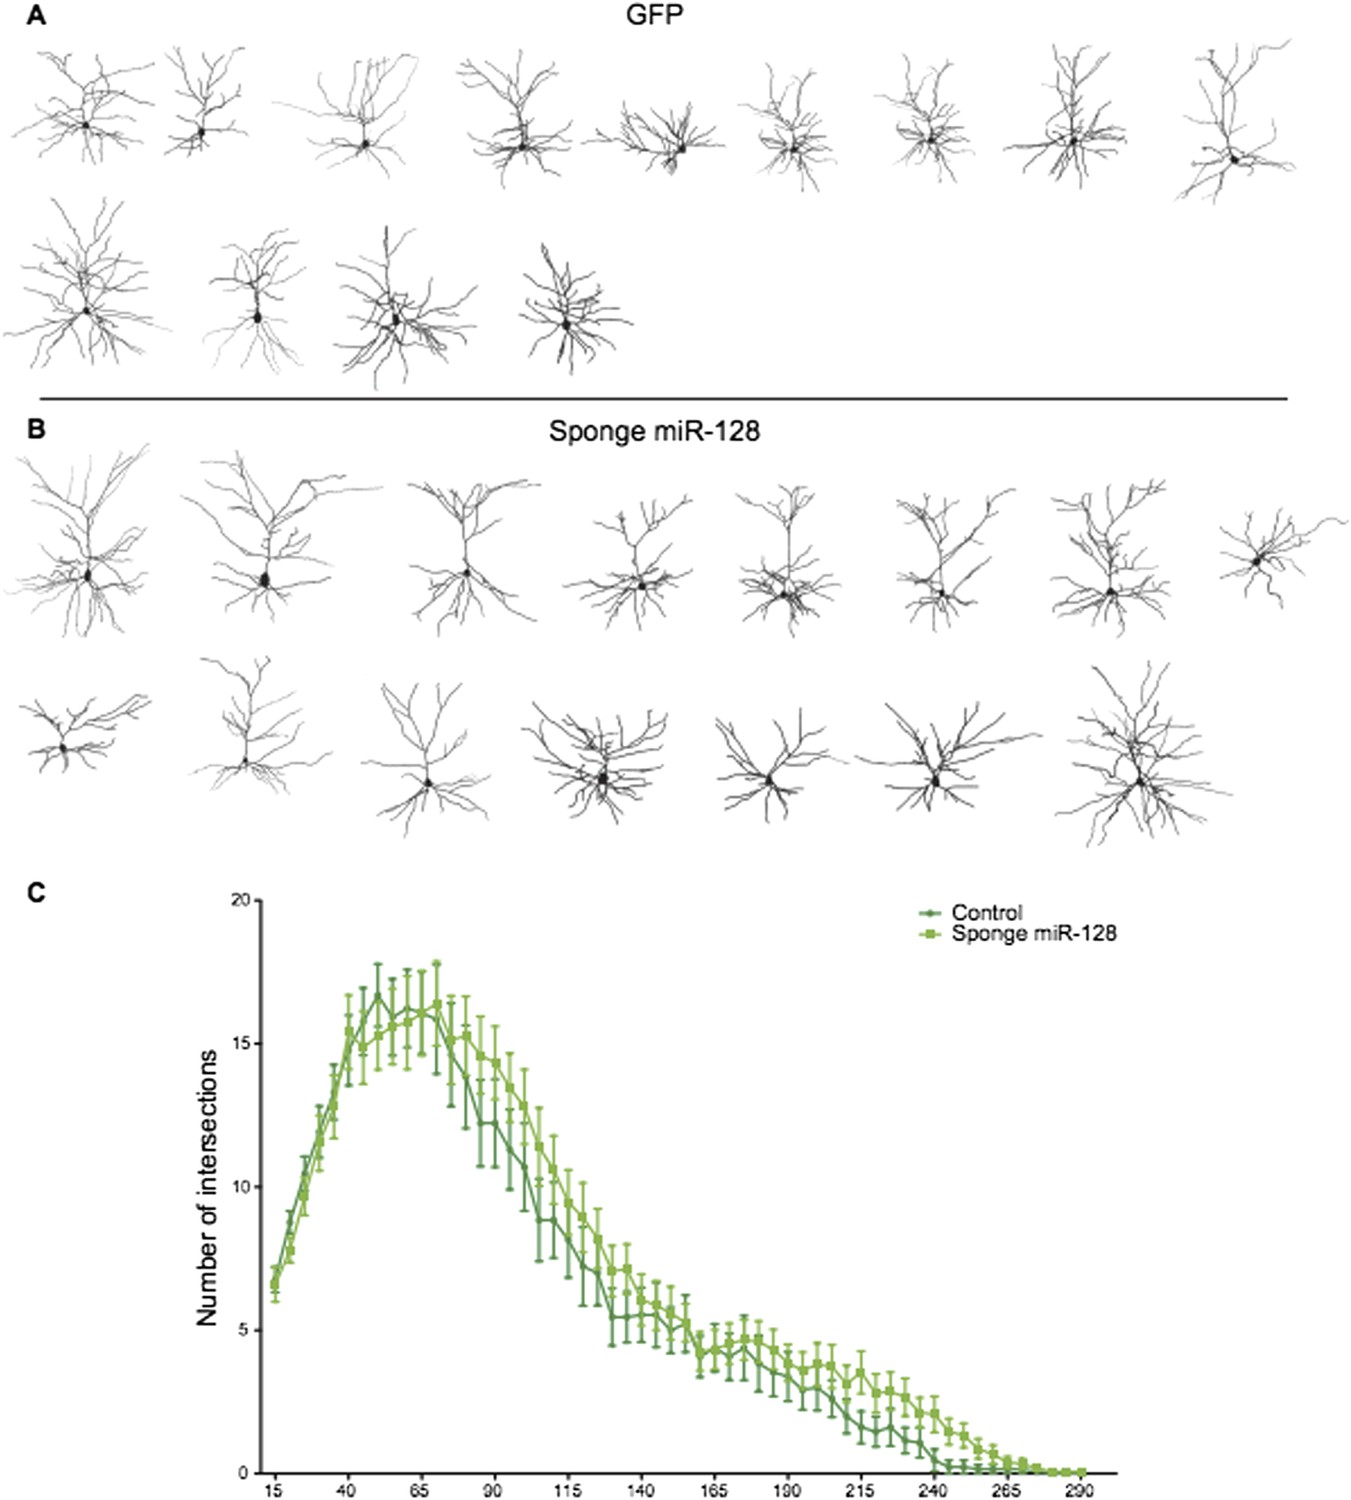
Reconstructed neurons obtained by biocytin filling of cells electroporated with an eGFP control (dark green), or an anti-miR-128 sponge (light green) construct are shown in A and B. The results of Sholl analysis are presented in C, comparing eGFP control (dark green) and anti-miR-128 sponge (light green). Error bars represent SEM.
Author response image 2
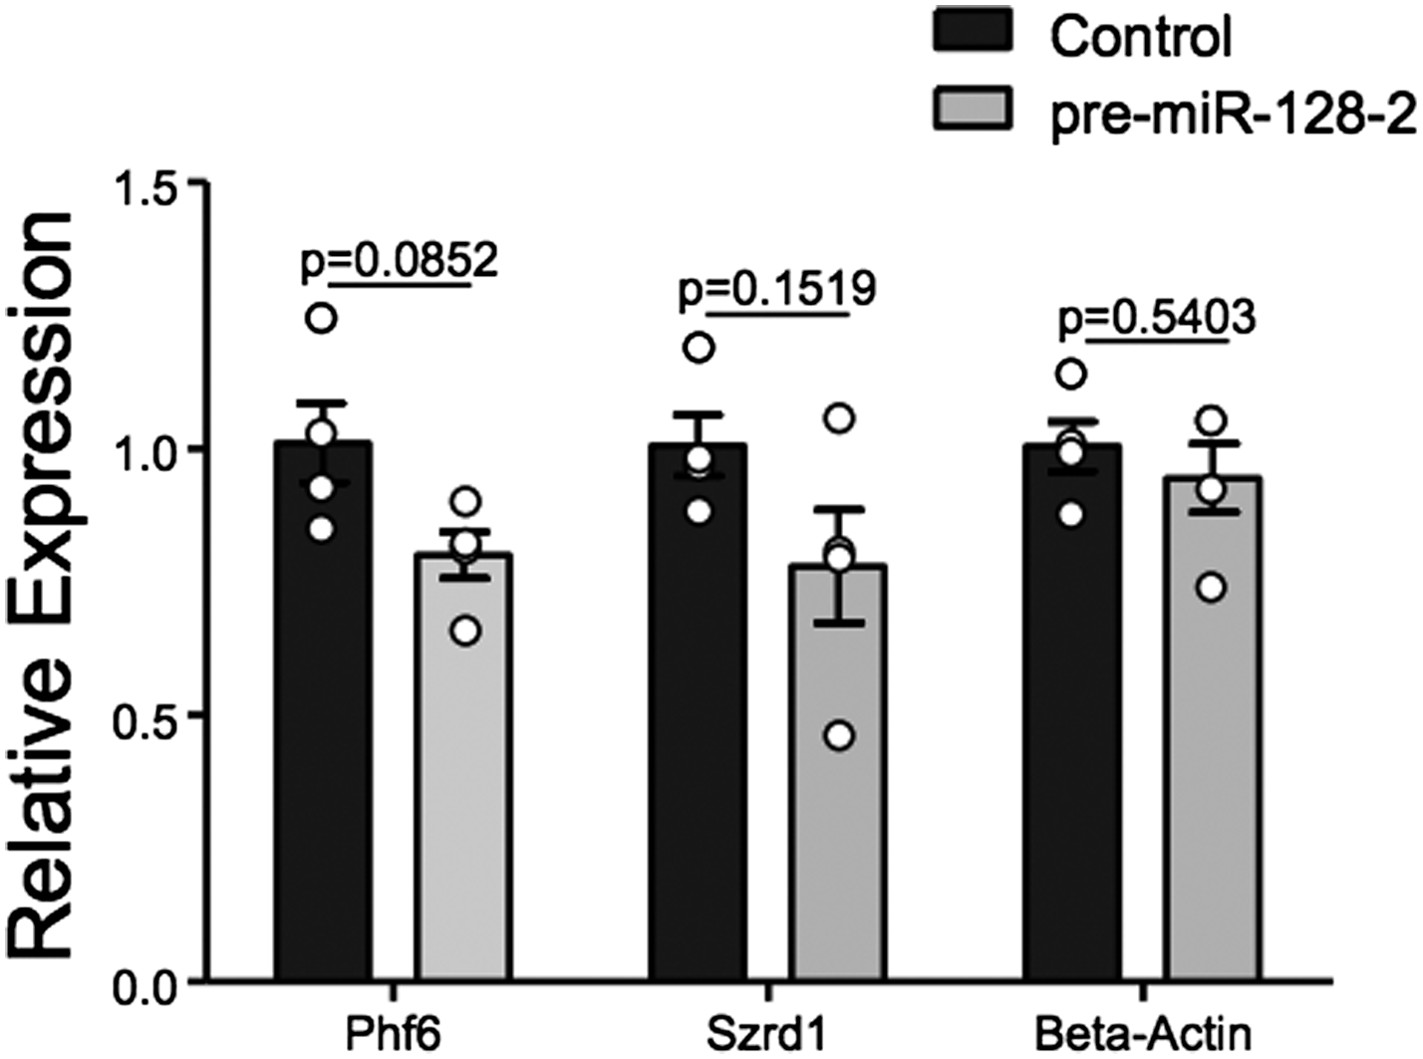
qRT-PCR performed on FAC-sorted cells obtained after electroporation at E15.5 with an Intron-RED control plasmid (black bars) or the miR-128-2 expression plasmid pre-miR-128-1-RED (gray bars). dsRed positive cells were collected, RNA isolated and qRT-PCR performed using Oaz1 as reference mRNA. PHf6, Szrd1 were readily detected, quantification is shown. Szrd1 as a known target of miR-128 is the positive control, β-actin the negative control. Although a clear trend is observed, the reduction of PHf6 mRNA in response to ectopic miR-128 is not statistically significant (unpaired t-test).
Additional files
-
Supplementary file 1
Contains Tables of LNA probe sequences, primers used in reporter, and expression plasmid cloning as well as qRT-PCR analysis.
- https://doi.org/10.7554/eLife.04263.021
-
Supplementary file 2
Related to Figure 7: data set used for Sholl analysis at P15.
- https://doi.org/10.7554/eLife.04263.022
-
Supplementary file 3
Related to Figure 7—figure supplement 2: data set used for Sholl analysis at P21.
- https://doi.org/10.7554/eLife.04263.023
Download links
A two-part list of links to download the article, or parts of the article, in various formats.
Downloads (link to download the article as PDF)
Open citations (links to open the citations from this article in various online reference manager services)
Cite this article (links to download the citations from this article in formats compatible with various reference manager tools)
miR-128 regulates neuronal migration, outgrowth and intrinsic excitability via the intellectual disability gene Phf6
eLife 4:e04263.
https://doi.org/10.7554/eLife.04263


