The basic leucine zipper transcription factor NFIL3 directs the development of a common innate lymphoid cell precursor
- University of Texas Southwestern Medical Center, United States
- Howard Hughes Medical Institute, University of Texas Southwestern Medical Center, United States
Figures
Figure 1 with 3 supplements
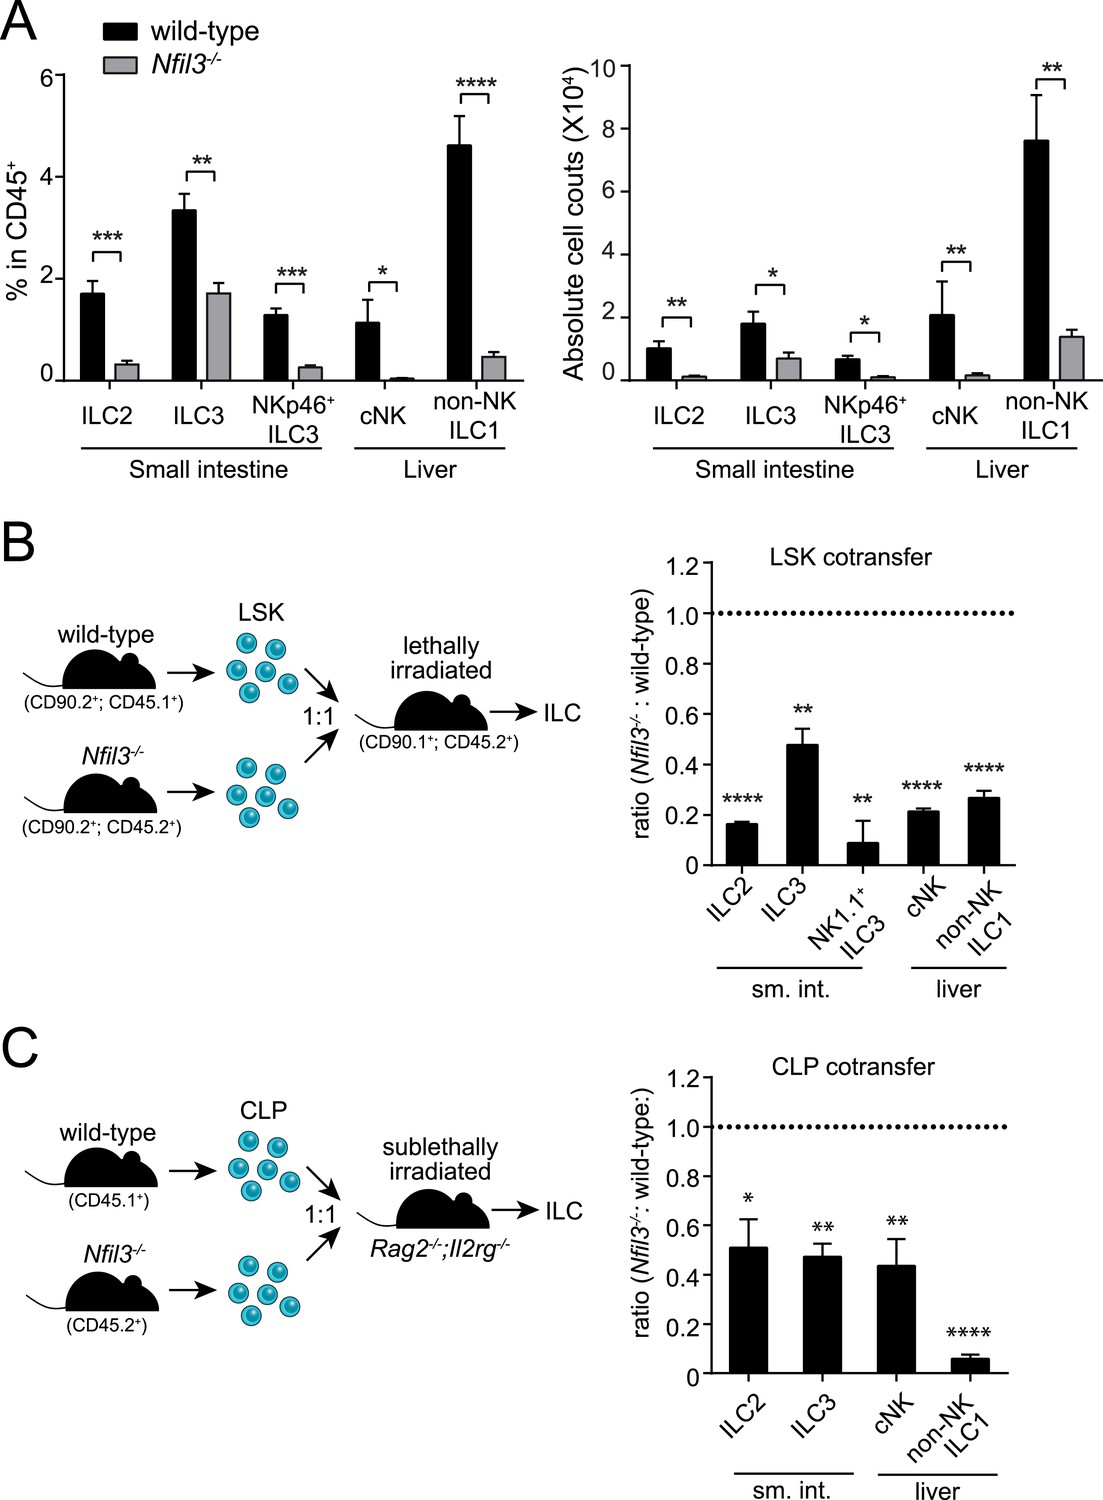
NFIL3 is required for innate lymphoid cell development in a cell-intrinsic manner.
(A) Nfil3−/− mice show reduced frequencies (left panel) and numbers (right panel) of major ILC types, including conventional NK (cNK), non-NK ILC1, ILC2 and ILC3. Lymphocytes were isolated from the small intestinal lamina propria and the liver and were stained as described in Materials and methods. Gating strategies are depicted in Figure 1—figure supplement 1. cNK cells were identified as CD45+ Lin(CD3ε, CD19, CD5, TCRβ, TCRγδ)- NK1.1+ T-BET+ EOMES+; non-NK ILC1 as CD45+ Lin(CD3ε, CD19, CD5, TCRβ, TCRγδ)- NK1.1+ T-BET+ EOMES−; ILC2 as CD45+ Lin(CD3ε, CD19)− GATA3+ Sca1+ KLRG1+; and ILC3 as CD45+ Lin(CD3ε, CD19)- RORγt+ CD127+. The NK receptor-expressing subtype of ILC3 (also known as NK22 cells) was identified by additional staining for NKp46. (B) NFIL3 regulates ILC development in a bone-marrow progenitor intrinsic manner. Equal numbers of wild-type (CD90.2+ CD45.1+) and Nfil3−/− (CD90.2+ CD45.2+) LSK cells were co-transplanted into lethally irradiated CD90.1+ mice. Liver CD90+ NK and non-NK ILC1 and intestinal ILC2 and ILC3 were analyzed 4-6 weeks later. The ratios of ILCs derived from wild-type (CD45.1+) and Nfil3−/− (CD45.2+) donor cells were calculated and plotted. Significant variation from 1.0 is indicated by *. sm. int., small intestine. (C) Nfil3 regulates ILC development in a CLP-intrinsic manner. Equal numbers of wild-type (CD45.1+) and Nfil3−/− (CD45.2+) CLPs were co-transplanted into sublethally irradiated alymphoid Rag2−/−;Il2rg−/− mice. ILCs were analyzed 4–6 weeks later as for the LSK experiment. Groups were compared by two-tailed student's t-test (A), one-sample t-test (B, LSK) or Wilcoxon signed rank test (B, CLP). Means ± SEM are shown. *, p < 0.05, **, p < 0.01, ***, p < 0.001, ****, p < 0.0001.
Figure 1—figure supplement 1

Gating strategy for ILC analysis.
(A) Small intestinal lamina propria lymphocytes (LPLs) were gated on CD45+ to remove non-hematopoietic cells and then on lineage markers (CD3ε and CD19) to exclude B and T cells (upper panel). ILC2 were identified as CD45+ Lin− GATA3+ Sca1+ and were more stringently gated on expression of KLRG1. Total ILC3 were identified as CD45+ Lin− RORγt+ CD127+ and the NKp46+ ILC3 (also known as NK22) were examined by staining for NKp46. (B) Liver lymphocytes were first gated on CD45+ as above and then on lineage (CD3ε, CD19, CD5, TCRβ, TCRγδ) and NK1.1. Lin− NK1.1+ cells were further examined for T-BET and EOMES expression. Conventional NK (cNK) cells were identified as CD45+ Lin− NK1.1+ T-BET+ EOMES+ and non-NK ILC1 as CD45+ Lin− NK1.1+ T-BET+ EOMES−.
Figure 1—figure supplement 2
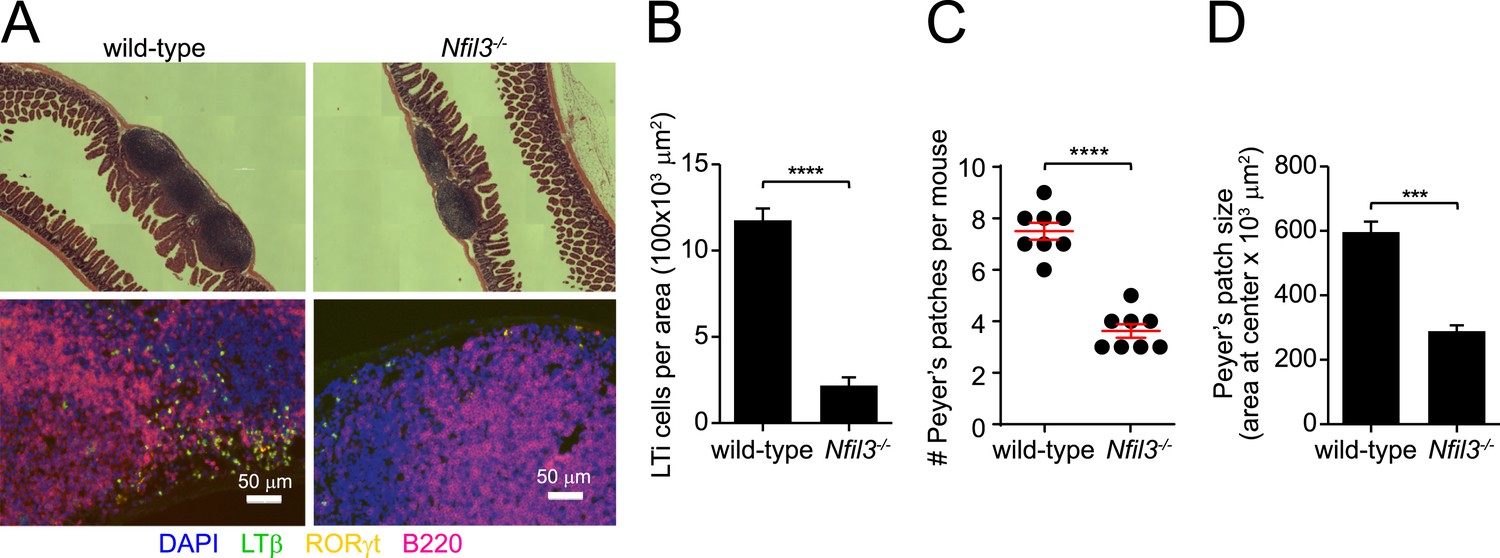
Nfil3−/− mice are deficient in Peyer's patches and lymphoid tissue inducer cells.
(A) Peyer's patches were examined in wild-type and Nfil3−/− mice by hematoxylin and eosin (H&E) staining (upper panel) and immunofluorescence (lower panel). Anti-lymphotoxin β (LTβ) and anti-RORγt were used to detect lymphoid tissue inducer (LTi) cells and anti-B220 was used to identify B cells. Scale bars = 50 μm. (B) LTi cells were enumerated as a function of Peyer's patch area. N = 4–5 mice/group. (C) Peyer's patches were enumerated in the small intestines of wild-type and Nfil3−/− mice. (D) Peyer's patch size was measured by determining the area of the section of tissue at the center (necessitated by the irregular shape of some Peyer's patches). N = 4–5 mice/group. Statistical analysis was performed with the two-tailed student's t-test. Means ± SEM are shown. ***, p < 0.001; ****, p < 0.0001.
Figure 1—figure supplement 3

LSK cells are not deficient in Nfil3−/− mice.
(A) Enrichment of Lineage-negative bone marrow cells by negative selection. Due to low frequencies of hematopoietic progenitor cells in the bone marrow of adult mice, lineage-negative cells were enriched by MACS-mediated negative selection prior to analysis or purification by FACS. To examine the efficiency of negative selection, samples before selection (upper panel) and after selection (lower panel) were subjected to CD45 and Lineage marker staining. At least 10-fold enrichment of Lineage-negative cells was routinely obtained during this process. Lineage markers used here include CD3ε, B220, CD11b, Gr-1, Ter119, CD5, TCRγδ, and NK1.1. (B–D) LSK cell frequencies and numbers are unaltered in Nfil3−/− mouse bone marrow. Lin− cKit+ Sca1+ (LSK) cells roughly represent the hematopoietic stem cells (HSC). Bone marrow cells were isolated from femur and tibia from wild-type and Nfil3−/− mice. Lineage marker (Lin)-negative cells were first enriched by negative selection and then stained with antibodies against Sca1 and cKit. Typical flow plots are shown in (B) and cell frequencies and absolute cell numbers from multiple mice are pooled in (C) and (D). Comparison between genotypes was done with the two-tailed student's t-test. Means ± SEM are shown. ns, not significant.
Figure 2 with 1 supplement
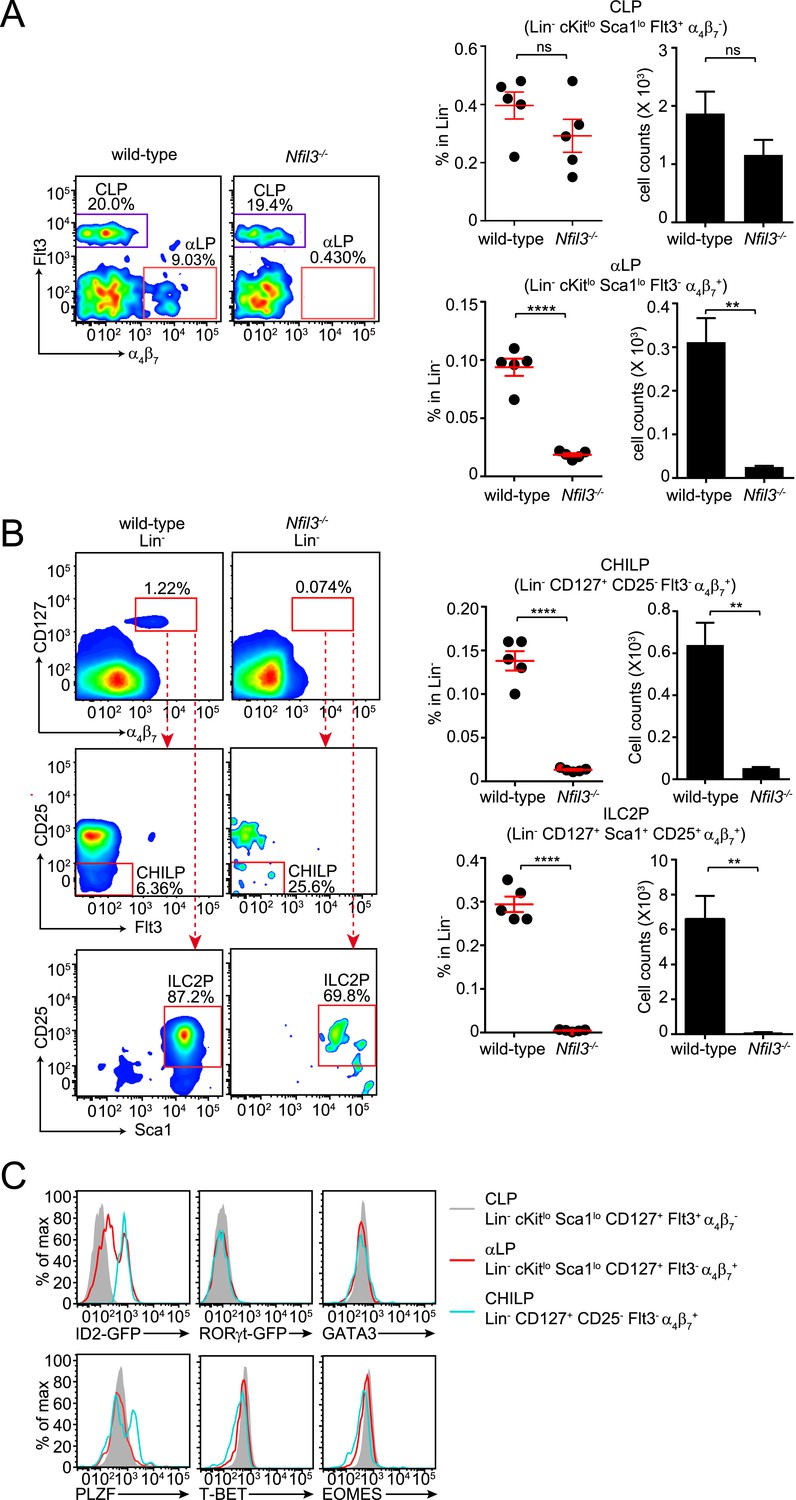
Nfil3−/− mice are deficient in bone marrow ILC precursors downstream of the CLP.
(A) Nfil3−/− mice have comparable CLP frequencies but show deficiencies in αLP. Bone marrow cells were isolated from femur and tibia of wild-type and Nfil3−/− mice. Lineage marker (CD3ε, B220, CD11b, Gr-1, Ter-119, CD5, TCRγδ, NK1.1)-negative (Lin−) cells were first enriched by negative selection and then stained with antibodies to identify CLP (Lin− cKitlow CD127+ Sca1low Flt3+ α4β7-) and αLP (Lin− cKitlow CD127+ Sca1low Flt3- α4β7+) (Possot et al., 2011). Gating strategy and representative flow plots are shown on the left and combined data for the frequencies and absolute numbers of CLP and αLP are shown on the right. (B) Nfil3−/− mice are deficient in common ‘helper-like’ innate lymphoid progenitor (CHILP) cells and ILC2P (Klose et al., 2014). Bone marrow cells were processed as above and CHILPs and ILC2Ps were identified as Lin− CD127+ α4β7+ CD25- Flt3- and Lin− CD127+ α4β7+ CD25+ Sca1+, respectively. (C) Expression of key transcription factors involved in ILC development in CLP, αLP and CHILP. Bone marrow cells were isolated from Id2GFP/+ and RorgtGFP/+ mice to examine Id2 and RORγt expression. Expression of GATA3, PLZF, T-BET and EOMES were examined in C57BL/6 mice with specific antibodies. Statistical analysis was performed with two-tailed student's t-test. Means ± SEM are shown. ns, not significant; ***, p < 0.001, ****, p < 0.0001.
Figure 2—figure supplement 1
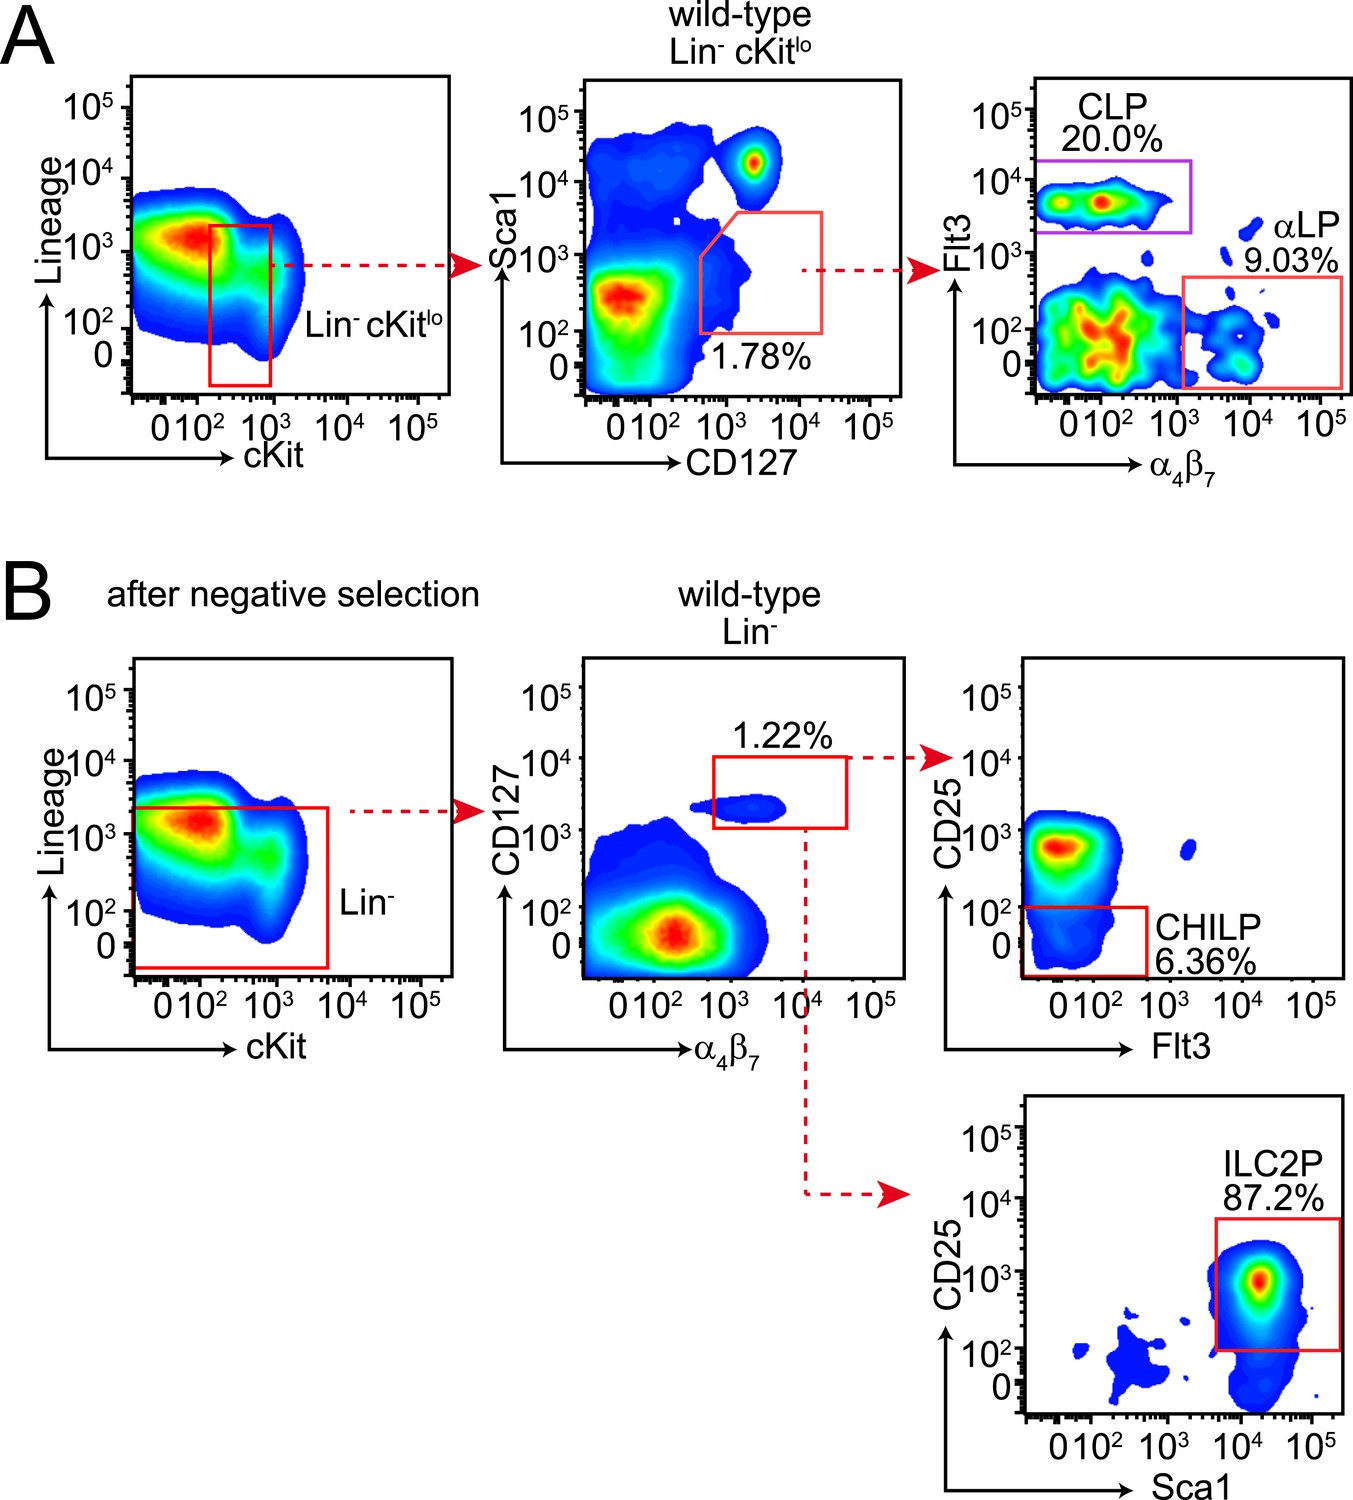
Gating strategies for bone marrow lymphoid progenitor analysis.
(A) Gating of common lymphoid progenitor (CLP) cells and α4β7 integrin-expressing CLP (αLP) in the bone marrow. Bone marrow cells were released from femur and tibia and differentiated cells were removed by negative selection. Cells were then stained with anti-biotin (Lineage), cKit, Sca1, CD127, Flt3 and α4β7. CLPs are identified as Lin− cKitlo Sca1lo CD127+ Flt3+ α4β7− and αLP as Lin− cKitlo Sca1lo CD127+ Flt3− α4β7+. (B) Gating of CHILP and ILC2P cells. Lineage-negative cells were prepared as above and stained with anti-biotin (Lineage), CD25, Sca1, CD127, Flt3 and α4β7. CHILPs are identified as Lin− CD127+ α4β7+ CD25− Flt3− and ILC2P as Lin− CD127+ α4β7+ CD25+ Sca1+.
Figure 3
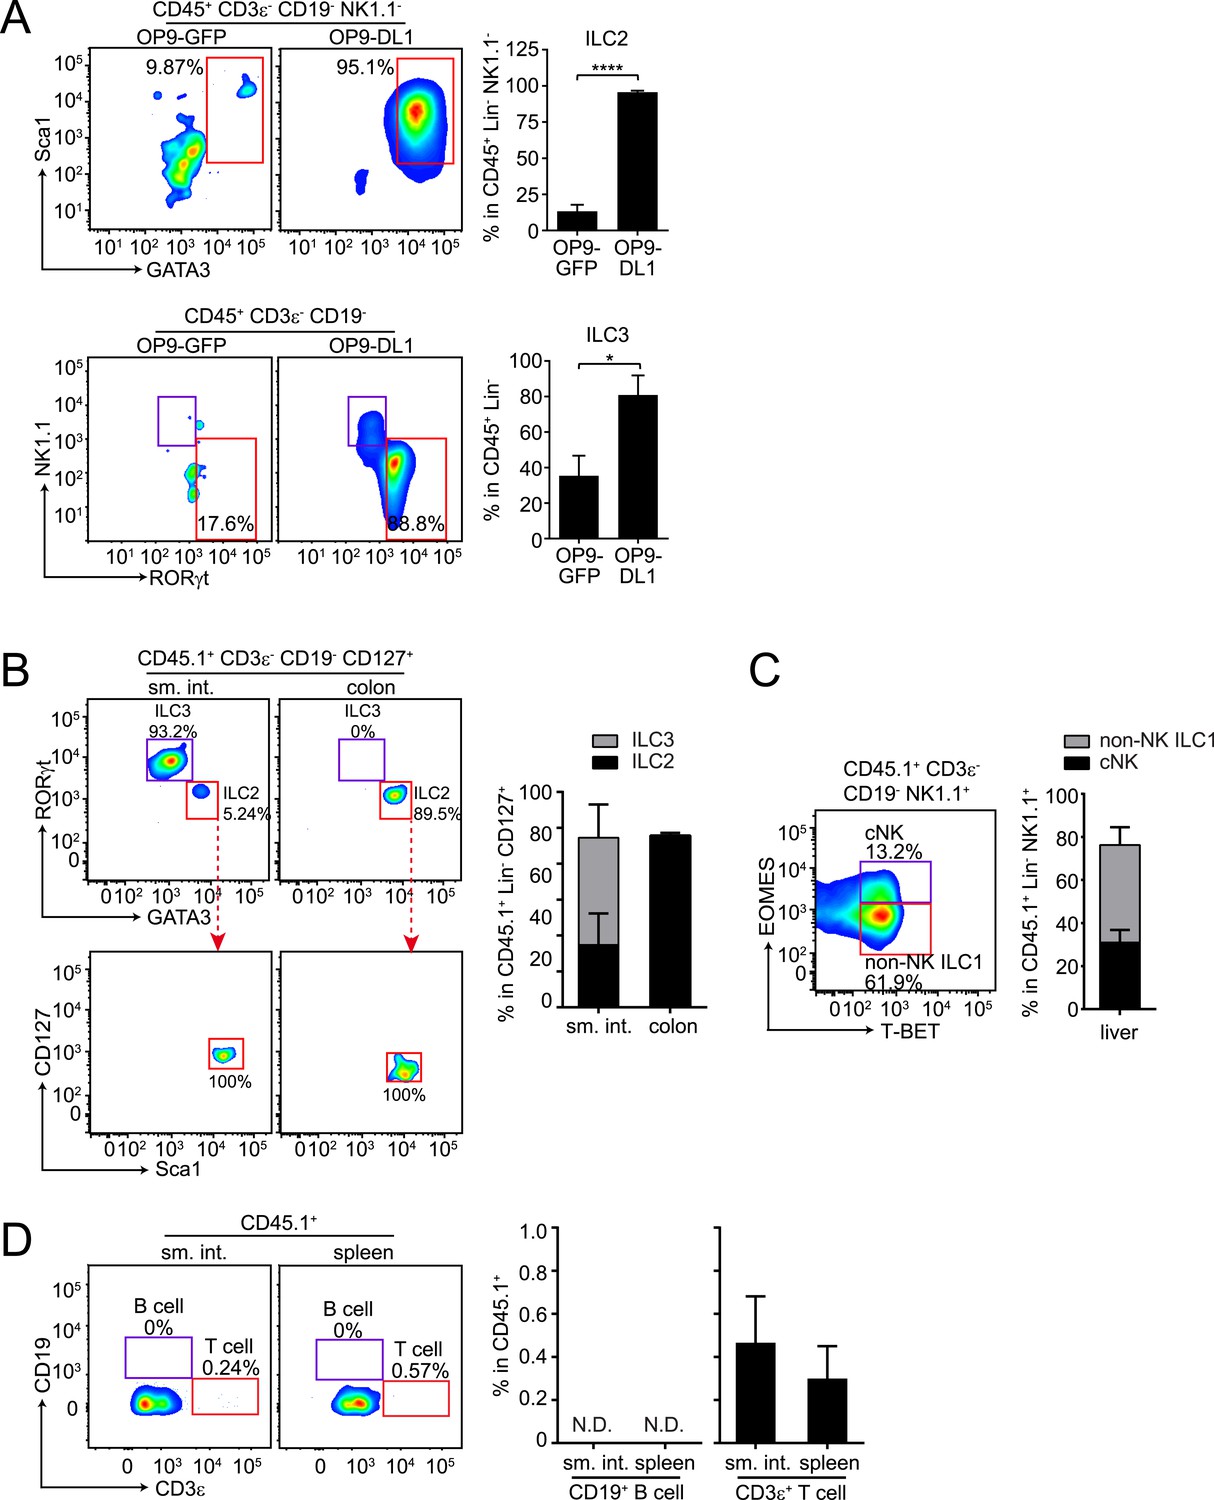
αLPs can differentiate into ILC2 in vitro and in vivo, and can thus give rise to all known ILC lineages.
(A) αLPs can differentiate into ILC2 in vitro. αLPs were purified by FACS and ∼25 cells were co-cultured with a bone marrow stromal cell line OP9 (OP9-GFP) or OP9 cells stably expressing the Notch ligand Delta-like 1 (OP9-DL1) for 14 days in the presence of ILC2-inducing (IL-2) or ILC3-inducing (IL-23) cytokines. Cells were then stained and analyzed by flow cytometry. ILC2 cells were identified as CD45+ CD3ε− CD19- GATA3+ Sca1+, ILC3 as RORγt+ NK1.1-, and ILC1 (including NK and non-NK ILC1) as CD45+ CD3ε− CD19- RORγt− NK1.1+. Typical flow plots are shown on the left and combined data are shown on the right. (B and C) αLPs can differentiate into ILC2, ILC3, cNK, and non-NK ILC1 in vivo. αLP cells were purified from wild-type (CD45.1+) mice and ∼1000 αLP cells were transplanted into sublethally irradiated Rag2−/−;Il2rg−/− (CD45.2+) mice. ILCs in the small intestine and colon (B) or liver (C) were examined 4–6 weeks later. (D) αLPs failed to differentiate into B cells both in the small intestine and spleen. There were small numbers of T cells in both the small intestine and spleen. Statistical analysis was performed with two-tailed student's t-test. Means ± SEM are shown. N.D., not detected; *, p < 0.05; ***, p < 0.001.
Figure 4 with 1 supplement
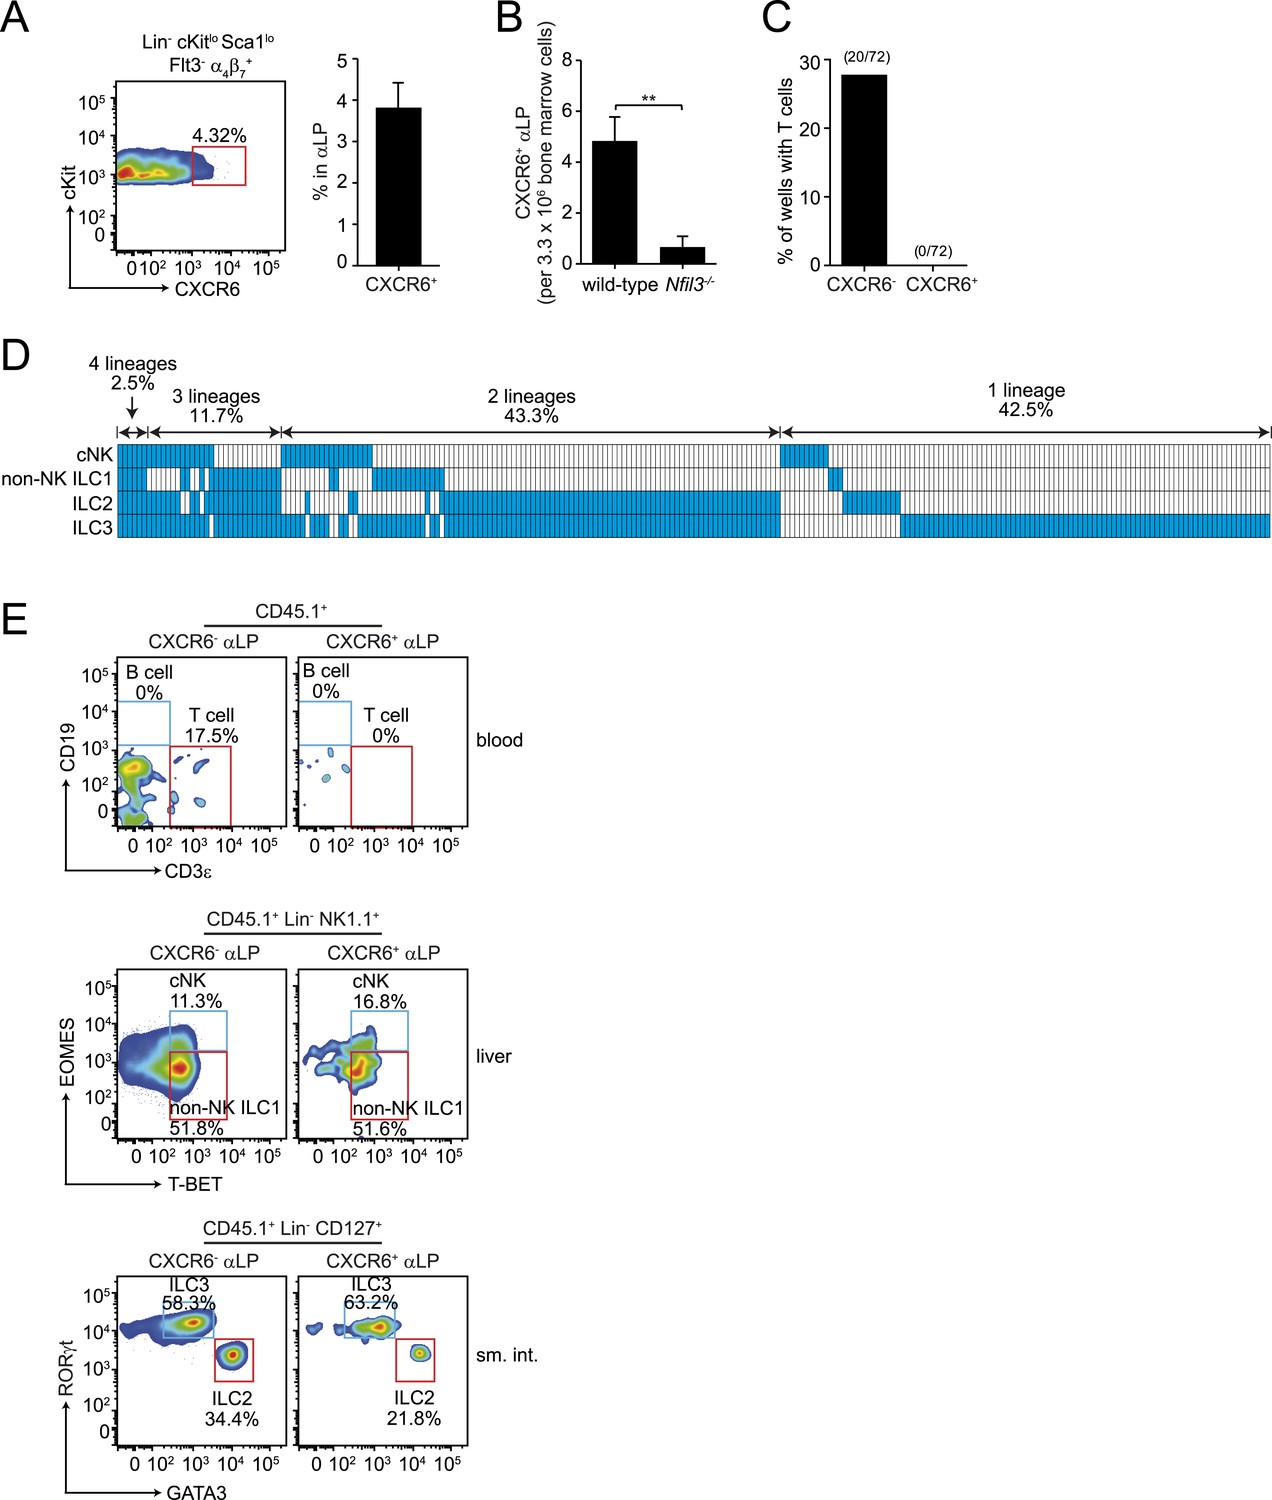
CXCR6+ αLP cells are ILC-committed precursors.
(A) αLP can be divided into two subpopulations based on CXCR6 expression. (B) Enumeration of CXCR6+ cells in Nfil3−/− mice. Bone marrow progenitor cells were enriched by negative selection with Lin− cell counts ranging from 8–12.5 × 10⁶ per mouse. Lin− cells were then stained and analyzed by flow cytometry. The numbers of CXCR6+ αLP cells in 3.3 × 10⁶ Lin− cells are plotted. (C) CXCR6+ αLP cells lack T cell differentiation potential. CXCR6- and CXCR6+ αLP cells were individually sorted into the wells of a 96-well plate with an irradiated OP9-DL1 feeder cell monolayer. Cells were cultured in the presence of 20 ng/ml SCF and 20 ng/ml IL-7 for 3 weeks. T cells were detected by CD3ε staining. Data are shown as the percentages of CD45+ cell-containing wells in which T cells were detected. (D) CXCR6+ αLP cells are multipotent precursors to cNK cells, non-NK ILC1, ILC2 and ILC3 in vitro. Individual CXCR6+ αLP cells were sorted and cultured as above (240 cells in total, pooled from two independent experiments). ILCs were analyzed by flow cytometry. cNK cells were detected as CD45+ CD3ε− CD19- RORγt− GATA3- NK1.1+ T-BET+ EOMES+; non-NK ILC1 as CD45+ CD3ε− CD19- RORγt− GATA3- NK1.1+ T-BET+ EOMES−, ILC2 as CD45+ CD3ε− CD19- GATA3+; and ILC3 as CD45+ CD3ε− CD19- RORγt+. Each well is presented as a column, with detected ILC lineages highlighted in blue. (E) CXCR6+ αLP cells differentiate into cNK cells, non-NK ILC1, ILC2 and ILC3 in vivo. ∼1000 CXCR6+ αLP cells were purified from 20 CD45.1+ mice by FACS sorting and were transplanted into sublethally irradiated Rag2−/−;Il2rg−/− (CD45.2+) mice. T cells and B cells in the blood and ILCs in the small intestine and liver were examined 4–6 weeks later. Data shown are representative of two independent experiments. Statistical analysis was performed with two-tailed student's t-test. Means ± SEM are shown. **, p < 0.01.
Figure 4—figure supplement 1
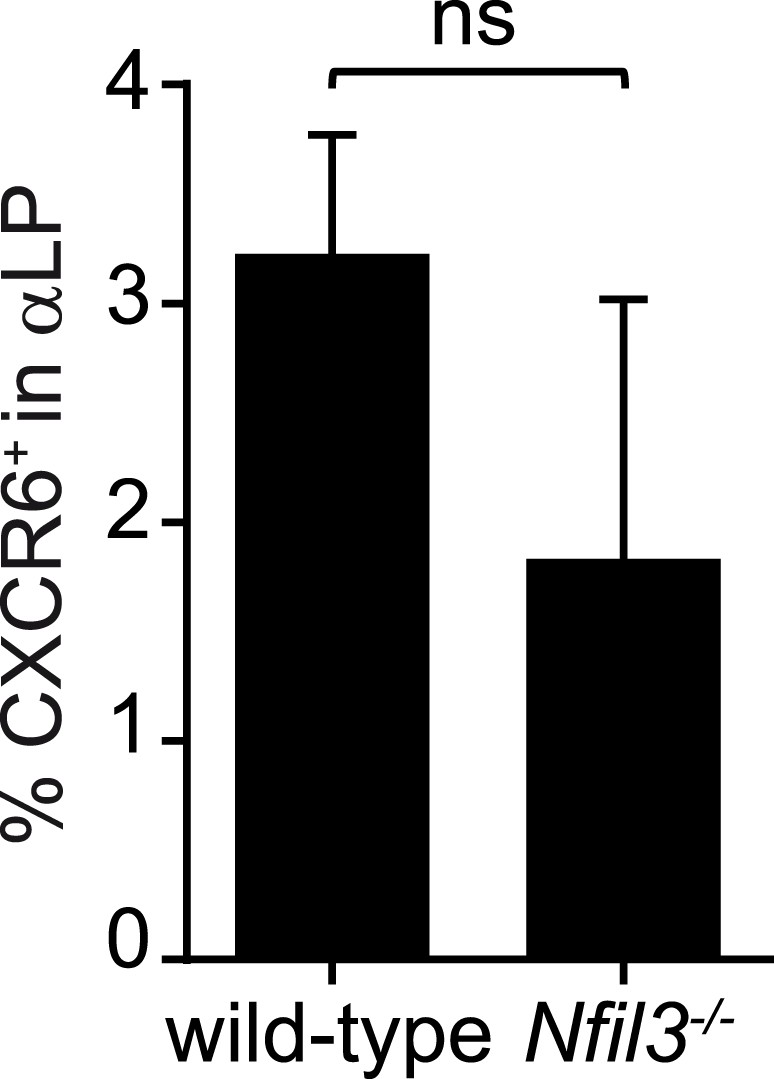
Frequencies of CXCR6+ cells in wild-type and Nfil3−/− αLP cell populations.
Bone marrow progenitors from wild-type and Nfil3−/− mice were enriched by negative selection and stained to detect CXCR6+ αLP cells. The frequencies of CXCR6+ cells among αLP cells are plotted. Statistical analysis was performed by two-tailed student's t-test. Means ± SEM are shown. ns, not significant.
Figure 5 with 2 supplements

NFIL3-dependent ILC development is mediated by Tox.
(A and B) Tox expression is lower in Nfil3−/− CLPs than in wild-type cells. (A) Heatmap comparing expression levels of transcription factors in wild-type and Nfil3−/− CLPs (left). Factors included Nfil3, Tox and other transcription factors that are known to be involved in ILC development. The absolute signal values and detection p values for each transcription factor in Illumina BeadArrays are also shown (right). Note that only Nfil3 and Tox expression can be reliably detected in wild-type CLP cells. (B) Q-PCR analysis of Tox expression in wild-type and Nfil3−/− CLPs. (C–E) NFIL3 activates Tox expression by binding directly to the Tox promoter. (C) Tox expression was determined by Q-PCR following shRNA knockdown of NFIL3 (left), and NFIL3 overexpression (right) in EL4 cells. (D) ChIP analysis of EL4 cells using an NFIL3-specific antibody or IgG control. Tox promoter (nt −2105 to −1867) enrichment was calculated as the ratio of the NFIL3-specific antibody pull-down to the IgG control pull-down. The left panel shows results with endogenous NFIL3 levels and the right panel shows results with NFIL3 overexpression. (E) Luciferase reporter assay. A 2.8 kb fragment of the Tox promoter was cloned and fused with the firefly luciferase gene to generate a Tox-luciferase reporter. HEK293T cells were co-transfected with the reporter and an empty vector or an NFIL3-encoding vector. Luciferase activity was normalized to cells transfected with vector-only controls. (F) Restoring Tox expression in Nfil3−/− progenitors rescues ILC development in vivo. Nfil3−/− LSK cells (CD45.2+) were retrovirally transduced with either an empty vector (MSCV-IRES-hCD2), a TOX-encoding vector (MSCV-Tox-IRES-hCD2), or an NFIL3-encoding vector (MSCV-Nfil3-IRES-hCD2) and then transferred into lethally irradiated wild-type (CD45.1+) mice. ILCs were examined 5–6 weeks later. The frequencies of total ILC2 and ILC3 within CD45.2+ hCD2+ cells are shown. Statistical comparisons between groups were performed with two-tailed student's t-test (B–E), nonparametric one-way ANOVA test with posttests (F). Means ± SEM are shown. ns, not significant; *, p < 0.05; **, p < 0.01; ***, p < 0.001; ****, p < 0.0001.
Figure 5—figure supplement 1

Knockdown of Nfil3 by shRNA.
(A) shRNA constructs were screened for Nfil3 knockdown. HEK293T cells were co-transfected with an Nfil3-coding plasmid (CDS only) and shRNA constructs. NFIL3 protein levels were examined by Western blotting 36 hr later. A scrambled shRNA was used as a negative control and ACTIN was used as a loading control during Western blotting. (B) Nfil3 was knocked down by shRNAs, sh39 and sh40, in EL4 cells. HEK293T cells were co-transfected with shRNA constructs, pVSVG and pCMVDR9. Cell culture supernatants were harvested 48 hr later and lentiviral particles were concentrated by ultracentrifugation. EL4 cells were transduced with shRNA-encoding lentivirus by spinoculation in the presence of 4 μg/ml polybrene. Cells stably expressing shRNAs were selected with 8 μg/ml puromycin and live cells (propidium iodide-negative) were purified by FACS. Nfil3 mRNA levels were examined by Q-PCR with Gapdh as an internal control. Statistical analysis was performed with one-way ANOVA with post-tests. Means ± SEM are shown. ****, p < 0.0001.
Figure 5—figure supplement 2

Experimental design and gating strategy for the Tox rescue experiment.
(A) Schematic illustrating the experimental design. Nfil3−/− LSK (CD45.2+) cells were retrovirally transduced with empty (MSCV-IRES-hCD2), TOX-encoding (MSCV-Tox-IRES-hCD2) or NFIL3-encoding (MSCV-Nfil3-IRES-hCD2) vectors. Cells were then transplanted into lethally irradiated wild-type mice (CD45.1+) and ILCs were examined 4–6 weeks later. (B) Gating strategy for examining ILCs in the recipient mice. Live cells were first electronically gated as ZombieGreen-negative and cells transduced by retrovirus were identified as CD45.2+ hCD2+. ILC2, ILC3, cNK and non-NK ILC1 were gated as Lineage (CD3, CD19, CD5, TCRβ, TCRγδ)− CD127+ GATA3+, Lin− CD127+ RORγt+, Lin− NK1.1+ T-BET+ EOMES+ and Lin− NK1.1+ T-BET+ EOMES−, respectively. The results of the experiment are summarized in Figure 5F.
Figure 6
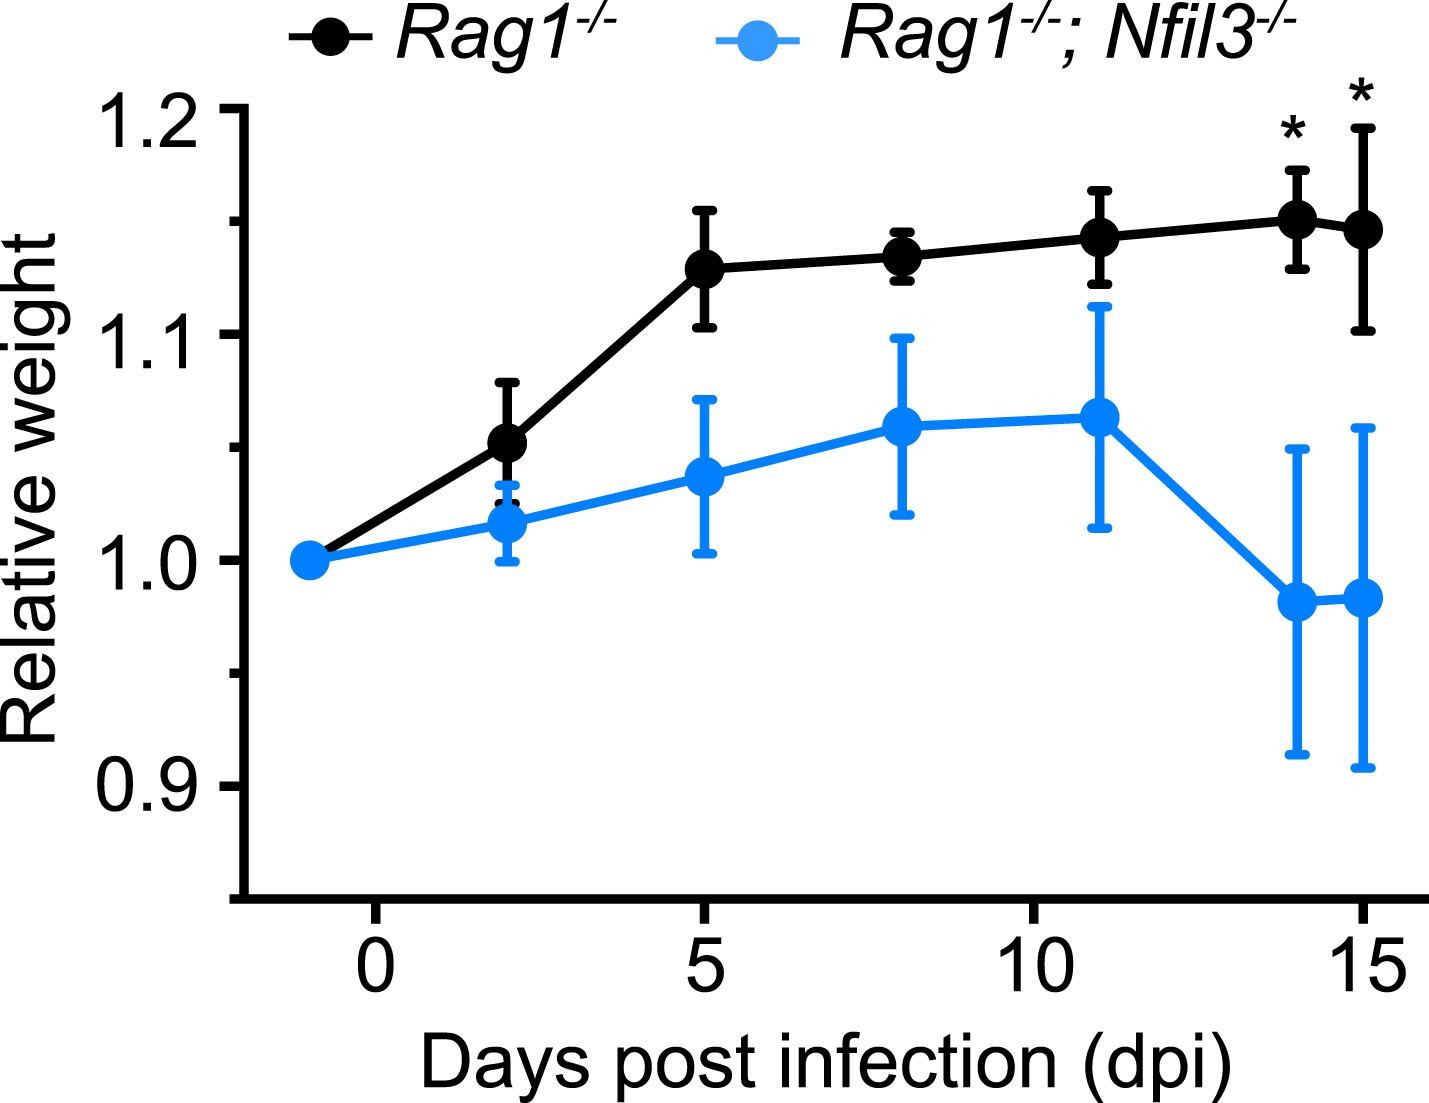
Nfil3 deficiency results in increased susceptibility to C. rodentium infection in mice.
Nfil3−/− mice were crossed with Rag1−/− mice to generate Nfil3−/−;Rag1−/− mice to eliminate the effects of adaptive immune cells, especially TH17 cells. Rag1−/− and Nfil3−/−;Rag1−/− mice were orally challenged with 5 × 10⁹ CFU of C. rodentium and mouse weight loss was monitored. 4 Rag1−/− mice and 5 Nfil3−/−;Rag1−/− mice were analyzed. Comparisons were carried out with or two-way ANOVA with posttests. Means ± SEM are shown. *, p < 0.05.
Download links
A two-part list of links to download the article, or parts of the article, in various formats.
Downloads (link to download the article as PDF)
Open citations (links to open the citations from this article in various online reference manager services)
Cite this article (links to download the citations from this article in formats compatible with various reference manager tools)
The basic leucine zipper transcription factor NFIL3 directs the development of a common innate lymphoid cell precursor
eLife 3:e04406.
https://doi.org/10.7554/eLife.04406


