Regulation of RNA granule dynamics by phosphorylation of serine-rich, intrinsically disordered proteins in C. elegans
- Howard Hughes Medical Institute, Johns Hopkins University School of Medicine, United States
- Academica Sinica, Taiwan
- Janelia Farm Research Campus, Howard Hughes Medical Institute, United States
Figures
Figure 1 with 1 supplement
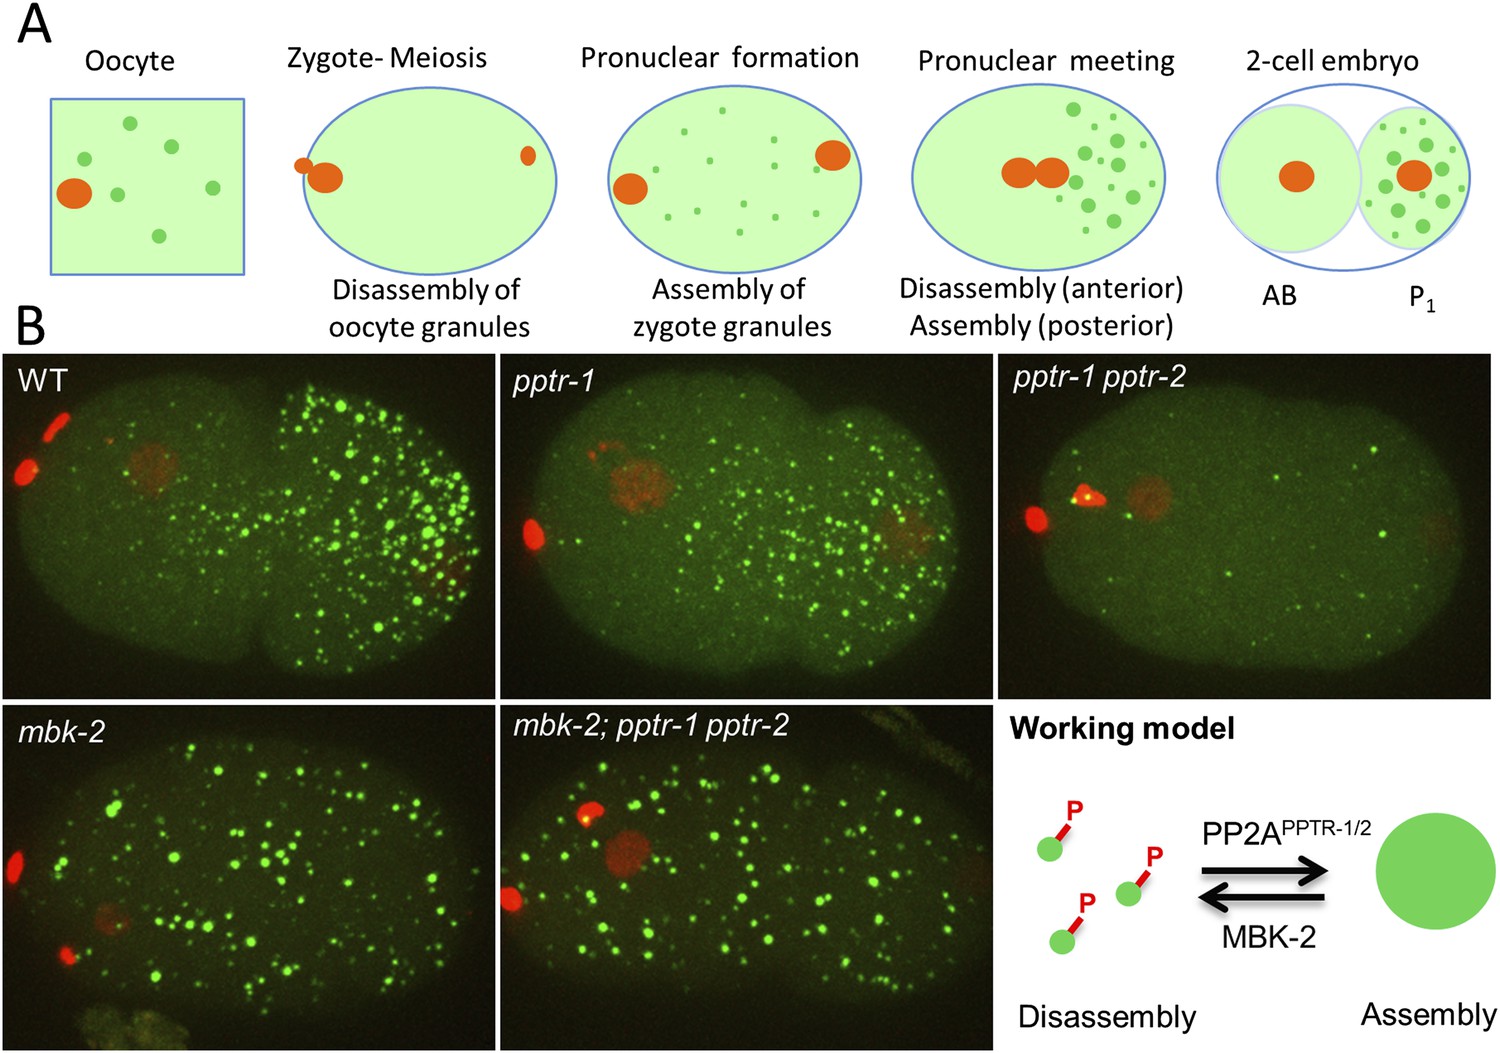
MBK-2 and PP2APPTR−1/2 are an opposing kinase/phosphatase pair.
(A) P granule dynamics during the oocyte to embryo transition. Green puncta are P granules, pale green color represents P granule components that diffuse into the cytoplasm. Orange represents pronuclei. P1 is the germline blastomere. (B) Zygotes of the indicated genotypes expressing GFP::PGL-1 and mCherry::Histone 2B during pronuclear migration. Full genotypes are pptr-1(tm3103), pptr-1(tm3103) pptr-2(RNAi), mbk-2(RNAi), and mbk-2(RNAi);pptr-1(tm3103) pptr-2(RNAi). Right: working model. Phosphorylation by MBK-2 disassembles granules. Dephosphorylation by PP2APPTR−1/2 assembles granules. Each embryo is 50 μm in length. Anterior is to the left, posterior is to the right.
Figure 1—figure supplement 1

Oocyte P granule disassembly during the oocyte-to-zygote transition.
First four columns: time points from movies of eggs (highlighted by dashed lines) undergoing the oocyte-to-embryo transition (top to bottom) and expressing GFP::PGL-1 (green) and mCherry::H2B (red). At time point zero, the oocytes are still in oviduct and not yet fertilized. At 24 min, fertilization has occurred and the zygotes are undergoing the first meiotic division. The oocyte granules have disassembled, except in meg-3 meg-4 zygotes. At 31 min, the zygotes are finishing the second meiotic division, and the zygote granules are forming. Zygote granule assembly is impaired in pptr-1 pptr-2 and meg-3 meg-4 zygotes. Full genotypes are: pptr-1(tm3103) pptr-2(RNAi), mbk-2(RNAi), and meg-3(RNAi) meg-4(RNAi). Fifth column: time points from movies of eggs expressing mCherry::PGL-3. Note that the top image was taken at 4:00. All other images are time-matched to those taken in GFP::PGL-1 mCherry::H2B strains.
Figure 2
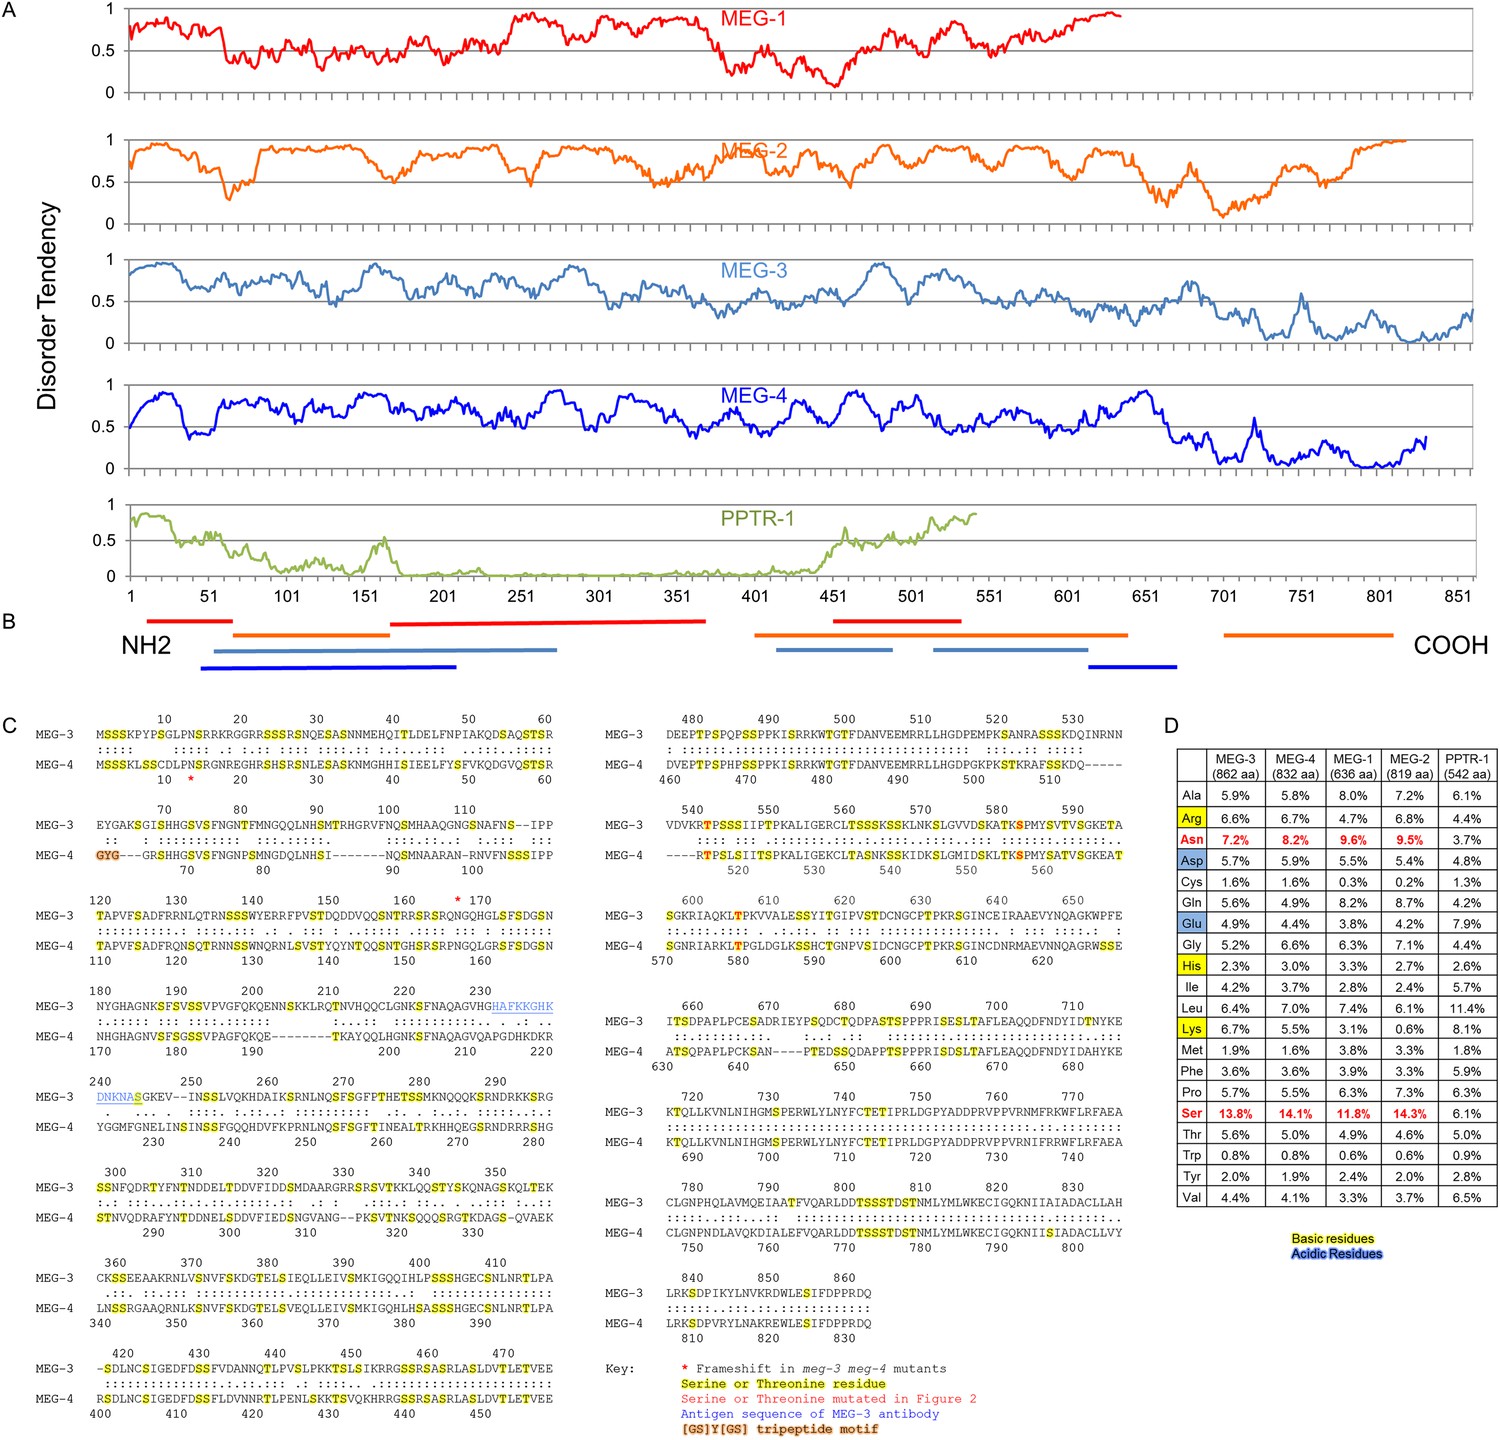
The MEG proteins contain sequences predicted to be intrinsically disordered.
(A) Graphs showing the disorder tendency of sequences along each protein calculated using IUPRED (http://iupred.enzim.hu/) using ‘long disorder’ parameters (Dosztányi et al., 2005). Scores above 0.5 indicate disorder. Number of predicted disordered residues: MEG-1: 420 of 636 aa (66%), MEG-2: 715 of 819 aa (87%), MEG-3: 542 of 862 aa (63%), MEG-4: 570 of 832 aa (69%), PPTR-1: 97 of 542 aa (18%). PPTR-1 is included here as an example of a mostly ordered protein. (B) Lines below graph: regions of low complexity sequence as defined using SEG (http://mendel.imp.ac.at/METHODS/seg.server.html) (Wootton, 1994). Using the default SEG parameters (SEG 12 2.2 2.5) as used in Kato et al. (2012), there are no low complexity sequences greater than 36 residues in the MEG proteins. Using a larger window size (SEG 45 3.4 3.75), all MEGs have predicted low complexity regions as shown, but PPTR-1 does not. (C) Protein sequence alignment of MEG-3 and MEG-4, which are 71% identical to each other. Yellow highlight: serine and threonine residues. Red: predicted MBK-2 phosphorylation site mutated in Figure 3 kinase assay. Blue: antigen sequence of MEG-3 antibody. Orange highlight: [GS]Y[GS] tripeptide motif (Kato et al., 2012). There is only 1 instance of this sequence in MEG-4 and none in MEG-3. Red star: position of the frameshift in the meg-3(tm4259) and meg-4(ax2026) mutants. meg-3(tm4259) is a deletion of 623 nucleotides starting at nucleotide 543 (amino acid 165), followed by an insertion of ‘TACGA’. The frameshift inserts the sequence ‘KQGRH’ at amino acid 165 followed by a premature stop. meg-4(ax2026) is a deletion of 7 nucleotides starting at nucleotide 37 (amino acid 13). The frameshift inserts the amino acids ‘EETEKVTALIVEAIWKVHRKIWDTTLVLKNCFIRS’ at amino acid 13, followed by a premature stop. See Table 2 for full allele descriptions. (D) Amino acid composition of indicated proteins. Basic residues are highlighted in yellow, acidic in blue. Red residues are overrepresented in MEG proteins.
-
Figure 2—source data 1
Candidates from yeast two-hybrid screen.
DNA was extracted and sequenced from 111 colonies grown on –Trp–Leu–Ura–His plates. RNAi feeding vectors for each candidate were obtained from the Ahringer or OpenBiosystems RNAi banks, or if unavailable were PCR amplified from genomic DNA and cloned into pL4440. *meg-3(RNAi) also knocks out meg-4 and vice-versa. + in the pptr-1 suppression column means that the RNAi treatment restores P granules in P blastomeres. Pleiotropic indicates a P granule phenotype accompanied by additional cellular defects. Entries in red are the MEG proteins, which uniquely affect P granules in the zygote stage (meg-3 and meg-4) or suppress the pptr-1 phenotype (meg-1) without inducing other phenotypes. Other phenotypes were as follows: emb = embryonic lethal, dpy = dumpy, egl = egg laying defect.
- https://doi.org/10.7554/eLife.04591.008
Figure 3 with 1 supplement
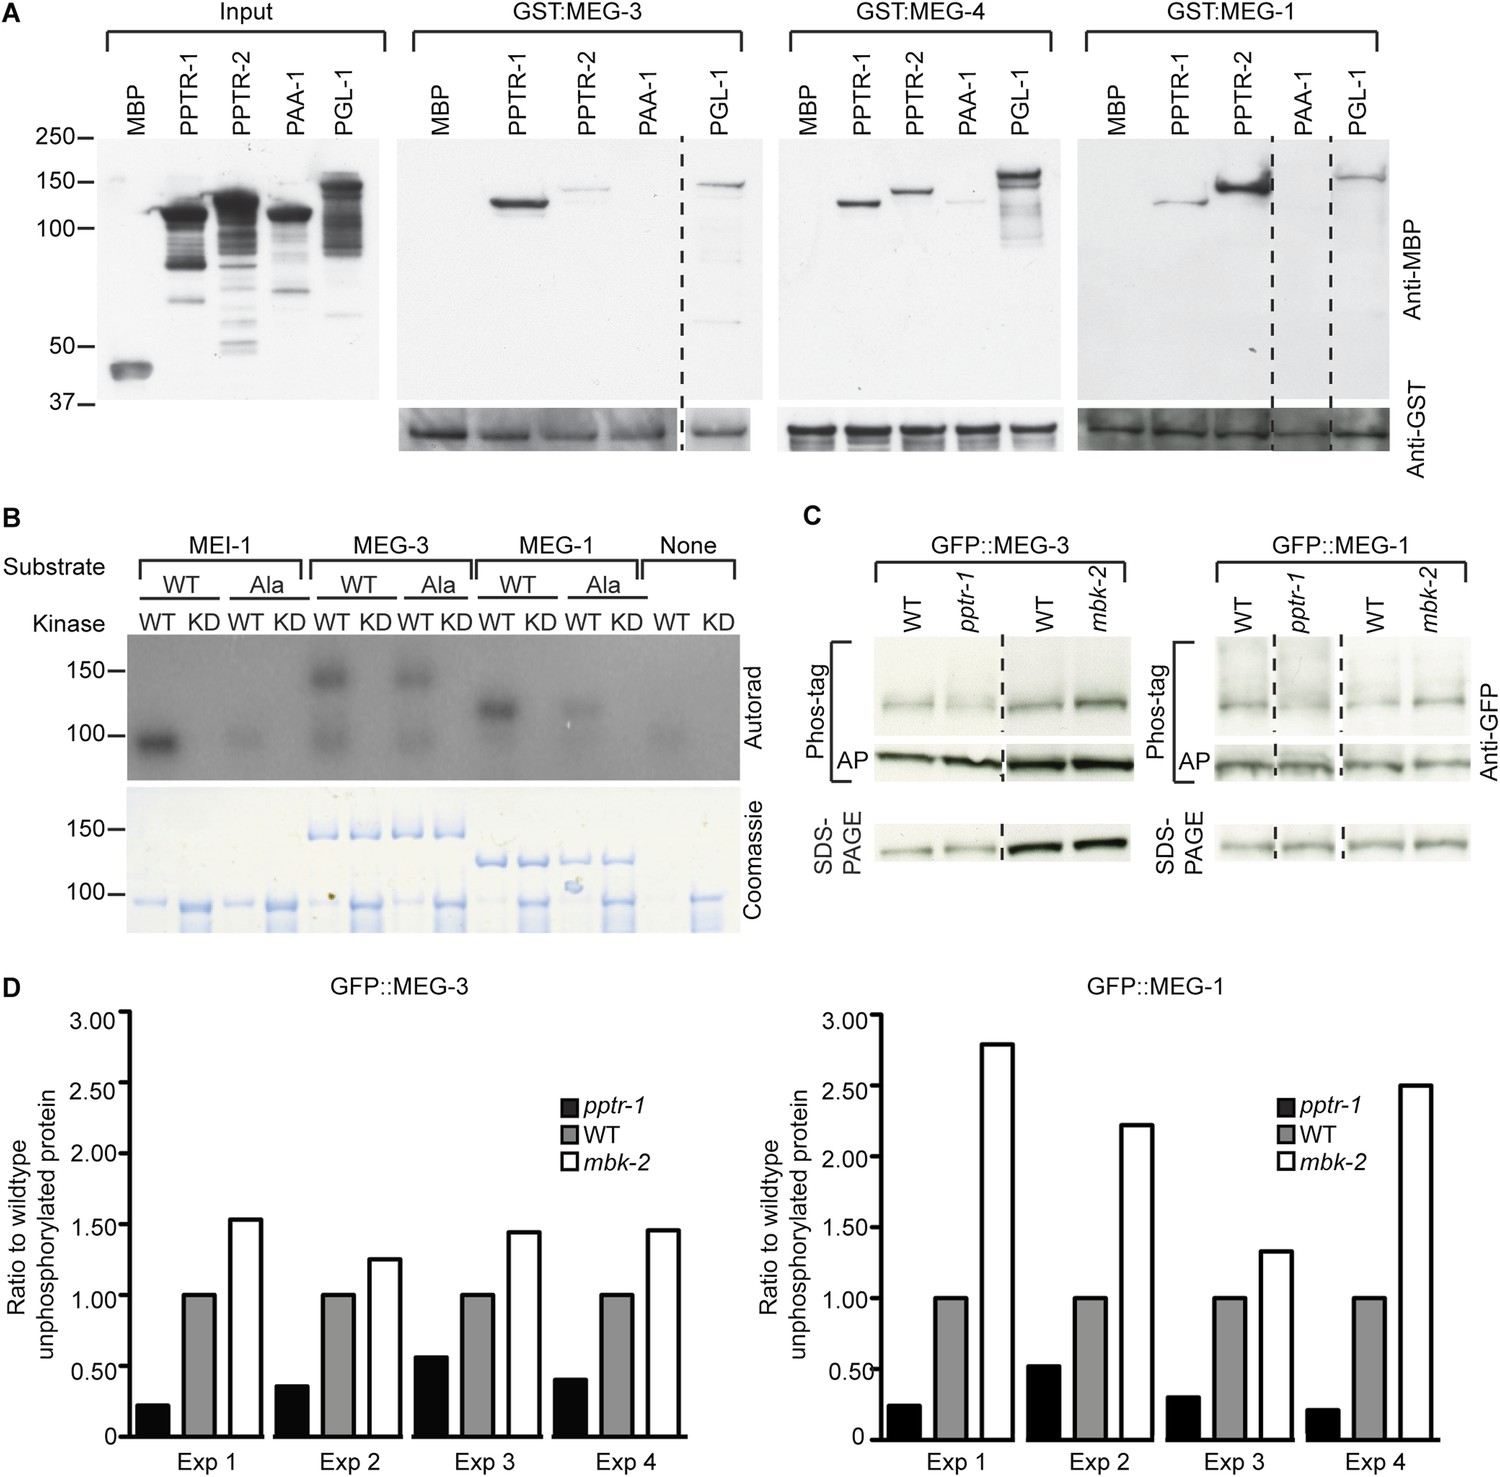
MEG-1 and MEG-3 are substrates of MBK-2 and PP2APPTR−1/2.
(A) Westerns of E. coli lysates expressing the indicated MBP fusions before (input) and after immobilization on columns containing the indicated GST fusions. MBP and PAA-1 are negative controls. PAA-1 is the scaffolding subunit of PP2A. Dashed lines separate individual gels. (B) In vitro kinase assay. MBP fused to wild-type or kinase-dead (KD) MBK-2 was incubated with gamma32P-ATP and MBP-fused substrates: MEI-1 (94 kDa); MEI-1(S92A) (94 kDa); MEG-3 (138 kDa with degradation band at ∼100 kDa); MEG-3(T541A S582A T605A) (138 kDa with degradation band at ∼100 kDa); MEG-1 (112 kDa); MEG-1(S574A) (112 kDa). MBP::MBK-2 is 99 kDa and autophosphorylates. MEI-1 is a previously known substrate of MBK-2 (Stitzel et al., 2006). Coomassie staining to control for loading is shown below. Phosphorylation is diminished in MEG-3(T541A S582A T605A) (64% of wild-type phosphorylation) and MEG-1 (S574A) (88% of wild-type phosphorylation). (C) Anti-GFP westerns of C. elegans embryonic lysates run on SDS-PAGE gels with (top) or without Phos-tag (bottom). Wild-type, pptr-1(tm3103), and mbk-2(RNAi) embryonic lysates expressing GFP::MEG-3 or wild-type, pptr-1(RNAi), and mbk-2(RNAi) embryonic lysates expressing GFP::MEG-1 were treated with or without alkaline phosphatase (AP) and equal amounts were loaded on gels with or without Phos-tag. Dashed lines separate individual gels. Loading control was protein run on SDS-PAGE without Phos-tag. (D) Graphs showing % unphosphorylated protein relative to wild-type in four Phos-tag experimental replicates. % unphosphorylated was calculated as the ratio of the intensity of the band corresponding to unphosphorylated protein on a Phos-tag gel over the intensity of the band on a non-Phos-tag gel (total protein) and normalized to wild-type.
Figure 3—figure supplement 1

MEG-1 and MEG-3 are phosphorylated in vivo.
Anti-GFP western of embryonic lysates expressing GFP::MEG-1 or GFP::MEG-3 treated with increasing amounts of alkaline phosphatase and run on Phos-tag SDS-PAGE (top) and SDS-PAGE without Phos-tag (bottom). Equivalent amounts of total cell lysates were loaded in each lane. Top arrow indicates position of phosphorylated band, bottom arrow indicates position of unphosphorylated band. Asterisk indicates alkaline phosphatase, which is detected to varying extents using these Western blotting conditions.
Figure 4 with 5 supplements
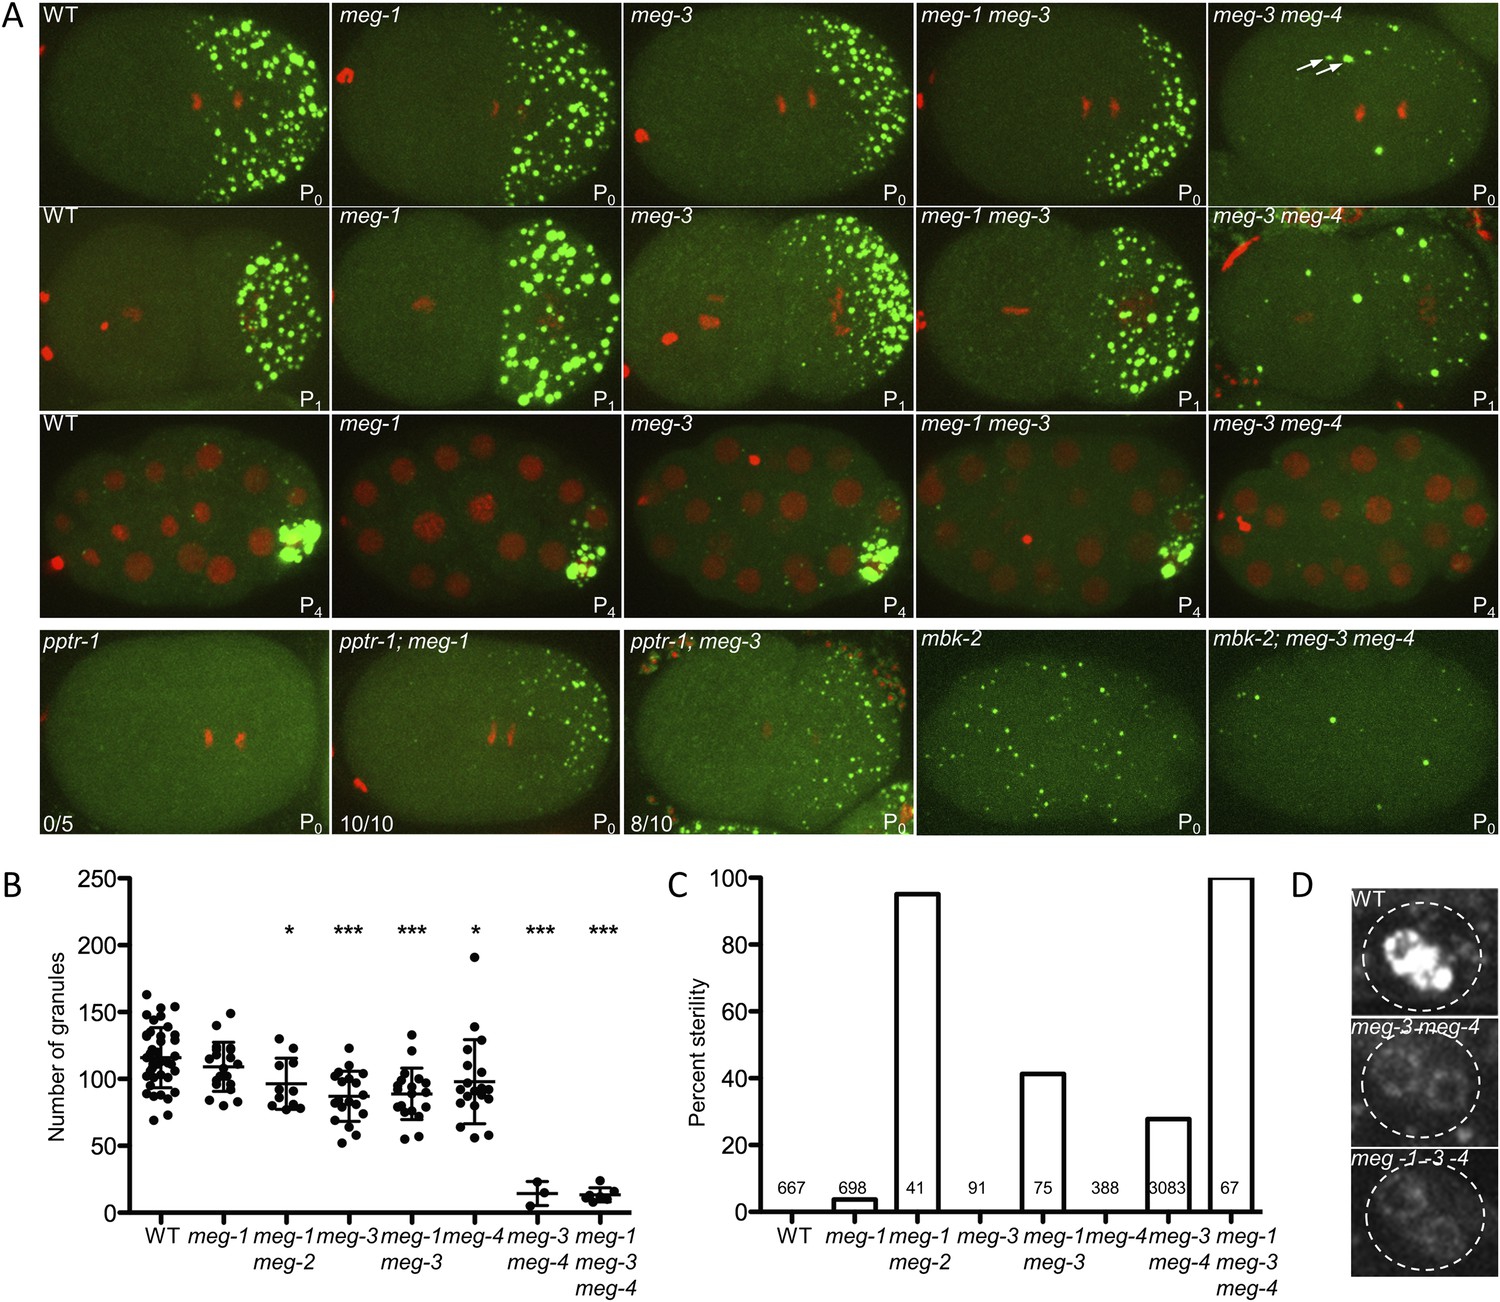
meg-1, meg-3, and meg-4 regulate P granule dynamics.
(A) Live embryos of the indicated genotypes and stages expressing GFP::PGL-1 (green) and mCherry::H2B (red) or GFP::PGL-1 only (last two). Arrows in meg-3 meg-4 point to oocyte granules. For pptr-1 zygotes, the number of zygotes with visible posterior P granules is indicated. P0 is 1-cell stage, P1 is 2-cell stage, P4 is 28-cell stage. (B) Number of GFP::PGL-1 granules in zygotes in anaphase of the first mitosis. Each dot represents a different zygote, and mean and standard deviation are shown. Asterisks indicate data that are statistically significantly different from wild-type (one asterisk: p < 0.005, three asterisks: p < 0.0001). (C) Percent sterility of adult hermaphrodites of the indicated genotypes grown at 20°C. Number of hermaphrodites scored (n) is written above the x axis. (D) Primordial germ cells in the L1 larval stage expressing GFP::PGL-1. By this stage, PGCs express P granule components (Kawasaki et al., 2004). Perinuclear P granules form in all three genotypes. GFP::PGL-levels are lower in the meg mutants due to the lack of P granules inherited from the early embryonic stages. Full genotypes are meg-1(vr10), meg-1(vr10) meg-2(RNAi), meg-3(tm4259), meg-1(vr10) meg-3(tm4259), meg-4(ax2081), meg-3(tm4259) meg-4(ax2026), pptr-1(tm3103), pptr-1(tm3103);meg-1(vr10), pptr-1(tm3103);meg-3(tm4259), mbk-2(pk1427) and mbk-2(pk1427); meg-3(RNAi) meg-4(RNAi).
Figure 4—figure supplement 1
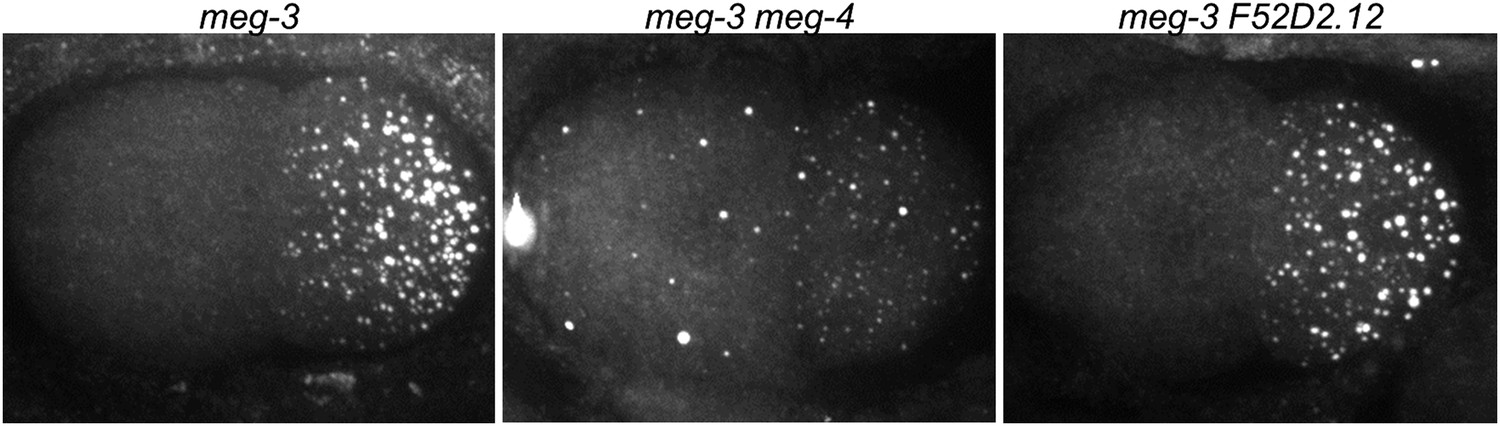
meg-3 and meg-4 are required redundantly for P granule assembly in zygote.
2-cell embryos stained for the P granule component GLH-2 (Gruidl et al., 1996). meg-3(tm4259) hermaphrodites were treated with meg-4 or F52D2.12 RNAi. The RNAi constructs were designed to target regions in meg-4 and F52D2.12 corresponding to the region deleted in meg-3(tm4259) to avoid any possible cross-silencing. Genotypes are meg-3(tm4259), meg-3(tm4259) meg-4(RNAi), and meg-3(tm4259) F52D2.12(RNAi). F52D2.12 is a more distantly related homolog of meg-3 and meg-4 (48% amino acid identity between meg-3 and F52D2.12, compared to 71% amino acid identity between meg-3 and meg-4). No phenotype was observed in meg-3(tm4259) F52D2.12(RNAi) nor in wild-type animals treated with meg-4(RNAi) or F52D2.12(RNAi).
Figure 4—figure supplement 2
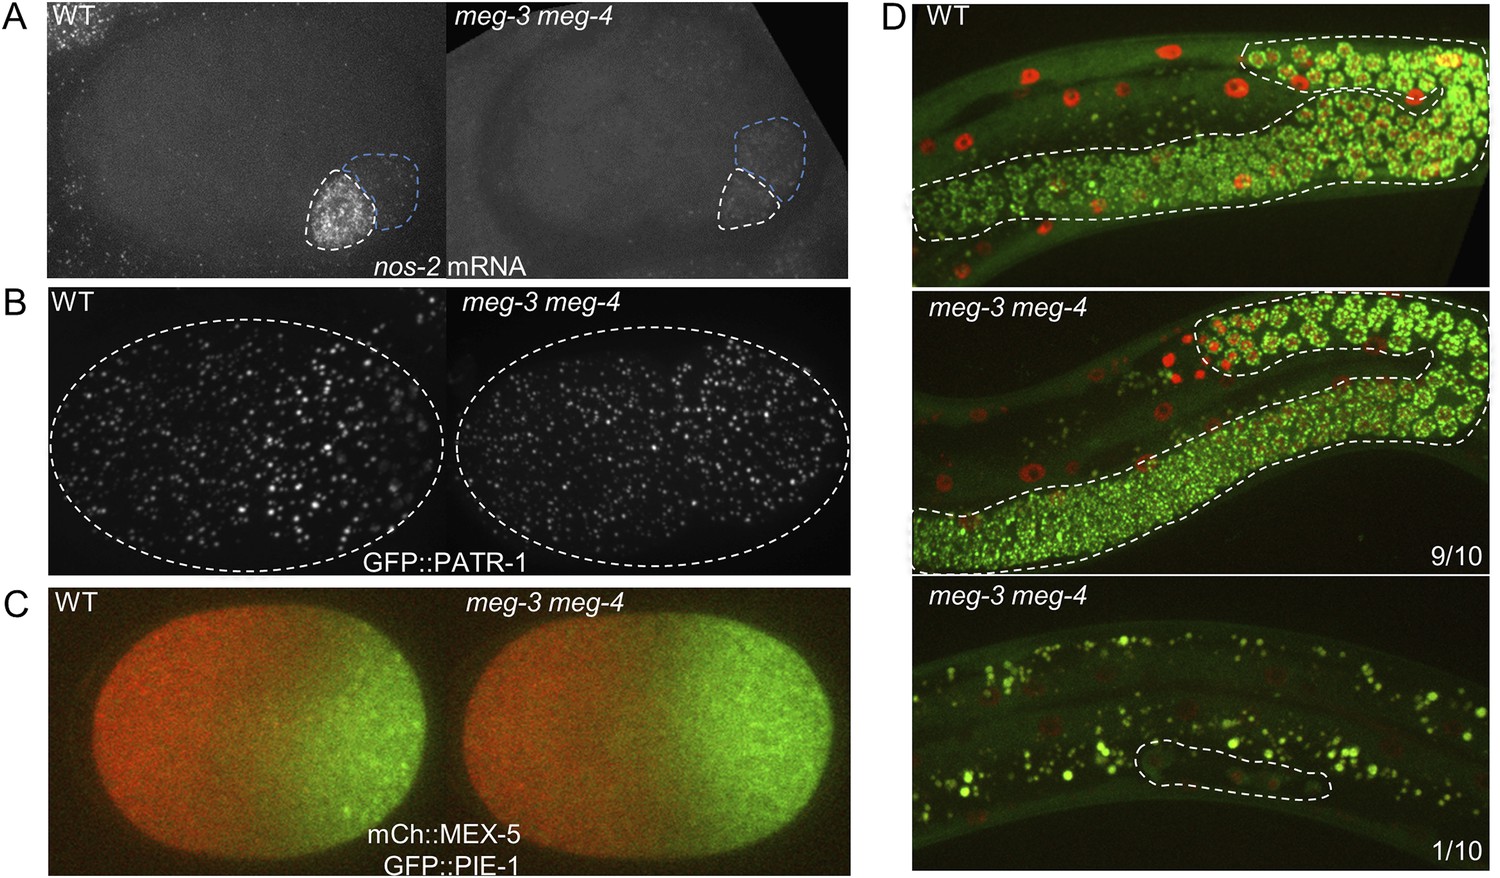
Comparison of wild-type and meg-3 meg-4 mutants.
(A) 28-cell stage embryos hybridized to a probe for nos-2 RNA. In wild-type embryos, nos-2 is enriched in the P blastomere (white outline). In meg3 meg-4, nos-2 RNA is segregated equally to the P blastomere (white outline) and its sister somatic blastomere (blue outline). Older somatic blastomeres have already turned over nos-2 RNA. (B) Live zygotes expressing GFP::PATR-1, a marker for P bodies. Assembly of P bodies is not affected in meg-3(RNAi) meg-4(RNAi) zygotes. (C) Live zygotes expressing GFP::PIE-1 and mCherry::MEX-5. Localizations are indistinguishable, except for the lack of PIE-1 on granules in meg-3(RNAi) meg-4(RNAi) zygotes. (D) L4 larvae expressing GFP::PGL-1 and mCherry::H2B. The germline is highlighted in white dashed lines. 9 of 10 meg-3 meg-4 L4 larvae developed a full germline, as in wild-type. The remaining one meg-3 meg-4 L4 larva only contained 4 germ cells.
Figure 4—figure supplement 3
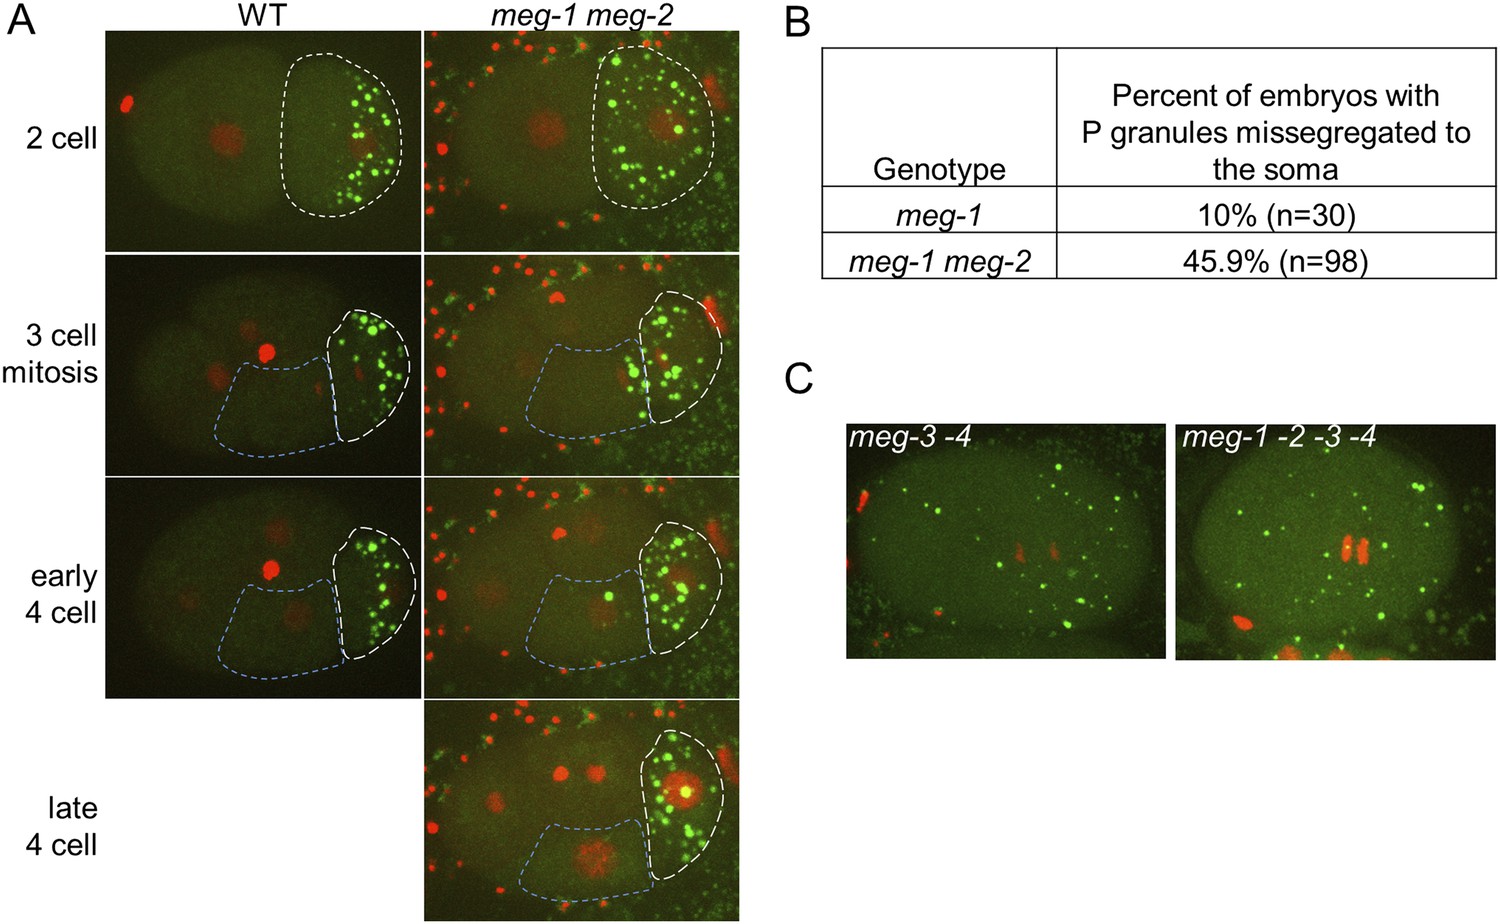
meg-1 meg-2 embryos exhibit defects in P granule disassembly in 2-cell and later embryos leading to missegregation of P granules to somatic blastomeres.
(A) Time points from movies of a wild-type and a meg-1(RNAi) meg-2(RNAi) embryo expressing GFP::PGL-1 and mCherry::H2B. The embryos are precisely aged-matched. White dashed lines outline the P blastomeres P1 (2-cell stage) and P2 (3-cell and later stages), blue dashed lines outline the somatic blastomere EMS. In wild-type, P granules are disassembled in the anterior cytoplasm of P1 and segregate only to P2. In meg-1 meg-2, P granule disassembly is defective in P1, resulting in some P granules segregating into EMS. These ectopic P granules are disassembled by the late 4-cell stage. (B) Table showing the number of 4-cell and later stage embryos with missegregated P granules in meg-1(vr10) and meg-1(vr10) meg-2(RNAi). (C) Live meg-3(tm4259) meg-4(ax2026) and meg-1(vr10) meg-2(RNAi) meg-3(tm4259) meg-4(RNAi) zygotes expressing GFP::PGL-1 and mCherry::H2B. Phenotypes are indistinguishable.
Figure 4—figure supplement 4
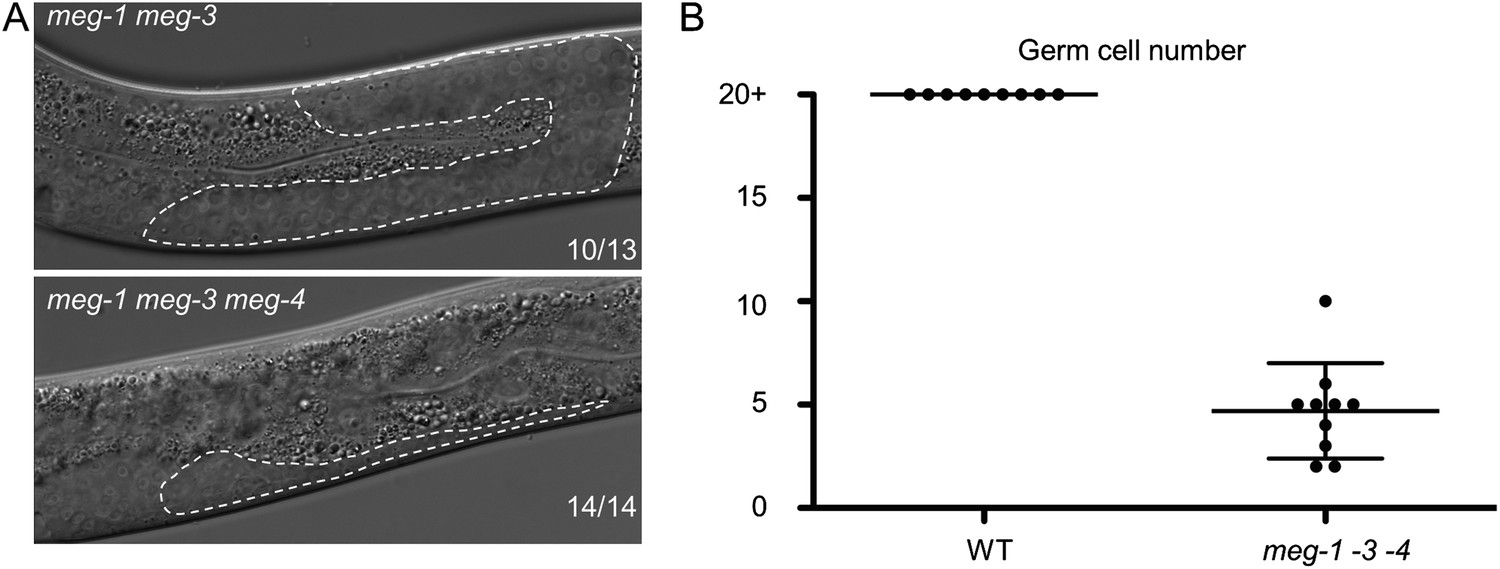
MEG proteins are required for germ cell development.
(A) Nomarski images of live L3 larvae. Worms were staged according to vulval development. Germline is outlined. 10 of 13 meg-1 meg-3 animals had wild-type germlines as shown, and 3 of 13 had underdeveloped germlines similar to meg-1 meg-3 meg-4. Full genotypes are: meg-3(tm4259) meg-4(ax2026) and meg-1(vr10) meg-3(tm4259) meg-4(RNAi). (B) Graph showing the total number of germ cells in wild-type and meg-1(vr10) meg-3(tm4259) meg-4(RNAi) L4 larvae. Each dot represents a single larva. Mean and standard deviation are shown.
Figure 4—figure supplement 5
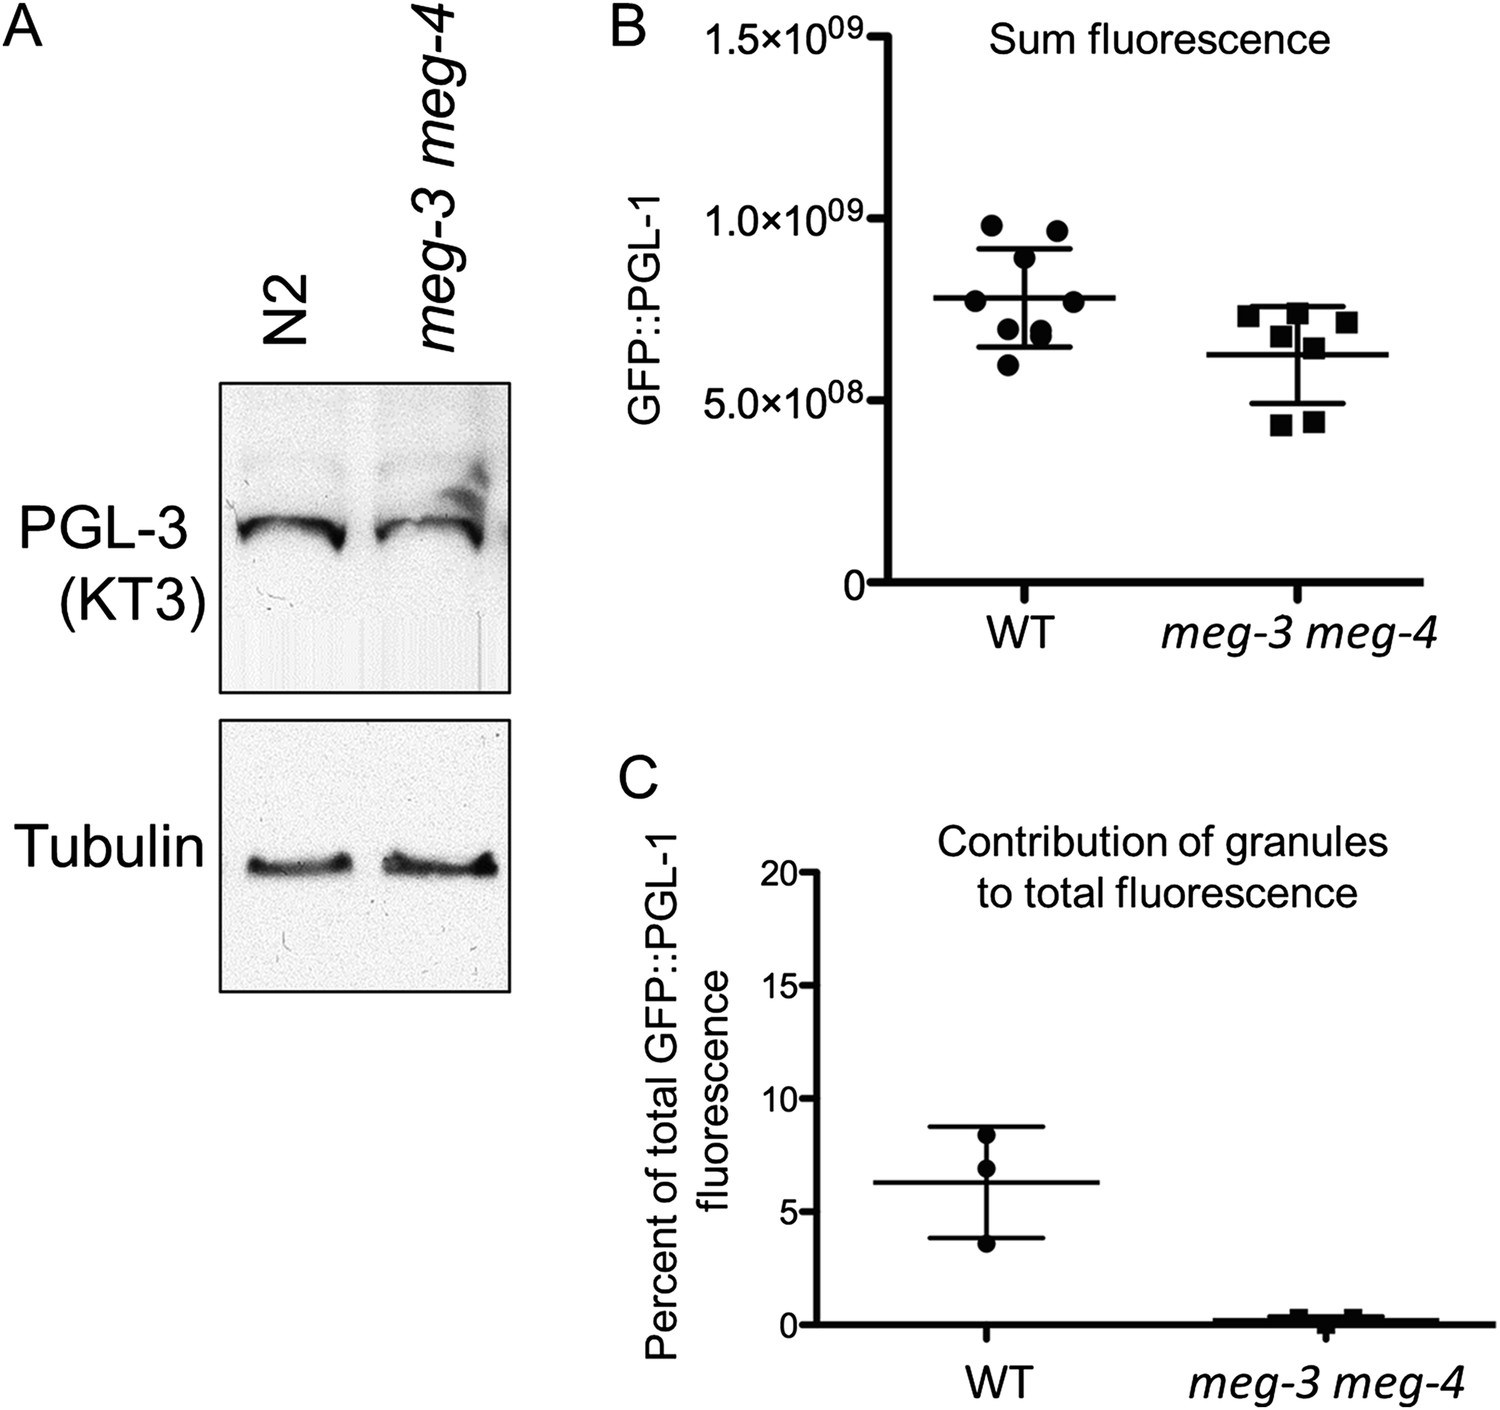
meg-3 meg-4 do not affect PGL-1 and PGL-3 levels significantly.
(A) Western blot for endogenous PGL-3 (detected using KT3 antibody) and tubulin in wild-type (N2) embryos and meg-3(tm4259)meg-4(RNAi) embryos. (B) Total GFP::PGL-1 fluorescence in wildtype and meg-3(tm4259) meg-4(ax2026) zygotes. Difference between wildtype and meg-3 meg-4 is not statistically significant (p = 0.3). Mean and standard deviation are shown. (C) Percent GFP::PGL-1 fluorescence present in granules in wild-type and meg-3(tm4259)meg-4(ax2026) zygotes at mitosis. Mean and standard deviation are shown.
Figure 5 with 5 supplements
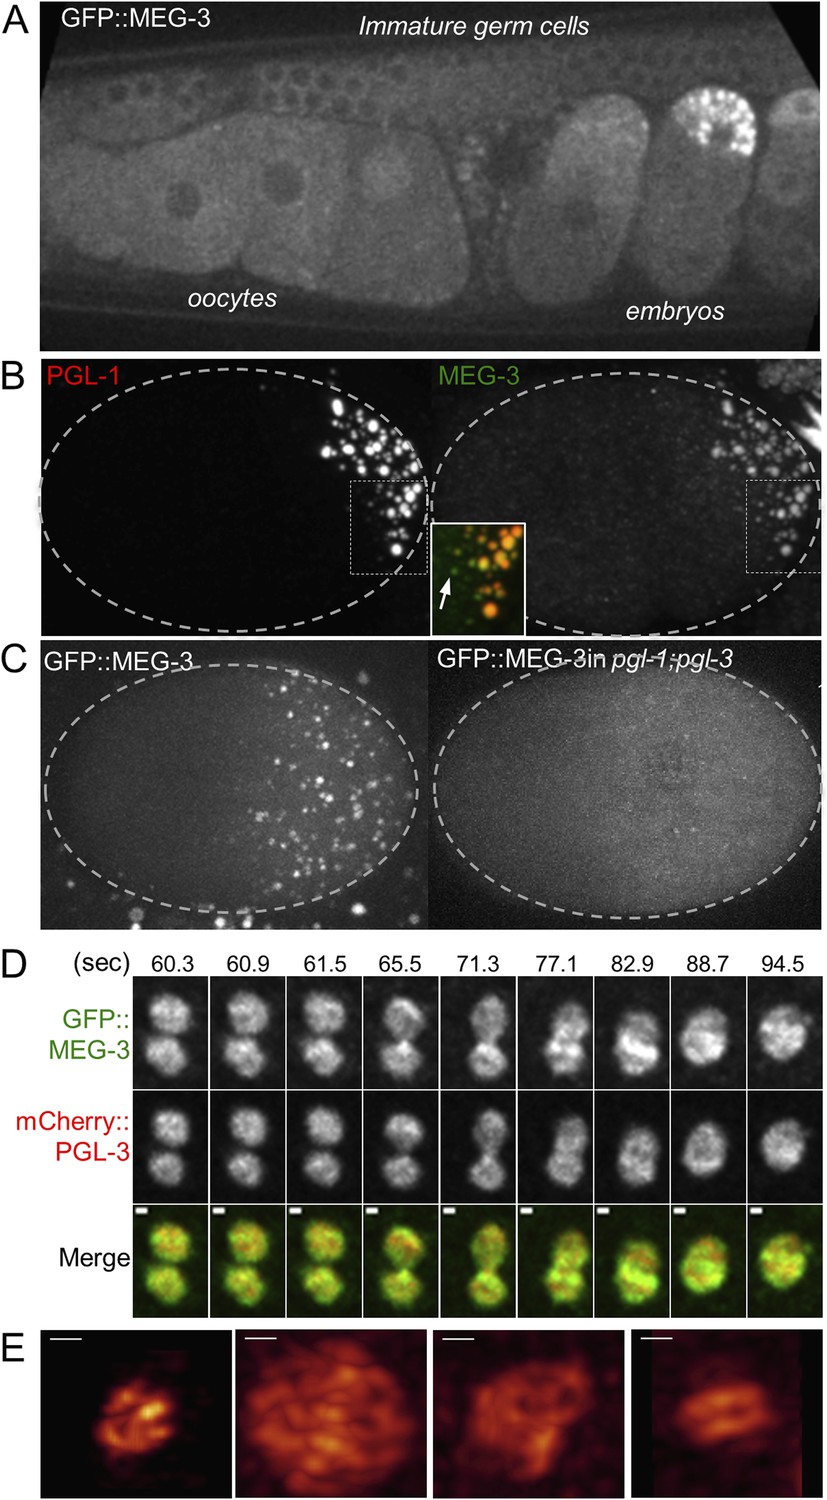
MEG-3 localizes to a dynamic domain that surrounds and penetrates the P granules.
(A) Gonad of an adult hermaphrodite expressing the GFP::MEG-3 transgene under the control of the meg-3 promoter and 3′ UTR. GFP::MEG-3 associates strongly with P granules only in embryos. (B) Fixed wild-type zygote stained with anti:MEG-3 and anti-PGL-1 sera. Inset: magnification of merged image. Arrow points to a MEG-3-positive/PGL-1-negative granule. (C) Live wild-type and pgl-1(RNAi);pgl-3(bn104) zygotes expressing GFP::MEG-3. GFP::MEG-3 localizes to a cytoplasmic gradient and P granules. P granule localization is lost in pgl-1(RNAi);pgl-3(bn104) zygotes, but the cytoplasmic gradient remains. (D) Still images from a movie acquired using lattice light sheet microscopy (Video 5). Max intensity projection of a Z stack through a pair of fusing granules. Time in seconds (Video 5) is indicated above each panel. GFP::MEG-3 and mCherry:PGL-3 domains are not completely co-localized. Also see Figure 5—figure supplement 3B. Resolution is 238 nm × 238 nm × 500 nm. Scale bars: upper left = 500 nm. (E) Lattice light sheet 3D-SIM mode reconstruction of GFP::MEG-3 in P granules in a living zygote (also see Video 6). Scale bars: upper left = 500 nm. First granule on the left: acquisition time is 1 s (Video 6). Subsequent granules: acquisition time is 1.7 s (Video 7).
Figure 5—figure supplement 1
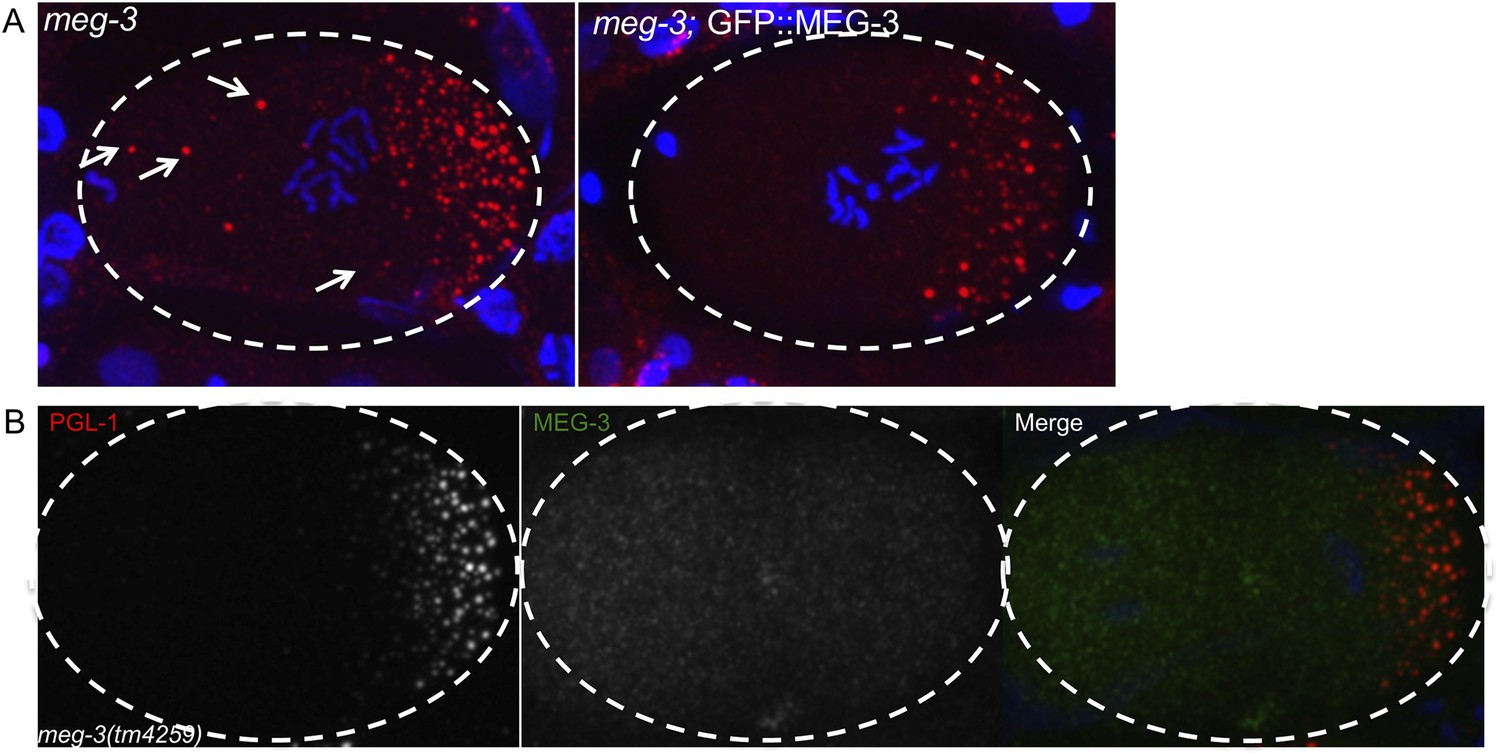
GFP::MEG-3 rescues meg-3 mutant and the MEG-3 antibody is specific.
(A) Fixed zygotes stained for P granules (K76 antibody, red). Note the oocyte granules (arrows) in meg-3(tm4259) which are absent in the rescued strain meg-3(tm4259);GFP::MEG-3. At least 20 mothers were stained for each genotype and these images are representative. We could not test whether GFP::MEG-3 also rescues the P granule assembly defect of meg-3(tm4259) mutants, since this defect can only be scored using GFP::PGL-1 (antibody staining of P granules is not reliable enough for accurate counts at this stage). (B) Fixed meg-3(tm4259) zygote stained for P granules (K76 antibody, red) and with anti-MEG-3 serum. Anti-MEG-3 serum does not stain granules in meg-3(tm4259) embryos, but does so in wild-type (Figure 5B), demonstrating specificity of the serum.
Figure 5—figure supplement 2
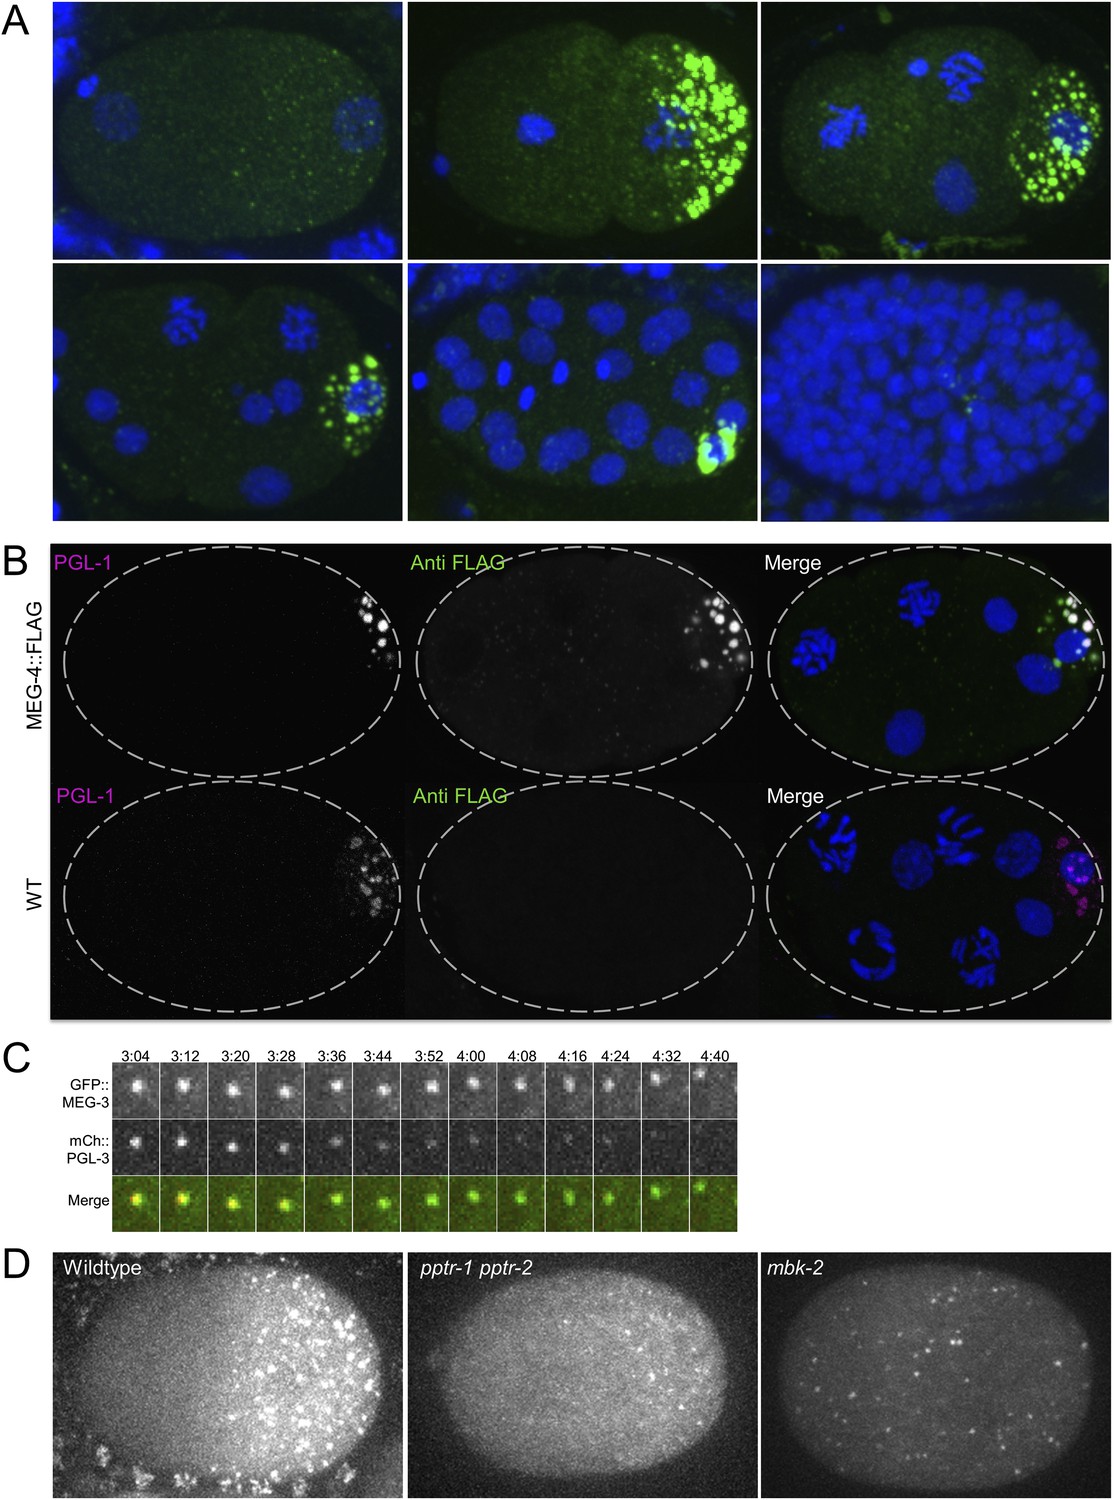
MEG-4 localizes to P granules and MEG-3 and MEG-4 assemblies persist longer in disassembling granules than PGL-1.
(A) Embryos expressing MEG-4::FLAG (endogenous locus) and stained with anti-FLAG antibody. (B) Top row: maximum projection image of embryo expressing MEG-4::FLAG (endogenous locus) and stained with anti-FLAG antibody and anti-PGL-1 (K76) antibody. Note the MEG-4:FLAG-positive/PGL-1 negative granules in the anterior part of the cell (where P granules disassemble). Bottom row: maximum projection of image of wild-type embryo (no MEG-4::FLAG) stained with anti-FLAG antibody and anti-PGL-1 (K76) antibody. Note the lack of FLAG staining confirming the specificity of the FLAG antibody. (C) Time-lapse of a disassembling P granule from an embryo expressing GFP::MEG-3 and mCherry::PGL-3 granule. During granule disassembly, GFP::MEG-3 persists for longer than mCherry::PGL-3. Also see Video 4. (D) Zygotes expressing GFP::MEG-3 imaged at mitosis. Genotypes are: pptr-1(RNAi) pptr-2(RNAi) and mbk-2(RNAi). Note the perduring GFP::MEG-3 clusters in the pptr-1pptr-2 zygotes which disassemble all PGL clusters by this stage (Figure 4A).
Figure 5—figure supplement 3
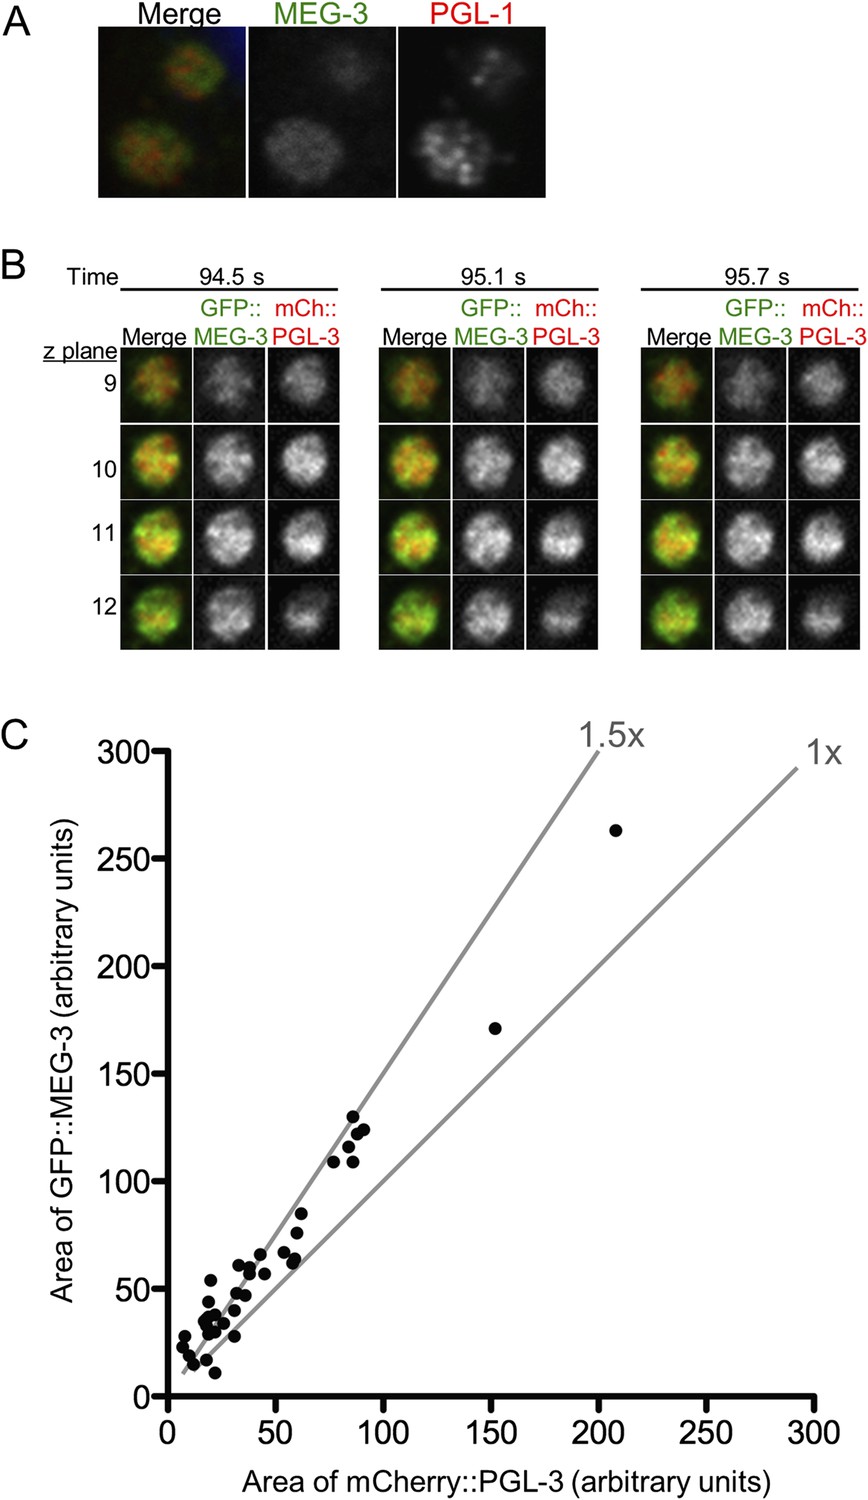
MEG-3 and PGL-1/3 overlap only partially in P granules.
(A) Confocal images of two P granules in a fixed zygote expressing GFP::MEG-3. Endogenous PGL-1 is visualized using the K76 antibody. In all fixed preparations, GFP::MEG-3 never co-localized perfectly with PGL-1, but the appearance of the PGL-1 signal varied between experimental replicates. (B) Single plane images of GFP::MEG-3 and mCherry::PGL-3 in fused granule is also shown in Figure 5D. Time points are indicated above in seconds. Four consecutive z planes are shown with 0.3 μm z steps. (C) Graph plotting area of mCherry::PGL-3 signal (x axis) vs area of GFP::MEG-3 signal (y axis) for 37 granules from two embryos visualized by lattice light sheet microscopy (dithered mode). Each dot represents an individual granule. Diagonal lines indicate 1× and 1.5× fold increase of GFP::MEG-3 area over mCherry::PGL-3 area. In 34 of 37 granules, the GFP::MEG-3 signal occupied a larger area than the mCherry::PGL-3 signal (1.57× increase on average). The area occupied by the mCherry::PGL-3 signal was always entirely contained within the area occupied by the GFP::MEG-3 signal (37/37 granules analyzed).
Figure 5—figure supplement 4
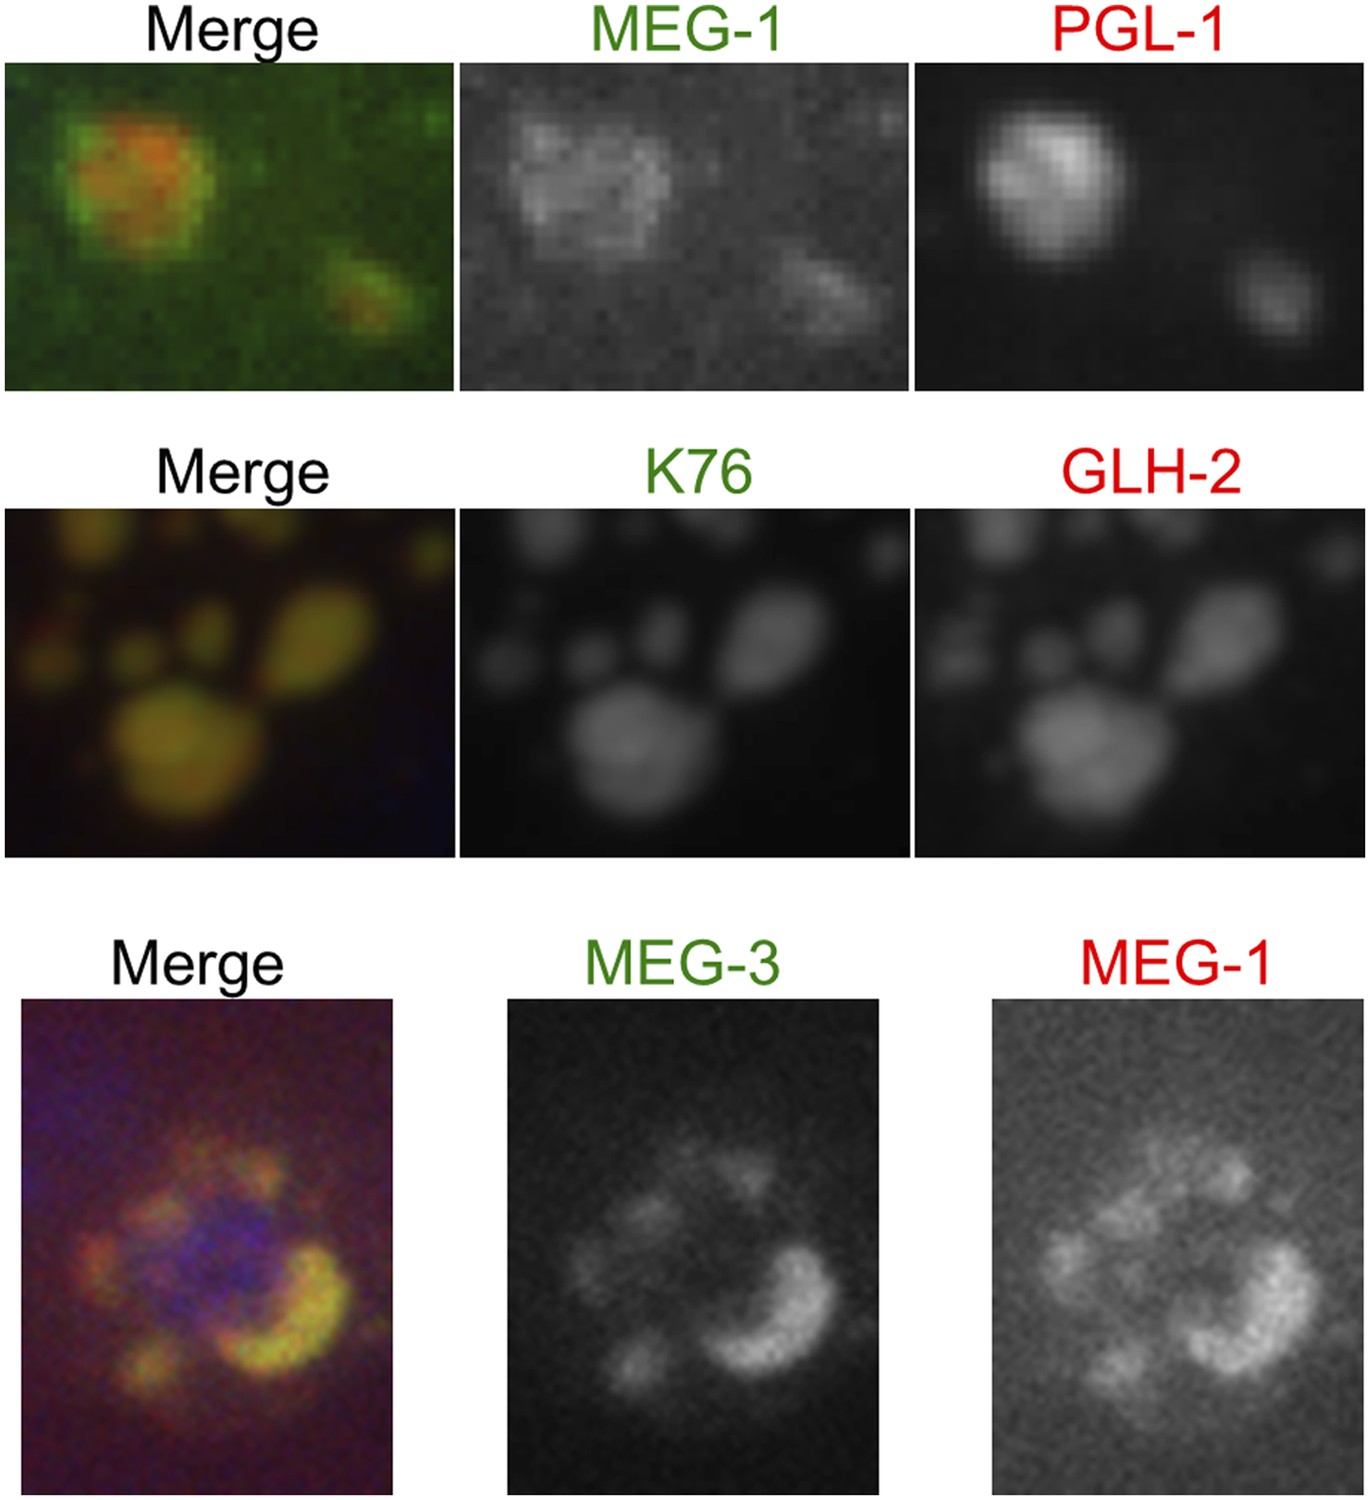
MEG-1 only partially co-localizes with PGL-1.
Fixed embryos imaged using confocal spinning disk microscopy. Top: endogenous MEG-1 antibody (green), K76 (anti-PGL-1, red). Middle: K76 (anti-PGL-1, green), GLH-2 (red). Bottom: GFP::MEG-3 (green), endogenous MEG-1 antibody (red).
Figure 5—figure supplement 5
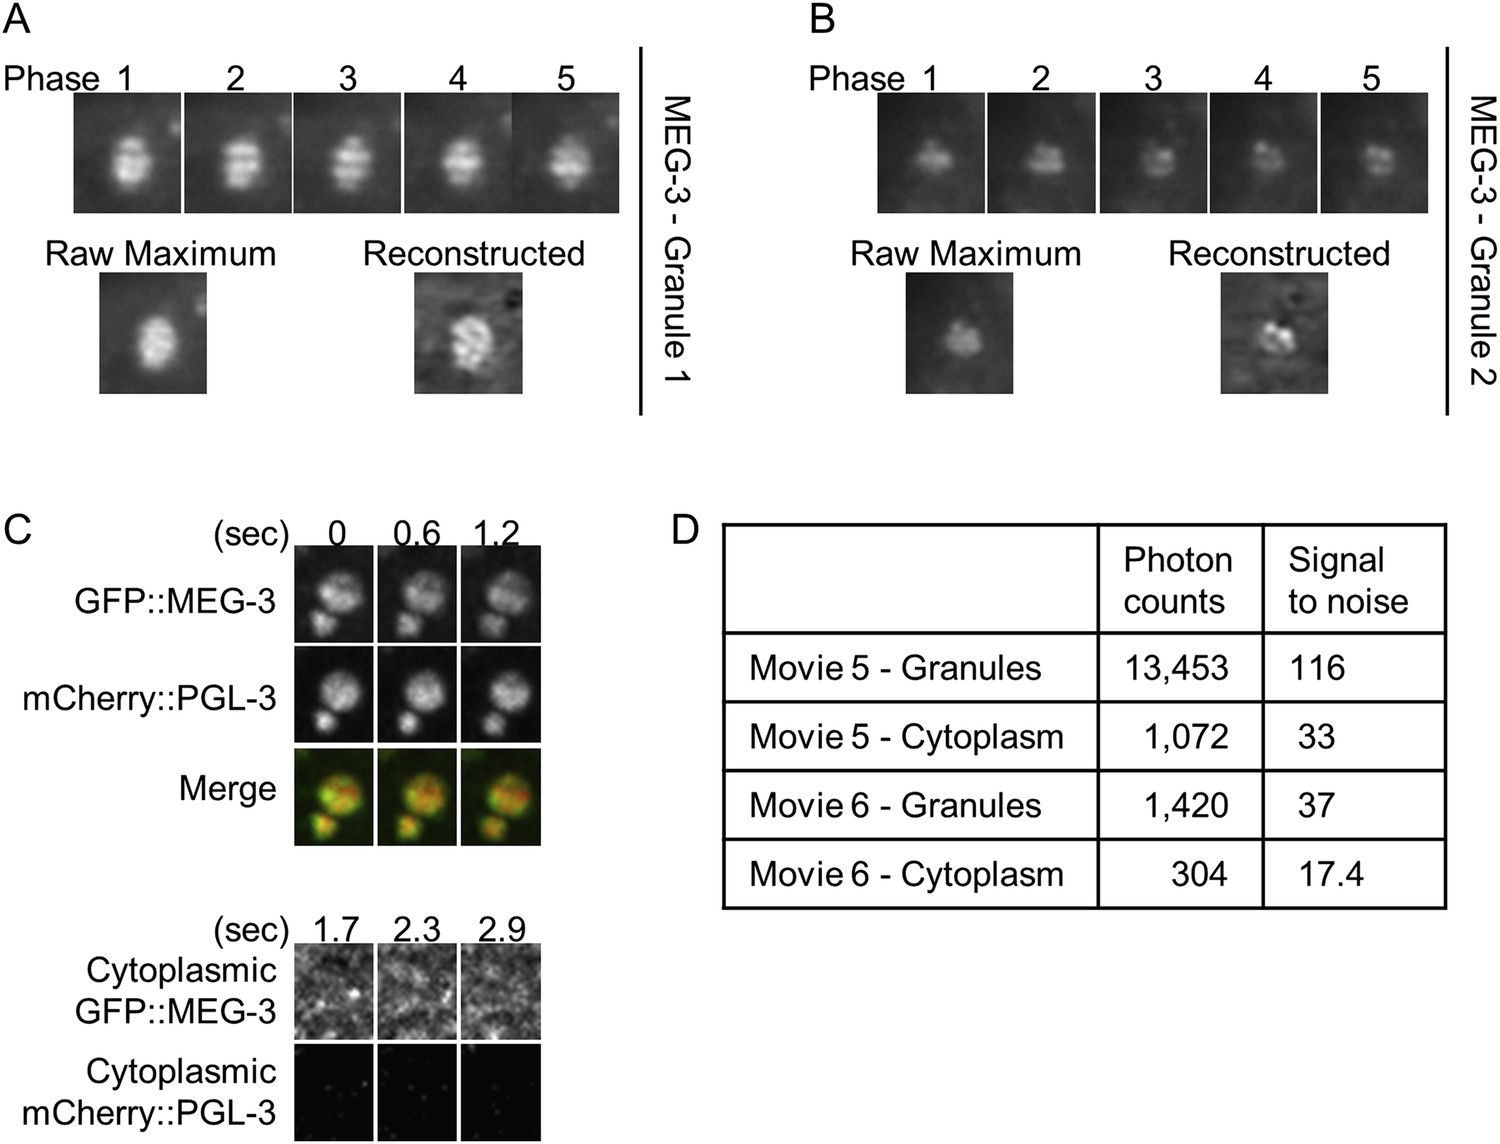
Lattice light sheet microscopy identifies sub-granular MEG-3 domain.
(A and B) Single plane images of granules from live embryos expressing GFP::MEG-3 imaged by lattice light sheet 3D-SIM. Granule in B is the same as in Video 6 and Figure 5E. Top row: each structured illumination phase is shown. Bottom row, left: maximum intensity image of the raw phase data. Bottom row, right: image after reconstruction. Note that the structure seen in the reconstructed images is present in the raw maximum images. (C) Top: maximum projections of lattice light sheet images of GFP::MEG-3 and mCherry::PGL-3 granules. MEG-3 sub-granular structure is preserved over successive frames. Bottom: maximum projections of lattice light sheet images of cytoplasmic GFP::MEG-3 and mCherry::PGL-3. Image contrast was enhanced to the same extent for both channels. mCherry::PGL-3 is not visible in the cytoplasm under these conditions. In contrast, GFP::MEG-3 is easily detected and is distributed non-uniformly. The partial pattern repetition seen in the three successive time points and the high signal-to-noise ratio (D) suggest that the cytoplasmic MEG-3 pattern represents true structure and not noise. (D) Photon counts and signal to noise for each movie.
Videos
Video 1
P granule dynamics during the oocyte-to-zygote transition.
Time-lapse of eggs undergoing the oocyte-to-embryo transition in the gonad of a hermaphrodite expressing GFP::PGL-1 and mCherry::H2B. An oocyte in the oviduct, several sperm in the spermatheca, and a zygote in the uterus are highlighted in the first frame of the movie. Key stages in the P granule disassembly and assembly process are also highlighted in later frames. Images are maximum intensity projections of 11 z stacks separated by 1 µm steps. Stacks were taken every 30 s, total movie time is 30 min 30 s, movie is played back in 60× real time.
Video 2
P granule dynamics in wild-type and meg-3 meg-4 zygotes.
Time-lapse of embryos expressing GFP::PGL-1 and mCherry::H2B. Images are maximum intensity projections of 8 z planes separated by 1 μm steps. Stacks were taken every 8 s, total movie time is 17 min 52 s, movie is played back in 80× real time. Full genotype of mutant is meg-3(tm4259) meg-4(ax2026). Very small granules form transiently in the posterior of the meg-3 meg-4 embryo at 7:20. The bright red puncta in the anterior (left) side of the embryos are polar bodies. In the wild-type movie, there are also red puncta above the embryo, these are sperm outside of the egg shell.
Video 3
P granule dynamics in wild-type and meg-3.
Time-lapse of embryos expressing GFP::PGL-1 and mCherry::H2B. Wild-type embryo is same one as shown in Video 2. Images are maximum intensity projections of 8 z planes separated by 1 μm steps. Stacks were taken every 8 s, total movie time is 17 min 20 s, movie is played back in 80× real time. Full genotype of mutant is meg-3(tm4259). The bright red puncta in the anterior (left) side of the embryos are polar bodies. In the wild-type movie, there are also red puncta above the embryo, these are sperm outside of the egg shell.
Video 4
MEG-3 and PGL-3 dynamics in the anterior of P1 cell.
Time-lapse of embryos expressing GFP::MEG-3 and mCherry::PGL-3. Images are maximum intensity projections of 8 z planes separated by 1 μm steps. Stacks were taken every 8 s, total movie time is 9 min 12 s, movie is played back in 80× real time.
Video 5
Lattice light sheet movie of an embryo expressing GFP::MEG-3 and mCherry::PGL-3.
Time-lapse of the posterior cytoplasm of a zygote (anterior to the left, posterior to the right) acquired using lattice light sheet microscopy in dithered mode. Two fusing granules are highlighted (also shown in Figure 5D). Images are maximum intensity projections of 11 z planes separated by 0.3 μm steps, capturing the entire depth of the fusing pair. Stacks were taken every 580 ms, total movie time is 34 s, movie is played back in 5× real time.
Video 6
3D reconstruction of GFP::MEG-3 granule.
Single time point SI images acquired with lattice light sheet microscopy of an individual P granule in an embryo expressing GFP::MEG-3. Acquisition time was 1 s. Resolution is 194 nm × 238 nm × 419 nm. Anterior is to the right, posterior to the left.
Video 7
3D reconstructions of GFP::MEG-3 granules.
Single time point SI images acquired with lattice light sheet microscopy of individual P granules in an embryo expressing GFP::MEG-3. Four examples are shown. Acquisition time was 1.75 s. Anterior is to the right, posterior to the left.
Tables
Table 1
List of strains used in this study
| Name | Description | Genotype | Reference |
|---|---|---|---|
| JH2842 | pie-1 prom::GFP::PGL-1-pgl-1 3′UTR; pie-1 prom::mCherry::H2B::pie-1 3′UTR | unc-119(ed3) III; axIs1522[pCM4.11]; ltIs37 [pAA64] IV | Gallo et al., 2010 |
| JH2843 | pptr-1 mutant; pie-1 prom::GFP::PGL-1-pgl-1 3′UTR; pie-1 prom::mCherry::H2B::pie-1 3′UTR | pptr-1(tm3103) V; axIs1522[pCM4.11]; ltIs37 [pAA64] IV | Gallo et al., 2010 |
| JH3055 | meg-3 mutant | meg-3(tm4259) X | This study |
| JH3147 | meg-3 mutant; pie-1 prom::GFP::PGL-1-pgl-1 3′UTR; pie-1 prom::mCherry::H2B::pie-1 3′UTR | meg-3(tm4259) X; axIs1522[pCM4.11]; ltIs37 [pAA64] IV | This study |
| JH3225 | meg-3 meg-4 mutant—see Table 2 | meg-3(tm4259) meg-4(ax2026) X | This study |
| JH3149 | meg-3 meg-4 mutant; pie-1 prom::GFP::PGL-1-pgl-1 3′UTR; pie-1 prom::mCherry::H2B::pie-1 3′UTR | meg-3(tm4259) meg-4(ax2026) X; axIs1522[pCM4.11]; ltIs37 [pAA64] IV | This study |
| JH3148 | meg-1 mutant; pie-1 prom::GFP::PGL-1-pgl-1 3′UTR; pie-1 prom::mCherry::H2B::pie-1 3′UTR | meg-1(vr10) X; axIs1522[pCM4.11]; ltIs37 [pAA64] IV | This study |
| JH3229 | meg-1 meg-3 mutant | meg-1(vr10) meg-3(tm4259) X | This study |
| JH3150 | meg-1 meg-3 mutant; pie-1 prom::GFP::PGL-1-pgl-1 3′UTR; pie-1 prom::mCherry::H2B::pie-1 3′UTR | meg-1(vr10) meg-3(tm4259) X; axIs1522[pCM4.11]; ltIs37 [pAA64] IV | This study |
| JH3156 | pptr-1; meg-1 mutant; pie-1 prom::GFP::PGL-1-pgl-1 3′UTR; pie-1 prom::mCherry::H2B::pie-1 3′UTR | pptr-1(tm3103) V; meg-1(vr10) X; axIs1522[pCM4.11]; ltIs37 [pAA64] IV | This study |
| JH3155 | pptr-1; meg-3 mutant; pie-1 prom::GFP::PGL-1-pgl-1 3′UTR; pie-1 prom::mCherry::H2B::pie-1 3′UTR | pptr-1(tm3103) V; meg-3(tm4259) X; axIs1522[pCM4.11]; ltIs37 [pAA64] IV | This study |
| JH2932 | mbk-2 null mutant; pgl-1::TY1::eGFP::3xFLAG992C12 | unc-24(e1172) mbk-2(pk1427) IV / nT1[let-?(m435)](IV;V); ddEX16 | This study |
| YL183 | meg-1 mutant; pie-1 prom::GFP::MEG-1::pie-1 3′UTR | meg-1(vr10) X; GFP::MEG-1 | Leacock and Reinke, 2007 |
| JH3016 | meg-3 prom::GFP::MEG-3::meg-3 3′UTR | unc-119(ed3); axIS2076[pJW6.01] | This study |
| JH3064 | pptr-1 mutant; meg-3 prom::GFP::MEG-3::meg-3 3′UTR | pptr-1(tm3103) V; axIS2076[pJW6.01] | This study |
| JH3019 | meg-3 prom::GFP::MEG-3::meg-3 3'UTR; pie-1 prom::GFP::PGL-3::pie-1 3′UTR | unc-119(ed3) III; axIS2076[pJW6.01]; axIS2077[pJW2.03] | This study |
| JH3230 | pgl-3 mutant; meg-3 prom::GFP::MEG-3::meg-3 3′UTR | pgl-3(bn104) V; axIS2076[pJW6.01] | This study |
| JH3153 | meg-3 mutant; meg-3 prom::GFP::MEG-3::meg-3 3′UTR | meg-3(tm4259) X; axIS2076[pJW6.01] | This study |
| JH3247 | C-terminal FLAG insertion in genomic meg-4 locus—see Table 2 | meg-4(ax2080) | This study |
| JH3248 | meg-4 mutant—see Table 2 | meg-4(ax2081) | This study |
-
Abbreviations: prom–Promoter, 3′ UTR–3′ untranslated region, ALL CAPs–coding regions of indicated genes.
-
All transgenes also contain a wild-type copy of unc-119 (transformation marker).
Table 2
Strains generated by CRISPR/Cas9
| Strain | Allele | Edit | Method | sgRNA (PAM sequence) | Genomic site of edit |
|---|---|---|---|---|---|
| JH3247 | meg-4 (ax2080) | C-terminal 3xFLAG insertion in meg-4 | Homology directed repair with ssODN. Sequence: (homology arms) (cctgtcagatacttgaatgcaaaacgagaatggctgga atctatttttgacccaccgagagatcaa)gactacaaaga ccatgacggtgattataaagatcatgatatcgattacaa ggatgacgatgacaag(tgattgtactgatatatatctatt tcatgtcgagtattttgtattttattcttgttcattgacc) | caatcattgatctctgggt (ggg) | X:1686208 |
| JH3248 | meg-4 (ax2081) | Deletion removing 733 base pairs upstream of the meg-4 start and the first 2565 bases of the gene | NHEJ | gagcgcgaaatagtgtgtg (ggg) tgggaccaaaaagcaagaa (tgg) atttatttatggtctgccc (agg) ctgcccaggaacttgtaac (ggg) | X:1682223..1685521 |
| JH3325 | meg-3 (tm4259) meg-4 (ax2026) | Deletion of 7 nucleotides starting at nucleotide 37 of meg-4(amino acid 13). The frameshift inserts the amino acids ‘EETEKVTALIVEAIWKVHRKIWDTTLVLKNCFIRS’ at amino acid 13 followed by a premature stop | NHEJ for meg-4(ax2026) in meg-3(tm4259) | tctctgtttcctctggagtt (tgg) caagttccgttgattccagc(tgg) | X:1682992 |
Download links
A two-part list of links to download the article, or parts of the article, in various formats.
Downloads (link to download the article as PDF)
Open citations (links to open the citations from this article in various online reference manager services)
Cite this article (links to download the citations from this article in formats compatible with various reference manager tools)
Regulation of RNA granule dynamics by phosphorylation of serine-rich, intrinsically disordered proteins in C. elegans
eLife 3:e04591.
https://doi.org/10.7554/eLife.04591


