The polarity protein Baz forms a platform for the centrosome orientation during asymmetric stem cell division in the Drosophila male germline
- University of Michigan, United States
- Howard Hughes Medical Institution, University of Michigan, United States
Figures
Figure 1
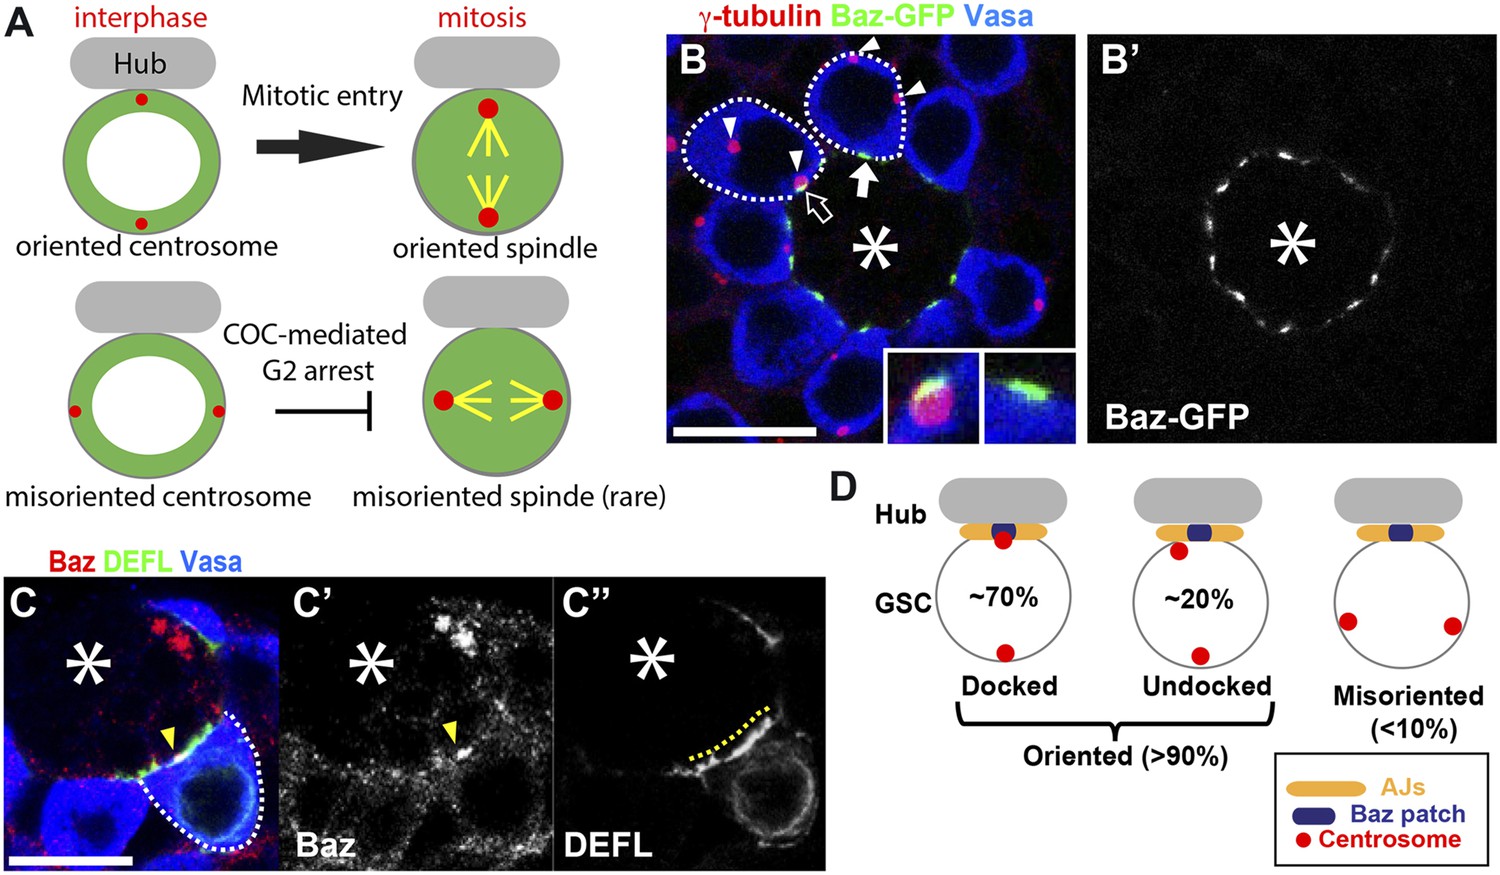
The apical centrosome associates with the Baz Patch.
(A) The centrosome orientation in GSCs and the function of COC. (B) An example of an apical testis tip showing the Baz patch and centrosomes. The apical centrosome often associates with the Baz patch (open arrow). The Baz patch (solid arrow) remains in GSCs with misoriented centrosomes. Centrosomes are indicated with arrowheads. The insets show Baz patches with or without the centrosome. (B′) Baz-GFP only. Bar: 10 µm. The colored text indicates the fluorescence pseudocolor in the images in this and subsequent figures. The γ-tubulin staining indicates the centrosome. The Vasa staining indicates the germ cells. The hub is denoted with an asterisk. (C) The Baz patch is a small structure that is located on the GSC-hub interface. The arrowhead in (C, C′) indicates the Baz patch stained with anti-Baz (red). The yellow dotted line in (C'') indicates the GSC-hub interface illuminated by GFP-E-cadherin (DEFL, green) expressed in the germline (nos-gal4>UAS-DEFL). (D) Schematic describing the definition of centrosome orientation and Baz-centrosome docking.
Figure 2
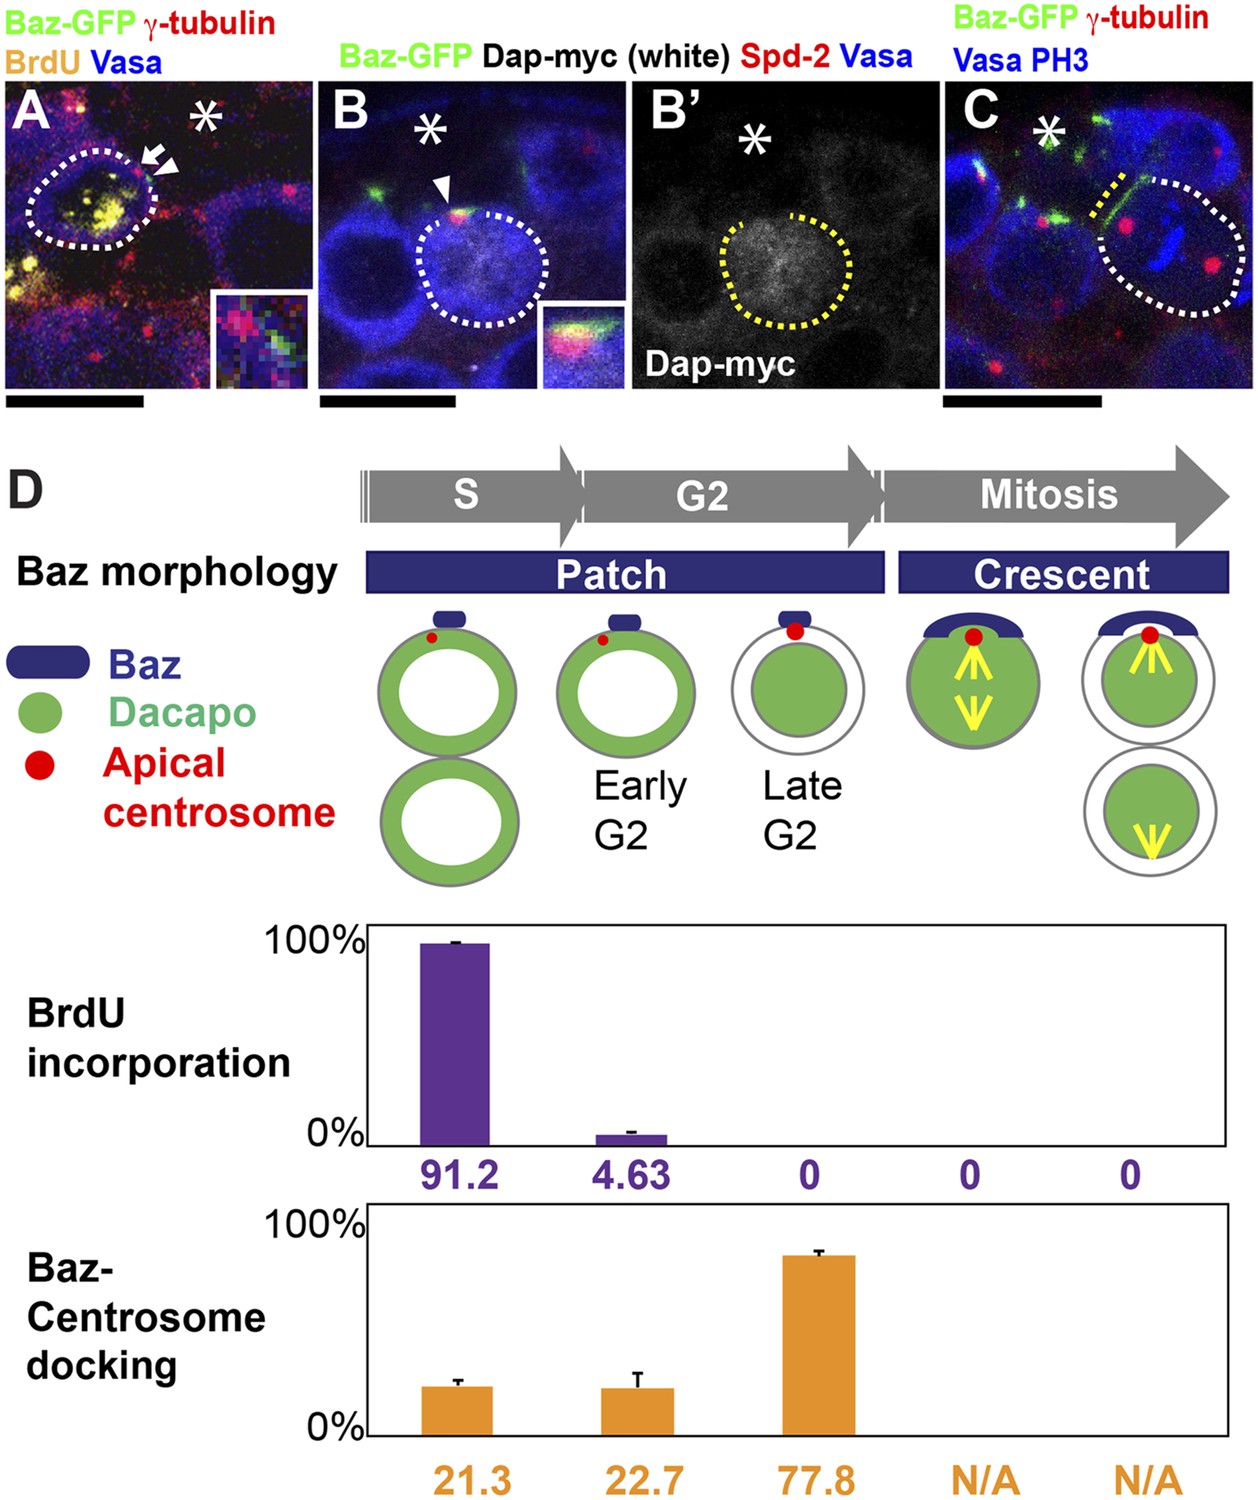
Baz-centrosome docking is cell cycle-dependent.
(A) A representative image of an undocked centrosome in S phase. The arrow indicates the centrosome, and the arrowhead indicates the Baz patch. The inset shows a magnified view. (B) A representative image of a late G2 GSC with nuclear Dap (white). The arrowhead indicates the centrosome docked to the Baz patch. Spd-2 staining indicates the centrosome (red). (B′) Dap-myc only. (C) A representative image of a mitotic GSC. The yellow dotted line indicates a Baz crescent along the hub-GSC interface. At this point, Baz-centrosome docking cannot be assessed because Baz does not localize as foci (‘N/A’ in panel D). (D) The frequency of Baz-centrosome docking during the cell cycle.
Figure 3 with 1 supplement
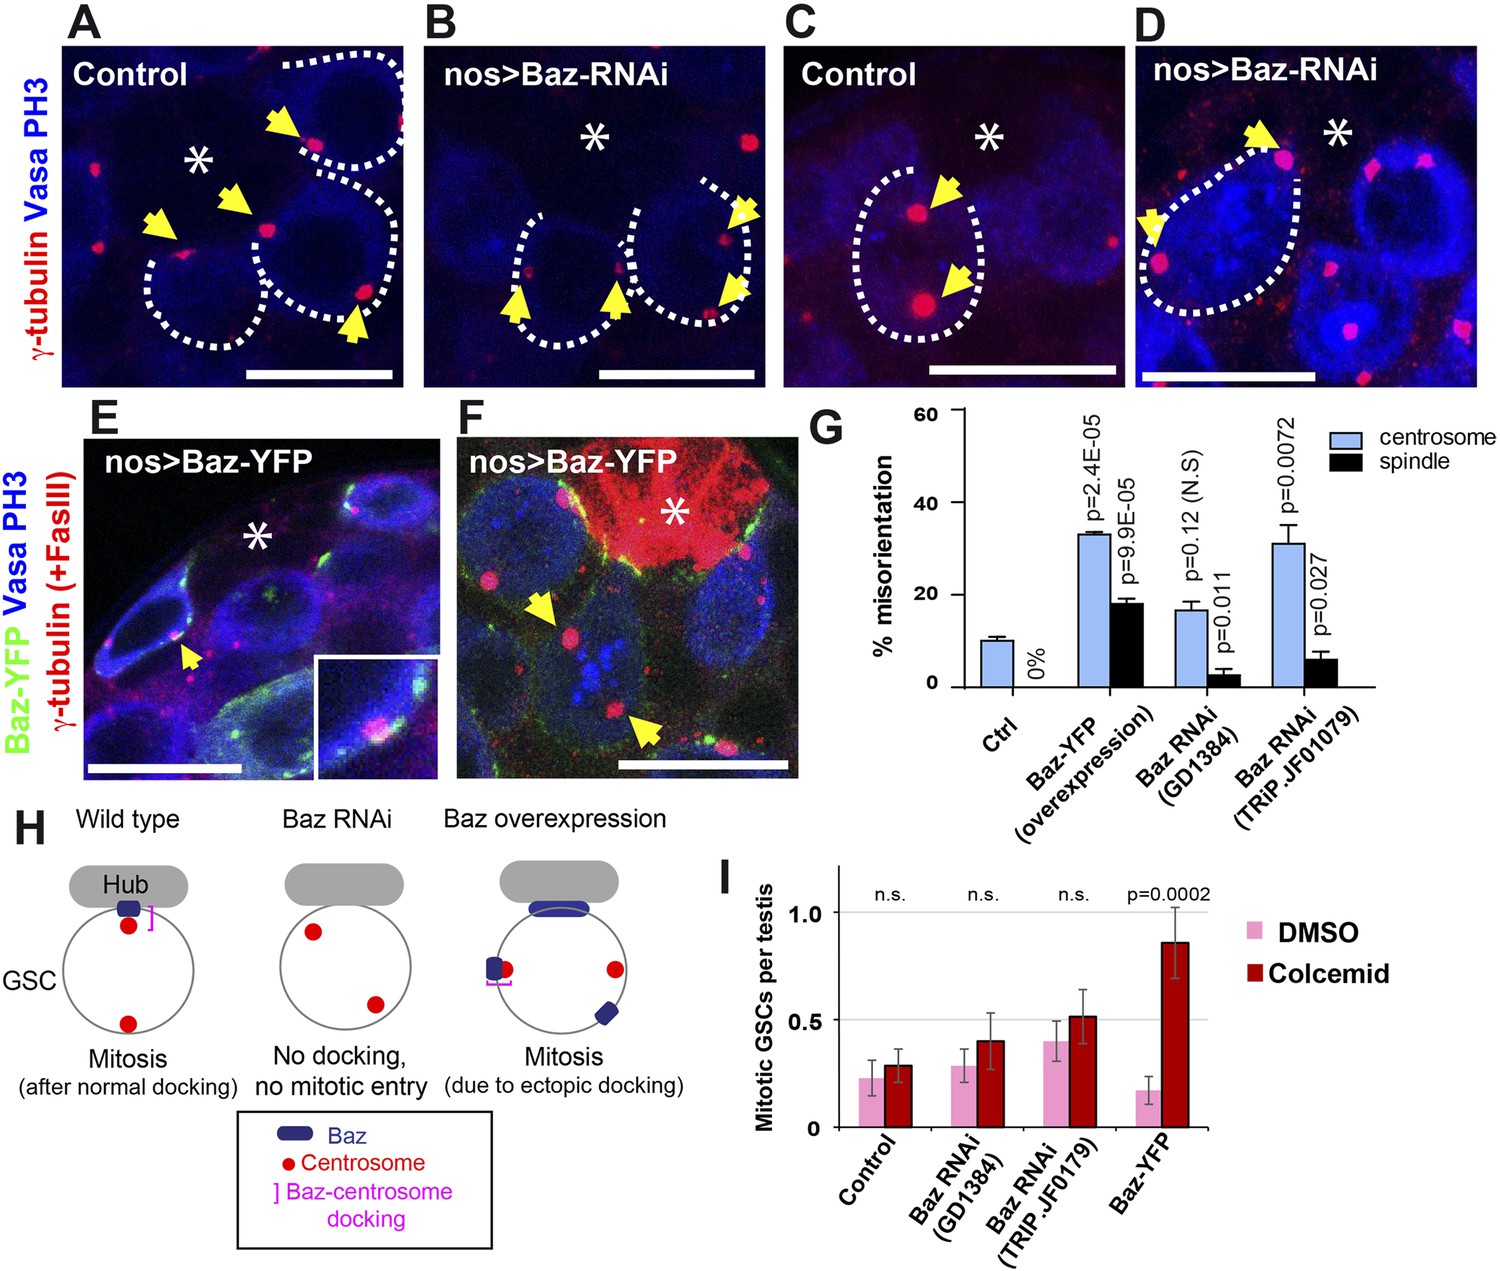
Baz is required for centrosome orientation.
(A, B) Control (A) and Baz RNAi (B) testes showing GSCs in interphase. Arrows indicate centrosomes. GSCs are indicated by broken lines. The hub is denoted by an asterisk. Bar: 10 µm. (C, D) Control (C) and Baz RNAi (D) GSCs in mitosis. Arrows indicate spindle poles. (E) Overexpressed Baz-YFP ectopically localizes to the lateral cortex of GSCs. Arrows indicate the ectopic patch docking to the centrosome. (F) Mitotic GSCs with misoriented spindles upon overexpression of Baz-YFP. (G) Frequencies of centrosome (% of total GSC) and spindle (% of mitotic GSC) misorientation upon Baz RNAi or Baz-YFP overexpression. N > 300 GSCs were scored for centrosome orientation, and N > 30 mitotic GSCs were scored for spindle orientation. (H) A model for Baz-centrosome docking and mitotic entry in control, Baz RNAi, and Baz overexpression. (I) Mitotic index of GSCs after incubation with or without colcemid for 4.5 hr in indicated genotypes. Increased mitotic index in the presence of colcemid indicates defective COC. p value indicates the statistical significance in an increase in mitotic index in the presence of colcemid.
Figure 3—figure supplement 1
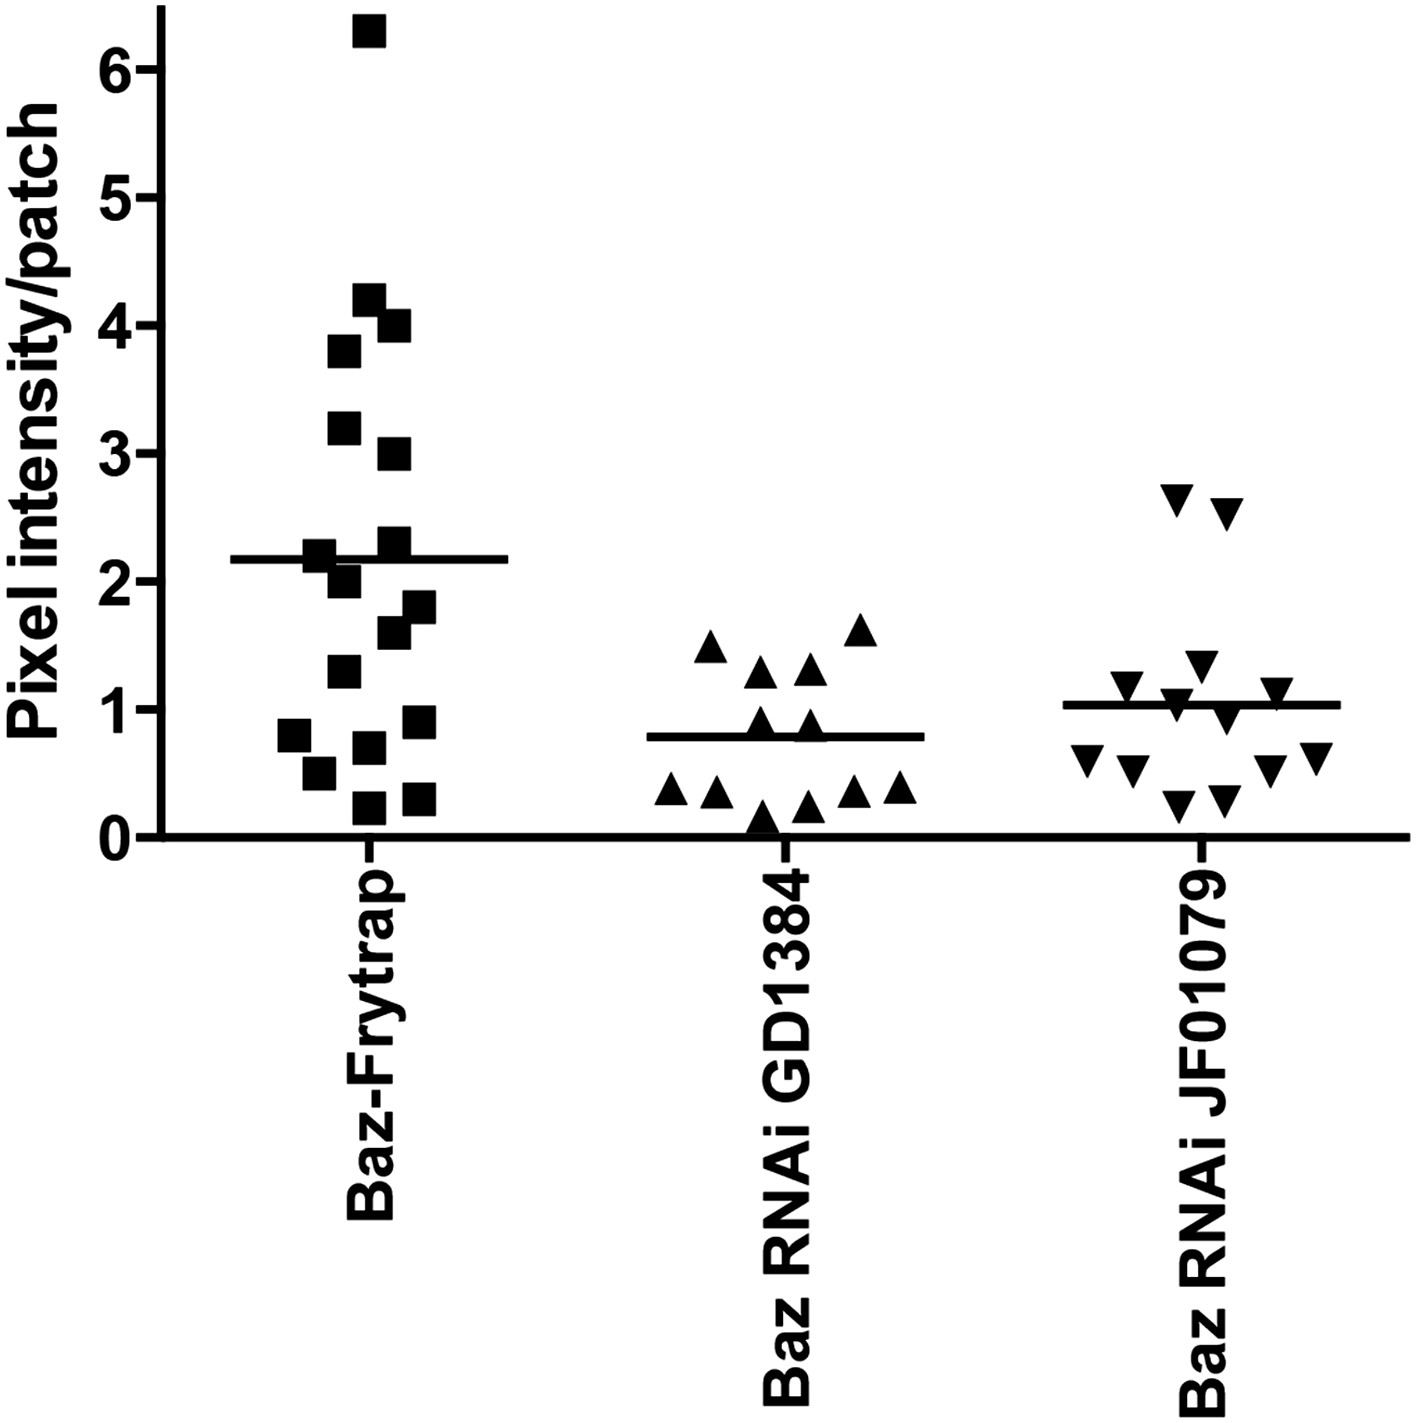
GFP fluorescent quantification of Baz patch (Baz-GFP Flytrap) upon knockdown of Baz (GD1384 and JF01079).
The background (cytoplasm signal in the same cell for same field) was subtracted from each patch.
Figure 4
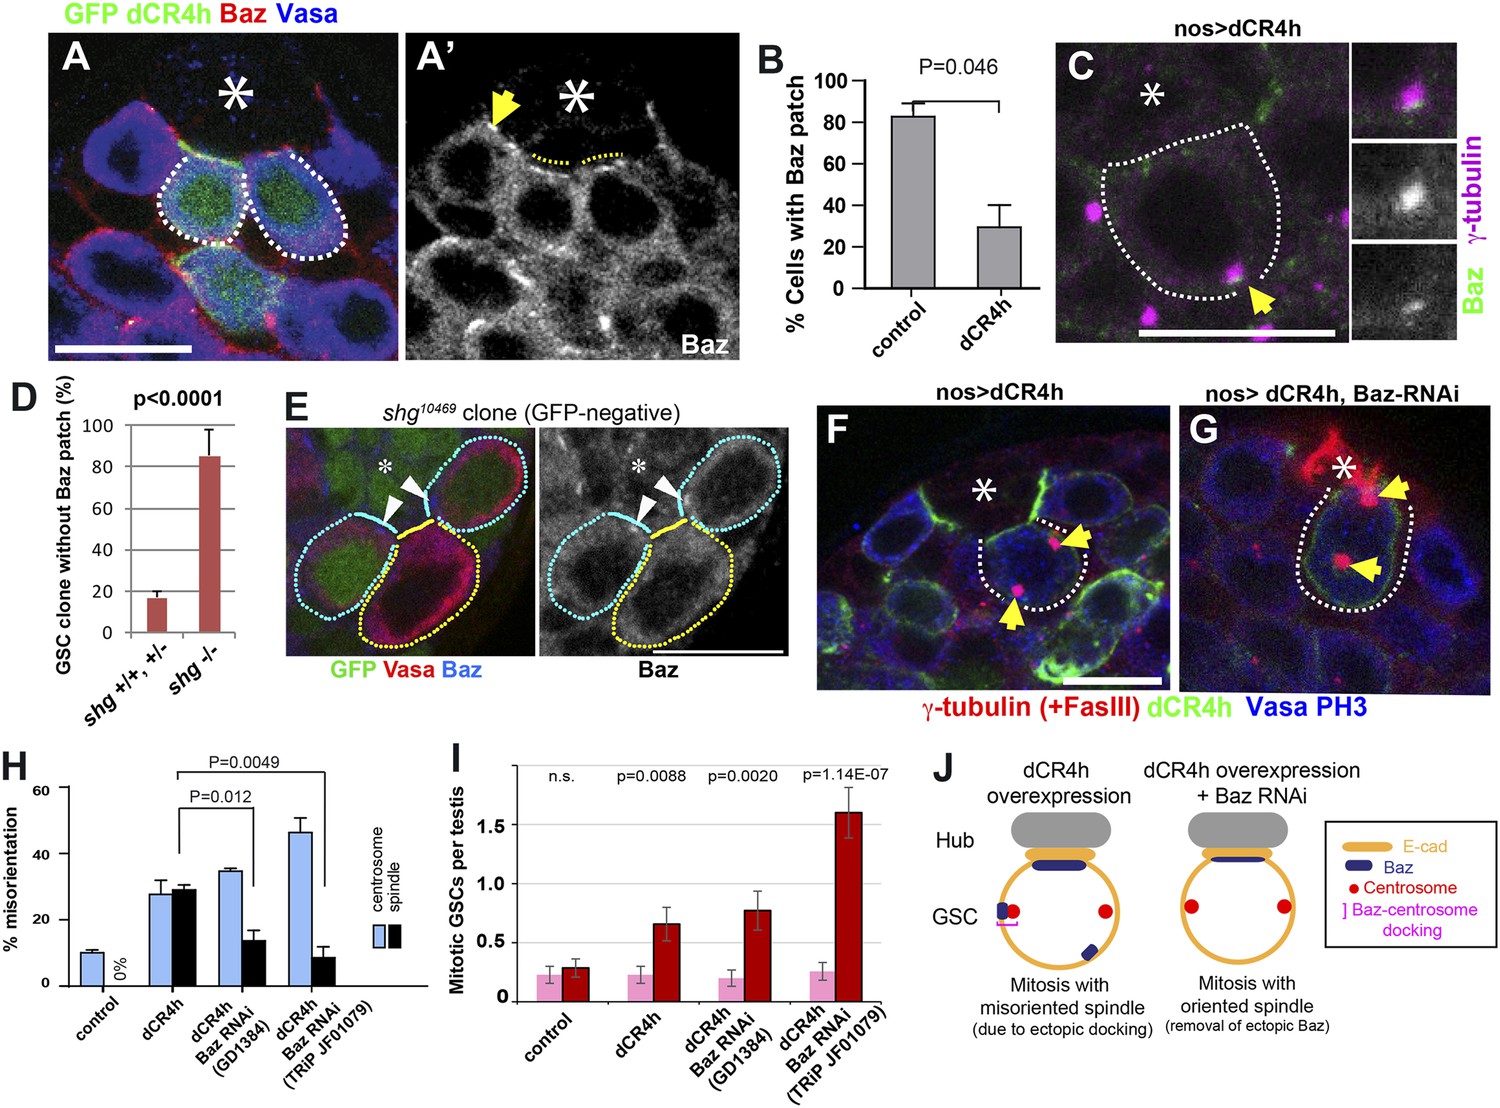
Baz functions downstream of E-cadherin during centrosome orientation.
(A) An apical tip of the testis containing clones (GFP+) that express a dominant-negative form of E-cadherin (dCR4h). The arrow indicates normal Baz patch in a control GSC that does not express dCR4h. Broken lines indicate diffused Baz localization upon expression of dCR4h. (A′) anti-Baz only. The hub is denoted by an asterisk. Bar: 10 µm. (B) Frequency of GSCs with the Baz patch in control vs dCR4h-expressing GSCs. N > 100 GSCs were scored. (C) An example of ectopic Baz patch away from the hub-GSC interface (arrow) that docks the centrosome upon expression of dCR4h. (D) Frequency of Baz patch in control vs shg10469 (E-cadherin loss of function allele) GSC clones. (E) An example of GFP-, shg10469 clone without Baz patch (yellow line). Control (GFP+) GSCs with Baz patch (arrowheads) are juxtaposed (cyan lines). (F) An example of a misoriented spindle upon expression of dCR4h. Arrows indicate spindle poles. (G) An example of oriented spindles in GSCs that express both dCR4h and Baz RNAi. (H) Frequencies of centrosome (% of total GSC) and spindle (% of mitotic GSC) misorientation upon expression of dCR4h in the presence or absence of Baz RNAi. N > 300 GSCs were scored for centrosome orientation, and N > 30 mitotic GSCs were scored for spindle orientation. (I) Mitotic index of GSCs after incubation with or without colcemid for 4.5 hr indicate genotypes. Increased mitotic index in the presence of colcemid indicates defective COC. p value indicates the statistical significance in an increase in mitotic index in the presence of colcemid. (J) A model for Baz-centrosome docking and mitotic entry in dCR4h-expressing GSCs with or without Baz RNAi.
Figure 5
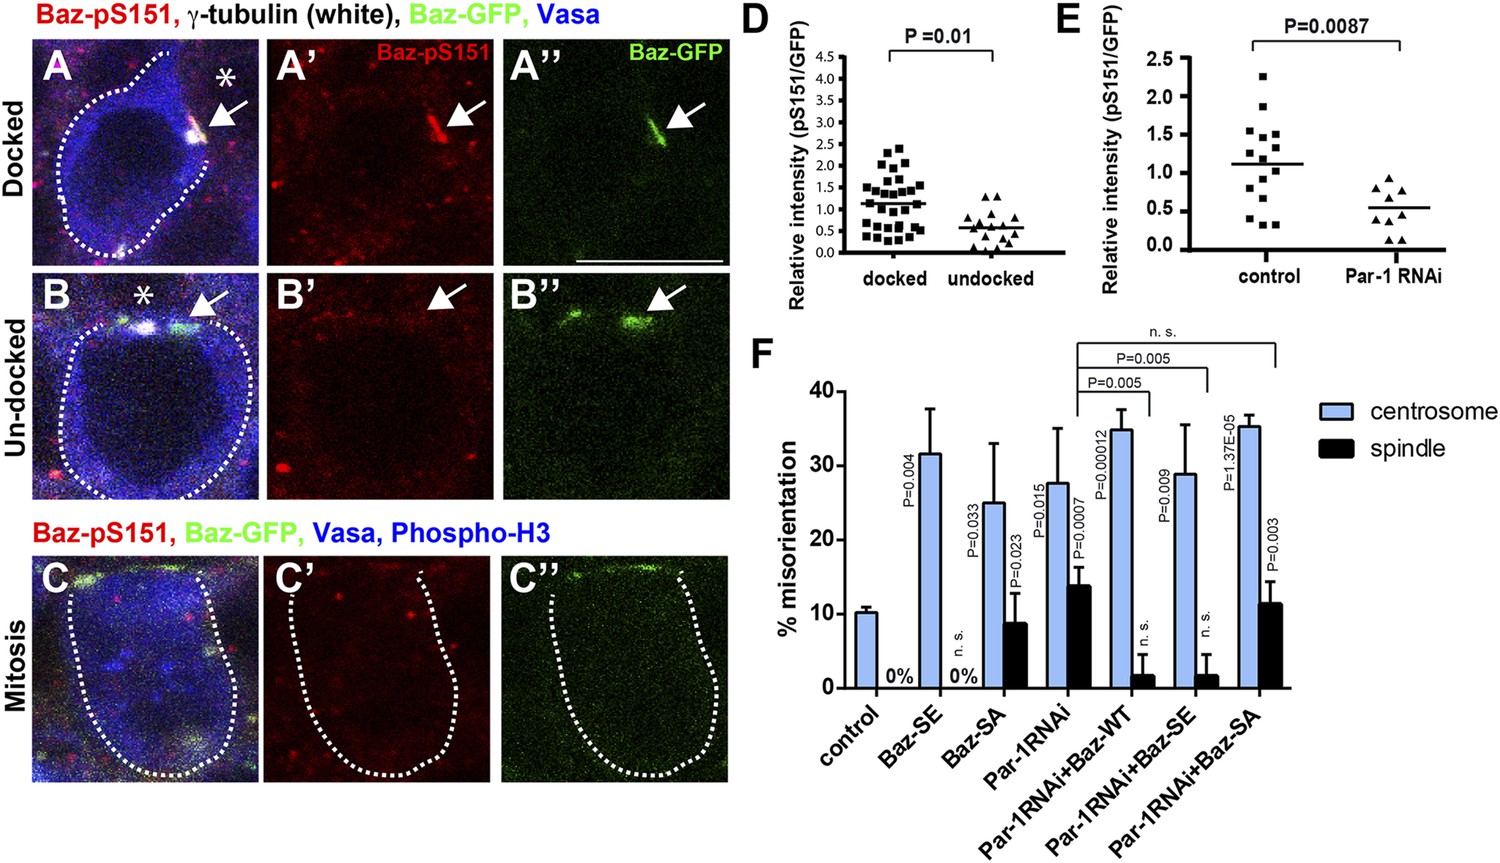
Par-1-dependent Baz-S151 phosphorylation is required for the centrosome orientation checkpoint.
(A–C) Phosphorylation of Baz-S151 was monitored by a phospho-S151-specific antibody during cell cycle. The Baz-patch is indicated by the arrow. Red indicates Baz-pS151, green indicates Baz-GFP, and blue indicates Vasa. Bar: 10 μm. The hub is denoted with an asterisk. (D) The quantification of Baz-S151 phosphorylation levels. The signal was normalized by Baz-GFP (pixel intensity of pS151 staining was divided by the pixel intensity of Baz-GFP). The background (cytoplasm signal in the same cell) was subtracted from both pS151 and Baz-GFP prior to calculation. N > 10 GSCs were scored. (E) The quantification of Baz-S151 phosphorylation level in control vs Par-1 RNAi GSCs. N > 10 GSCs was scored. (F) Frequencies of centrosome (% of total GSC) and spindle (% of mitotic GSC) misorientation in control vs Par-1 RNAi GSCs with or without expression of wild type Baz, Baz-SA or Baz-SE. N > 300 GSCs were scored for centrosome orientation, and N > 30 mitotic GSCs were scored for spindle orientation.
Figure 6
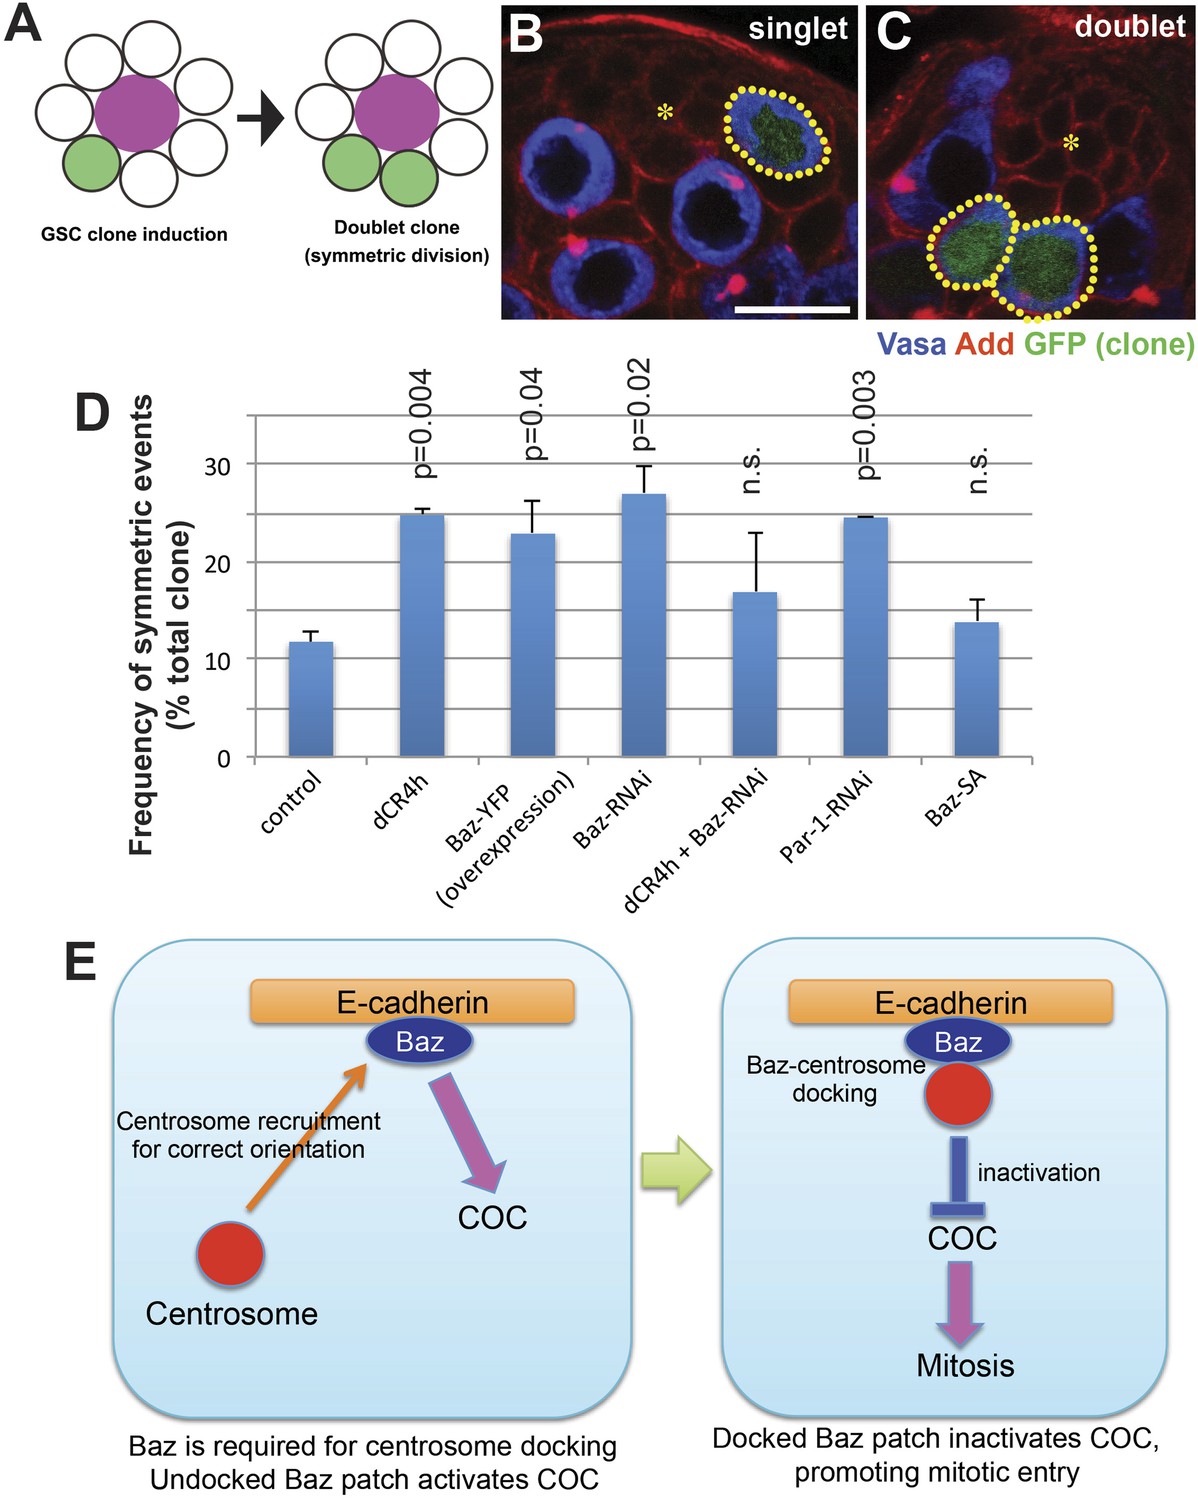
COC is required to prevent symmetric GSC divisions.
(A) An assay system to examine symmetric GSC divisions. GFP+ clone is induced at a low frequency using hs-FLP, nos > stop > gal4, UAS-GFP by a 20-min heatshock. GFP clones were examined 24 hr post heatshock. When such GSCs undergo symmetric stem cell division, it will generate doublet clones (two GFP+ GSCs are juxtaposed each other). (B, C) Representative images of singlet (B) and doublet (C) GSC clones. Hub is indicated by the asterisk. Clones are indicated by dotted lines. Bar: 10 µm. (D) Frequency of doublets after 24 hr post heatshock. JF01079 line was used for Baz RNAi. (E) Model of Baz function in COC (see text for detail).
Download links
A two-part list of links to download the article, or parts of the article, in various formats.
Downloads (link to download the article as PDF)
Open citations (links to open the citations from this article in various online reference manager services)
Cite this article (links to download the citations from this article in formats compatible with various reference manager tools)
The polarity protein Baz forms a platform for the centrosome orientation during asymmetric stem cell division in the Drosophila male germline
eLife 4:e04960.
https://doi.org/10.7554/eLife.04960


