A molecular basis for the differential roles of Bub1 and BubR1 in the spindle assembly checkpoint
- Max Planck Institute of Molecular Physiology, Germany
- University Medical Center Utrecht, Netherlands
- University Medical Center, Netherlands
- Utrecht University, Netherlands
- Netherlands Proteomics Center, Netherlands
- University Duisburg-Essen, Germany
Figures
Figure 1 with 1 supplement

Mps1 and Bub1 are required for kinetochore localization of BubR1.
(A) Similar domain organization of the homologous proteins Bub1 and BubR1. TPR—tetratrico peptide repeat, B3BD—Bub3 binding domain, B1—Bub1, BR1—BubR1. (B) Schematic depiction of the outer KT (KMN network). MELT repeats of Knl1 are phosphorylated by the checkpoint kinase Mps1 and recruit Bub1/Bub3 to KTs. It is not clear how BubR1 is recruited to KTs. (C–D) Quantitative IP-mass spectrometry analyses showing that the interaction of Bub1, BubR1, and Bub3 with KTs is significantly reduced upon inhibition of Mps1 with Reversine. Green- and red-labeled hits indicate respectively proteins whose levels were not strongly affected or were strongly affected in the presence of Reversine. (E and G) Representative images of Flp-In T-REx cell lines in BubR1 (E) and Bub1 (G) RNAi, respectively, after treatment with nocodazole, showing that Bub1 is required for BubR1 KT localization. Scale bar: 10 µm. (F and H) Quantification of Bub1 and BubR1 KT levels, respectively, in cells treated as in panel E and G. The graph shows mean intensity, error bars indicate SD. The mean value for non-depleted cells is set to 1. (I–J) Representative images of stable Flp-In T-REx cell lines expressing the indicated GFP-Bub1 constructs (panel I) or HeLa cells transfected with the indicated GFP-BubR1 constructs (panel J) after treatment with nocodazole. The same images are also shown in Figure 4A and Figure 5C, and quantified in Figures 4B and 5B. Scale bar: 10 µm.
Figure 1—figure supplement 1
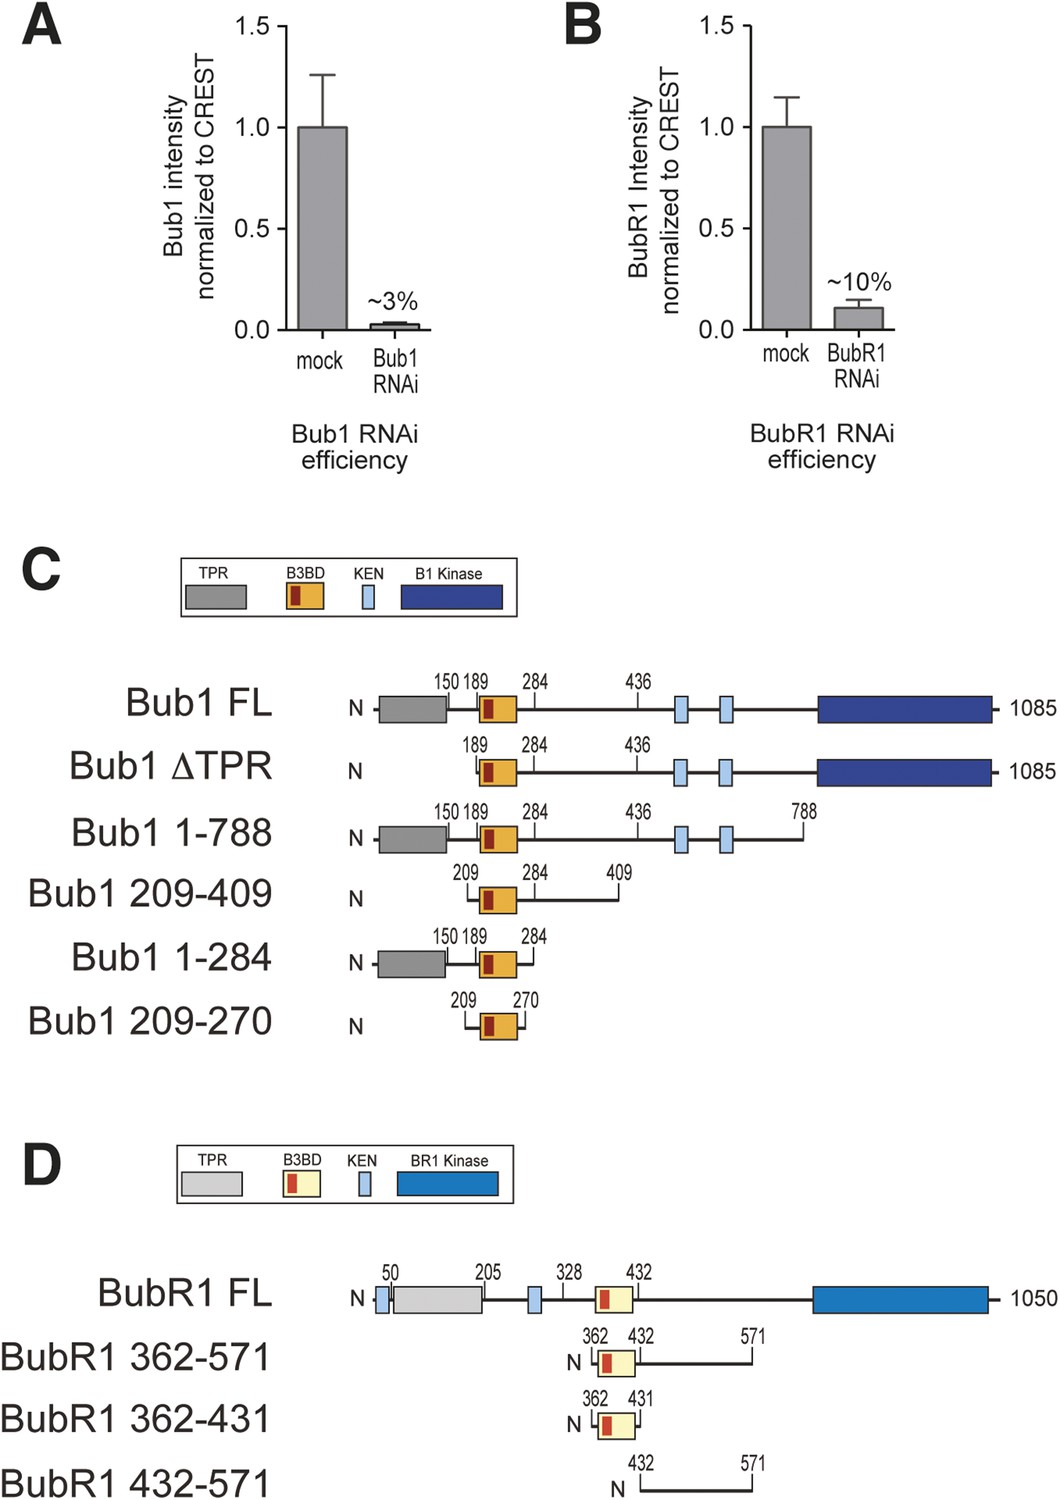
RNAi quantification and schematic depiction of Bub1 and BubR1 constructs.
(A–B) Quantification of RNAi-based depletion of Bub1 and BubR1. Shown are mean and standard deviation from two independent experiments. (C–D) Schematic depiction of the main Bub1 and BubR1 deletion constructs used in this study. TPR, tetratrico peptide repeats; B3BD, Bub3 binding domain; BR1, BubR1; FL, full-length; N, N-terminus.
Figure 2 with 1 supplement
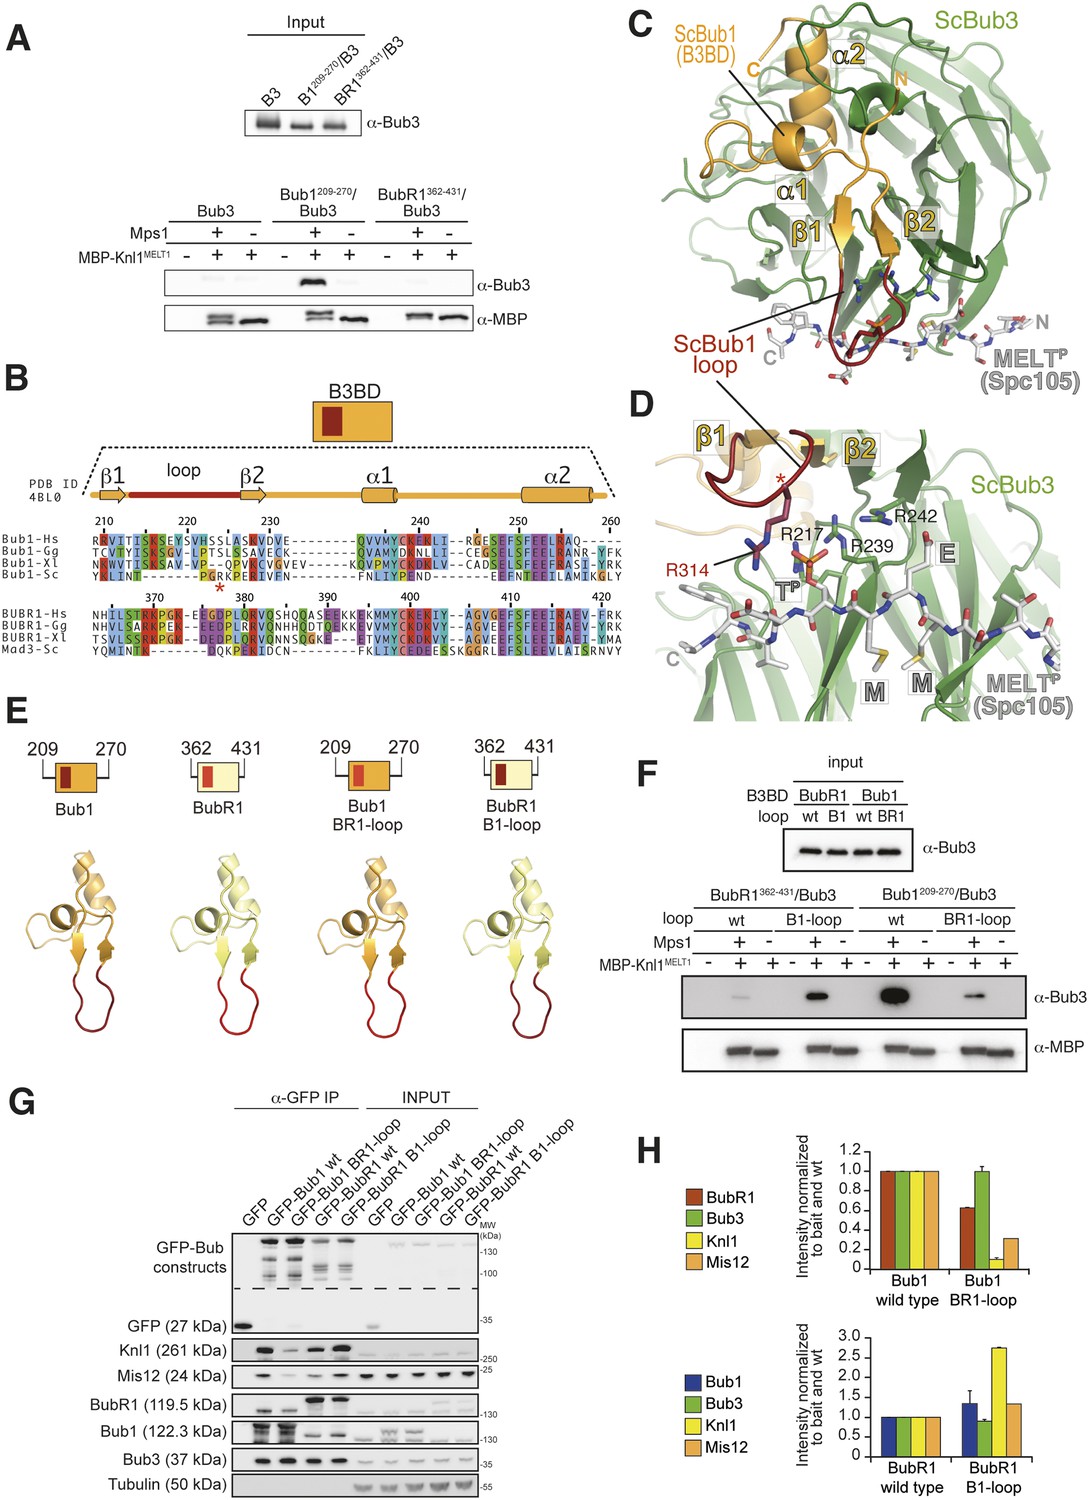
The loop regions of Bub1 and BubR1 modulate the interaction of Bub3 with phosphorylated MELT motifs.
(A) Recombinant Bub3, Bub1209–270/Bub3 and BubR1362–431/Bub3 were incubated with immobilized MBP-Knl1MELT1 (residues 138–168 of human Knl1) prephosphorylated with Mps1 (+) or unphosphorylated (−). Empty lanes (−) demonstrate lack of background binding to empty beads. wt, wild type; B3, Bub3; B1, Bub1; BR1, BubR1. (B) Multiple sequence alignments of the Bub3 binding domains (B3BD) of human (Homo sapiens, Hs), chicken (Gallus gallus, gg), frog (Xenopus laevis, Xl), and budding yeast (Saccharomyces cerevisiae, Sc) Bub1 and BubR1s. Mad3 is the budding yeast BubR1 homolog. ScBub1R314 (red asterisk) directly contributes to the interaction with the MELTP peptide. The different Bub1 and BubR1 sequences were aligned manually on the basis of the crystal structures of the B3BDs of Mad3 and Bub1 in complex with Bub3 (Larsen et al., 2007; Primorac et al., 2013). (C) Crystal structure of the ScBub1289–359-Bub3-MELTP ternary complex (Primorac et al., 2013). N and C indicate the N- and C-terminus, respectively. (D) Close-up of the MELTP binding site indicating the role of ScBub1R314 in MELTP binding. (E) Schematic depiction of short Bub1 and BubR1 ‘loop swap’ constructs, containing the loop (different shades of red) followed by the Bub3-binding domain (different shades of yellow). (F) Recombinant BubR1362–431/Bub3 with its own loop (wt) or with the Bub1 loop (B1) and recombinant Bub1209–270/Bub3 with its own loop (wt) or with the BubR1 loop (BR1) were incubated with immobilized MBP-Knl1MELT1 prephosphorylated with Mps1 (+) or unphosphorylated (−) as in panel A. Empty lanes (−) demonstrate lack of background binding to empty beads. (G) Western Blot of immunoprecipitates (IP) from mitotic Flp-In T-REx cell lines expressing the indicated GFP-Bub1 and GFP-BubR1 constructs showing the influence of the loop on the ability to pull down the KT-components Knl1 and Mis12. Tubulin was used as loading control. (H) Quantification of the Western blot in (G). In the upper graph, the amounts of co-precipitating BubR1, Bub3, Knl1, and Mis12 were normalized to the amount of GFP-Bub1 bait present in the IP. In the lower graph, the amounts of co-precipitating Bub1, Bub3, Knl1, and Mis12 were normalized to the amount of GFP-BubR1 bait. Values for GFP-Bub1 wt and GFP-BubR1 wt, respectively are set to 1. The graphs show mean intensity of two independent experiments (for Mis12 only one). Error bars represent SD.
Figure 2—figure supplement 1
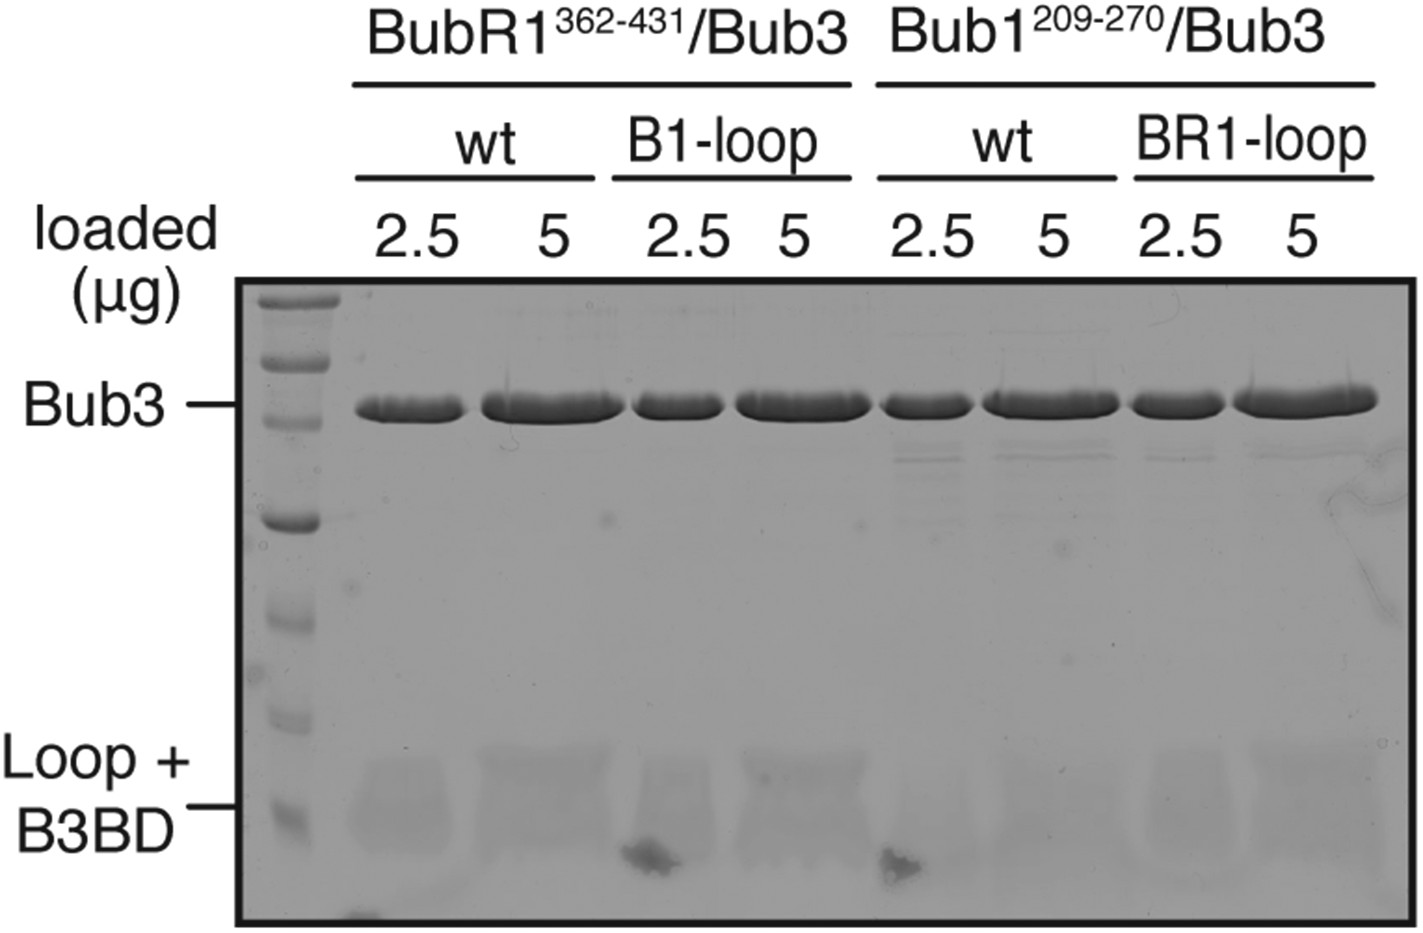
Validation of recombinant ‘loop swap’ mutants.
The indicated constructs were purified and separated by SDS-PAGE after purification. Both wild-type and chimeric constructs interact normally and with similar affinity with Bub3.
Figure 3 with 1 supplement
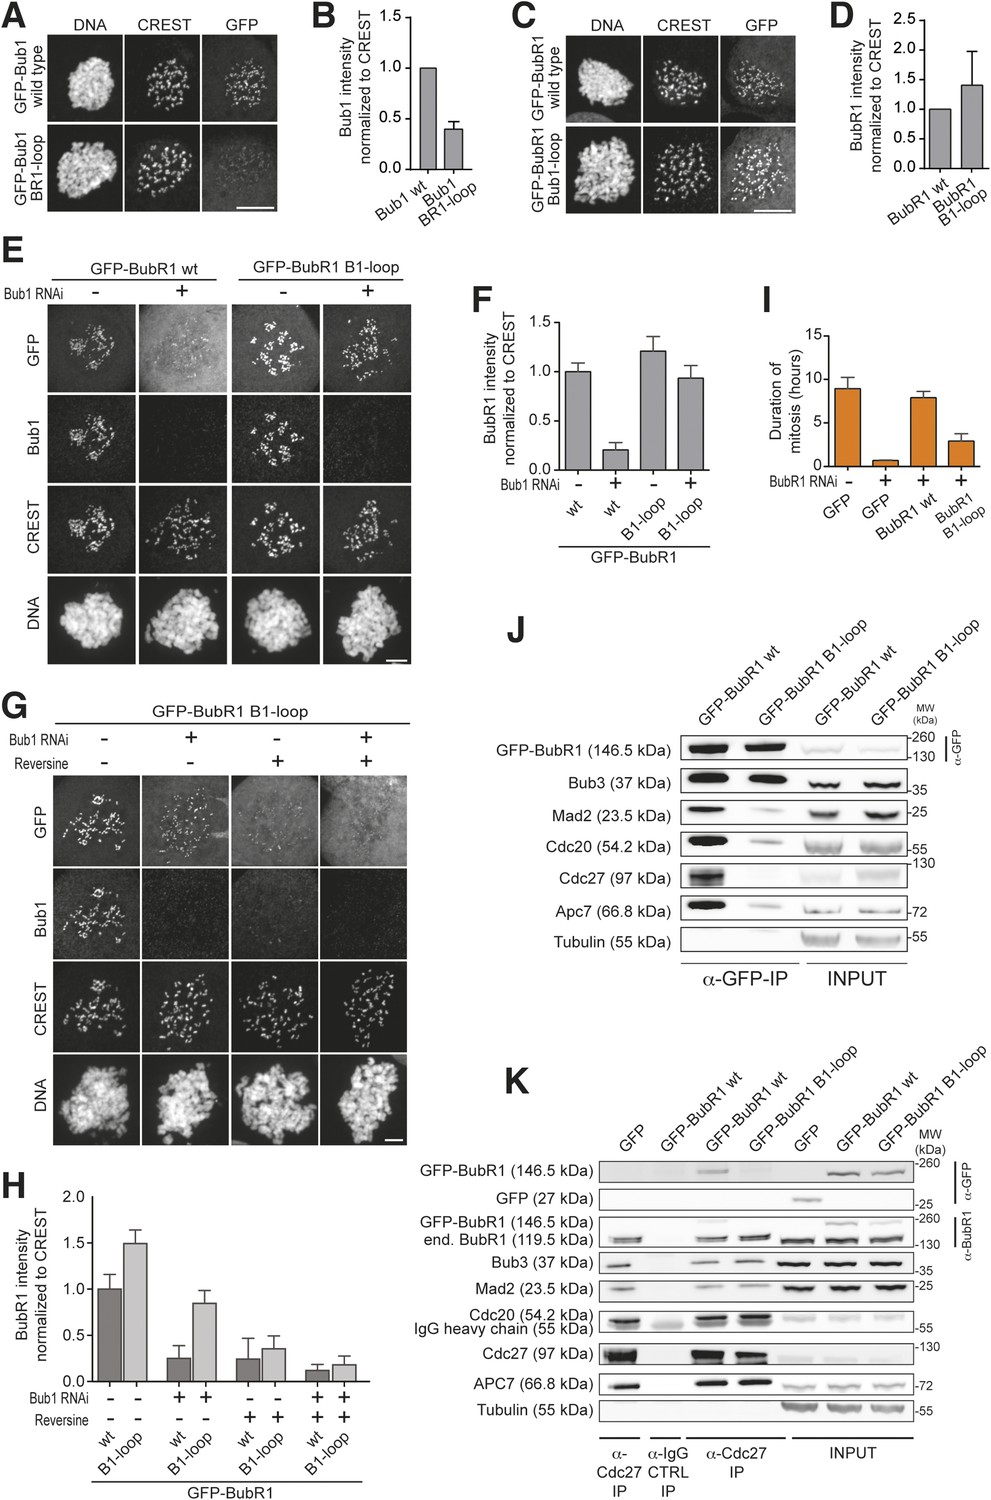
Behavior of the ‘loop swap’ mutants in HeLa cells.
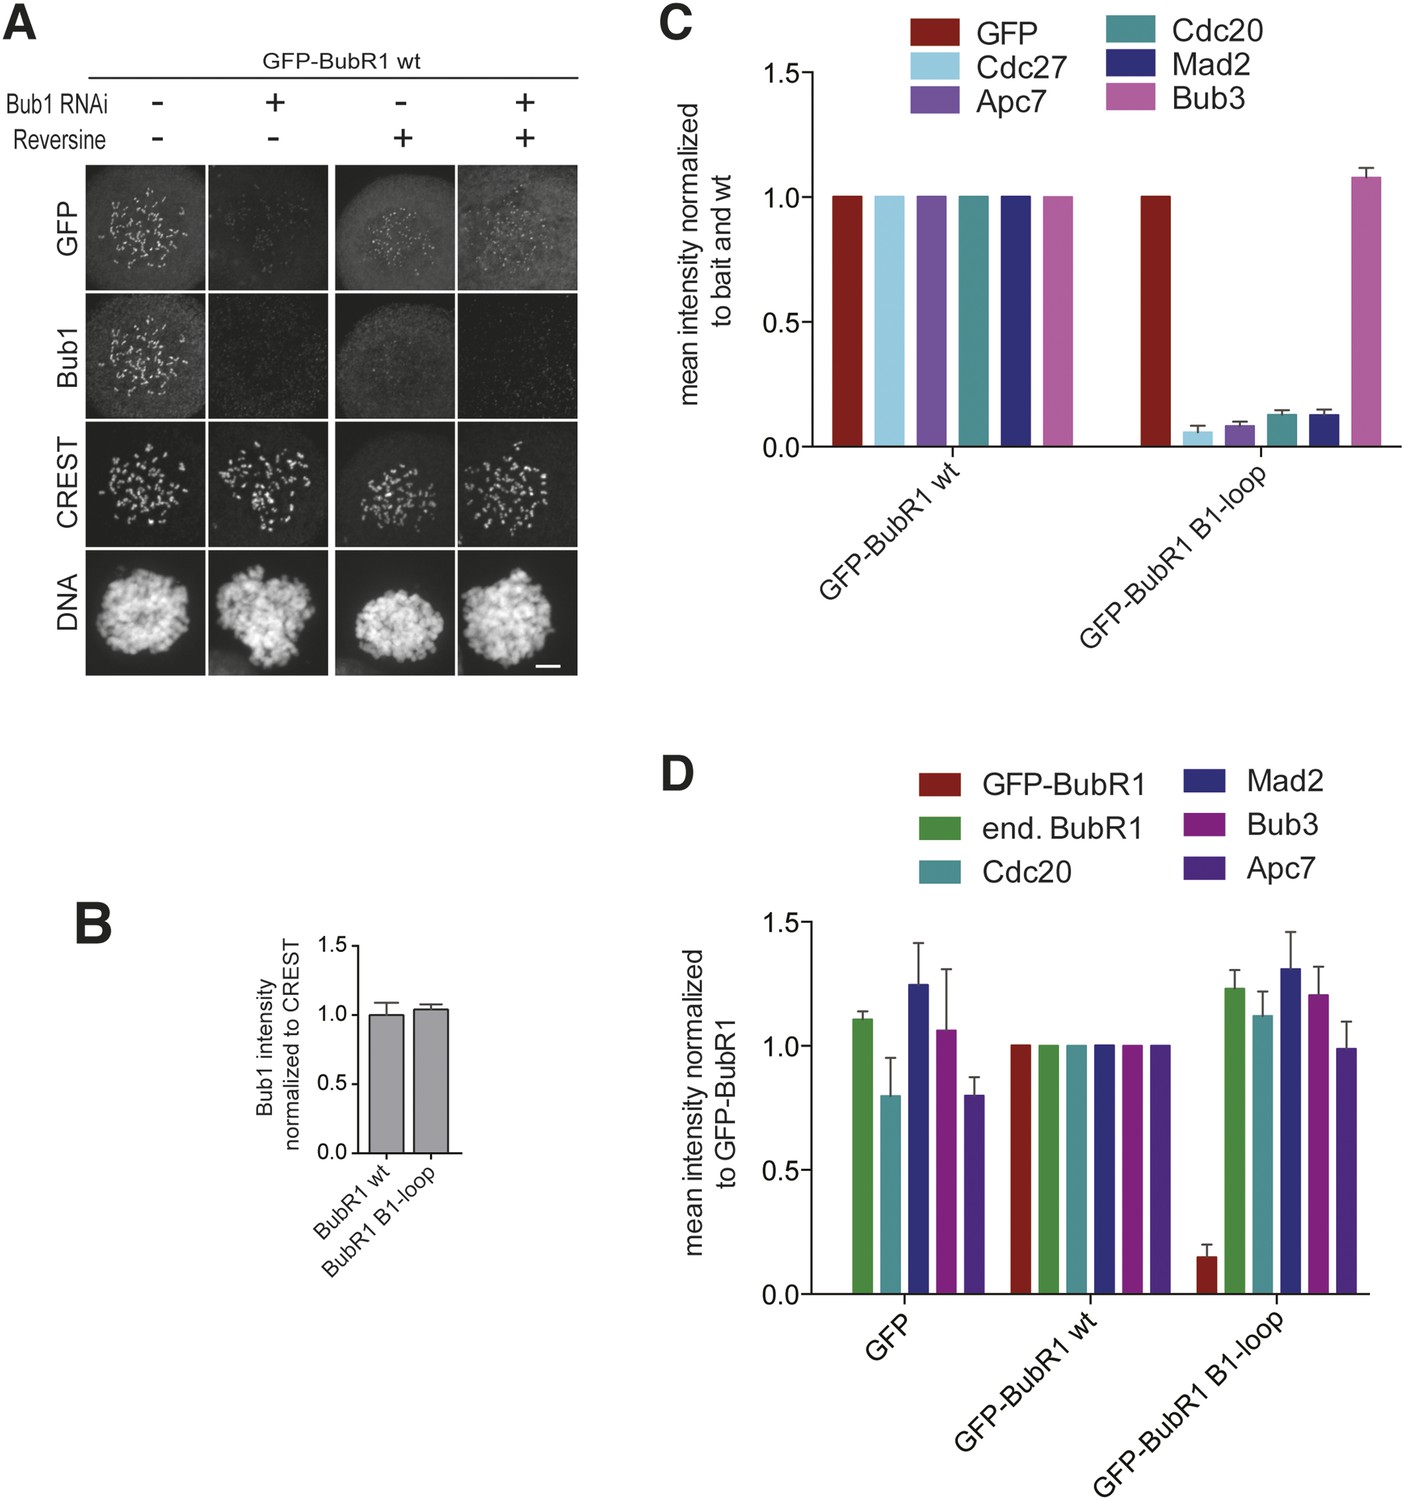
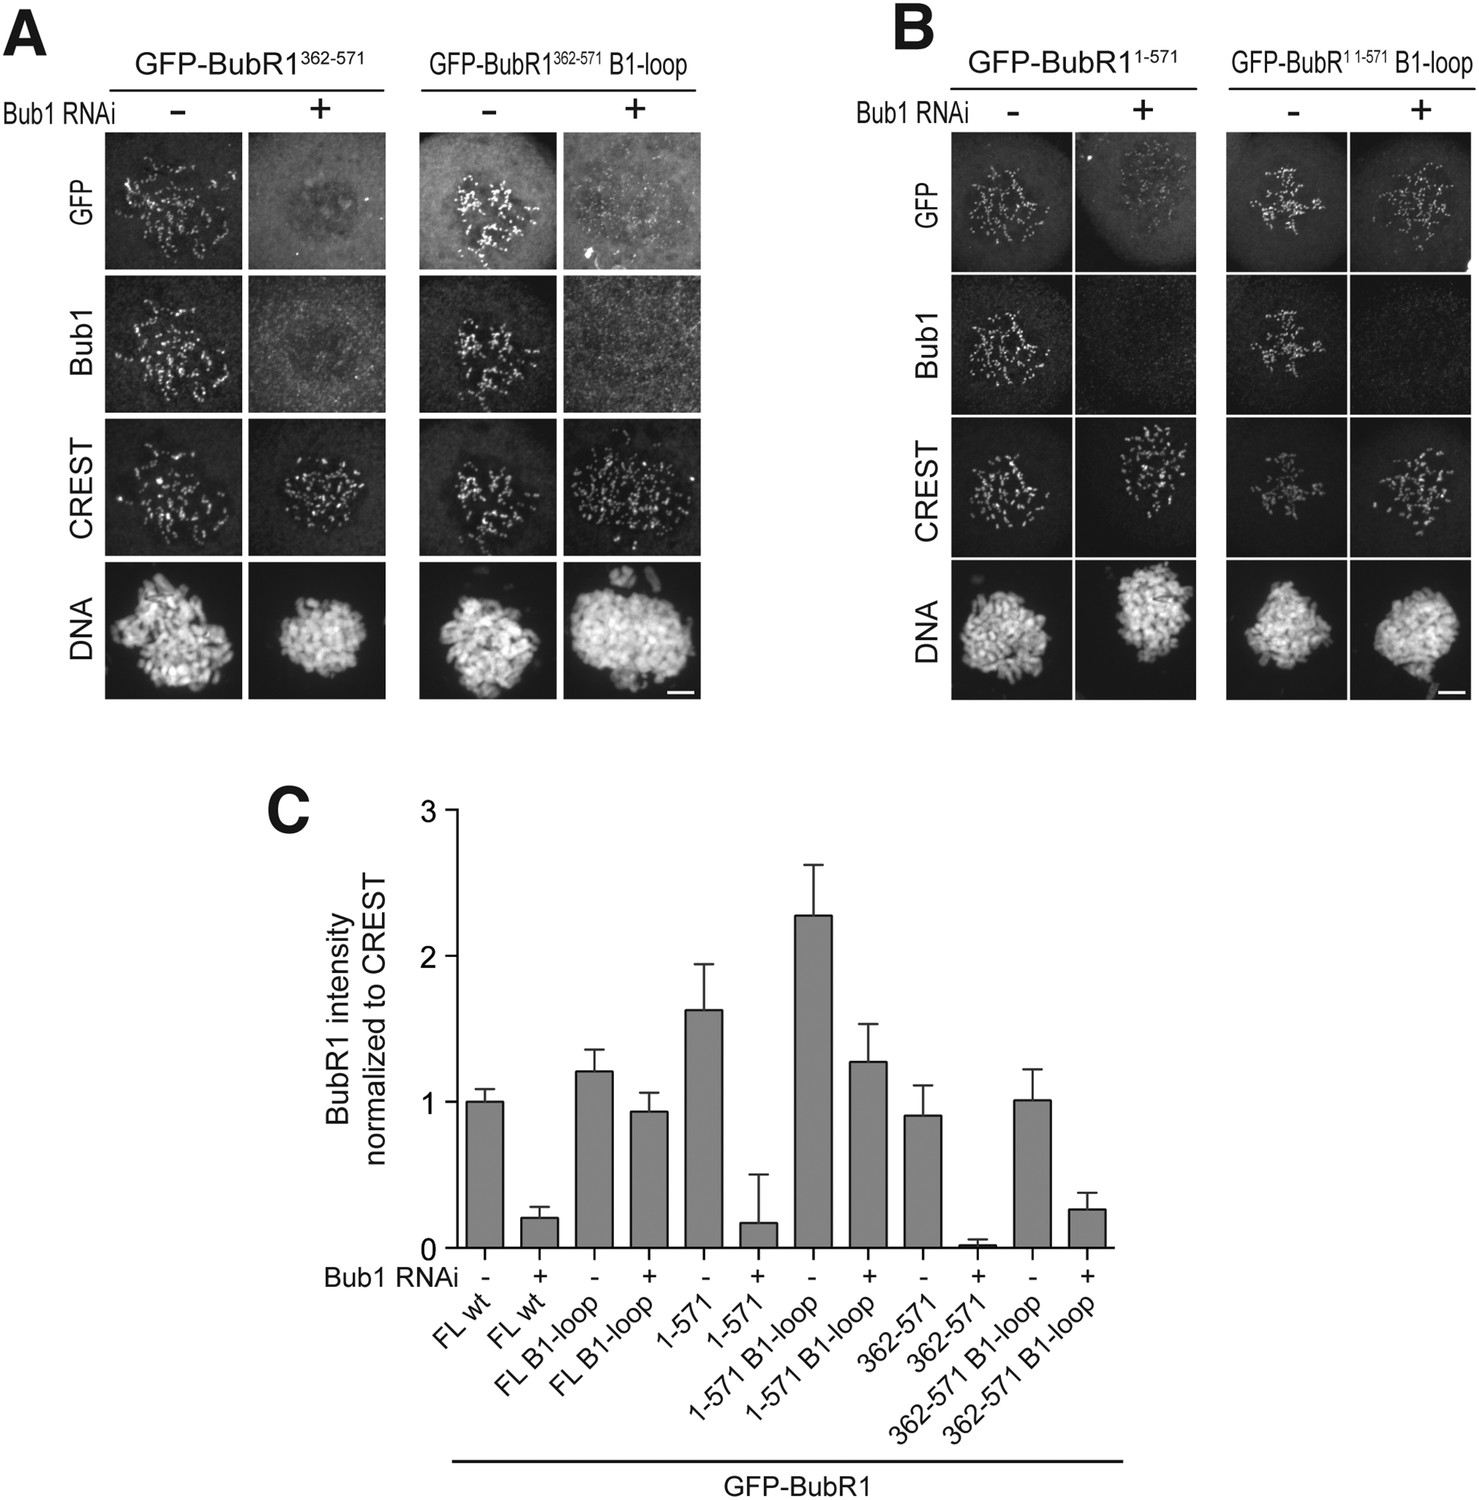
(A) Representative images of stable Flp-In T-REx cells expressing either GFP-Bub1 wild type (wt) or the loop mutant showing that the BR1-loop impairs KT localization. Scale bar: 10 µm. (B) Quantification of Bub1 KT levels in cells treated as in panel A. The graph shows mean intensity from three independent experiments. Error bar represents SEM. Values for Bub1 wt are set to 1. (C) Representative images of stable Flp-In T-REx cells expressing either GFP-BubR1 wt or the loop mutant showing that the B1-loop enhances KT localization. Scale bar: 10 µm. (D) Quantification of BubR1 KT levels in cells treated as in panel C. The graph shows mean intensity from three independent experiments. Error bar represents SEM. Values for BubR1 wt are set to 1. (E) Representative images of HeLa cells transfected with the indicated GFP-BubR1 constructs, showing that BubR1 B1-loop is independent of Bub1 for its KT localization. In brief, after transfection, cells were depleted of endogenous Bub1 by RNAi, synchronized with a double thymidine block and arrested in mitosis with nocodazole. Scale bar: 10 µm. (F) Quantification of BubR1 KT levels in cells treated as in panel E. The graph shows mean intensity from three independent experiments. Error bars represent SEM. Values for BubR1wt in non-depleted cells are set to 1. (G) Representative images of HeLa cells transfected with GFP-BubR1 B1-loop treated as in panel E in the presence (+) or absence (−) of the Mps1 inhibitor Reversine, showing that BubR1 B1-loop KT localization is dependent on Mps1. Scale bar: 10 µm. (H) Quantification of BubR1 KT levels in cells treated as in panel G. The graph shows mean intensity from two independent experiments. Error bars represent SEM. Values for BubR1wt in non-depleted cells without Reversine (images are shown in Figure 3—figure supplement 1, panel A) are set to 1. (I) Mean duration of mitosis of Flp-In T-REx stable cell lines expressing GFP-BubR1 wt or the loop mutant in the absence of endogenous BubR1 and in the presence of 50 nM nocodazole. Cell morphology was used to measure entry into and exit from mitosis by time-lapse-microscopy (n > 58 per cell line) from three independent experiments. Error bars depict SEM. (J) Western Blot of immunoprecipitates (IP) from mitotic Flp-In T-REx cell lines expressing the indicated GFP-BubR1 constructs showing the influence of the loop on the ability to pull down MCC and APC/C components. Tubulin was used as loading control. (K) Western Blot of immunoprecipitates (IP) of the APC/C subunit Cdc27 from mitotic Flp-In T-REx cell lines expressing the indicated GFP-BubR1 constructs showing the influence of the loop on the incorporation into APC/C-bound MCC. Tubulin was used as loading control.
Figure 3—figure supplement 1
Additional characterization of ‘loop swap’ mutants.
(A) Representative images of HeLa cells transfected with GFP-BubR1wt treated as in Figure 3E in the presence (+) or absence (−) of the Mps1 inhibitor Reversine as control for the experiment shown in Figure 3G. The corresponding quantification is shown in Figure 3H. Scale bar: 10 µm. (B) Quantification of Bub1 kinetochore levels in cells treated as in Figure 3E. The graph shows mean intensity from three independent experiments. Error bars represent SEM. Values for Bub1 in BubR1wt expressing cells are set to 1. (C) Quantification of the Western Blot in Figure 3J. The amounts of co-precipitating MCC and APC/C components were normalized to the amount of GFP-BubR1 bait present in the IP. Values for GFP-BubR1 wt are set to 1. The graphs show mean intensity of two independent experiments. Error bars represent SEM. (D) Quantification of the Western Blot in Figure 3K. The amounts of co-precipitating proteins were normalized to the amounts present in GFP-BubR1 wt expressing cells. The graphs show mean intensity of two independent experiments. Error bars represent SEM.
Figure 4 with 3 supplements
A minimal BubR1-binding region of Bub1.
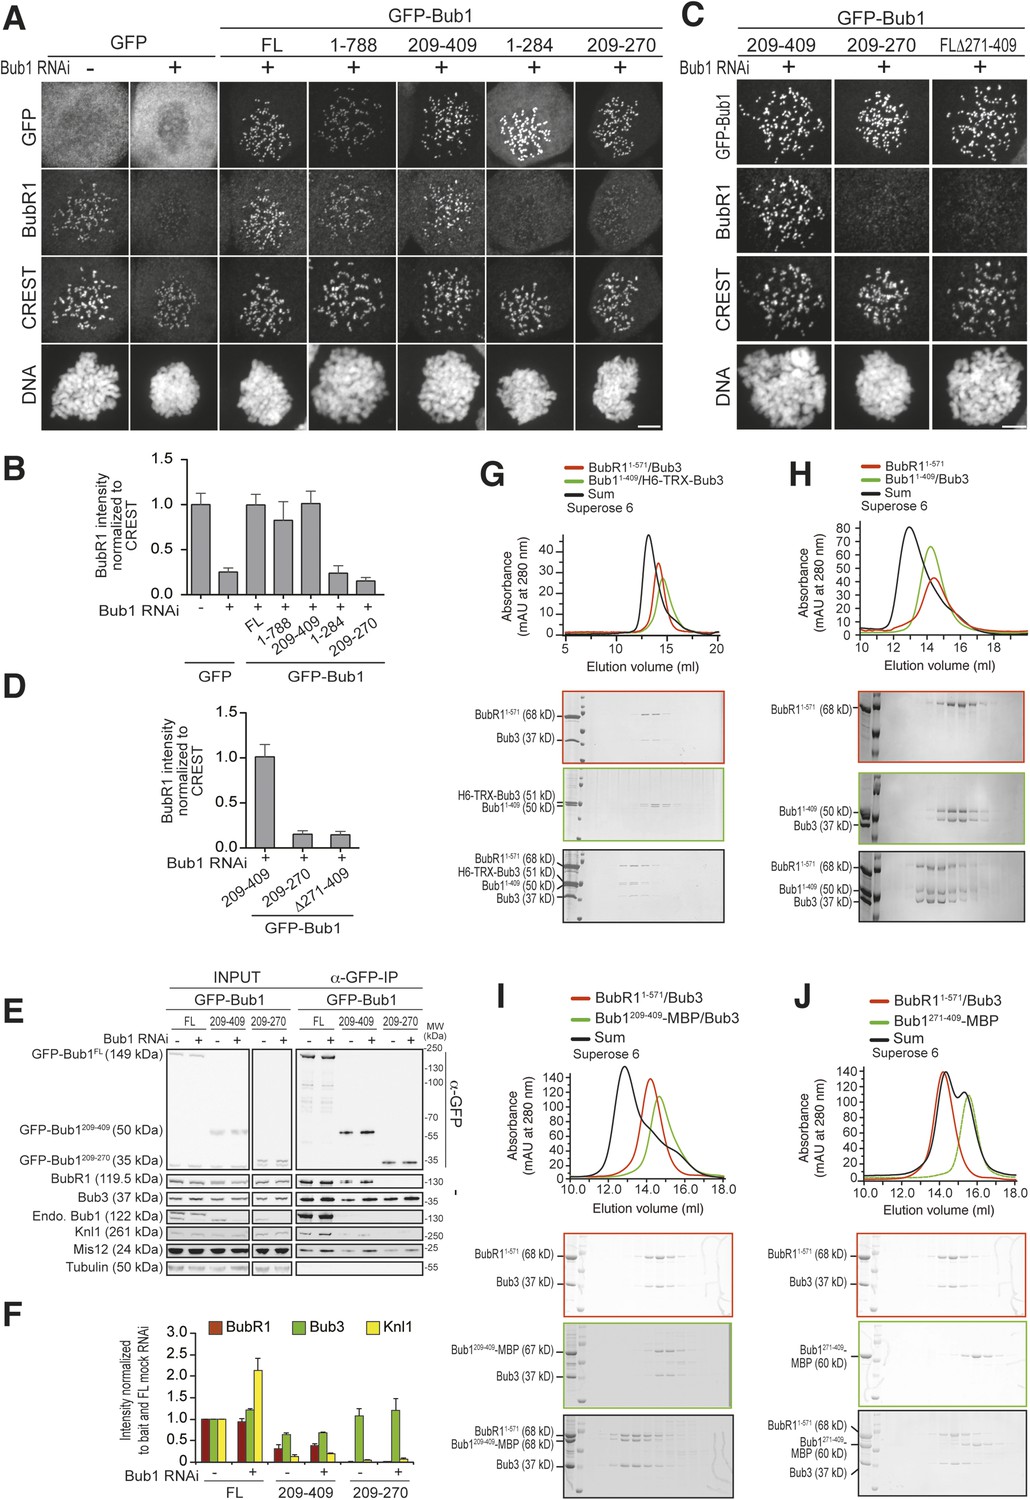
(A and C) Representative images of stable Flp-In T-REx cell lines expressing the indicated GFP-Bub1 constructs after treatment with nocodazole, showing that Bub1209–409 is sufficient to recruit BubR1 (panel A) and that residues 271–409 are essential for this function (panel C). Scale bar: 10 µm. (B and D) Quantification of BubR1 KT levels in cells treated as in panels B and D, respectively. The graphs show mean intensity of two independent experiments, the error bars indicate SEM. The mean value for non-depleted cells expressing GFP (panel B) or GFP-Bub1209–409 (panel D) is set to 1. (E) Western blot of immunoprecipitates (IP) from mitotic Flp-In T-REx cell lysates expressing the indicated GFP-Bub1 constructs in the presence or absence of endogenous Bub1, showing that Bub1209–409 is sufficient to pull down BubR1. Tubulin was used as loading control. (F) Quantification of the Western blot in panel E. The amounts of co-precipitating BubR1, Bub3, and Knl1 were normalized to the amount of GFP-Bub1 bait present in the IP. Values for GFP-Bub1 FL in non-depleted cells are set to 1. The graph shows mean intensity of two independent experiments. Error bars represent SD. (G) BubR11–571/Bub3 and Bub11–409/Bub3 interact in size exclusion chromatography, which separates proteins based on size and shape. H6 and TRX are tags used for protein purification and expression. (H) BubR11–571 and Bub11–409/Bub3 interact in size exclusion chromatography. (I) BubR11–571/Bub3 and Bub1209–409/Bub3 interact in size exclusion chromatography. (J) BubR11–571/Bub3 and Bub1271–409 do not interact in size exclusion chromatography. MBP—maltose binding protein, mAu—milliabsorbance unit.
Figure 4—figure supplement 1
Additional chromatographic experiments.
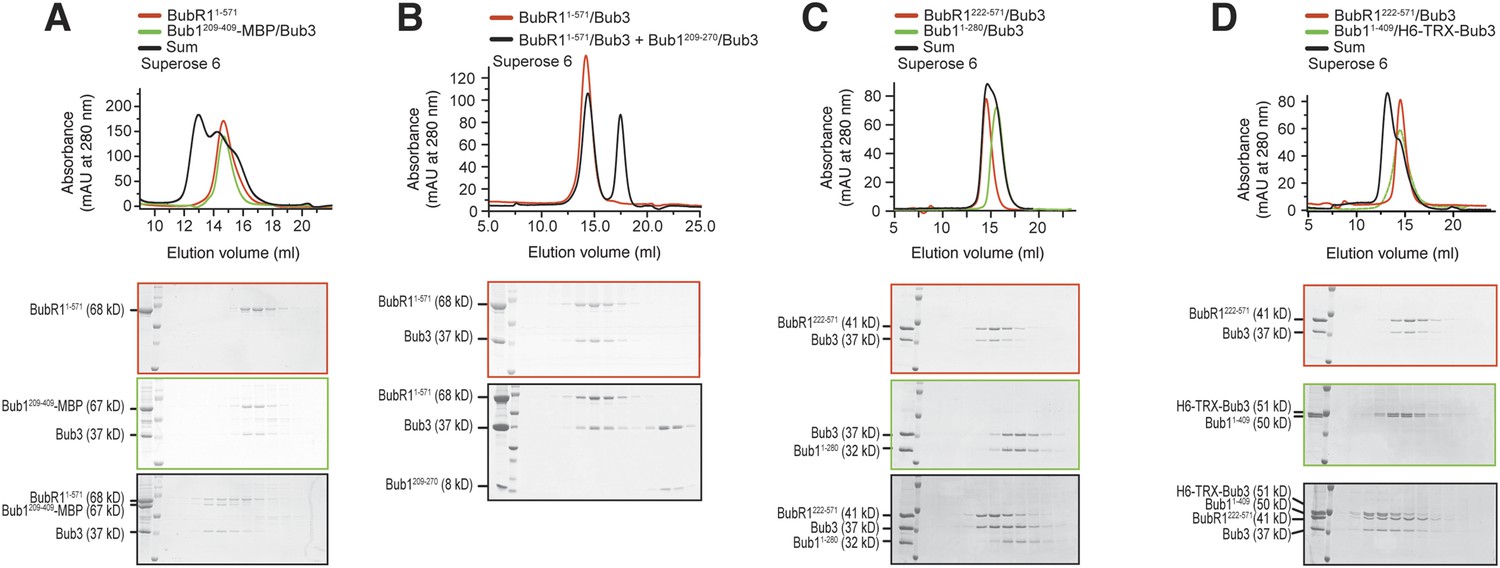
(A) BubR11–571 and Bub1209–409/Bub3 interact in size exclusion chromatography. (B) BubR11–571/Bub3 and Bub1209–270/Bub3 do not interact in size exclusion chromatography. The control run of Bub1209–270/Bub3 is missing due to limiting amounts of the protein. (C) BubR1222–571/Bub3 and Bub11–280/Bub3 do not interact in size exclusion chromatography. (D) BubR1222–571/Bub3 and Bub11–409/Bub3 interact in size exclusion chromatography. mAU—milliabsorbance unit.
Figure 4—figure supplement 2
The TPR domain of Bub1 influences KT binding affinity in addition to the loop region.
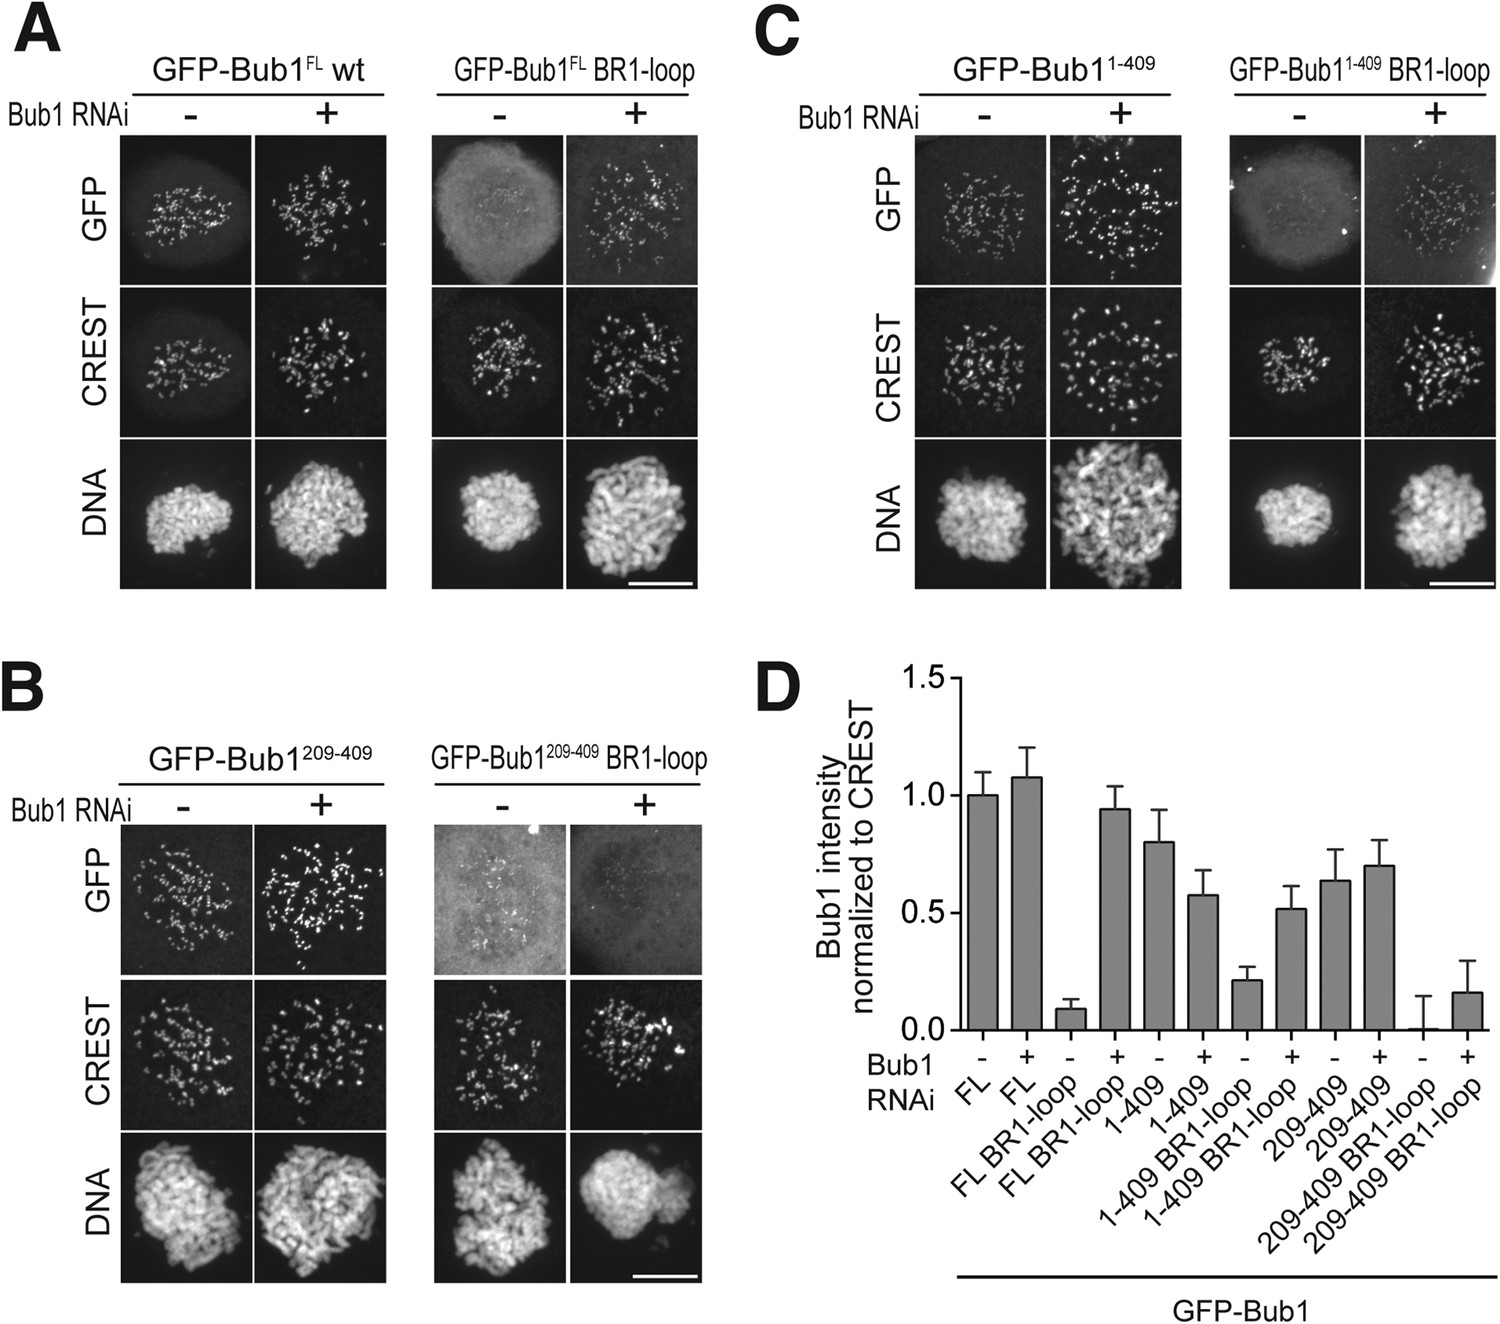
(A) Representative images of HeLa cells transfected with the indicated GFP-Bub1FL constructs, showing that the BR1-loop impairs KT localization. However in the absence of endogenous Bub1 considerable binding affinity is regained. Cells were treated as described in Figure 3E. Scale bar: 10 µm. (B) Representative images of HeLa cells transfected with the indicated GFP-Bub1209–409 constructs, showing that this construct, which lacks the N-terminal TPR domain, does not regain considerable binding affinity in the absence of Bub1. Cells were treated as described in Figure 3E. Scale bar: 10 µm. (C) Representative images of HeLa cells transfected with the indicated GFP-Bub11–409 constructs, showing that the TPR domain is contributing to regaining KT binding affinity in the absence of endogenous Bub1. Cells were treated as described in Figure 3E. Scale bar: 10 µm. (D) Quantification of Bub1 KT levels in cells treated as in panels A–C. The graph shows mean intensity from two independent experiments. Error bars represent SEM. Values for Bub1FL in non-depleted cells were set to 1.
Figure 4—figure supplement 3
The TPR domain of BubR1 influences kinetochore binding affinity in addition to the loop region.
(A) Representative images of HeLa cells transfected with the indicated GFP-BubR1362–571 constructs, showing that the B1-loop enhances kinetochore localization. However in the absence of endogenous Bub1 the short loop mutant, which lacks the N-terminal TPR domain, is less efficient than the full-length BubR1 in its localization to kinetochores (Figure 3E). Cells were treated as described in Figure 3E. Scale bar: 10 µm. (B) Representative images of HeLa cells transfected with the indicated GFP-BubR11–571 constructs, showing that the TPR domain is contributing together with the loop region to the ability to stay at KTs in the absence of endogenous Bub1. Cells were treated as described in Figure 3E. Scale bar: 10 µm. (C) Quantification of BubR1 KT levels in cells treated as in (A–B). The graph shows mean intensity from at least two independent experiments. Error bars represent SEM. Values for BubR1FL in non-depleted cells are set to 1.
Figure 5
A minimal Bub1-binding region of BubR1.
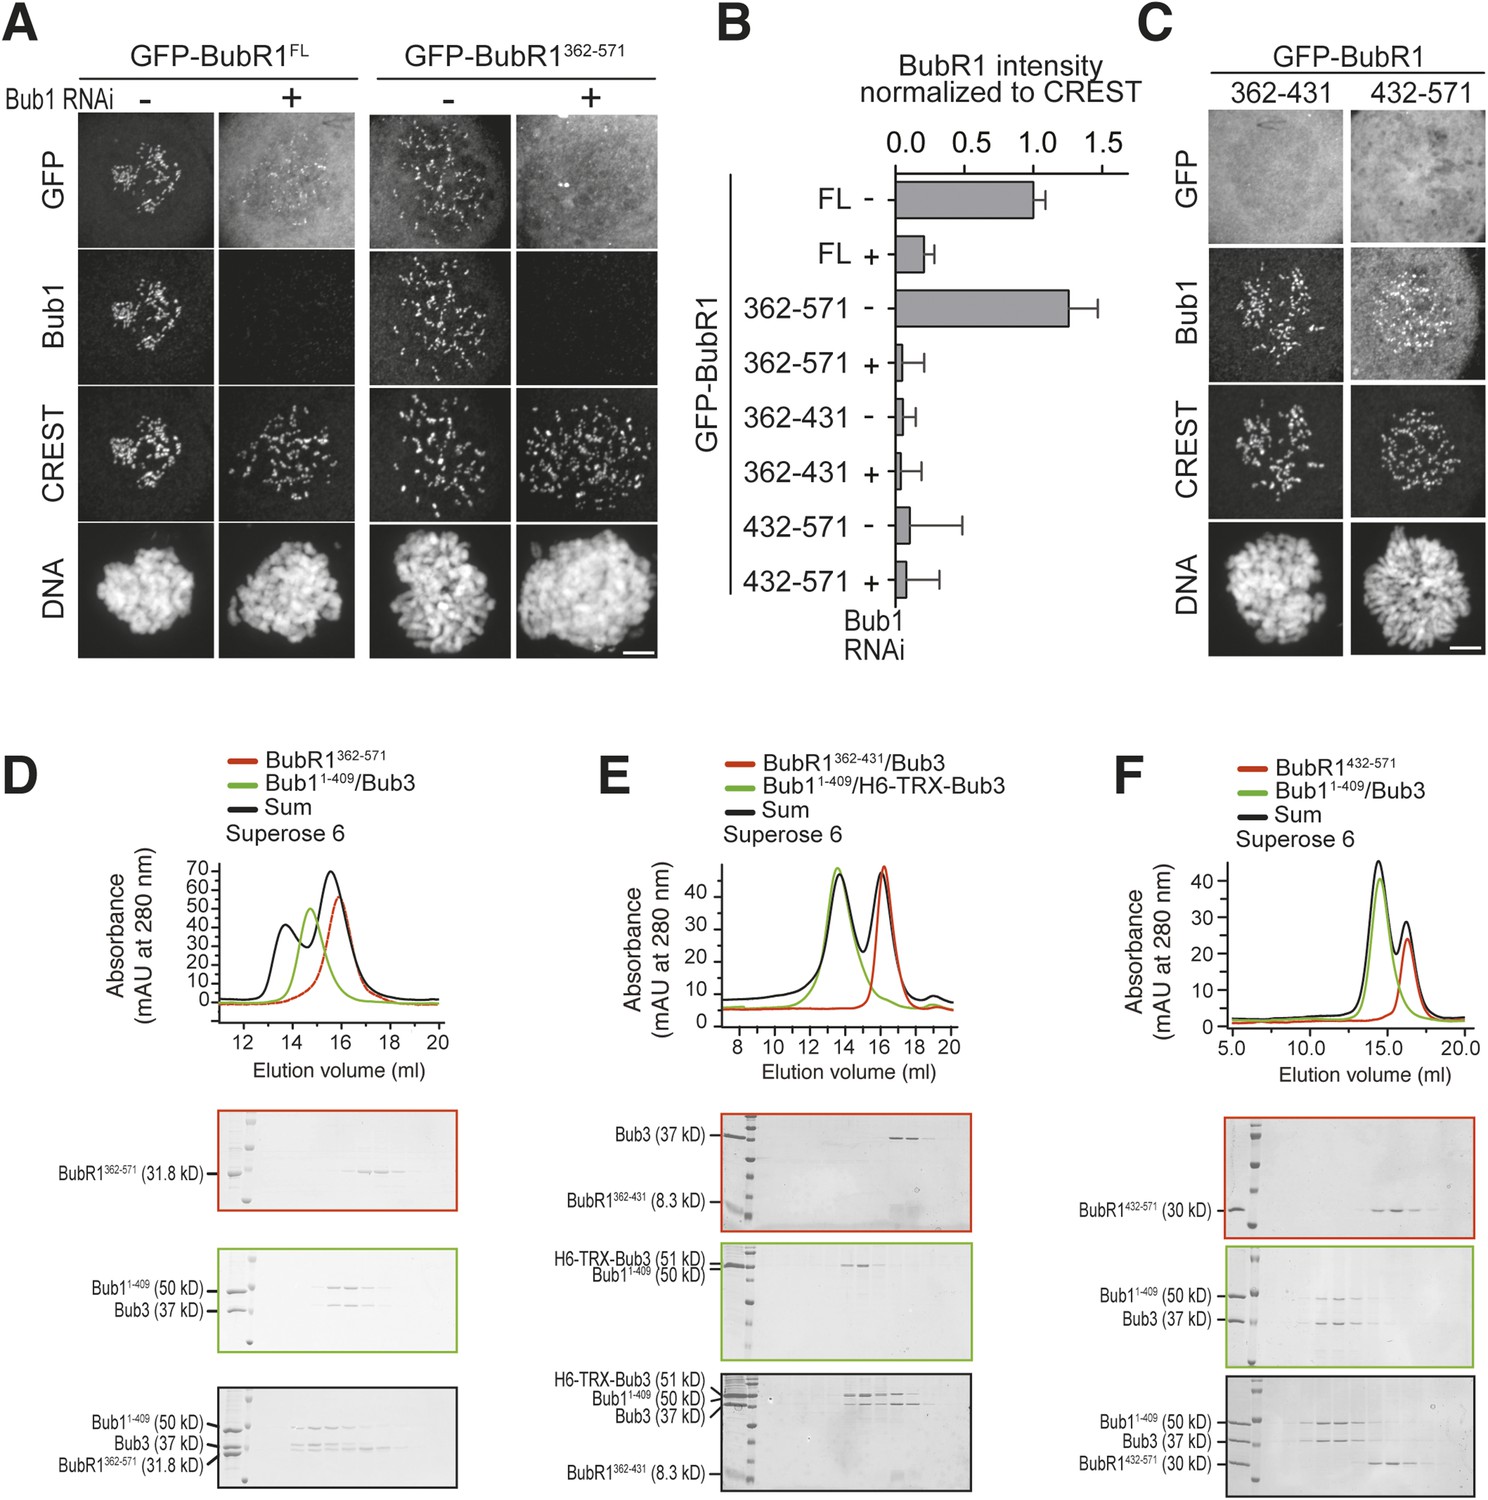
(A and C) Representative images of HeLa cells transfected with the indicated GFP-BubR1 constructs. Cells were treated as described in Figure 3E. BubR1362–571 is the minimal construct that is able to localize to KTs in the presence of Bub1. Scale bar: 10 µm. (B) Quantification of BubR1 KT levels in cells treated as in panels A and C. The graph shows mean intensity of at least two independent experiments, error bars depict SEM. Values for GFP-BubR1 FL in non-depleted cells are set to 1. (D) BubR1362–571 and Bub11–409/Bub3 interact in size exclusion chromatography. (E) BubR1362–431/Bub3 and Bub11–409/Bub3 do not interact in size exclusion chromatography. (F) BubR1432–571 and Bub11–409/Bub3 do not interact in size exclusion chromatography. mAU—milliabsorbance unit.
Figure 6 with 1 supplement
A pseudo-symmetric Bub1–BubR1 interaction.
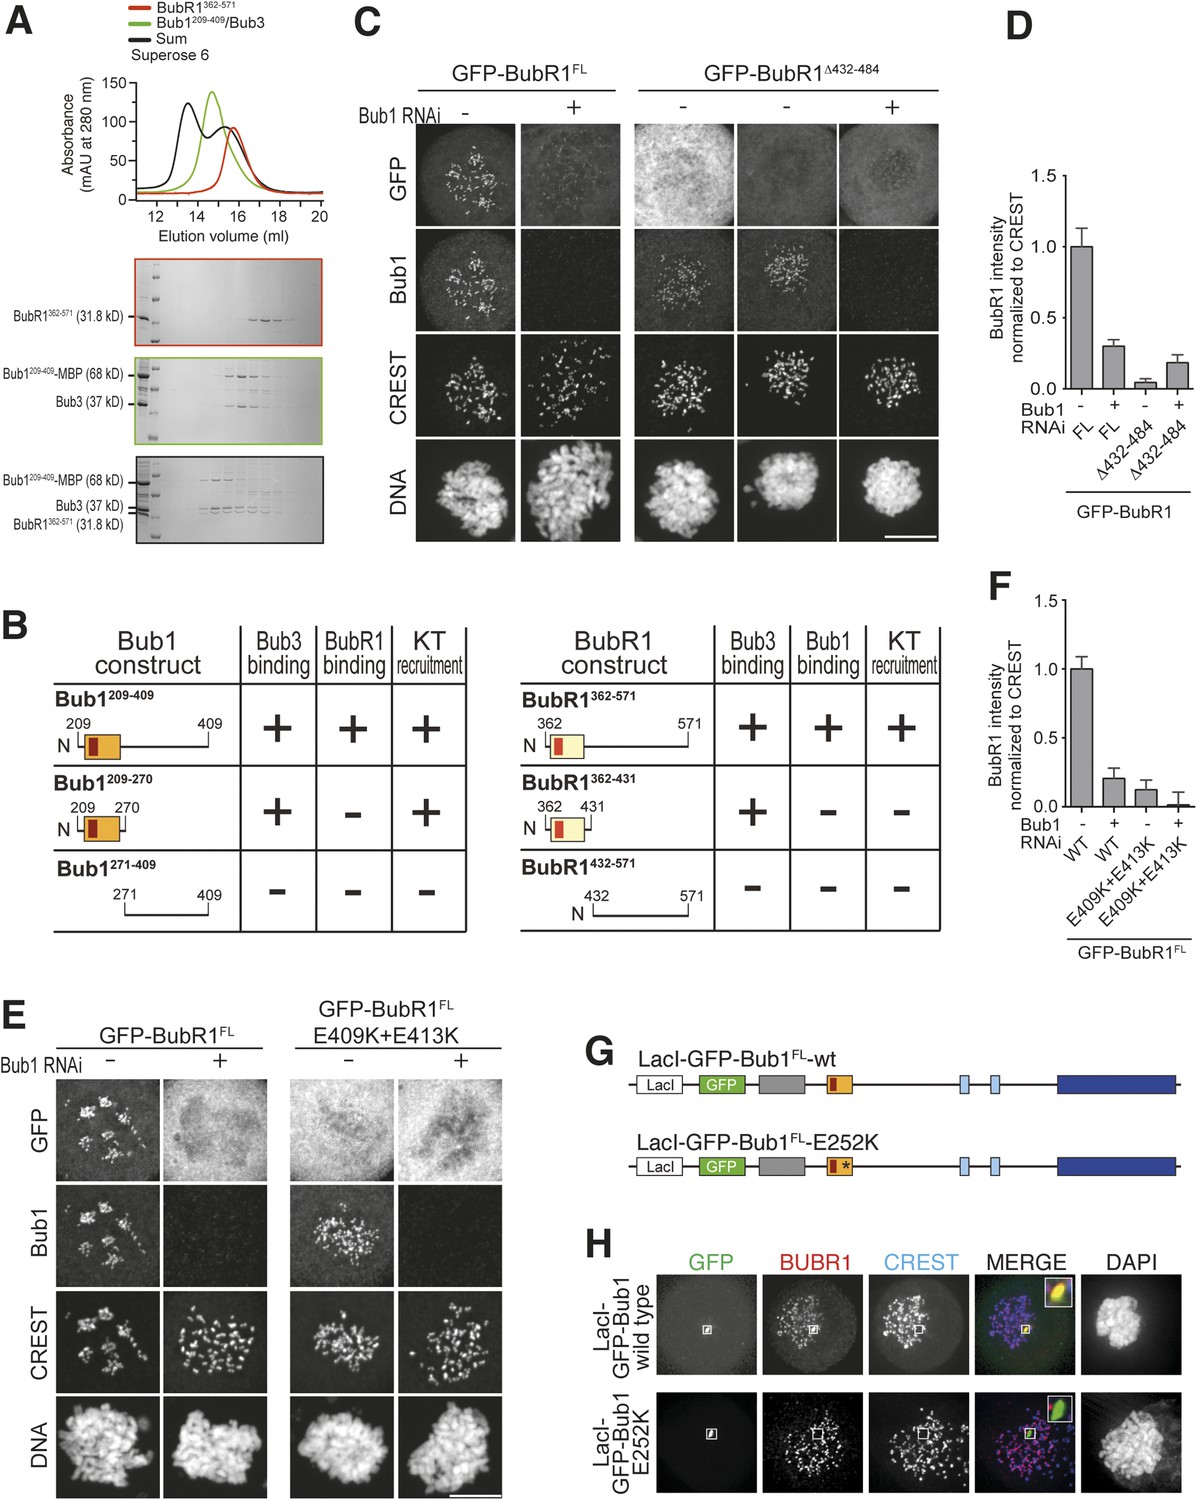
(A) The identified minimal constructs BubR1362–571 and Bub1209–409/Bub3 interact in size exclusion chromatography. (B) Summary of the behavior of the indicated Bub1 and BubR1 constructs. (C and E) Representative images of HeLa cells transfected with the indicated GFP-BubR1 constructs showing that neither BubR1Δ432–484 (panel C), which lacks the predicted helical segment of the C-terminal extension, nor BubR1E409K+E413K (panel E), which is not able to bind Bub3, are able to localize to KTs. Cells were treated as in Figure 3E. For BubR1Δ432–484 two different expression levels are depicted in the non-depleted condition. Scale bar: 10 µm. (D and F) Quantification of BubR1 KT levels in cells treated as in panels C and E, respectively. The graph shows mean intensity from at least two independent experiments. Error bars represent SEM. Values for BubR1FL in non-depleted cells are set to 1. (G) Domain organization of LacI-GFP-Bub1 constructs. (H) LacI-Bub1wt recruits BubR1 to the Lac-Operator, whereas Bub1E252K, which cannot bind Bub3, does not.
Figure 6—figure supplement 1
Alignment of the Bub1 and BubR1 interaction domains.
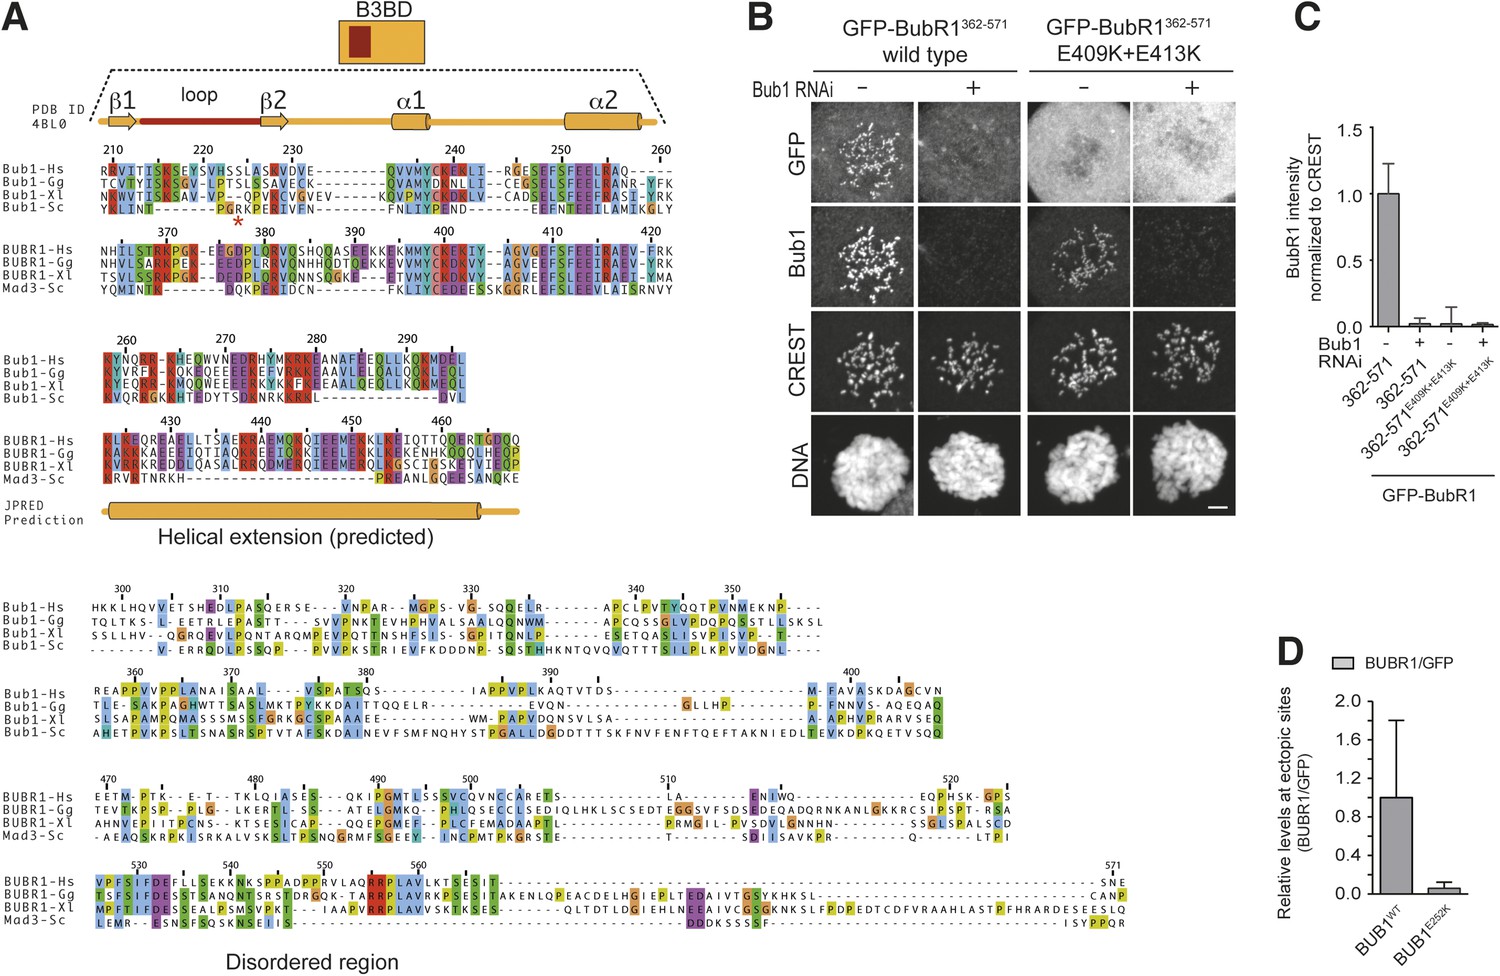
(A) Multiple sequence alignments of the interacting domains of Bub1 and BubR1 from four different species (Homo sapiens, Hs), chicken (Gallus gallus, Gg), frog (Xenopus laevis, Xl), and budding yeast (Saccharomyces cerevisiae, Sc). Mad3 is the budding yeast BubR1 homolog. (B) Representative images of HeLa cells transfected with the indicated GFP-BubR1 constructs, showing that also the short Bub3 binding domain mutant is not able to localize to KTs. Cells were treated as described in Figure 3E. Scale bar: 10 µm. (C) Quantification of BubR1 KT levels in cells treated as in panel B. The graph shows mean intensity from two independent experiments. Error bars represent SEM. Values for BubR1362–571 in non-depleted cells are set to 1. (D) Quantification of co-localization. Data represent normalized mean intensities and standard deviations from 12 cells. BubR1 was identified at the ectopic locus on 12/12 cells for the wild type and on 0/12 cells for the E252K mutant.
Figure 7
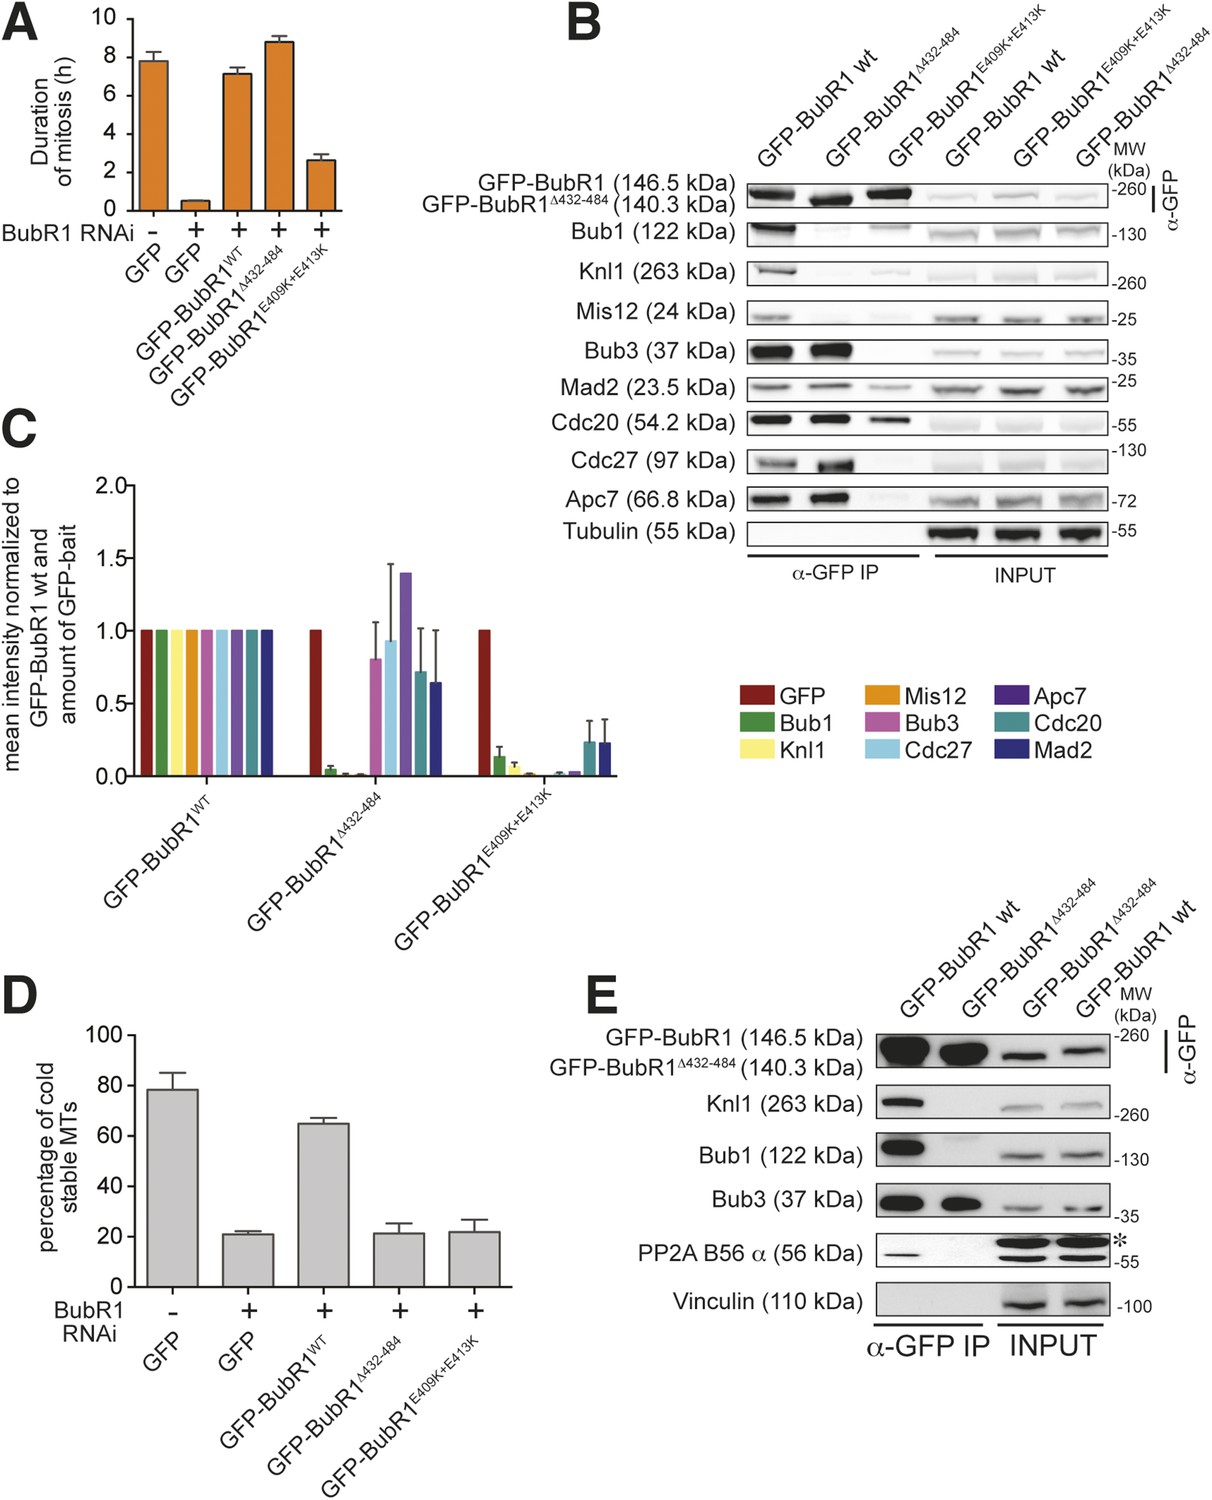
Functional characterization of BubR1 mutants.
(A) Mean duration of mitosis of Flp-In T-REx stable cell lines expressing GFP-BubR1 wt or the indicated mutants in the absence of endogenous BubR1 and in the presence of 50 nM nocodazole. Cell morphology was used to measure entry into and exit from mitosis by time-lapse-microscopy (n > 44 per cell line per experiment) from at least three independent experiments. Error bars depict SEM. (B) Western blot of immunoprecipitates (IP) from mitotic Flp-In T-REx cell lines expressing the indicated GFP-BubR1 constructs. Tubulin was used as loading control. (C) Quantification of the Western Blot in Figure 7B. The amounts of co-precipitating proteins were normalized to the amount of GFP-BubR1 bait present in the IP. Values for GFP-BubR1 wt are set to 1. The graphs show mean intensity of two independent experiments. Error bars represent SEM. (D) Analysis of cold-stable microtubules in cells expressing the indicated GFP-BubR1 constructs. (E) Western Blot of immunoprecipitates (IP) from mitotic Flp-In T-REx cell lines expressing the indicated GFP-BubR1 constructs. The asterisk represents an unspecific band recognized by the PP2A antibody.
Figure 8
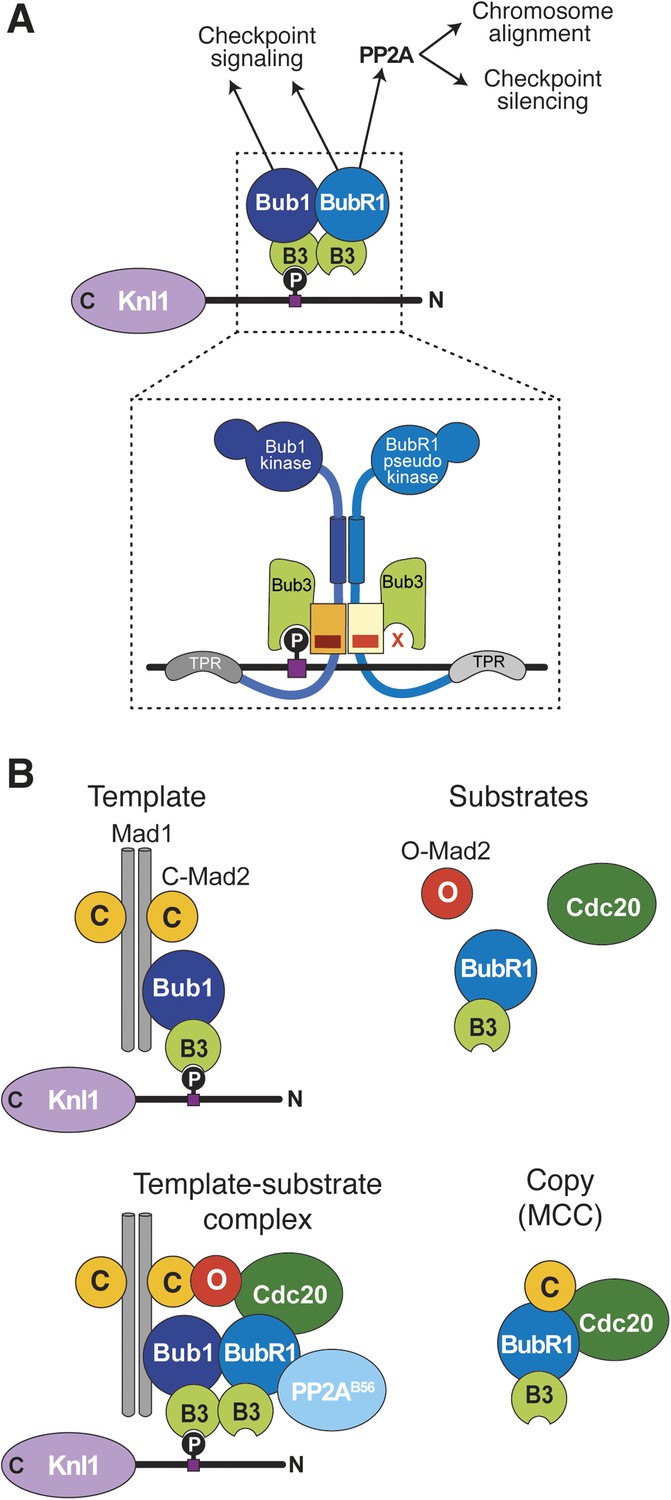
Extension of the template model.
(A) Model of the Bub1–BubR1 interaction. The upper part shows the described KT recruitment mechanism of BubR1/Bub3, which in turn recruits the phosphatase PP2A, to a Bub1/Bub3 complex on Knl1. The lower part depicts a close-up of the identified pseudo-symmetric Bub1–BubR1 interaction, which involves equivalent segments of Bub1 and BubR1 comprising the Bub3 binding domain and a C-terminal extension whose first part is predicted to have a helical fold in both proteins. The presence of Bub3 on both proteins seems to be essential for this interaction, although due to different reasons (for more explanations see text). The TPR regions of human Bub1 and BubR1 bind to non-conserved short motifs of Knl1 named KI1 and KI2, respectively (Kiyomitsu et al., 2007; Krenn et al., 2012, 2014). (B) Extension of the template model. Mad1/C-Mad2 at KTs is known to act as a template for the establishment of the Cdc20/C–Mad2 interaction. This seems similar to the BubR1 recruitment mechanism, wherein Bub1/Bub3 recruits BubR1/Bub3 through a pseudo-symmetric interaction. Ultimately, the entire MCC (BubR1/Bub3 and Cdc20/C-Mad2) may represent the copy of a KT template consisting of Bub1/Bub3 and Mad1/C-Mad2.
Author response image 1
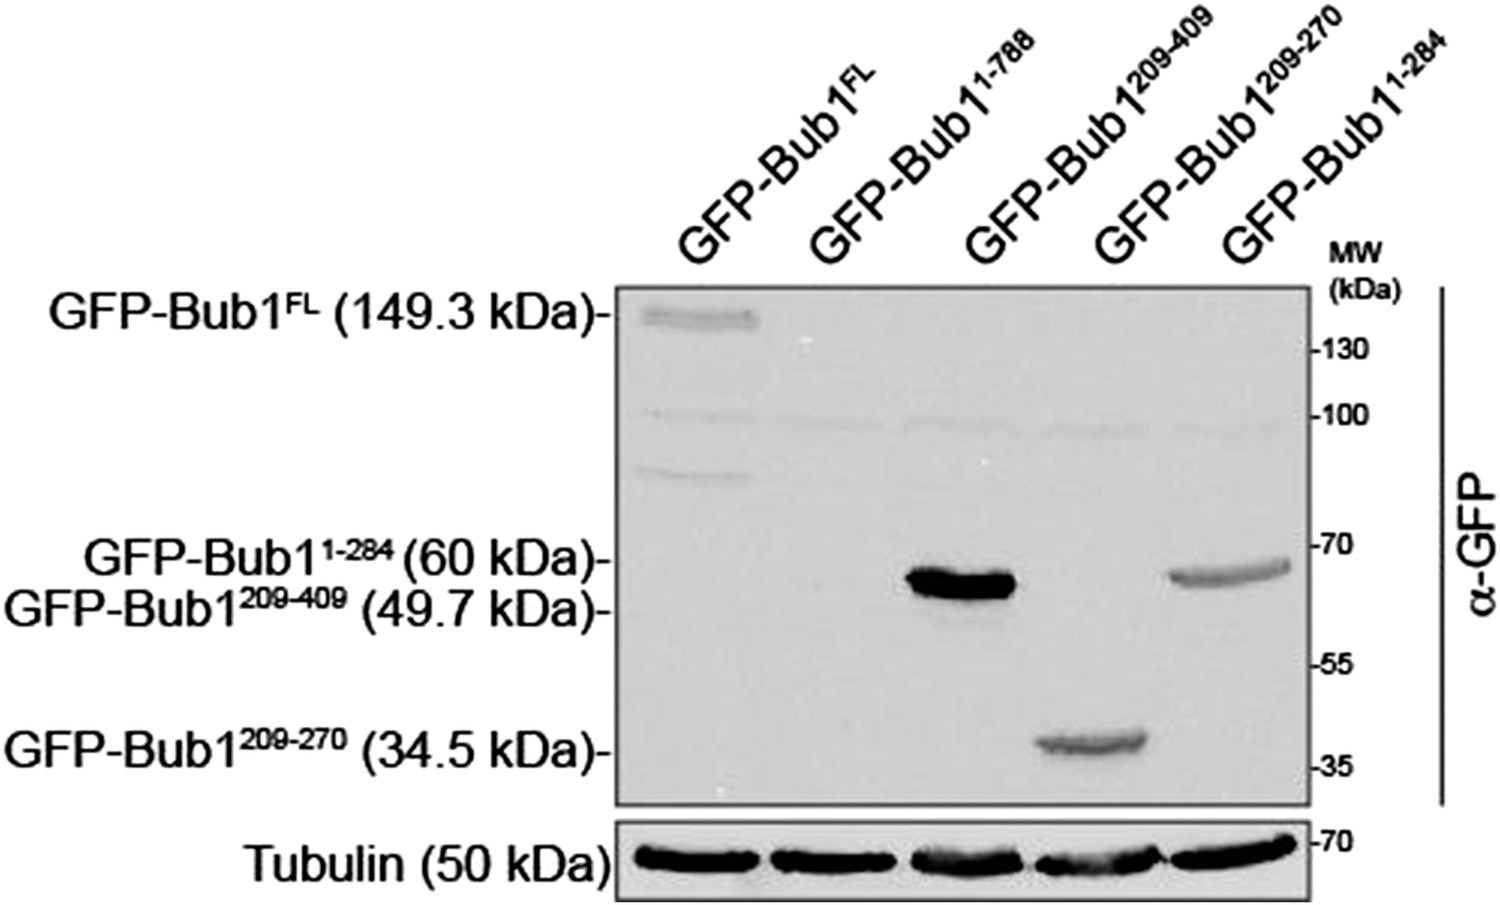
anti-GFP Western expression levels of GFP-Bub1 constructs
Download links
A two-part list of links to download the article, or parts of the article, in various formats.
Downloads (link to download the article as PDF)
Open citations (links to open the citations from this article in various online reference manager services)
Cite this article (links to download the citations from this article in formats compatible with various reference manager tools)
A molecular basis for the differential roles of Bub1 and BubR1 in the spindle assembly checkpoint
eLife 4:e05269.
https://doi.org/10.7554/eLife.05269


