Constraint and divergence of global gene expression in the mammalian embryo
- Stanford University School of Medicine, United States
- Stanford University, United States
Figures
Figure 1
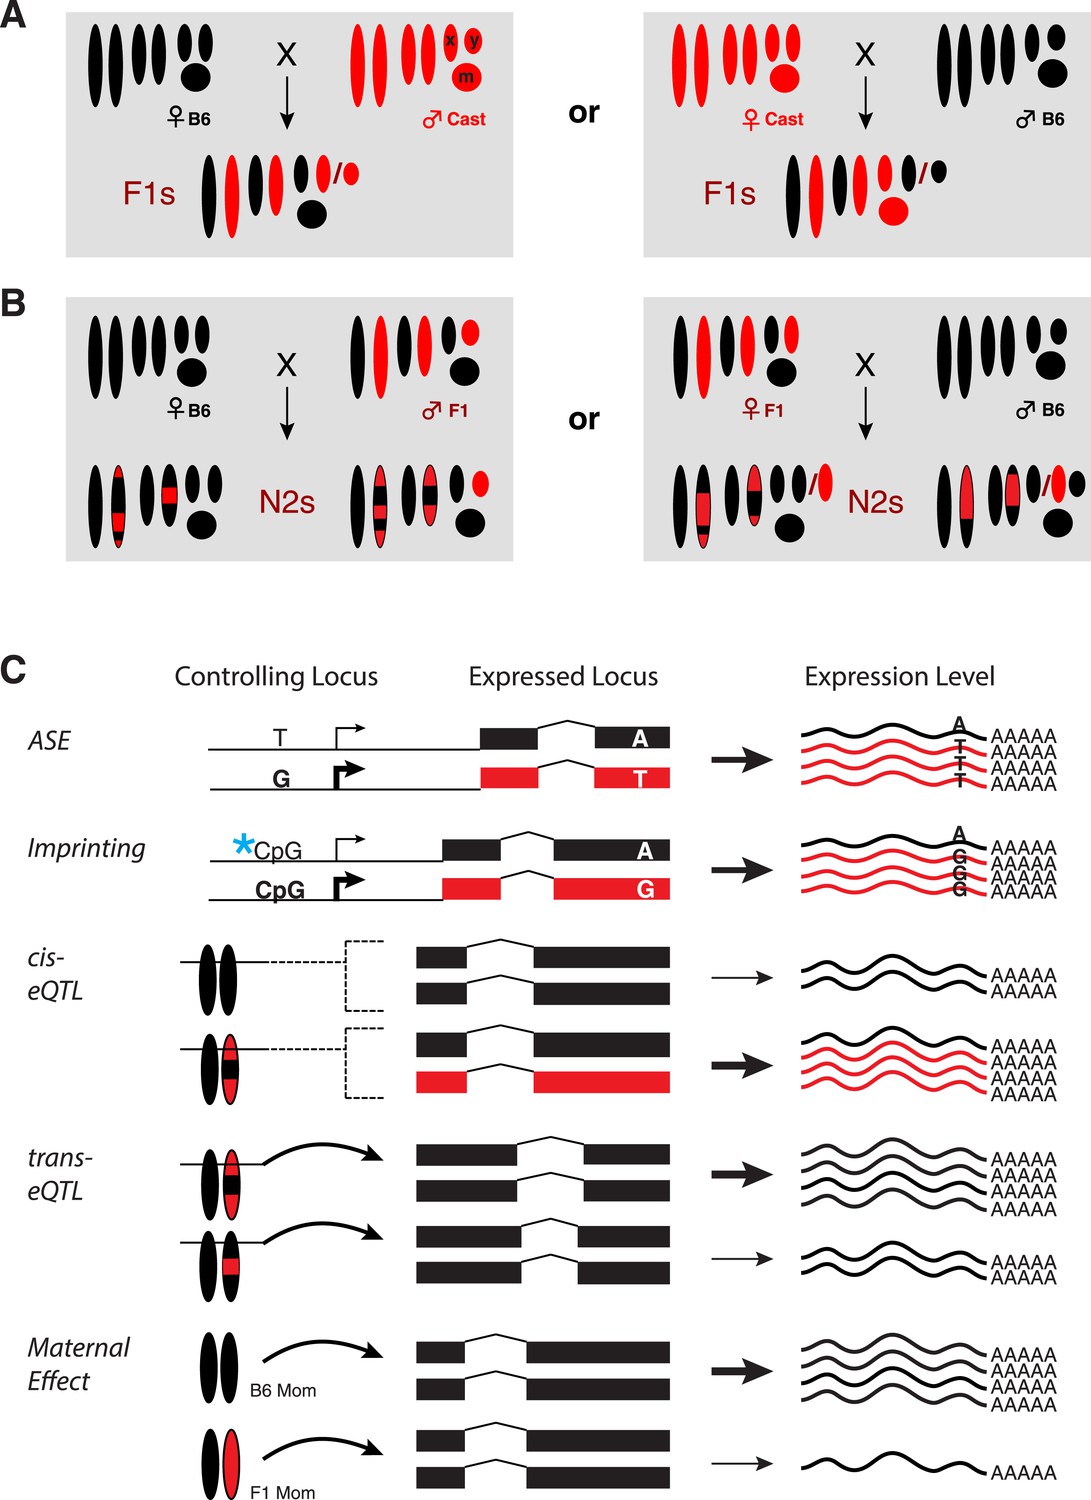
Experimental design.
(A) Reciprocal crosses of B6 and Cast parents were used to generate F1 hybrid embryos. (B) F1 hybrid adults were backcrossed to B6 to generate N2 embryos via reciprocal crosses of B6 females with F1 males and F1 females with B6 males. Chromosomal regions inherited from a B6 parent are black and Cast regions are red. (C) Example genotypes at a controlling genetic locus, its corresponding target gene, and resulting gene expression levels for different types of gene regulatory variation assayed. Allele-specific expression (ASE) and imprinting are measured by allele-specific read counts, whereas other types measure total gene expression levels. X: X chromosome; Y: Y chromosome; m: mitochondrial DNA.
Figure 2 with 3 supplements
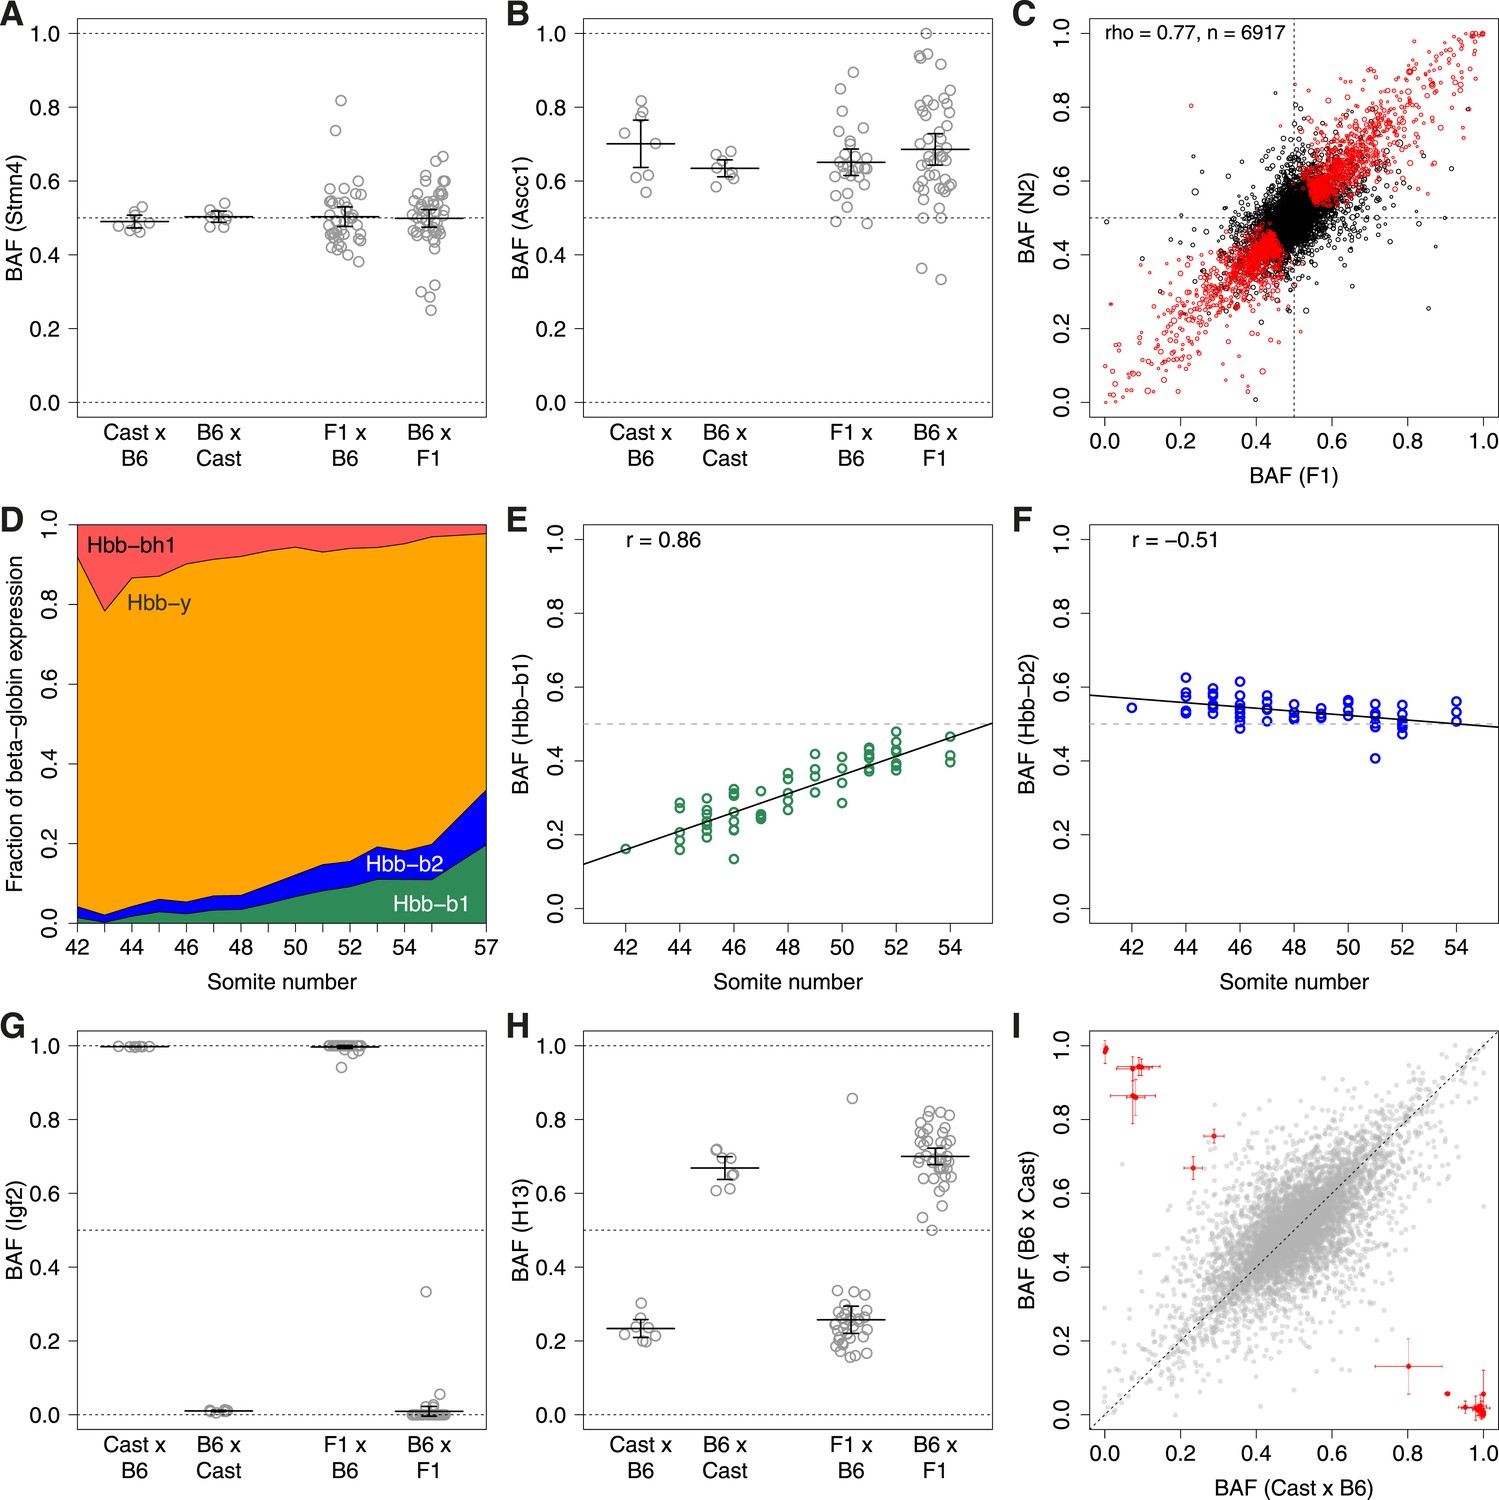
ASE.
B6 allele fraction (BAF) for (A) non-ASE gene Stmn4, (B) ASE gene Ascc1. Each point represents a single embryo, grouped by cross (F1 embryos on left, N2 embryos on right). Cross mother is listed first. Bars are mean BAF and 95% confidence intervals. (C) Correlation of average BAF between F1 and N2 embryos. Significant ASE genes (called using union of F1 and N2 data) are red. Point size corresponds to relative expression level. (D) Transition from fetal (Hbb-bh1, Hbb-y) to adult (Hbb-b2, Hbb-b1) beta-globins, shown as fraction of total expression of all beta-globins, averaged across individuals by time point (somite number). (E and F) Divergent temporal regulation for B6 and Cast alleles of Hbb-b1 (E) and Hbb-b2 (F) in heterozygous N2 mice. (G and H) BAF for imprinted genes Igf2 (G) and H13 (H). (I) Significantly imprinted genes (red, with 95% confidence intervals; n = 31) clearly separate from non-imprinted genes (gray, n = 8261; Figure 2—figure supplement 2).
Figure 2—figure supplement 1
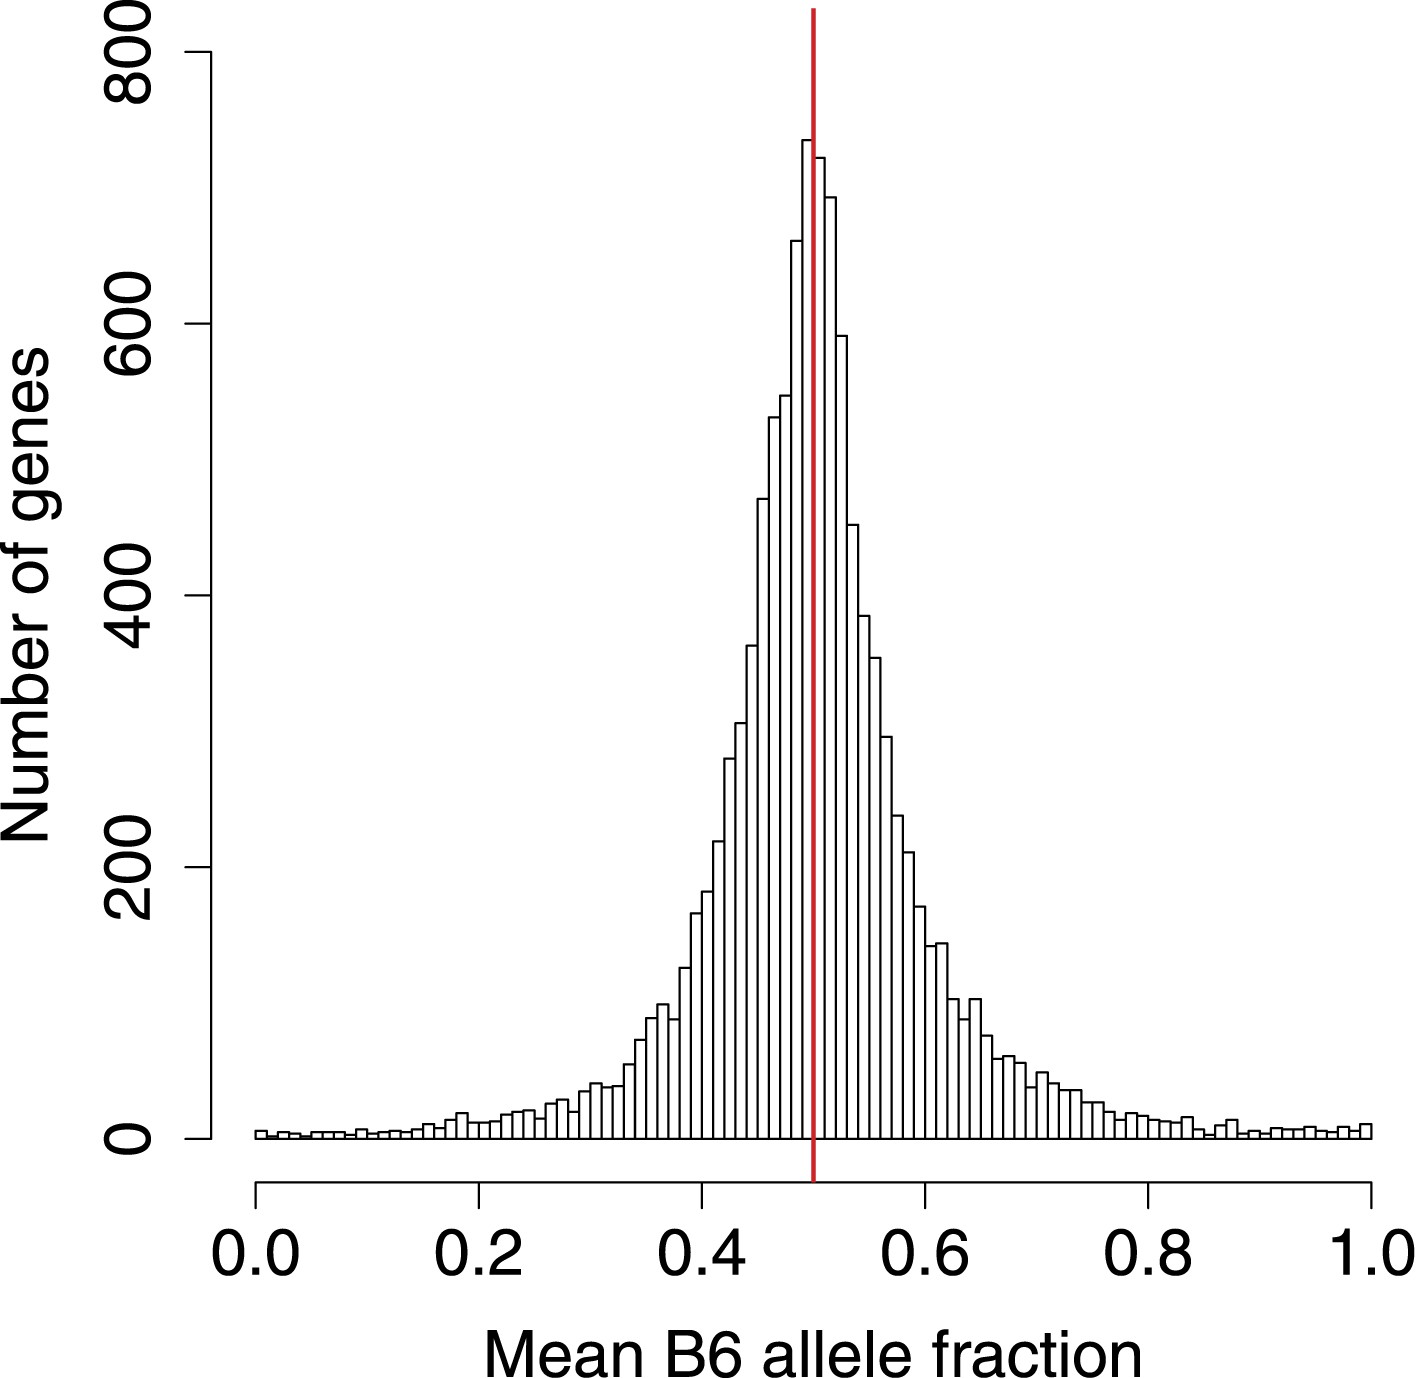
B6 allele fractions.
Histogram of BAF across genes with SNP coverage, in 0.01 increments.
Figure 2—figure supplement 2
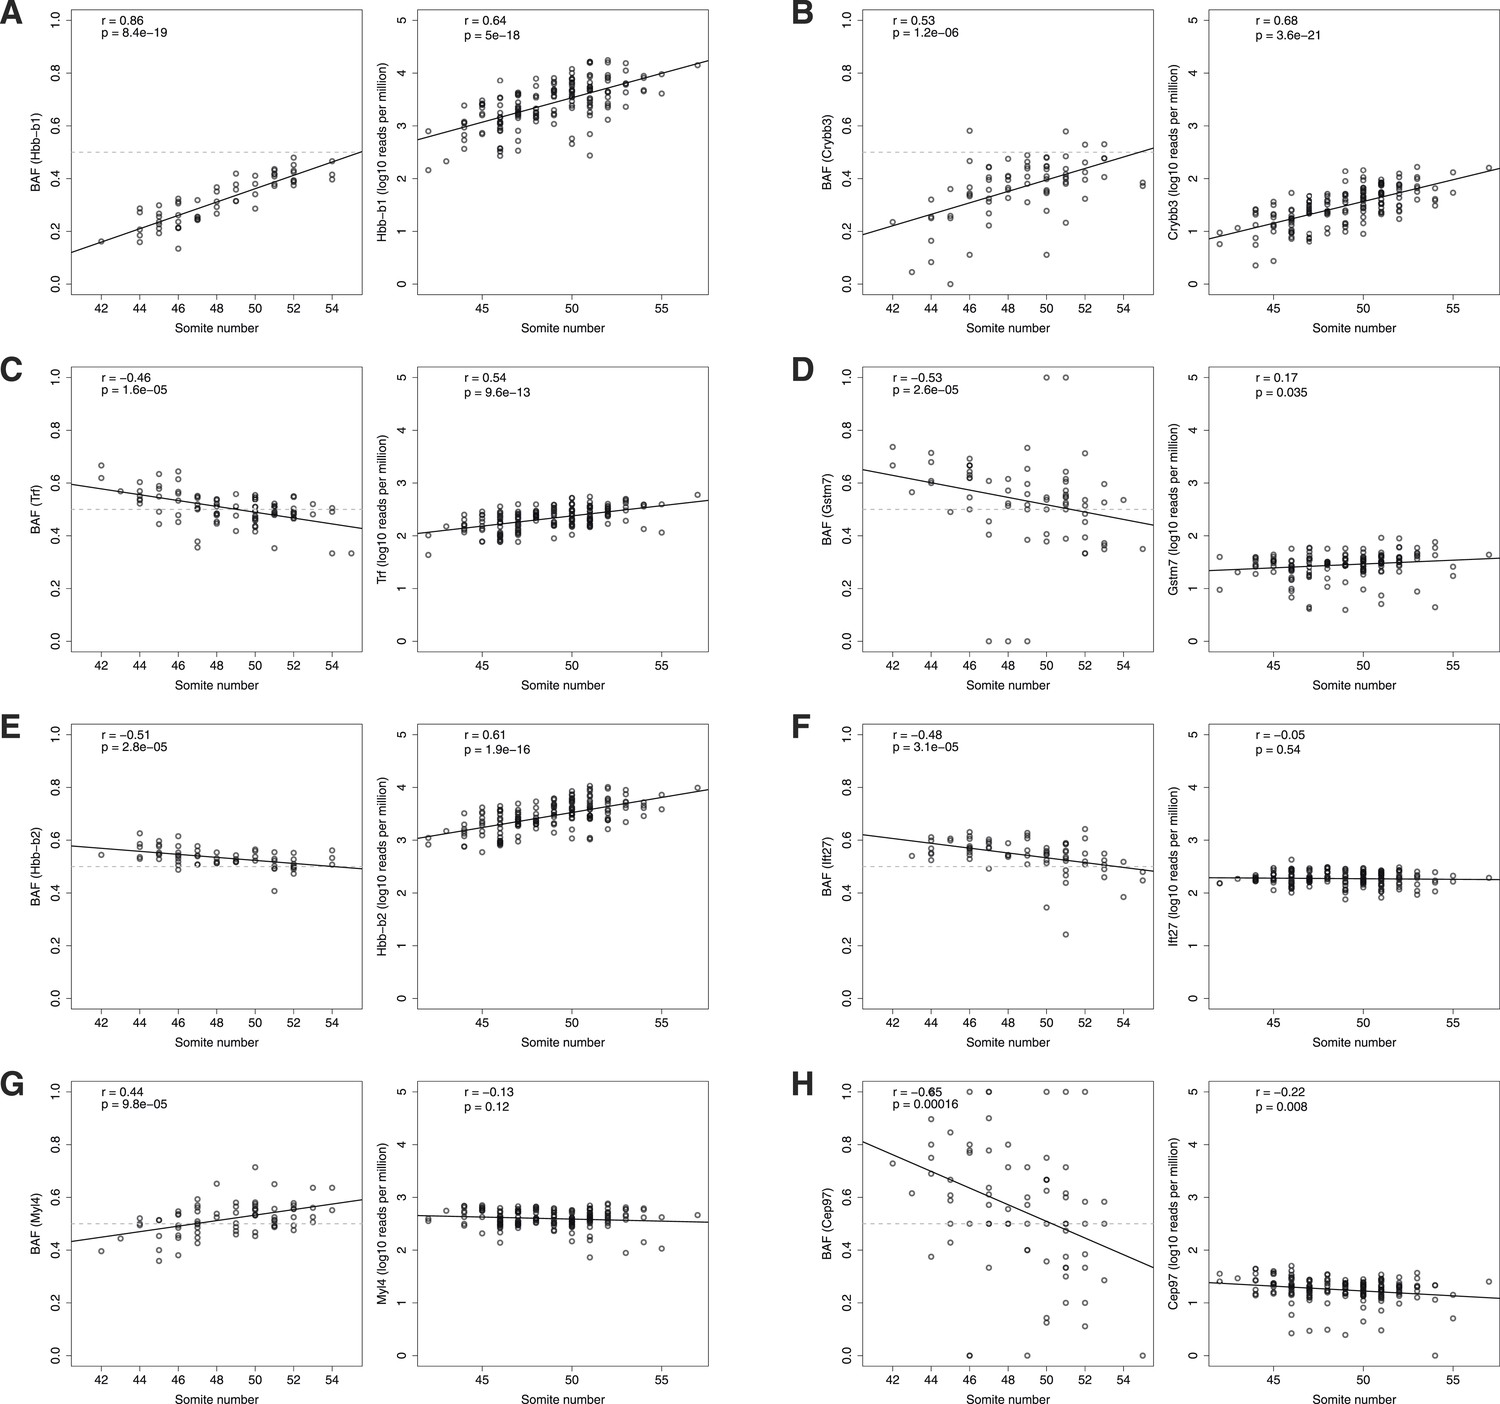
Age-dependent ASE.
ASE time courses for top eight genes (A-H) exhibiting significant dependence of ASE on somite number. Left panel, BAF; right panel, normalized expression. Only heterozygous embryos are shown in the left panels.
Figure 2—figure supplement 3
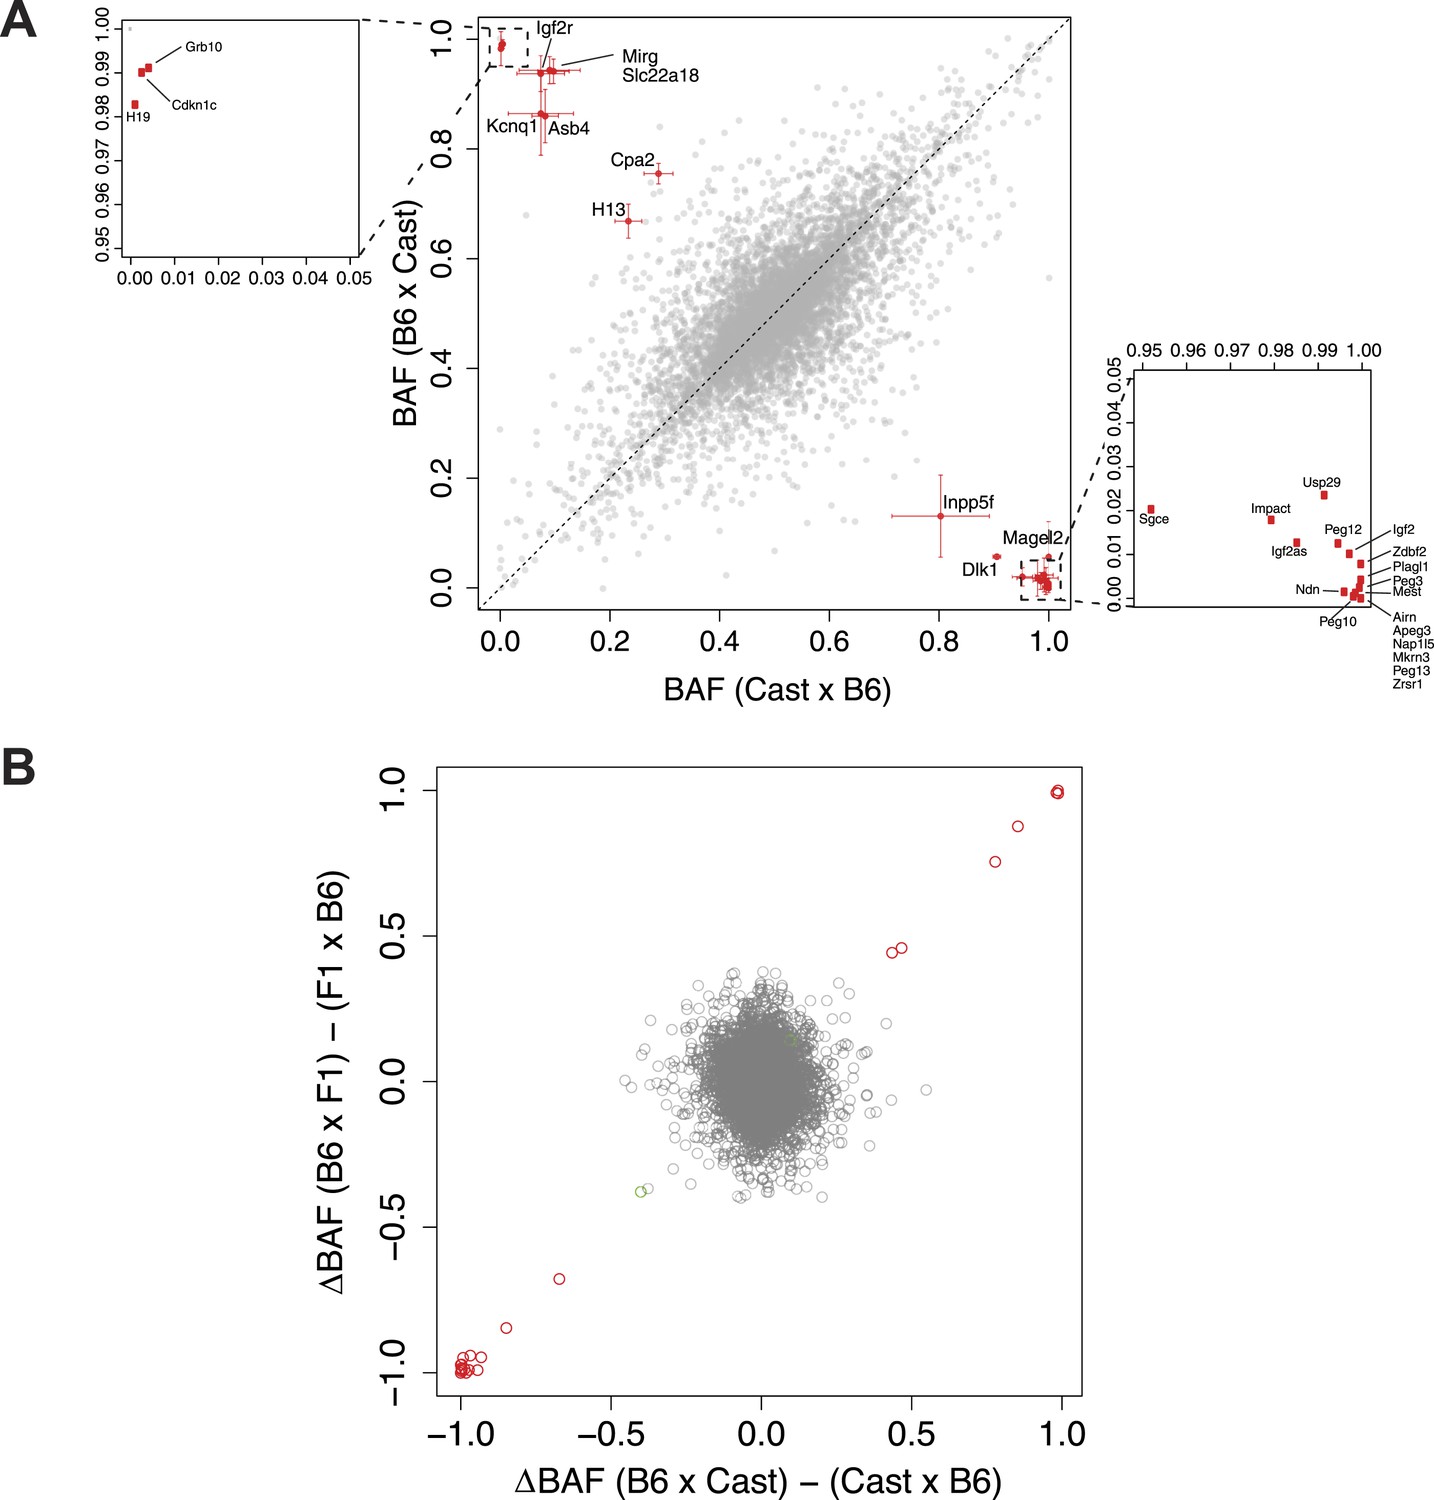
Significantly imprinted genes.
(A) Magnification of the clusters close to points (1,0) and (0,1) in the context of the same plot shown in Figure 1I, where BAF is plotted as a function of the direction of the cross. Mother's strain is listed first according to convention. (B) Plot of the average difference in BAF between the two reciprocal crosses, for each of the F1 and N2 crosses. Each gene is a point. For each gene, for F1 embryos, average BAF of embryos from CastxB6 cross was subtracted from average BAF of embryos from B6xCast cross. For N2 embryos, only embryos heterozygous at the assayed gene are considered; for each gene, average BAF of embryos from F1xB6 cross is subtracted from average BAF of embryos from B6xF1 cross. Significantly imprinted genes, where the two crosses give a large difference, are in red near (1,1) or (−1,−1). If imprinting were not usually Boolean (either fully on or off) but rather a quantitative phenomenon in which different tissues respond differently to the imprint or change the imprint, the significant genes would reside in the tails of a continuous distribution and not be so clearly separated from the bulk of the non-imprinted genes.
Figure 3

Maternal effect target genes.
(A) Quantile–quantile (qq) plot for maternal effect target genes (black circles), compared to cis-expression quantitative trait loci (eQTL) (gray circles). (B) Expression by embryo for the top 20 maternal effect target genes, separated by maternal genotype. For each gene, samples are grouped by F1 mother (left) and B6 mother (right). (C) Total expression for Angptl4 for embryos grouped by embryonic genotype and maternal genotype. Error bars indicate mean and 95% confidence intervals.
Figure 4 with 1 supplement
eQTL.
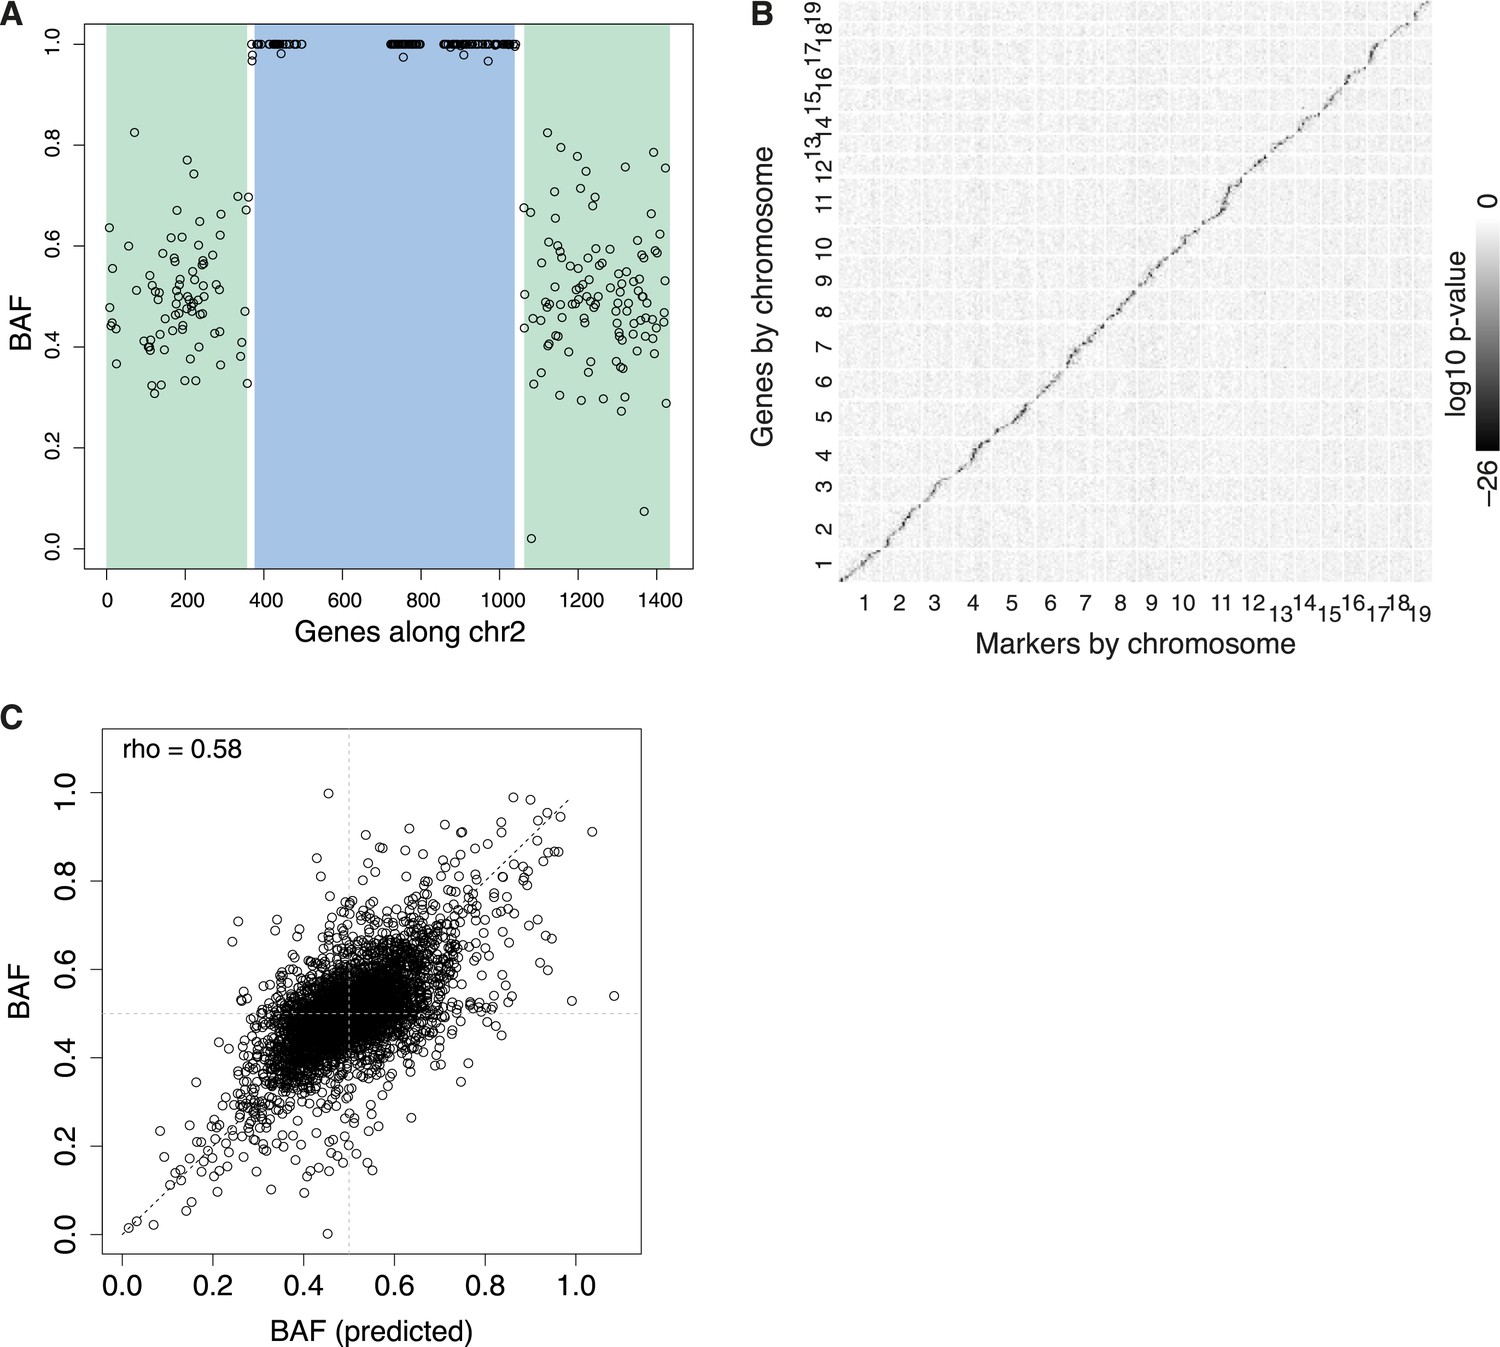
(A) Example N2 embryo data used to call recombination events for chromosome 2. Each point represents BAF for a single gene. The HMM calls green regions as heterozygous, blue regions as homozygous, with two recombination events occurring in the short intervening white regions. Only genes with sufficient read coverage of single nucleotide polymorphisms (SNPs) are shown as points; genes with under 20 SNP reads are still genotyped, based on neighboring genes. (B) Overview of all eQTL, arranged by genomic position, shaded by log10 p-value. cis-eQTL, along the diagonal, show the only appreciable signal. (C) Predicted BAF from transformed expression levels in heterozygotes and homozygotes (x-axis) correlate with BAF measured by ASE (y-axis).
Figure 4—figure supplement 1
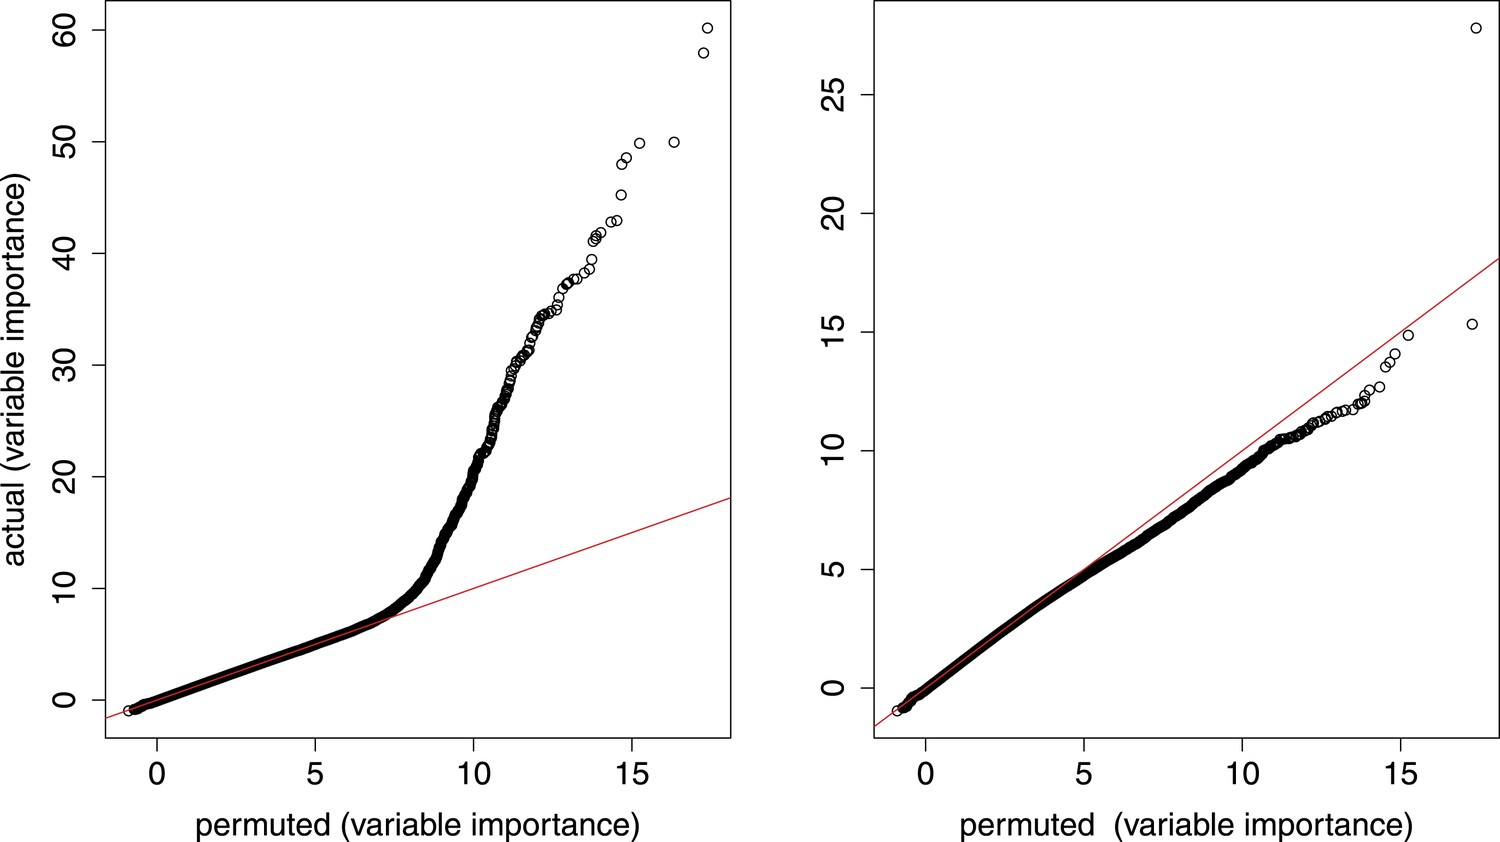
Random forest analysis.
qq plots from random forest model that simultaneously considers age (number of somites) and genotype. Left, all gene–marker pairs; right, gene–marker pairs only in trans.
Figure 5
Trans-eQTL.
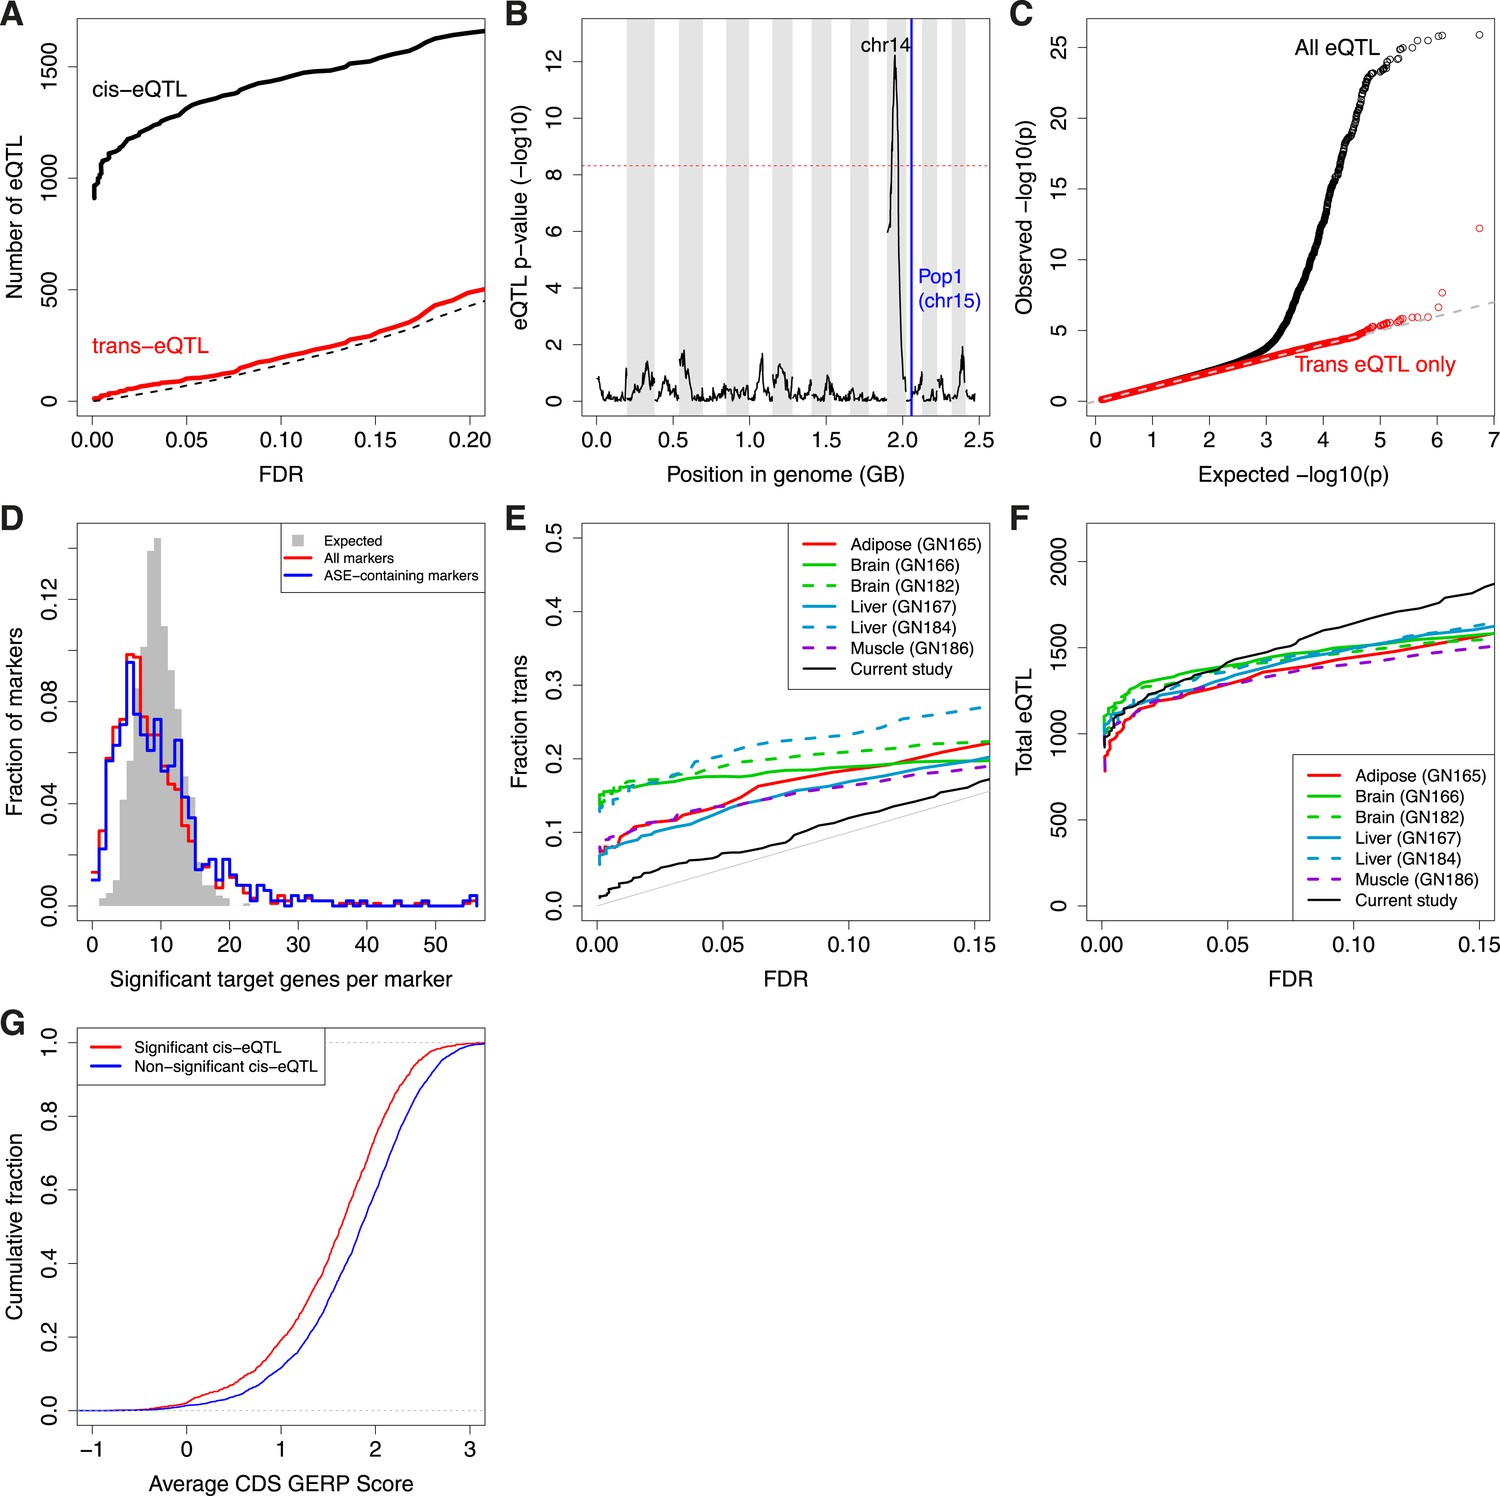
(A) Number of cis-eQTL (black) and trans-eQTL (red) as a function of FDR. Dashed line indicates number of false positive eQTL expected. (B) eQTL for Pop1, the most significant trans-eQTL target (vertical blue line). Candidate controlling loci are shown across the x-axis in genome order; only the peak on Chr14 is significant. Chromosomes are shaded in alternating background colors. (C) qq plot for all gene–marker pairs (black) and gene–marker pairs only in trans (red). Gray straight lines are y = x, x axis is expected p-values based on permutations. (D) Trans-eQTL hotspots, shown as the distribution of significant target genes per marker region (p < 0.005) across all marker regions (red) or only marker regions containing the top 50% of ASE genes (blue). Gray shows the expected distribution if there were no hotspots. (E and F) Comparison of our study with that of eQTL in adult tissues as a function of FDR. (E), Trans-eQTL as a proportion of total eQTL. (F), total number of eQTL. GeneNetwork sample ID indicated in parentheses. (G) Evolutionary constraint (GERP score) in coding regions (CDS) for the most significant (red; n = 1347) and non-significant (blue; n = 3726) cis-eQTL genes.
Author response image 1
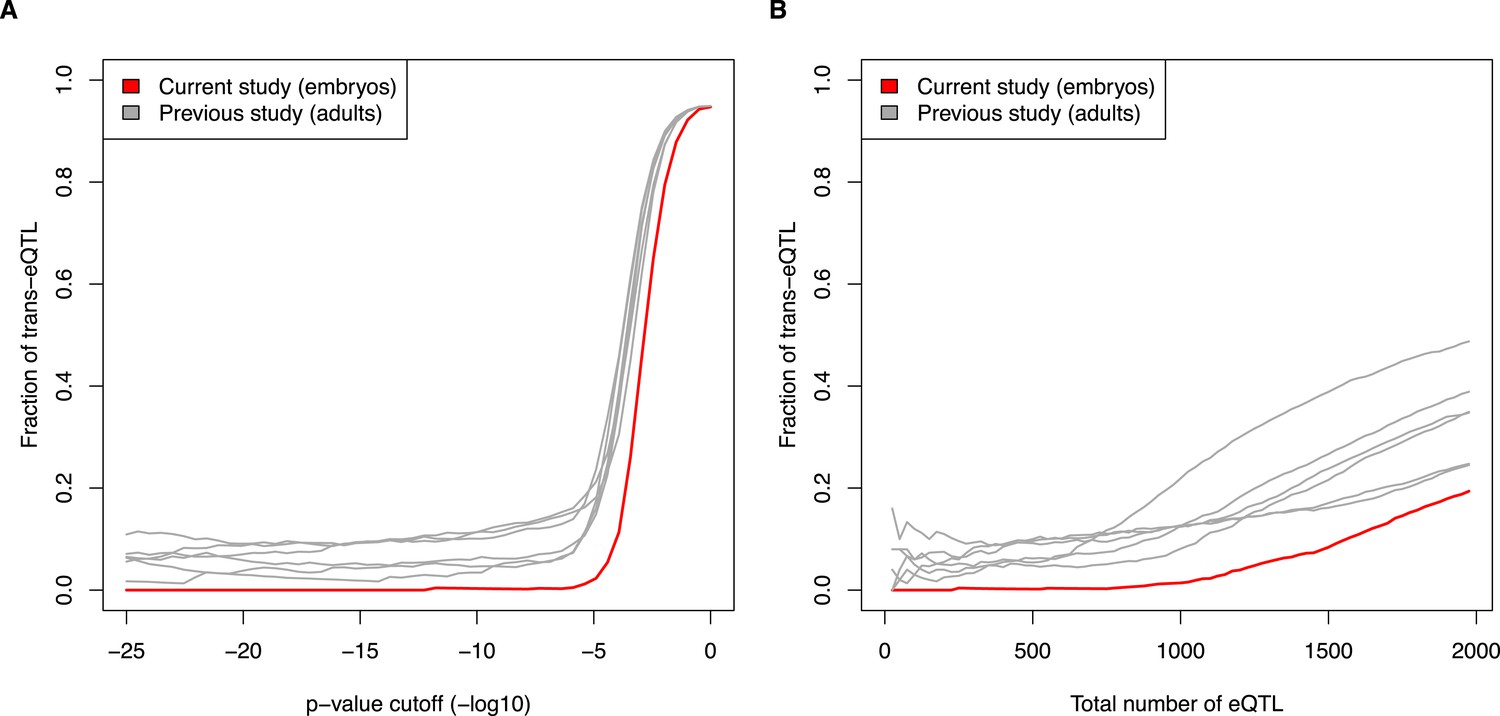
Fraction of eQTL in trans, comparing current embryo study to previous adult studies. (A) eQTL were calculated at increasing p-value cutoffs (x-axis). (B) eQTL were compared at increasing ranks (e.g., top 500 eQTL from each study). See also Figure 5E and 5F.
Additional files
-
Supplementary file 1
Gene summaries.
- https://doi.org/10.7554/eLife.05538.012
Download links
A two-part list of links to download the article, or parts of the article, in various formats.
Downloads (link to download the article as PDF)
Open citations (links to open the citations from this article in various online reference manager services)
Cite this article (links to download the citations from this article in formats compatible with various reference manager tools)
Constraint and divergence of global gene expression in the mammalian embryo
eLife 4:e05538.
https://doi.org/10.7554/eLife.05538


