Genetic and epigenetic variation in the lineage specification of regulatory T cells
- Howard Hughes Medical Institute, Memorial Sloan Kettering Cancer Center, United States
- Memorial Sloan Kettering Cancer Center, United States
- University of Virginia, United States
- University of Florida, United States
Figures
Figure 1 with 1 supplement

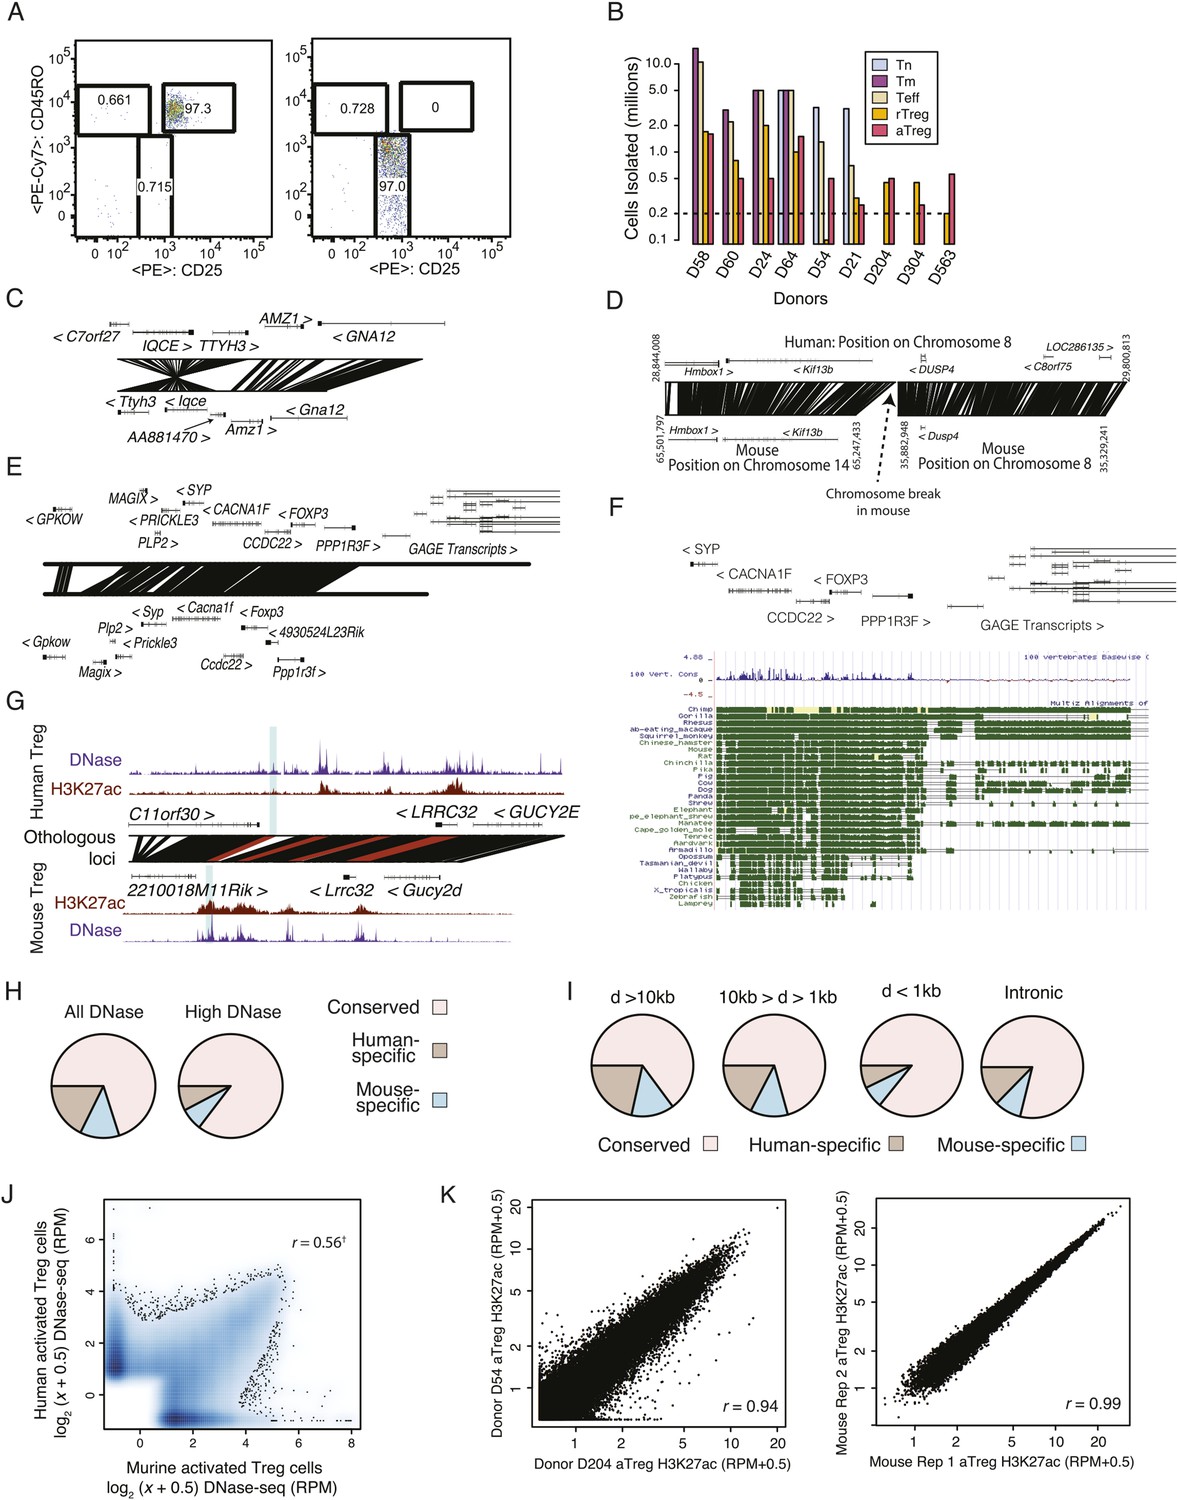
Analysis of genetic and epigenetic conservation in mouse and human Treg and CD4+ T cell subsets.
(A) Schematic representation of profiled CD4+ T-cell subsets. Abbreviations: naive T cell (Tn); effector T cell (Teff); resting regulatory T cell (rTreg); activated regulatory T cells (aTreg). (B) The indicated human CD4+ T-cell subpopulations were FACS sorted based on CD3, CD4, CD45RO, and CD25 expression from preparations of peripheral blood mononuclear cells (PBMCs) from healthy human donors. Highly purified Treg cell subpopulations were obtained using a FACS Aria II fluorescent cell sorter (Figure 1—figure supplement 1A). Epigenetic profiling was performed using the following 16 cell samples isolated from 7 healthy donors: including 7 aTreg, 4 rTreg, 2 Teff, 2 Tmem, and 1 Tn independently isolated cell populations. See also Figure 1—figure supplement 1A,B. (C) Resting and activated murine CD4+ T-cell subpopulations were FACS sorted from Foxp3DTR-GFP mice injected with PBS or diphtheria toxin (DT), respectively. In Foxp3DTR-GFP mice, Treg cells express diphtheria toxin receptor (DTR). Mice injected with DT underwent punctual Treg cell depletion and consequent transient systemic inflammation, which resulted in activation of rebounding Treg and conventional T cells. A total of 10 mouse cell samples isolated using FACS sorting from DT-treated and DT-untreated Foxp3DTR mice were analyzed: 2 aTreg, 4 rTreg, 2 Teff, and 4 Tn biological replicates. (D, E) Genetic and epigenetic conservation at select loci. Multiple regulatory elements near LRRC32 and YY1 are genetically and epigenetically conserved: YY1 has two epigenetic elements that are not conserved in human; LRRC32 has a regulatory element that is genetically, but not epigenetically conserved. (D) Acetylation at the LRRC32 locus shows multiple conserved genetic elements that illustrate concordant and discordant epigenetic states across species (highlighted regions). The human LRRC32 locus (top) and murine Lrrc32 locus (bottom) feature extensive genetically orthologous elements (lines connecting human and murine genomic coordinates) containing species-specific insertions/deletions (white space). H3K27ac ChIP-seq reads per million (RPM) are shown on y-axis for the indicated species and cell lineages. Orthologous regions with regulatory elements of interest are shown by blue background highlighting and red connecting lines. A genetically conserved element near LRRC32 is epigenetically active in mouse, but not in human (leftmost highlighted region). (E) Two regulatory elements near YY1 are epigenetically active in human but are not genetically conserved in mouse (leftmost and rightmost highlighted regions). (F) Genome-wide fractions of genetically conserved acetylated loci. Loci with high read counts are more frequently genetically conserved (shown) as are regulatory elements more proximal to gene body (Figure 1—figure supplement 1H). (G) Genome-wide quantification of epigenetic conservation. Axes show H3K27ac quantification (reads per million: RPM) of murine (x-axis) and human (y-axis) acetylated loci. Qualitatively, the vast majority of regulatory elements are epigenetically conserved in mouse and human Treg cells, with genome-wide quantitative correlation of r = 0.48 (‘†’ indicates that correlation is computed only for genetically conserved loci; non-conserved loci are shown on axes and by definition cannot be epigenetically conserved). Correlation across mouse biological replicates was r > 0.99 and between human donors r > 0.94, indicating that the observed conservation and lack thereof are reflective of biology and not technical/replicate reproducibility (Figure 1—figure supplement 1K).
Figure 1—figure supplement 1
Quality analysis of epigenetic datasets.
(A) High post-sort purity of human activated and resting Treg cell populations. (B) Isolated cell counts for each of nine donors are shown. Donors D204, D304, and D563 had lower buffy coat sample volumes (∼25 ml) than other donors (∼50 ml). (C, D) Examples of genetic conservation of inversion (C) and chromosome break (D). (E) Conservation analysis of the Foxp3 locus finds that downstream and proximal upstream elements are conserved, whereas distal upstream genomic elements encoding the GAGE transcripts are not conserved. (F) Phylogenetic analysis of the Foxp3 locus across a broad set of organisms indicates evolutionary constraint of distal genetic elements. The proximal genetic elements controlling Foxp3 expression have been previously characterized (Zheng et al., 2010; Samstein et al., 2012). (G) DNase-seq analysis confirms that the highlighted regulatory element is genetically conserved and even weakly accessible, but not histone H3K27 acetylated in human. (H) Genome-wide fractions of genetically conserved DNase-accessible loci. Loci with ‘high’ read counts are more frequently genetically conserved. (I) Genetic conservation of H3K27Ac sites is highest at promoter-proximal regulatory elements. Genetic conservation (pie charts) is shown for sites at given distances (D) from the most proximal gene promoter. Conservation at intronic loci is also shown. (J) Conservation statistics for DNase hypersensitive sites (DHSs) (similar to Figure 1F). Genome-wide quantitative correlation of mouse and human DHSs is r = 0.56 (‘†’ indicates that correlation is computed only for genetically conserved loci; non-conserved loci are shown on axes and by definition cannot be epigenetically conserved). (K) ChIP-seq reproducibility in mouse and human. Representative donor-to-donor and mouse biological replicates are shown. Slightly increased variation in human donors is a combination of biological and technical variation. Lower chromatin (cell) input into the chromatin immunoprecipitation (ChIP) assay likely results in higher technical variation; however, we also identify donor-specific usage of regulatory elements such as ENTPD1, which we confirmed as a high-probability eQTL (Figure 4).
Figure 2 with 2 supplements
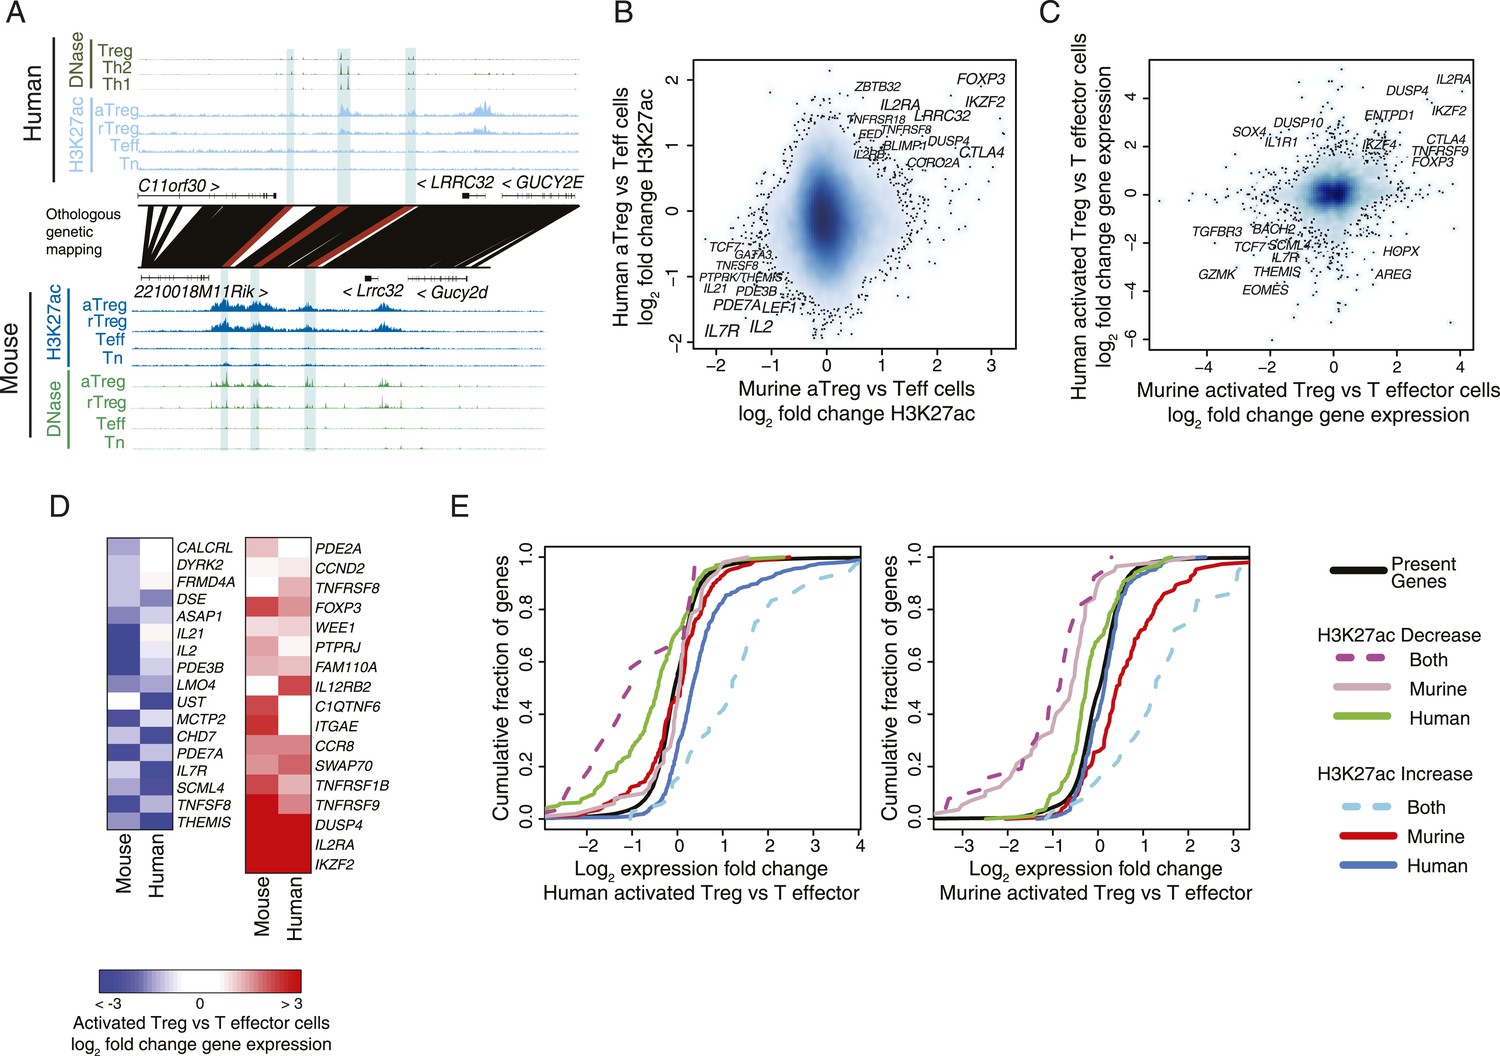
Conservation of the lineage-specific epigenome identifies the core Treg cell transcriptional control program.
(A) The LRRC32 locus contains multiple epigenetically active regulatory elements that are conserved and Treg lineage-specific in mouse and human. The layout is same as in Figure 1D,E, with H3K27ac and DNase-seq RPM quantification shown on the y-axis for multiple mouse and human CD4+ T-cell subpopulations. The DNase-seq track provides high-resolution localization of protein-bound DNA in acetylated loci. (B) Lineage-specific conservation of epigenetic activity occurs at only a handful of Treg regulatory elements. Changes in histone acetylation (H3K27ac ChIP RPM) in aTreg compared to Teff cells are shown for mouse (x-axis) and human (y-axis) cells for genetically conserved loci. (C) Treg cell lineage-specific gene expression is similarly conserved as lineage-specific chromatin features in mouse and man. Changes in gene expression in aTreg compared to Teff cells are shown for mouse (x-axis) and human (y-axis) cells. (D) Conserved gene expression changes are associated with conserved lineage-specificity of histone acetylation. Expression changes are shown for genes most proximal to regulatory elements that were lineage-specific in both species. See also Figure 2—figure supplement 2. (E) Species-specific gene expression changes are associated with species-specific changes in histone acetylation. Acetylated loci were classified as upregulated or downregulated in a cell type-specific manner in mouse, human, or both organisms. These loci were mapped to their most proximal gene expressed in either mouse or human (lines) and cumulative fraction is shown (y-axis). The differential expression in aTreg vs Teff cells was plotted for these genes in human (left) and mouse (right). Regulatory elements that are lineage-specific in both species (dashed lines) have been associated with genes with the most conserved differential expression patterns. Regulatory elements that are lineage-specific in only mouse (red/gray for up/downregulated loci) are near genes that are more differentially expressed in mouse cell subsets. Similarly, elements that are lineage-specific in only human (purple/green for up/downregulated loci) are associated with differential expression in human. Statistical significance was assessed by the Kolmogorov–Smirnov test; all relevant distribution shifts are statistically significant; p-values are shown for relevant comparisons in Figure 2—figure supplement 1F.
Figure 2—figure supplement 1

The core Treg lineage specification program is robust across multiple donors and is enriched for significant changes in gene expression.
(A) Treg cell lineage-specific acetylation at the CTLA4 locus (highlighted region). The layout and axes are same as in Figure 2A. (B) The Treg lineage-specific H3K27ac landscape is reproducible in both mouse and human. Representative donor-to-donor and mouse biological replicates are shown as Treg vs Teff cell ChIP-seq log2 RPM fold-change on the x- and y-axes; actual transform is log2[(RPMtreg + 0.5)/(RPMteff + 0.5)], which preferentially decreases fold changes of lower read count peaks and thus reduces noise in the plot. Sources of variance are likely to be similar to those in Figure 1—figure supplement 1K. An example of a genotype-associated inconsistent lineage-specificity is ENTPD1, which is further characterized in Figure 4. (C) Lineage-specific changes in accessibility at DHSs are globally similar to H3K27ac, showing lineage-specific conservation at a subset of loci in mouse and human. (D) Treg lineage-specific downregulation and upregulation of histone acetylation is significantly conserved (p < 10−7, 10−3, respectively). Venn diagram shows overlap counts of loci in mouse and human with differential lineage acetylation. Statistical significance was tested by the one-sided hypergeometric test. (E) Conservation of the Treg cell lineage-specific program is statistically significant (y-axis) irrespective of fold-change cutoff (x-axis). All H3K27ac peaks were ranked by ChIP-seq RPM fold change in aTreg vs Teff cells (x-axis; rank of upregulated and downregulated peaks is shown as red and blue, respectively). Genome-wide, downregulation of histone acetylation is more statistically conserved than upregulation. The rank of differentially acetylated loci in each species was tested for statistical significance (y-axis, left) of overlap enrichment between species (y-axis, right). (F) Statistical analysis of Figure 2E. Kolmogorov–Smirnov test p-values for the indicated comparisons (shown in black arrows) are shown on plots, proceeding left-to-right. For instance, regulatory elements that are downregulated in both mouse and human Treg cells (dashed magenta line) are near genes that are more downregulated in human Treg cells vs Teff cells (left panel) than regulatory elements downregulated only in human (green line; p < 0.005). Similarly, human-only downregulated elements (green line) are associated with much more pronounced gene repression than murine-only downregulated elements (gray line) in human cells (left panel; p < 10−8).
Figure 2—figure supplement 2
Genes with lineage-specific elements in each organism at different genetic locations exhibit limited lineage-specific expression changes.
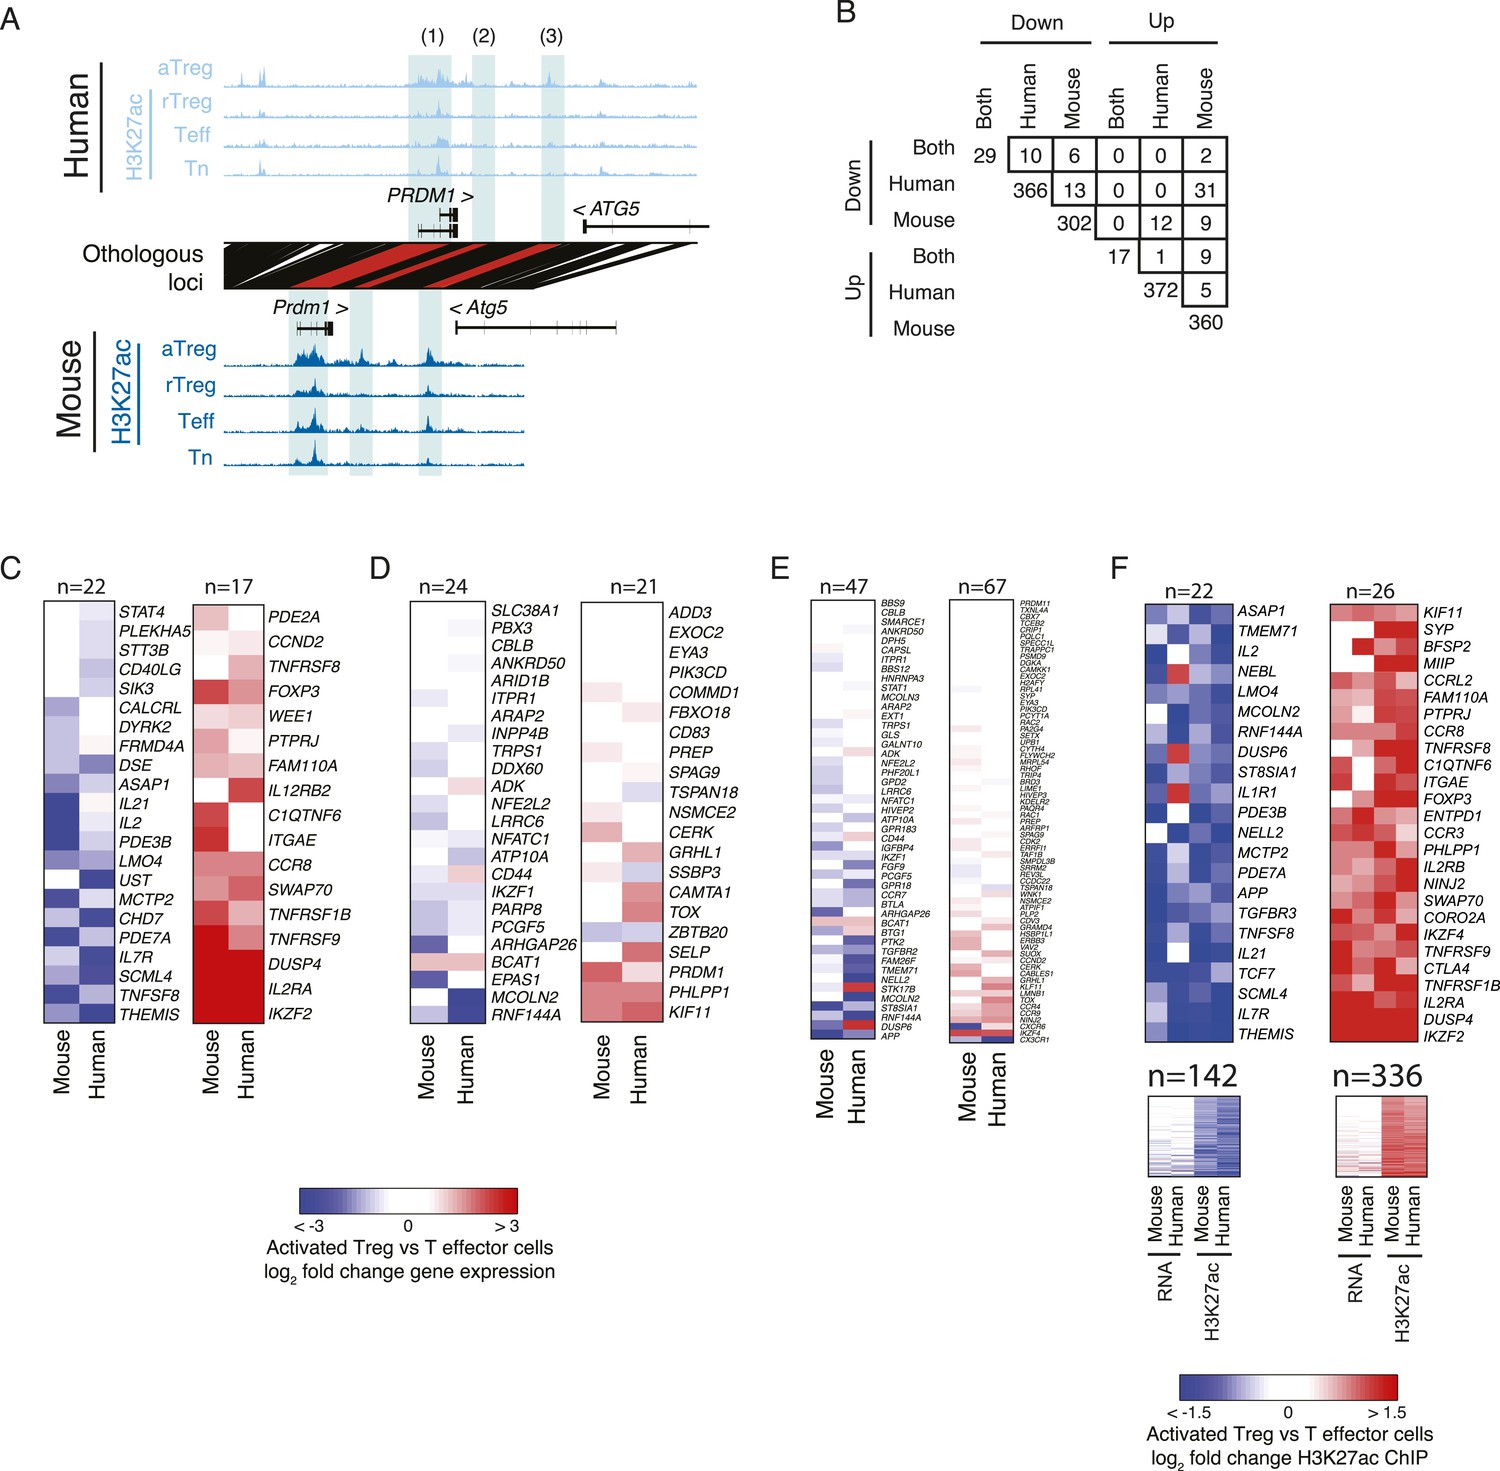
(A) Examples of lineage-specific elements in human and mouse that are partially or non-epigenetically and/or genetically conserved in the other organism. At the PRDM1 locus, the locus is comparably acetylated in both organisms (labeled 1), whereas a downstream enhancer shows lineage-specificity only in mouse; this element is epigenetically inactive in human (2). Another enhancer is acetylated in a lineage-specific manner in human and epigenetically active, but not lineage-specific in mouse (3). (B) Overlap of genes with conserved or organism-specific differentially acetylated loci in aTreg vs Teff cells. Regulatory elements were assigned to genes within 100 kbp or nearest gene. The overlap of genes with human-specific and mouse-specific consistently differentially regulated elements (n = 13 and n = 5 for downregulated and upregulated elements, respectively) is not statistically significant (see ‘Materials and methods’ for nominal and empirical statistical tests). Note the comparable values for overlap of discordant up/downregulated loci (e.g., n = 31 down in human, up in mouse; n = 12 up in human, down in mouse). (C–F) Regulatory elements that are lineage-specific either at the conserved orthologous genetic elements or nearby conserved or non-conserved regions have varying impact on gene expression. Heatmaps of differential gene expression in aTreg vs Teff cells; non-expressed genes are excluded. Panel F also shows maximum lineage-specific differential histone acetylation, since in that panel every gene can be assigned a maximally lineage-specific element. (C) Loci that are lineage-specific elements in both human and mouse have concordant differential gene expression. Statistical analysis of this set is shown in Figure 2E, Figure 2—figure supplement 1F. Foxp3 differential expression is not detected in mouse due to knock in of IRES-DTR-GFP allele. (D) Genes with regulatory elements that are epigenetically active in both organisms, but lineage-specific in only one. (E) Genes with regulatory elements that are lineage-specific in only mouse or human and not genetically conserved in the other organism. (F) Genes with at least one lineage-specific regulatory element in mouse or human. Genes with differential expression (fold change >2) are shown above (n = 22 and n = 26) and remaining genes are shown below. The additional two columns show human and mouse differential histone acetylation.
Figure 3 with 1 supplement
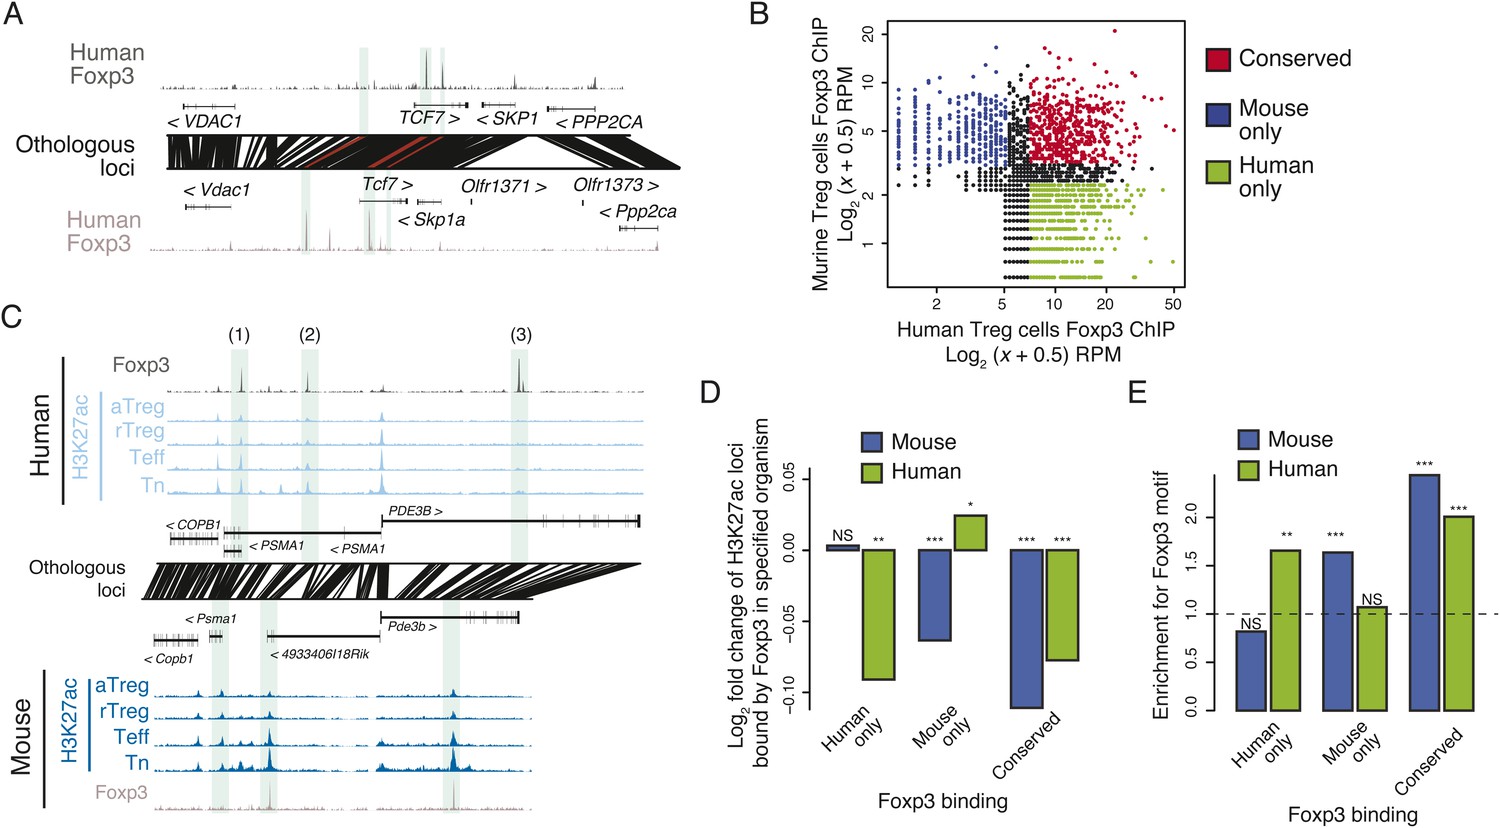
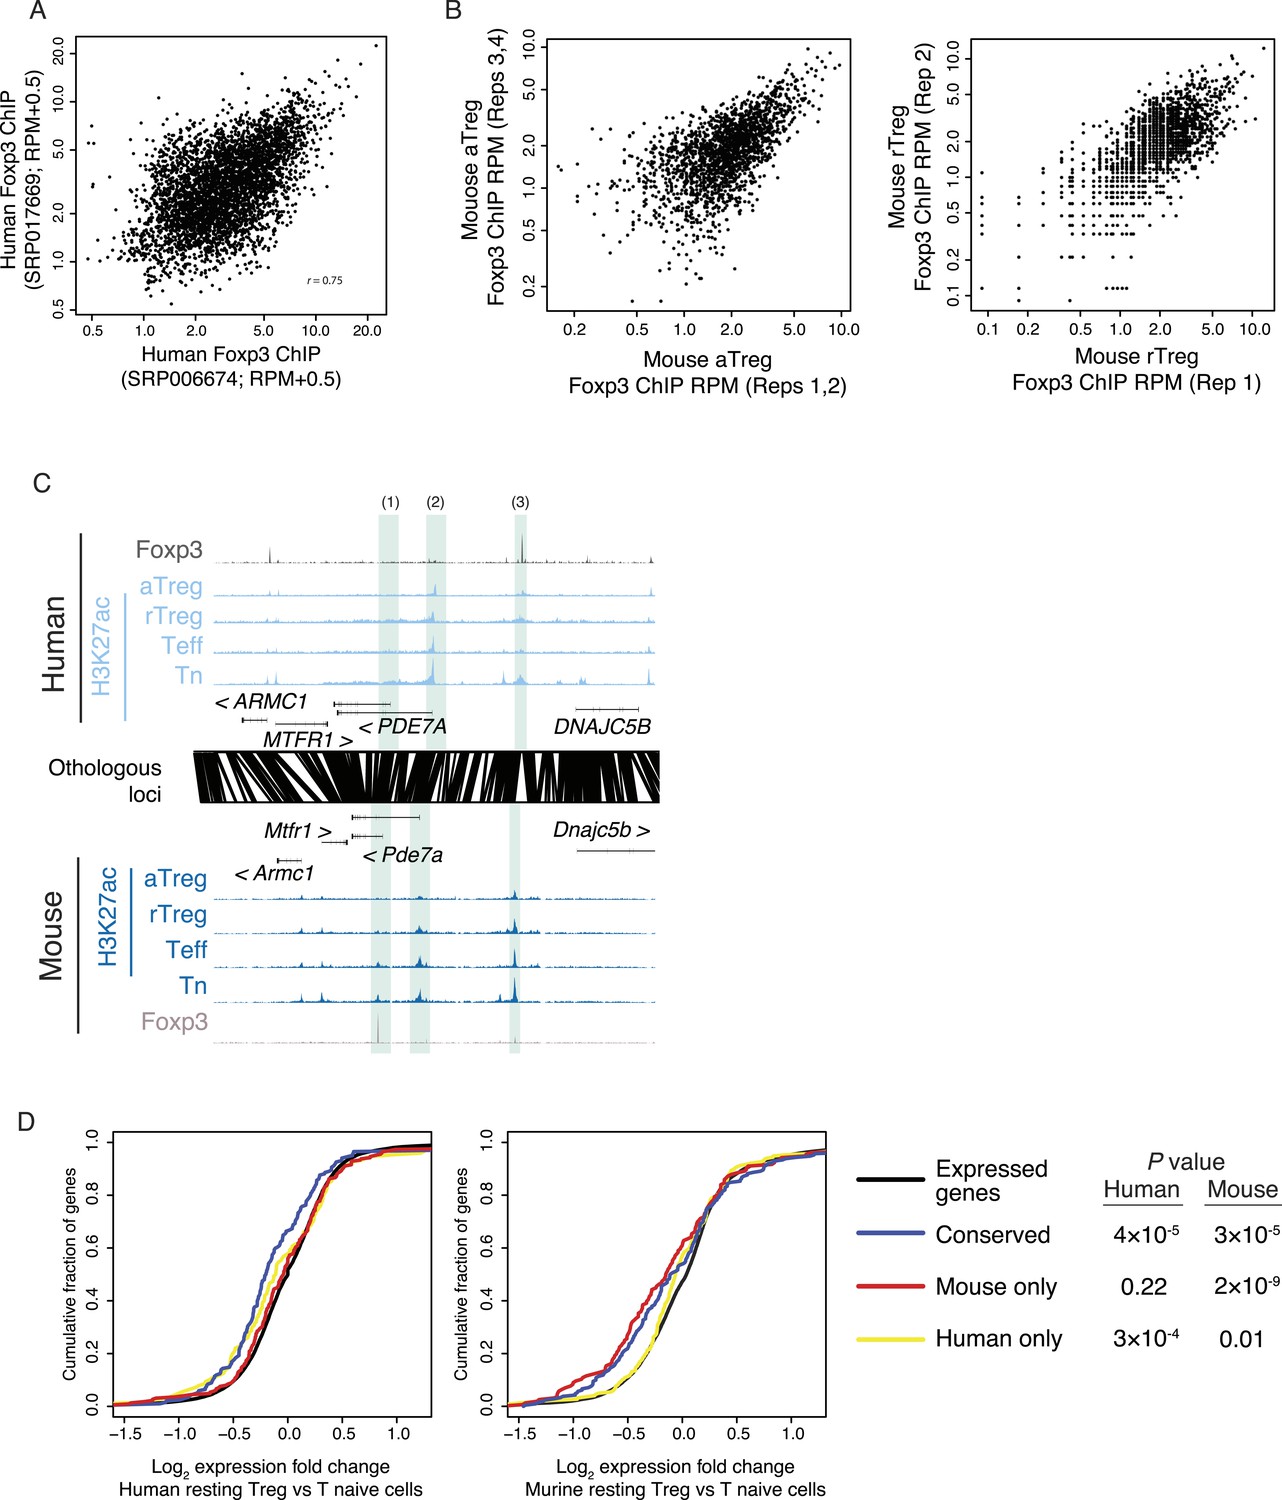
Epigenetic and genetic conservation of Foxp3-binding elements and corresponding differential gene expression.
(A) The TCF7 locus provides examples of conserved (first intron, promoter-proximal), mouse-specific (upstream), and human-specific (first intron, promoter-distal) Foxp3 binding. Plot layout and axes are similar to Figure 2A. Orthologous regulatory elements (light blue) and their orthological mapping (red) are shown. (B) Genome-wide, regulatory elements are bound by Foxp3 in both mouse and human (red) or in a human-specific (green) or mouse-specific (blue) manner. (C) Foxp3 binds loci in human and mouse that have decreased acetylation in the Treg cells at the PDE3B locus. This locus contains species-specific Foxp3-binding sites that are associated with species-specific decrease in acetylation in Treg cells (marked as 1, 3) and conserved Foxp3 binding that is associated with conserved Treg lineage decreases in acetylation (2). The decrease in acetylation at the PDE3B promoter is conserved in both species. (D) Conserved and species-specific Foxp3 binding is associated with decreased histone H3K27 acetylation at regulatory elements. Changes in human or mouse H3K27 acetylation (y-axis) at genetically conserved regulatory elements are shown to be associated with human- or mouse-specific, or conserved Foxp3 binding (x-axis). Statistical significance was calculated by two-sample t-test using all acetylated loci as the background distribution; p-values are shown as *: p < 0.05; **: p < 0.01; ***: p < 0.001. (E) Species-specific Foxp3 binding in mouse and human Treg cells is associated with non-conserved forkhead box DNA motif. Enrichment of the forkhead motif (odds ratio, y-axis) is shown for those Foxp3-binding sites that are genetically conserved and bound only in human (left) or mouse (center) Treg cells or both (right). Odds ratio and statistical significance were calculated using Fisher's exact test, where motif counts in Foxp3-binding sites were compared to flanking 200nt regions to estimate the empirical enrichment over chance. p-values are shown as *: p < 0.05; **: p < 0.01; ***: p < 0.001.
Figure 3—figure supplement 1
Foxp3 binding sites in mouse and human are reproducible and associated with transcriptional repression.
(A) Foxp3 binding is consistent in multiple human donors across two laboratory studies. Each study consists of two replicates. The NCBI SRA accession SRP006674 (Birzele et al., 2011) had two high-quality technical replicates (SRR192544, SRR192545) of a single donor, which were merged into single average (x-axis). The NCBI SRA accession SRP017669 (Schmidl et al., 2014) had high-quality Foxp3 ChIP-seq in two distinct donors (SRR639420, SRR639419), which were averaged in the above comparison (y-axis) and analyzed individually in other analyses. (B) Mouse Foxp3 ChIP-seq was performed on activated and resting Treg cell populations. Average ChIP signal is shown for 2 aTreg cell biological replicates on each axis (left) and single biological replicates in rTreg cells (right). These panels are from Arvey et al., 2014 and are reproduced here with copyright permission. (C) Examples of Foxp3 binding that is conserved, species specific, and the association with Treg lineage-specific differences in acetylation. The examples include: a mouse-specific Foxp3-binding site is associated with a mouse-specific active regulatory element that is downregulated in the Treg lineage (1); a Treg lineage-specific decrease in acetylation at the PDE7A promoter in both mouse and human (2); and a human-specific Foxp3-binding site (3). Figure design and axes similar to Figure 3C in main text. (D) Foxp3-binding sites are associated with decreases in gene expression. Statistical significance is shown for comparison of conserved, mouse, and human-specific Foxp3-bound genes against all expressed genes in the respective organism (p-values are one-sided Kolmogorov–Smirnov tests). Conserved and mouse-specific binding sites have statistically indistinguishable effect on gene expression in mouse (p < 0.18, two-sided test); whereas conserved and mouse-specific sites are more repressed than human-specific sites (p < 0.03 and p < 10−4, respectively).
Figure 4 with 1 supplement
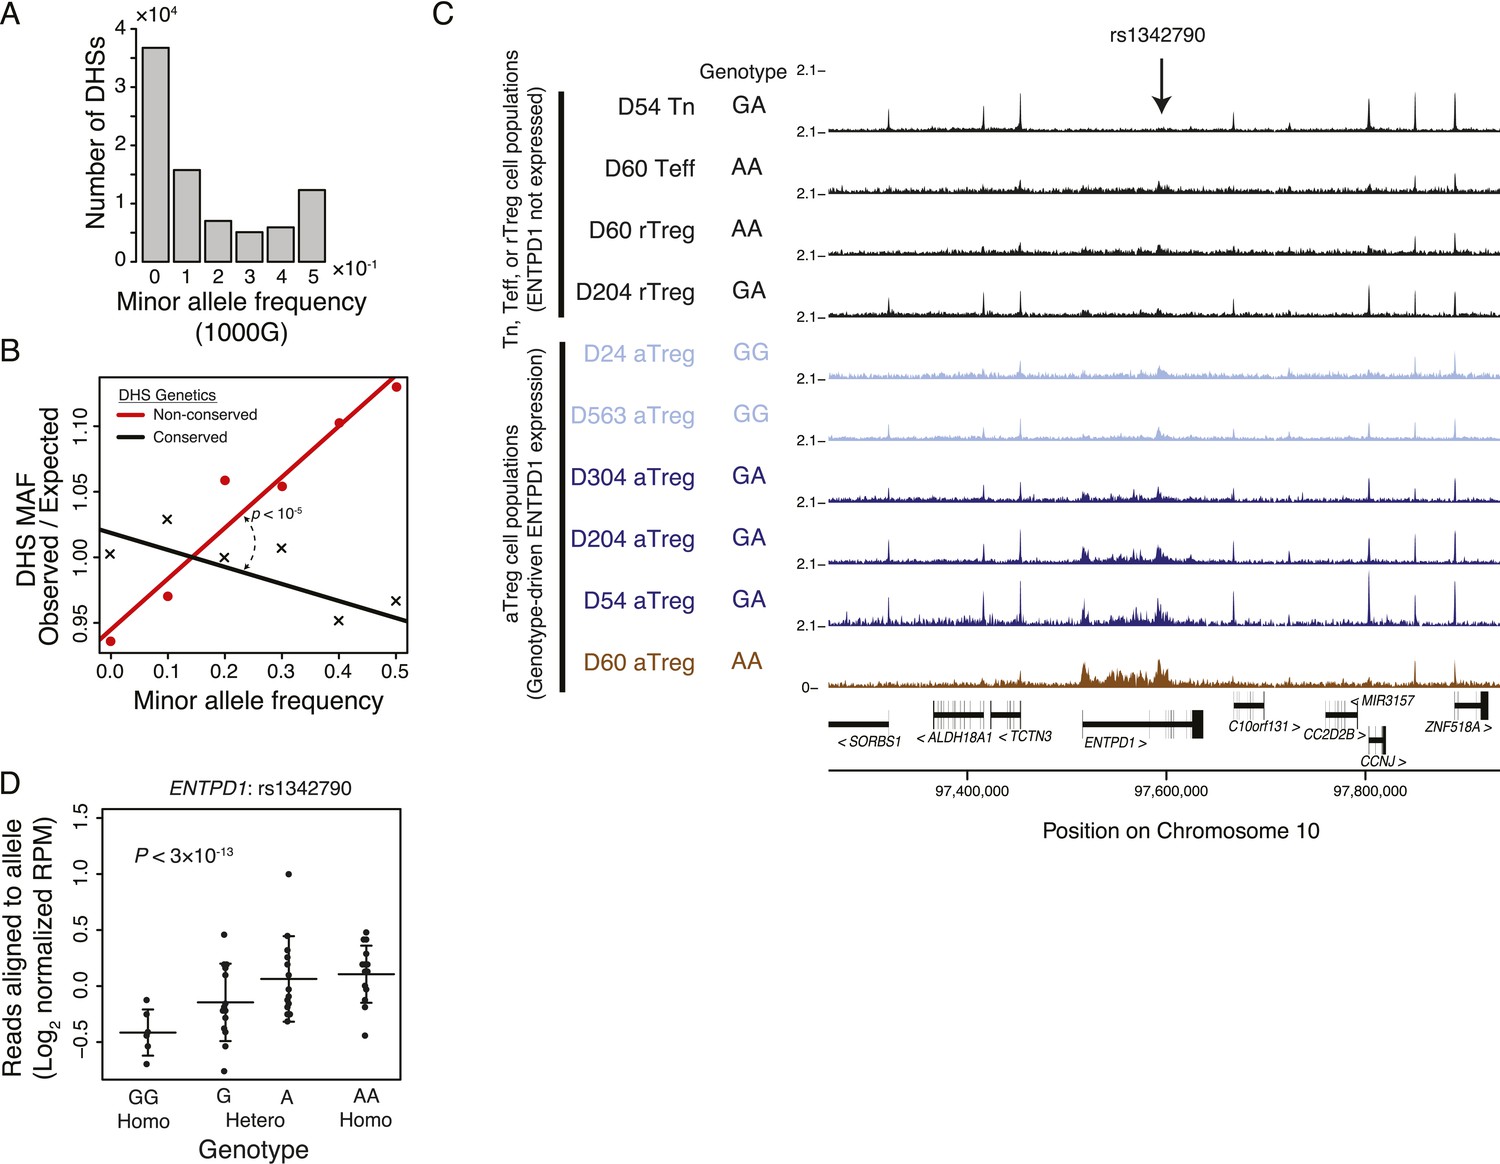
Common human genetic polymorphisms in Treg lineage-specific regulatory elements can alter histone acetylation.
(A) The CD4+ T-cell epigenome is subject to human-to-human genetic variation. The number (y-axis) of DHSs with at least one polymorphism greater than a given minor allele frequency (MAF, x-axis). MAFs are binned by <0.05 (0), 0.05–0.15 (0.1), 0.15–0.25 (0.2), 0.25–0.35 (0.3), 0.35–0.45 (0.4), >0.45 (0.5) for each population in the 1000G project (‘Materials and methods’). (B) Human DHSs not genetically conserved in mouse (red) contain greater genetic variation than those DHS that are conserved (black). Empirical p-value is computed by sampling maximum polymorphism MAF across conservation-permuted DHSs, fitting a linear regression, and testing for greater conserved vs shuffled DHS slopes: βconserved > βshuffle. (C) Genetic polymorphisms are correlated with H3K27 acetylation at the ENTPD1 locus. The activated Treg cell-specific expression of ENTPD1 is associated with a haplotype represented by single nucleotide polymorphism (SNP) rs1342790. Resting Treg (rTreg) and naive (Tn) and effector (Teff) CD4+ T-cell populations have limited acetylation of the ENTPD1 locus; in contrast, activated Treg cells have acetylation that is associated with the 'A' genotype of rs1342790. (D) Quantification of the ENTPD1 genetic association reveals allele-specific histone modification in heterozygous individuals. Meta-analysis of the ENTPD1 locus in B lymphoblastoid cell lines was performed to provide additional statistical power (Kasowski et al., 2013a). Genotypes (x-axis) and their corresponding reads crossing the polymorphism per million reads aligned (RPM; y-axis) were calculated for each individual with more than 5 reads at rs1342790. Values across zygosity and cell type were made comparable by doubling heterozygous RPMs and mean normalizing. Statistical significance was estimated by independent assessment of heterozygous and homozygous allelic normalized read counts (‘Materials and methods’).
Figure 4—figure supplement 1
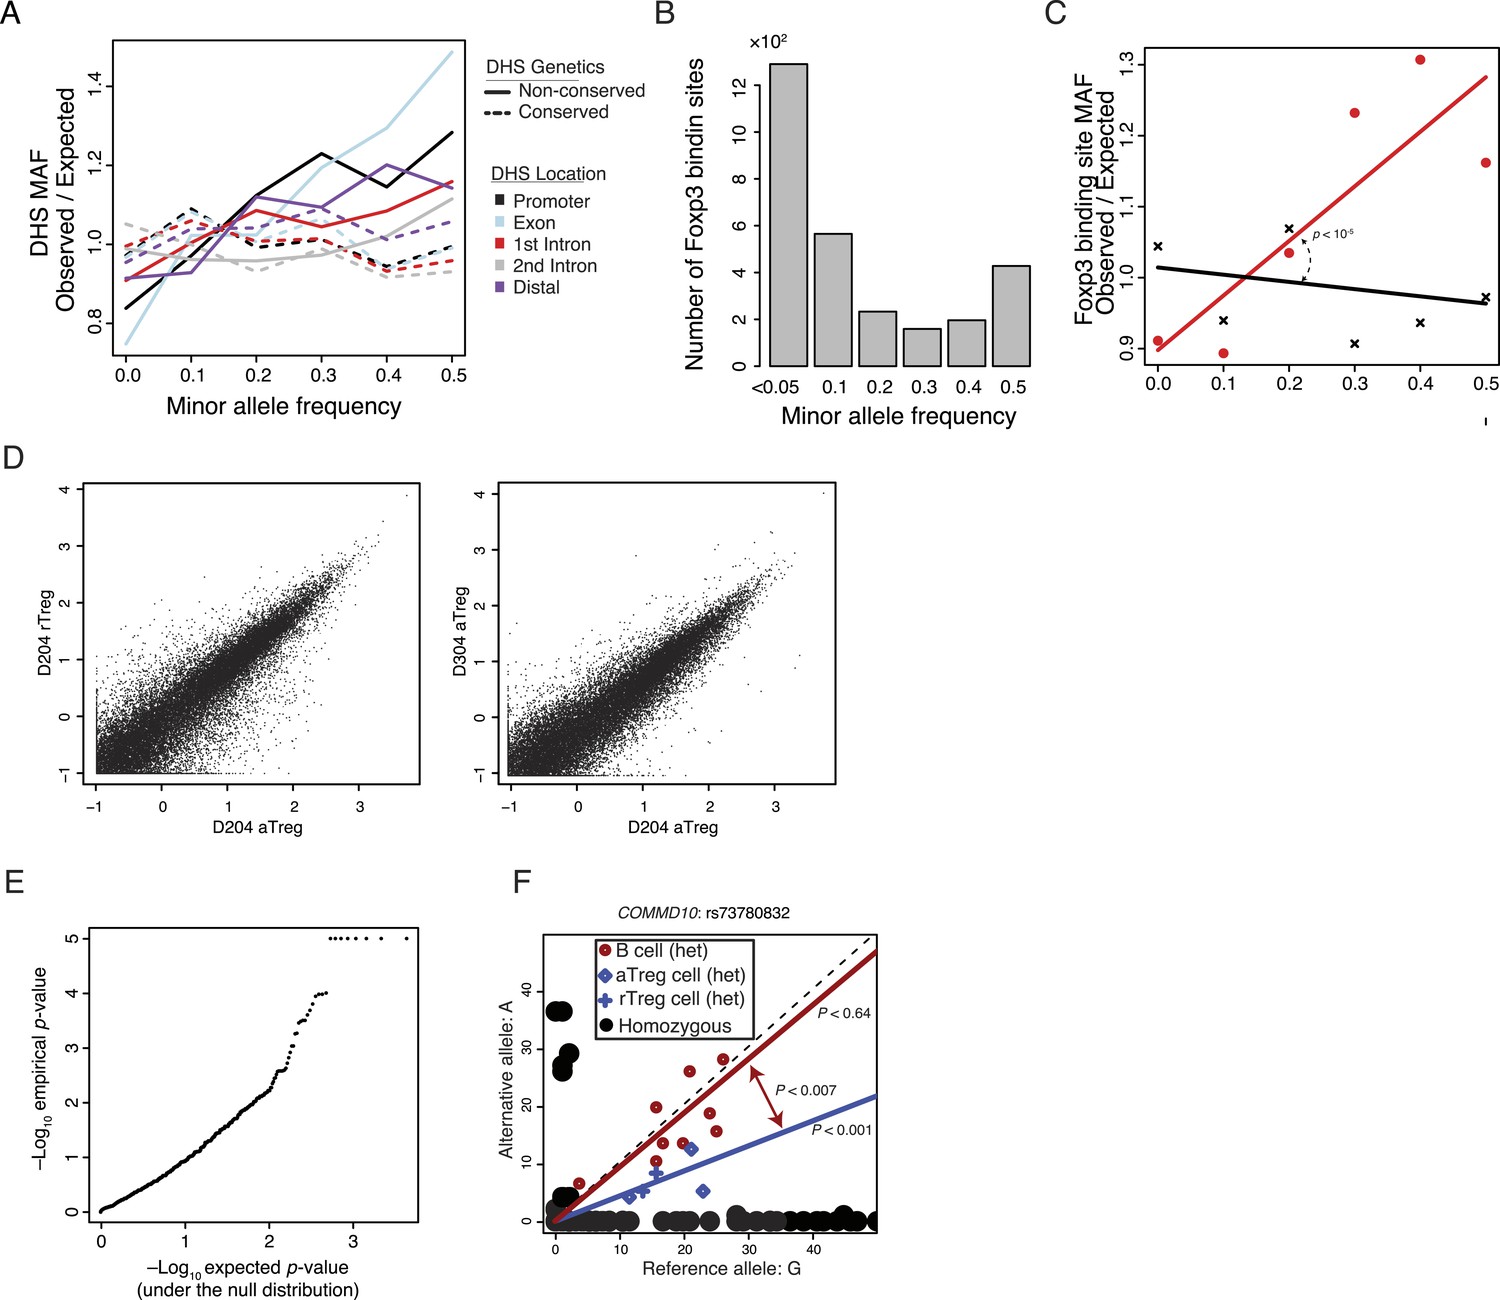
Common human genetic polymorphisms exist in Treg lineage-specific regulatory elements and Foxp3 binding sites. These polymorphisms can be associated with variation in histone acetylation.
(A) Increased sequence polymorphism frequency in non-conserved DHSs stratified by localization relative to the most proximal gene. Non-conserved DHSs (solid lines) at promoters, exons, introns, and distal elements showed patterns of polymorphism consistent with decreased constraint in contrast to conserved DHSs (dashed lines). (B) Human Foxp3-bound regulatory elements are subject to human-to-human genetic variation. The number (y-axis) of DHSs with at least one polymorphism greater than a given MAF (x-axis). (C) Human Foxp3-bound regulatory elements not genetically conserved in mouse (red) contain greater genetic variation than the conserved ones (black). Empirical p-value is computed by sampling maximum polymorphism MAF across conservation-permuted DHSs. (D) Representative examples of lineage-to-lineage and donor-to-donor variation. ChIP-seq H3K27ac RPM intra-donor variation for D204 aTreg and rTreg cells is shown (left) as well as inter-donor variation between D204 and D304 aTreg cells (right). Axes are log2(x + 0.5) transformed. (E) QQ-plot quantification of allele specificity in 2227 enhancers with robustly detectable heterozygous polymorphisms reveals potentially significant associations. Axes show observed (y-axis) and expected (x-axis) −log10 p-values. Since the observed p-value distribution diverges from the expected (null) p-value distribution, the most significant p-values are likely not a result of multiple hypothesis testing. Observed −log10 p-values were capped at 5 for ease of visualization. (F) A polymorphic allele at COMMD10 does not affect acetylation in B cells but is associated with differential acetylation in T-cell populations. A linear regression model with fixed intercept is fitted to the B and T-cell populations. Difference in slope parameters β1 ≠ β2 was tested for significance with two-tailed t-test with n1 + n2 −4° of freedom where n1 and n2 are the number of heterozygous alleles in B and Treg cells. As indicated in the legend, homozygous cell lines/donors are shown as black circles, while heterozygous sample cell type is represented by color and symbol.
Figure 5 with 1 supplement
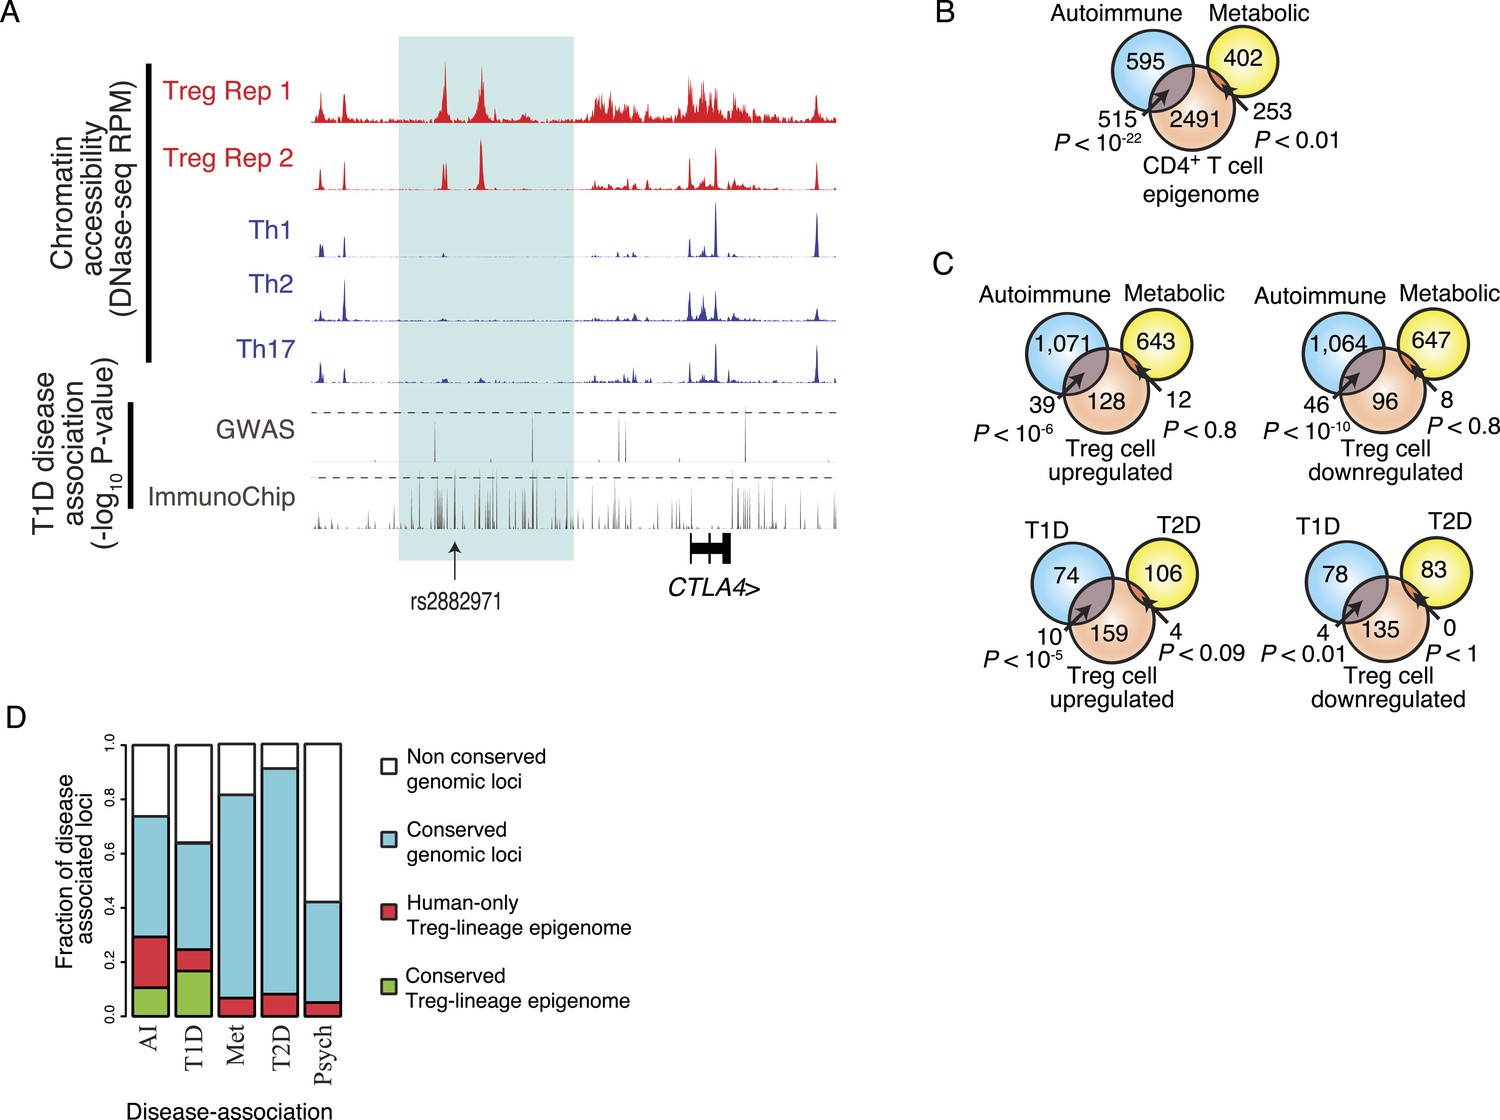
Disease-associated SNPs are enriched in Treg lineage-specific regulatory elements.
(A) Fine mapping of genetic disease association identifies Treg-specific upstream enhancers (highlighted in blue) at the CTLA4 locus as being associated with predisposition to type 1 diabetes (T1D). The high-resolution ImmunoChip SNP array analysis suggests that the functional polymorphism resides in the Treg-specific enhancer. The x-axis shows genomic position and y-axis shows RPM for chromatin tracks and −log10(p-value) for association study data. Dashed horizontal lines show genome-wide statistical significance thresholds for T1D disease association studies. The highlighted polymorphism rs2882971 is representative of multiple SNPs in linkage disequilibrium. (B) Autoimmune disease-risk polymorphisms have extensive overlap with the pan-CD4+ T-cell epigenome. Disease-risk polymorphisms was obtained from the NHGRI GWAS catalog and statistical significance of overlap was determined by a one-tailed hypergeometric test using all known disease-associated polymorphisms to model the null distribution (‘Materials and methods’). (C) Treg and Teff cell-specific epigenetic elements contain a significant number of autoimmune disease-risk polymorphisms. Metabolic diseases are shown as a control. T1D and type 2 diabetes (T2D) are shown as representative autoimmune and metabolic diseases. Aggregated disease sets are provided in Supplementary file 14. (D) Polymorphisms in conserved Treg lineage-specific epigenetic elements are enriched for autoimmune-associated genetic variation. Genes near epigenetic elements containing risk polymorphisms are divided into categories: genetically non-conserved, genetically conserved, lineage-specific elements epigenetically active in human, and lineage-specific epigenetic modification conserved in both human and mouse. Autoimmune (AI), T1D, metabolic (Met), T2D, and psychiatric (Psych) disease sets are shown.
Figure 5—figure supplement 1
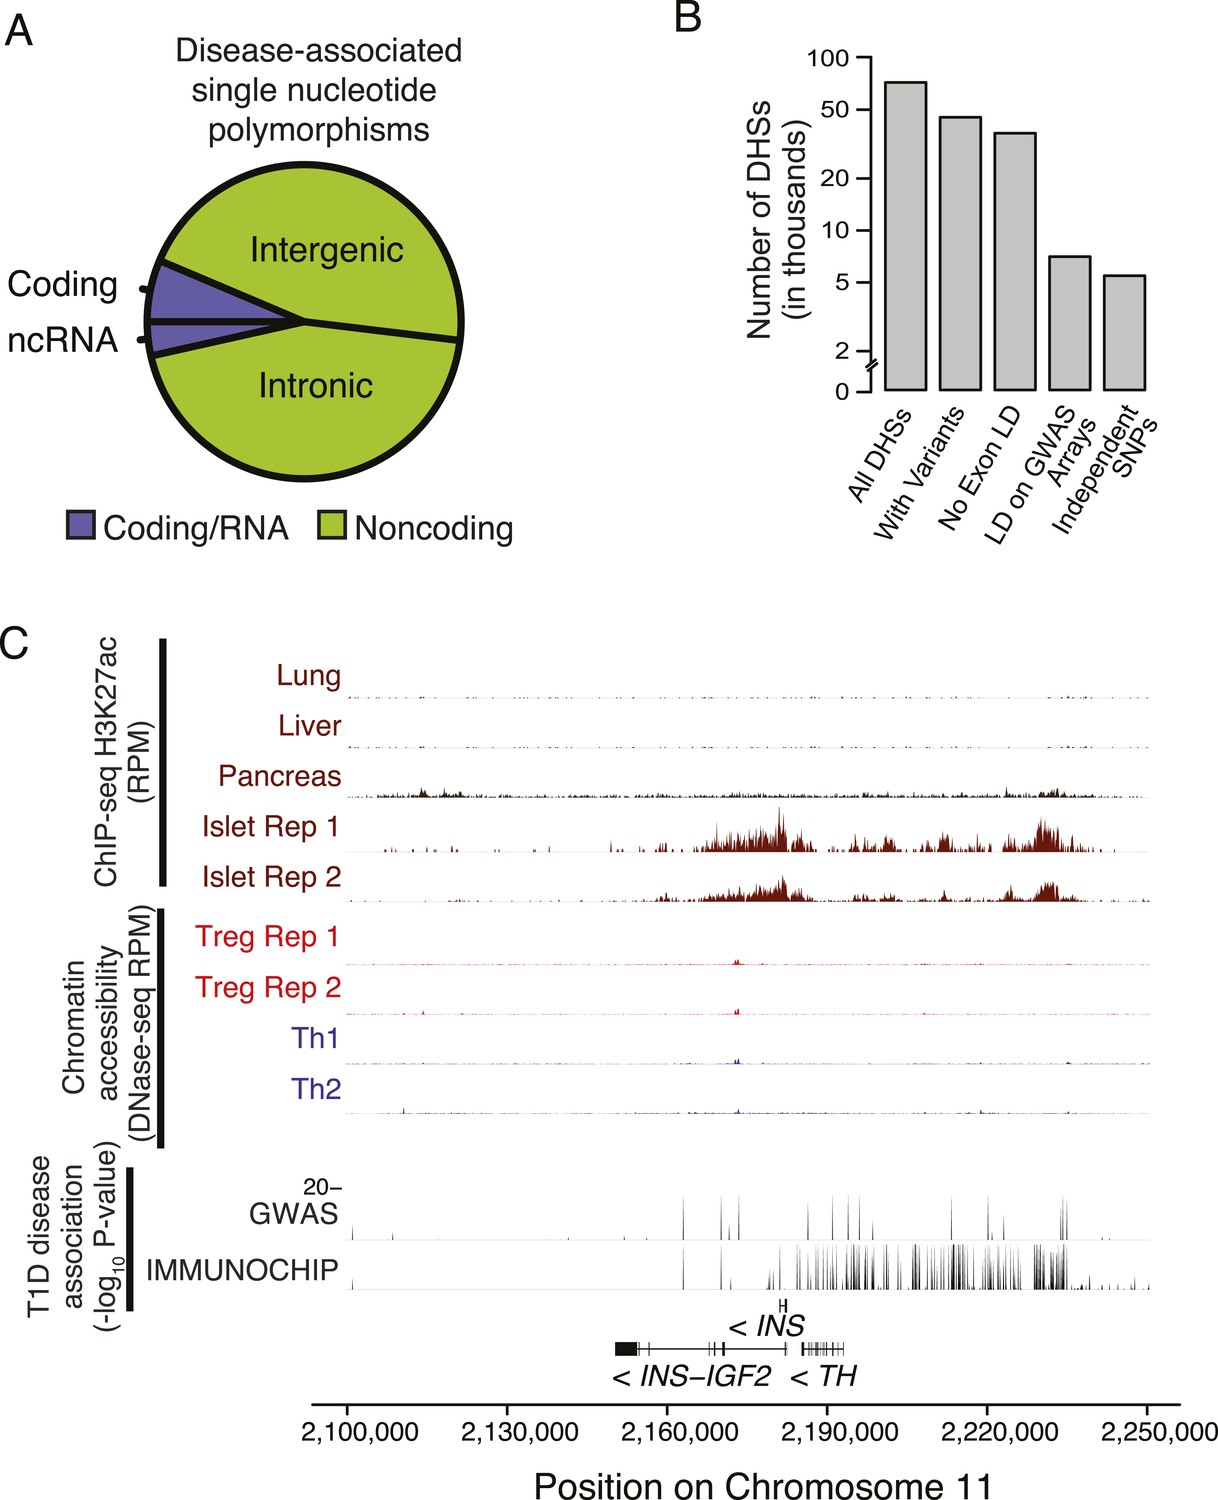
Non-coding disease-associated polymorphisms are assayed by genotyping arrays.
(A) Polymorphisms associated with common polygenic diseases reside predominantly in the non-coding portion of the genome. Annotations of statistically significant SNP-phenotype associations are taken from the NHGRI GWAS catalog. (B) Only a subset of DHSs contain variants that exhibit high LD with polymorphisms assayed using the Illumina genotyping bead array. The number of DHSs (y-axis) satisfying certain critera (x-axis) are shown. Of the ∼85 K DHSs, ∼45 K have at least one variant with significant MAF (>0.05 across 1000G). The majority of these loci have limited LD (<0.8) with any exonic polymorphism with 100 kbp. However, only ∼7 K DHSs have a polymorphism that is in strong LD (>0.8) with an assayed polymorphism on the Illumina Human 660 K genotyping chip. (C) Chromatin state at the INS locus supports the unique role of insulin in beta islet cells in the etiology of T1D (similar axes to Figure 5A). This is consistent with an extensive literature on beta islet cells and supports the relevance of our approach to characterizing cell type- and tissue-specific disease relevance using chromatin state.
Additional files
-
Supplementary file 1
Quantification of human H3K27ac peaks. Reads per million reads aligned (RPM) are log2(x + 0.5) transformed and quantile normalized.
- https://doi.org/10.7554/eLife.07571.014
-
Supplementary file 2
Quantification of human DNase-seq peaks. RPM reads aligned are log2(x + 0.5) transformed and quantile normalized.
- https://doi.org/10.7554/eLife.07571.015
-
Supplementary file 3
Quantification of mouse H3K27ac peaks. RPM reads aligned are log2(x + 0.5) transformed and quantile normalized.
- https://doi.org/10.7554/eLife.07571.016
-
Supplementary file 4
Quantification of mouse DNase-seq peaks. RPM reads aligned are log2(x + 0.5) transformed and quantile normalized.
- https://doi.org/10.7554/eLife.07571.017
-
Supplementary file 5
Orthologous regions are determined for the union of all human and mouse acetylated loci. Values are averages across indicated cell populations after quantile normalization.
- https://doi.org/10.7554/eLife.07571.018
-
Supplementary file 6
Orthologous regions are determined for the union of all human and mouse DNase hypersensitive sites (DHSs). Values are averages across indicated cell populations after quantile normalization.
- https://doi.org/10.7554/eLife.07571.019
-
Supplementary file 7
Quantification of human Foxp3 ChIP-seq peaks. RPM reads aligned are log2(x + 0.5) transformed and quantile normalized.
- https://doi.org/10.7554/eLife.07571.020
-
Supplementary file 8
Quantification of mouse Foxp3 ChIP-seq peaks. RPM reads aligned are log2(x + 0.5) transformed and quantile normalized.
- https://doi.org/10.7554/eLife.07571.021
-
Supplementary file 9
Orthologous regions are determined for the union of all human and mouse Foxp3 peaks. Values are averages across indicated cell populations after quantile normalization.
- https://doi.org/10.7554/eLife.07571.022
-
Supplementary file 10
Gene expression of human.
- https://doi.org/10.7554/eLife.07571.023
-
Supplementary file 11
Gene expression of mouse.
- https://doi.org/10.7554/eLife.07571.024
-
Supplementary file 12
Gene expression of orthologous genes for uniquely mapping human/mouse genes.
- https://doi.org/10.7554/eLife.07571.025
-
Supplementary file 13
Maximum minor allele frequency in each DHS with genetic, epigenetic, conservation, and genic localization data.
- https://doi.org/10.7554/eLife.07571.026
-
Supplementary file 14
Autoimmune and metabolic phenotypes genome-wide association (GWA) studies analyzed.
- https://doi.org/10.7554/eLife.07571.027
Download links
A two-part list of links to download the article, or parts of the article, in various formats.
Downloads (link to download the article as PDF)
Open citations (links to open the citations from this article in various online reference manager services)
Cite this article (links to download the citations from this article in formats compatible with various reference manager tools)
Genetic and epigenetic variation in the lineage specification of regulatory T cells
eLife 4:e07571.
https://doi.org/10.7554/eLife.07571


