Chemical perturbation of an intrinsically disordered region of TFIID distinguishes two modes of transcription initiation
- Janelia Research Campus, Howard Hughes Medical Institute, United States
- Howard Hughes Medical Institute, Harvard University, United States
- Broad Institute, United States
- Howard Hughes Medical Institute, University of California, Berkeley, United States
- University of California, Berkeley, United States
- Massachusetts Institute of Technology, United States
Figures
Figure 1
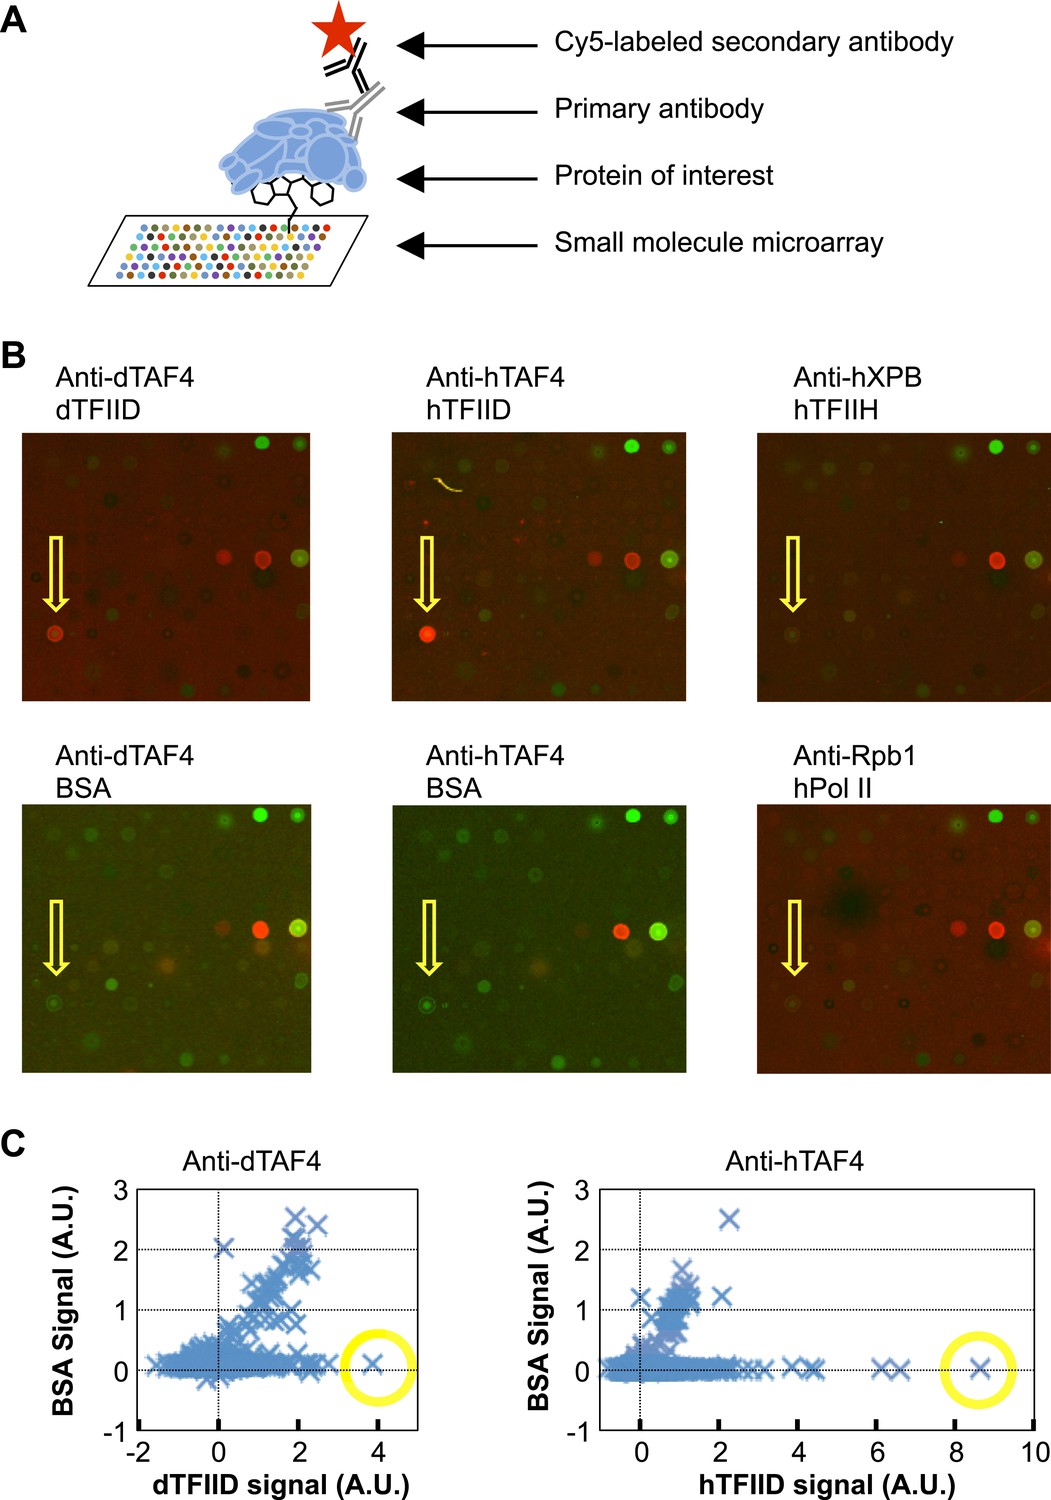
Small-molecule microarray screening for TFIID-specific modulators.
(A) Screening schematic: chemicals of diverse structure were covalently attached to a functionalized glass surface, and incubated with protein of interest, the binding of which was indicated by primary antibodies recognized by a specific fluorescently (Cy5, red) labeled secondary body. (B) Representative images of an area of arrays probed with bovine serum albumin (BSA, control), Drosophila (d) TFIID, human (h) TFIID, TFIIH (control), and Pol II (control) in combination with specified primary antibodies. Yellow arrows denote the lead compound (1, ChemDiv 7241-4207). The images were scanned at 532 nm (green, for reference spots) and 635 nm (red, for antibody signal). (C) Background subtracted average signal in arbitrary unit (A.U.) in the Cy5 fluorescent channel picked up by Drosophila (left) or human (right) TFIID is plotted against their respective BSA controls. Yellow circles depict the data points of the lead compound.
Figure 2 with 1 supplement

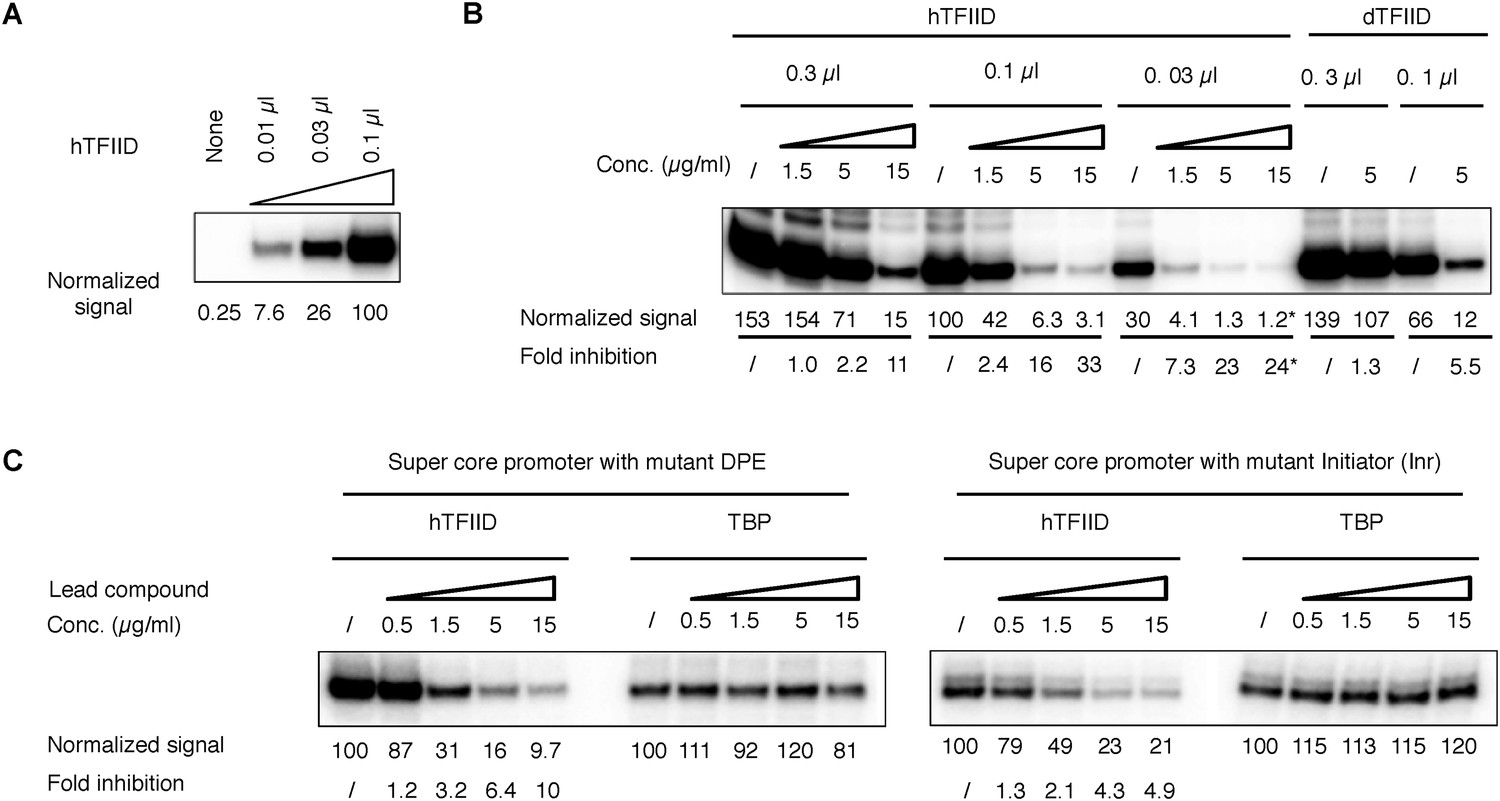
TFIID-specific transcription inhibition in a reconstituted system.
(A) Cartoon illustration of TFIID- or TATA-binding protein (TBP)-directed transcription assays. Highly purified protein factors were mixed with the chemical and incubated before the addition of DNA templates for preinitiation complex (PIC) assembly. The DNA template contains the synthetic super core promoter (SCP1) (Juven-Gershon et al., 2006). (B) Dose-dependent inhibition of hTFIID-directed transcription, but not TBP-directed transcription, by the originally purchased lead compound (1, ChemDiv 7241-4207). The images were the primer extension products of the synthesized RNA and their signals were quantified and normalized to the respective controls (first lane from left, DMSO vector only). (C) Transcription rescue with individual protein factors supplemented in twofold excess (relative to the default dosage of each factor) immediately after chemical treatment (ChemDiv 7241-4207 at 5 µg/ml) and before the addition of the DNA template. Fold of inhibition was calculated for each reaction pair.
Figure 2—figure supplement 1
TFIID dependency of the in vitro transcription assay and controls for the TFIID-specific inhibition.
(A) Titration of hTFIID in the reconstituted transcription reaction. The reaction contains all other protein factors specified in Figure 2, except for the lead compound. (B) Titration of hTFIID and dTFIID and their response to the lead compound 1 ChemDiv 7241-4207. Asterisk (*) denotes quantifications affected by cross-over signal from a neighbor. (C) TFIID-specific transcription inhibition on mutant SCP1s (Juven-Gershon et al., 2006). These images were from a same gel with the same display setting as those shown in Figure 2B. Note that although the absolute signal from TFIID-directed transcription may be core promoter element-dependent, ∼1.5 µg/ml of lead compound 1 is always sufficient to cause ∼50% transcription inhibition. In contrast, TBP-directed transcription is rather constant.
Figure 3 with 3 supplements
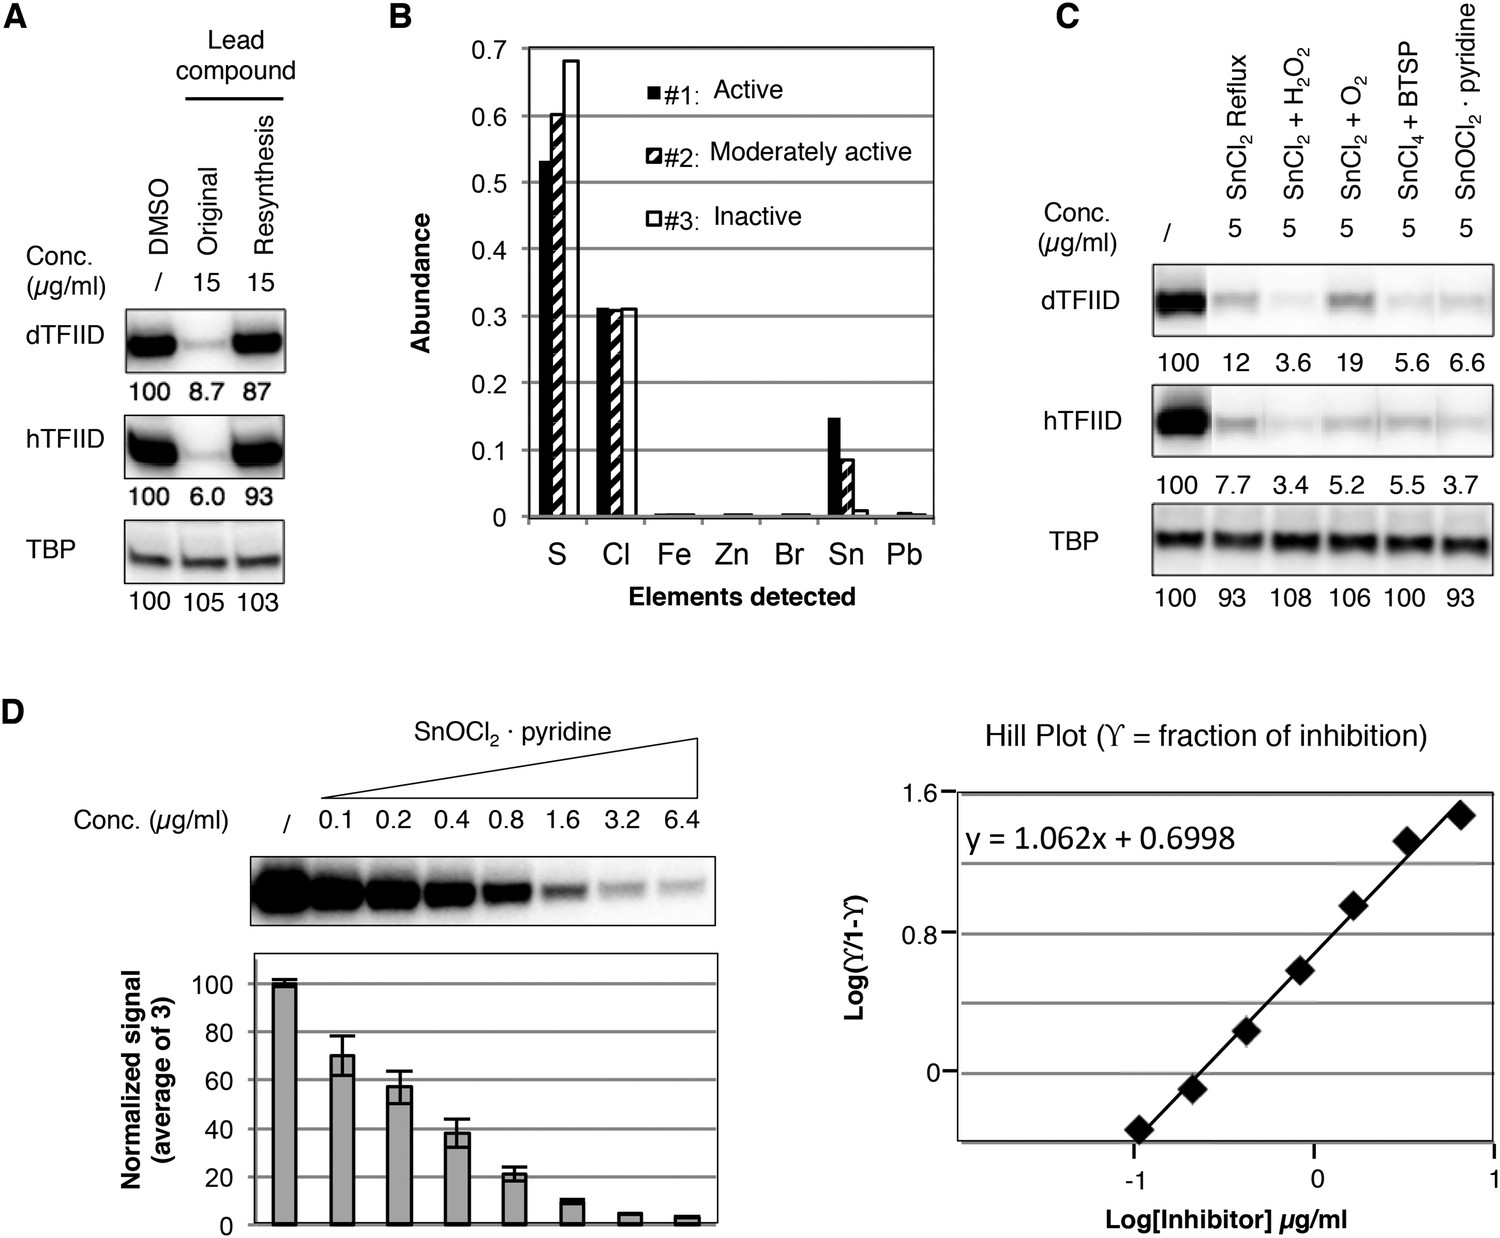
Identification of a tin(IV) oxochloride-derived cluster as the TFIID-specific transcription inhibitor.
(A) Inhibition of TFIID-directed transcription by the originally purchased lead compound (1, ChemDiv 7241-4207), but not the in-house resynthesized one. (B) Elemental analysis of three batches of analog compound (2) with varying levels of inhibitory activity (see Figure 3—figure supplement 1B,C). (C) Inhibition of TFIID-directed transcription by tin(IV) oxochloride synthesized using different methods. From left to right: DMSO control, SnCl2 refluxed in isopropanol, SnCl2 oxygenation with H2O2 or O2, and SnCl4 oxygenation with bis(trimethylsilyl) peroxide (BTSP), and SnOCl2 in complex with pyridine. (D) Dose response titration (left) and Hill Plot (right) of SnOCl2·pyridine inhibiting hTFIID-directed transcription. Three independent replicates were used for plotting. The Hill coefficient was 1.062.
Figure 3—figure supplement 1
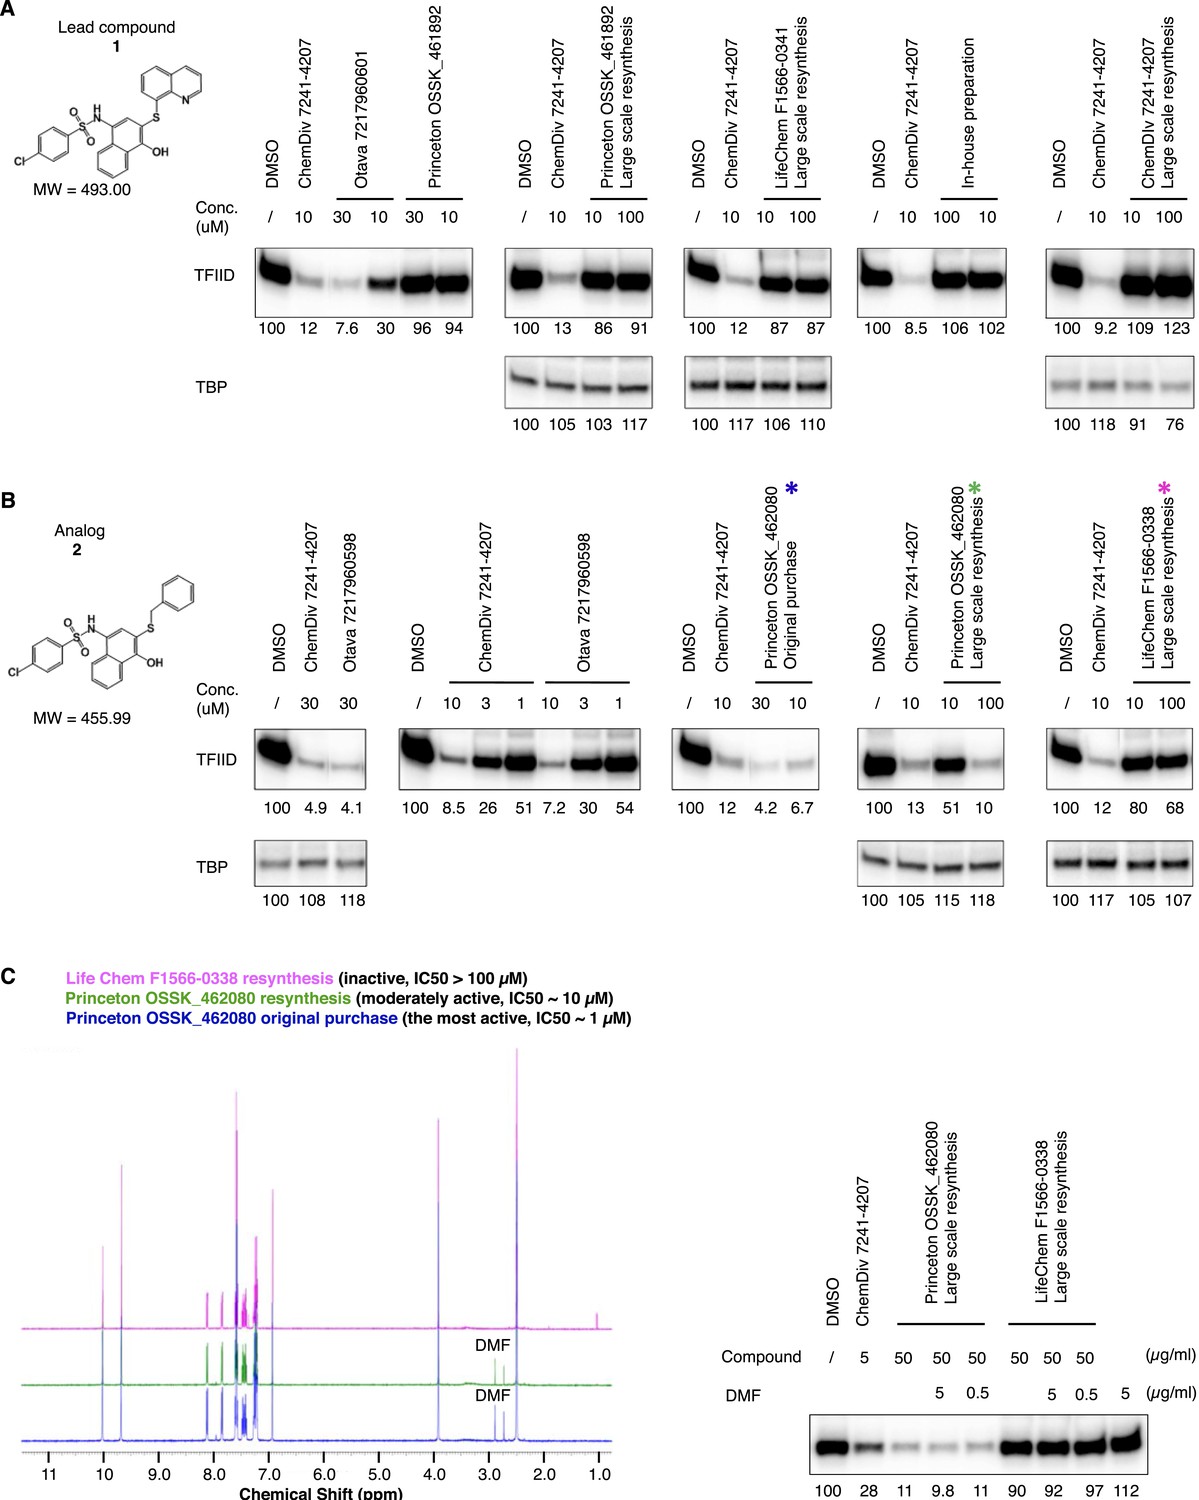
Discrepancy between organic compound structures and the transcription inhibitor activity of commercial compounds.
Transcription inhibition by lead compound 1 (A) and its analog 2 (B) from different sources. Because the actual inhibitory activity was found to be from minor contaminations unrelated to the assigned chemical structure, the reagents are named by an abbreviation of the vender name followed by the catalog number (or as ‘in-house’ preparation). ChemDiv 7241-4207 (original purchase, lead compound 1) was also used in (B) as a positive control for transcription inhibition. By analytical organic chemistry standards (nuclear magnetic resonance [NMR] and mass spectrometry), all these compounds are >95% ‘pure’. The three supplies of analog compound 2 subjected to elemental analysis (Figure 3B) are highlighted with colored stars (*) in (B), and their high-resolution NMR analysis results are shown in panel C (left). (C) (Right) is a hTFIID-directed transcription assay showing that the minor dimethylformamide (DMF) solvent contamination detected in the active materials by NMR as two chemical shifts between 2.5 and 3.0 ppm is irrelevant to the inhibitory activity.
Figure 3—figure supplement 2
Tracking of the TFIID inhibitory activity to a tin-containing complex.
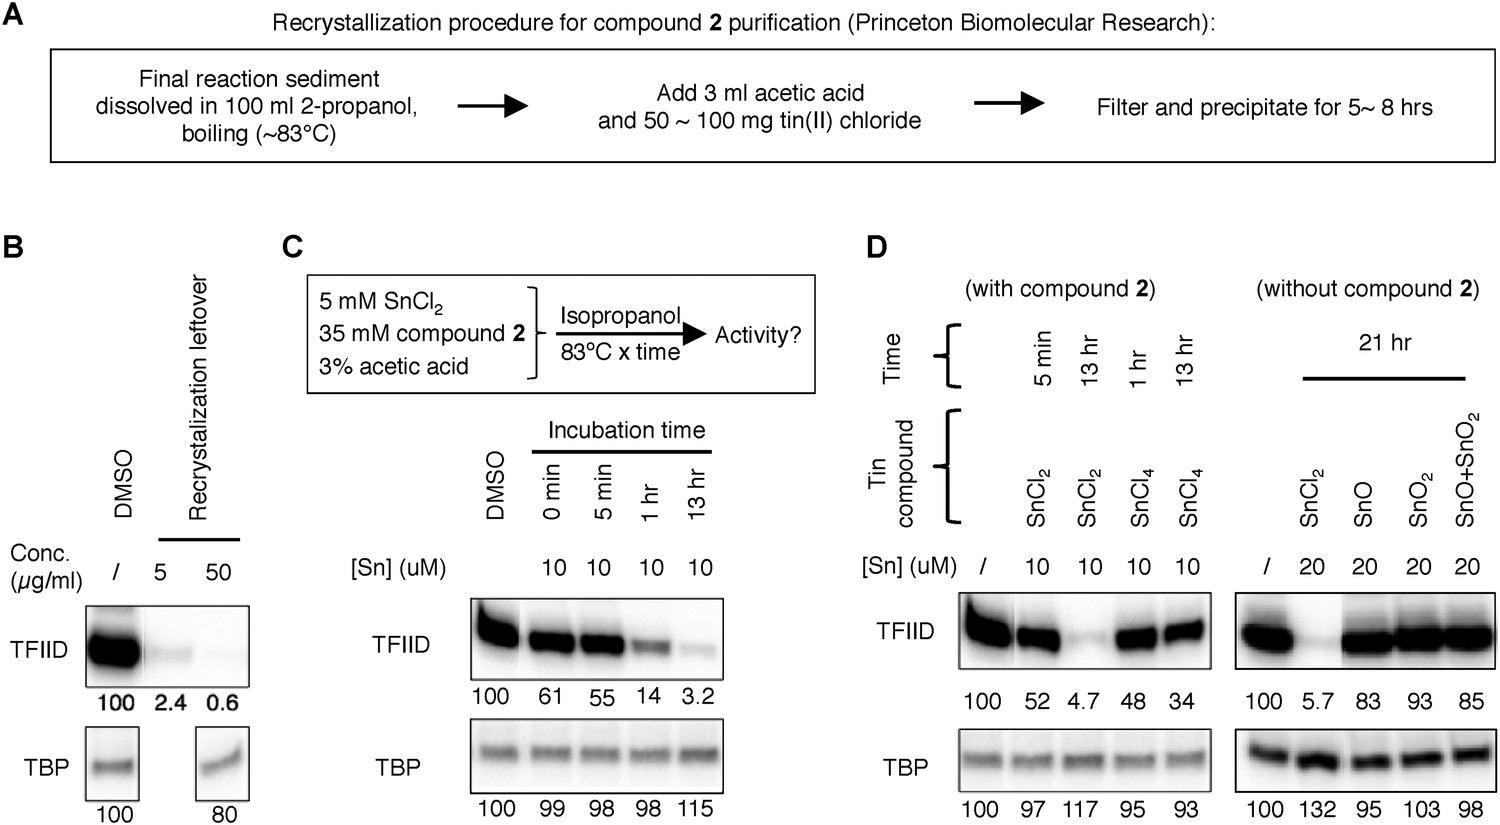
(A) Scheme of the recrystallization procedure provided by the vender for the resynthesis of Princeton OSSK_462080. (B) Detection of robust TFIID inhibitory activity within the recrystallization leftover. For comparison, the corresponding ‘pure’ chemical (Princeton OSSK_462080 large-scale resynthesis) only inhibited TFIID-directed transcription by twofold at 10 µM (4.6 µg/ml; 10-fold at 100 µM) (Figure 3—figure supplement 1B). (C) Recreation of the TFIID inhibitory activity by mimicking the recrystallization procedure. Top, the scheme. Inactive compound 2 (LifeChem F1566-0338 large-scale resynthesis), tin(II) chloride, and acetate acid were dissolved in isopropanol in a sealed container with atmosphere air and incubated at 83°C. Samples were taken at different time point and assayed for activity (with a final concentration equivalent to 10 µM elemental tin), as shown on the bottom. (D) Comparing different tin compounds in recreating the inhibitory activity, in the presence (left) or absence (right) of the inactive mother molecule (compound 2). The reaction conditions are as described in (C). Tin (II or IV) oxides were used as suspension in corresponding reactions.
Figure 3—figure supplement 3
Tin(IV) oxochloride-derived cluster identified as the TFIID-specific transcription inhibitor.
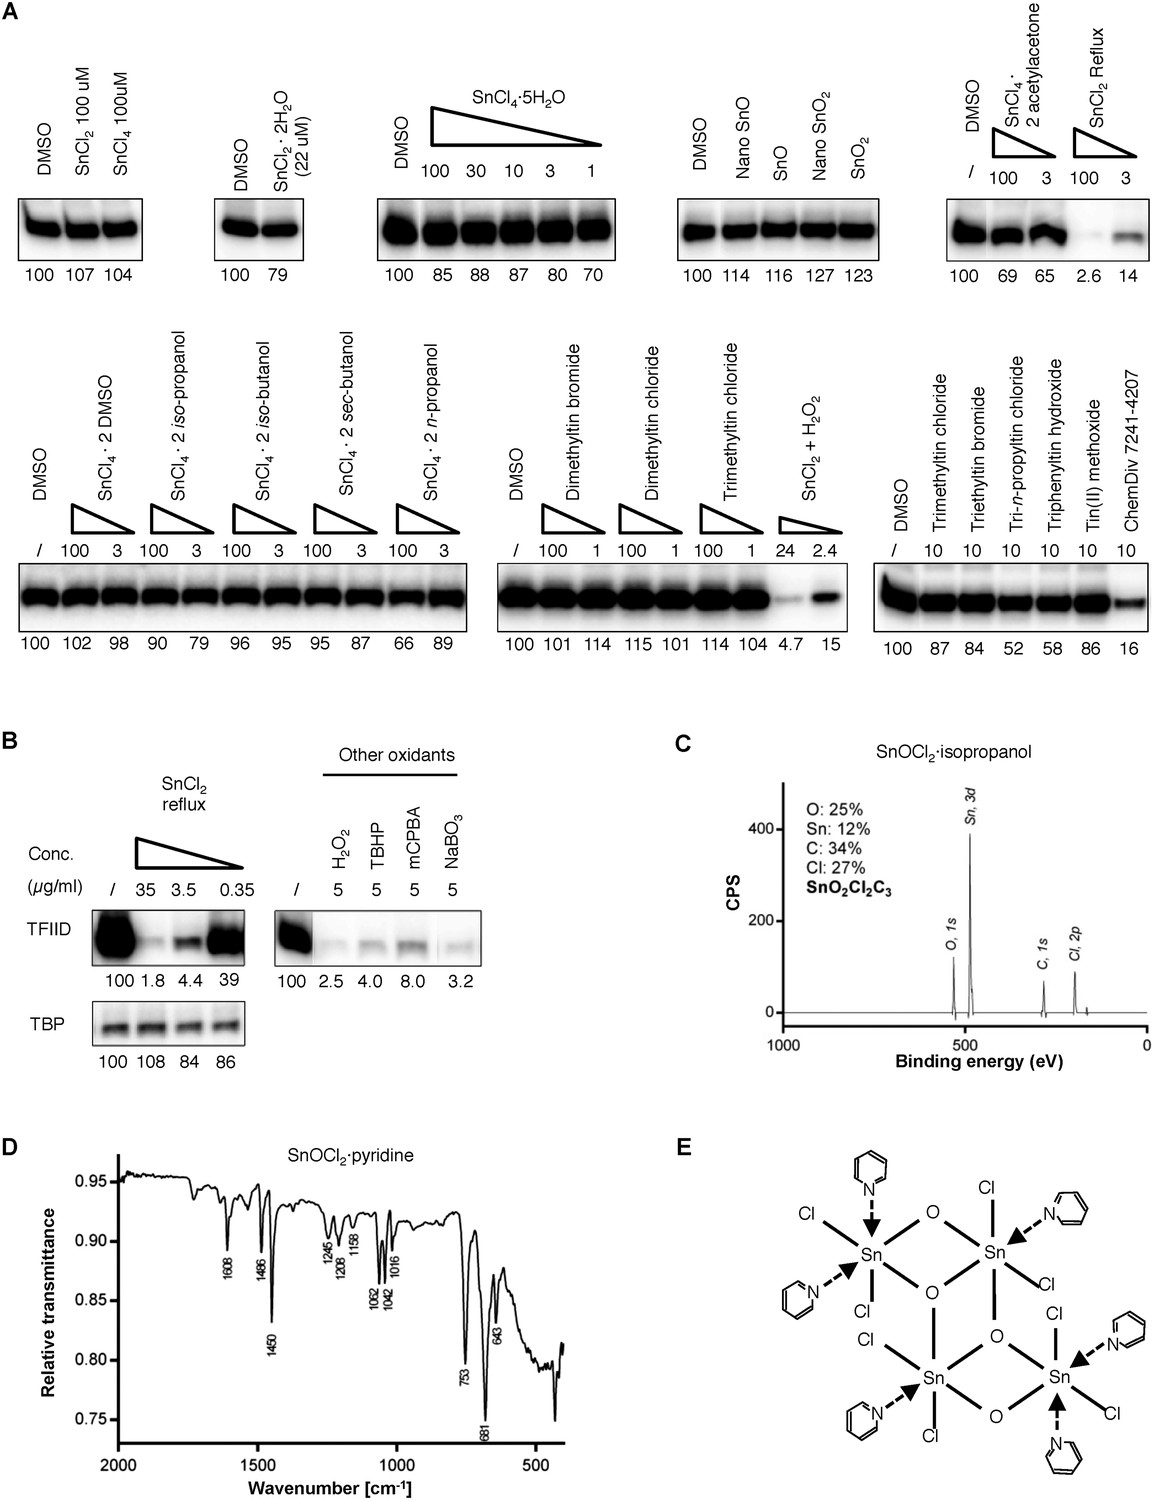
(A) Simple inorganic and organic tin-containing complexes tested for inhibition of TFIID-directed transcription. Nano particles (‘nano’) or regular tin oxide compounds were used as suspension (13.5 and 15.1 µg/ml for SnO and SnO2, respectively). Concentrations for the rest of the chemicals were expressed in µM. SnCl2 oxygenated by refluxing in air or H2O2 treatment (concentration expressed as elemental tin), or ChemDiv 7241-4207 (original purchase) was used as positive controls. (B) Oxygenation converts SnCl2 into the active species. Left: generation of the TFIID-specific inhibitory activity by refluxing SnCl2 in isopropanol under air atmosphere. Right: TFIID-inhibitory activity generated by other oxygenation methods (H2O2: hydrogen peroxide; TBHP: tert-butyl hydroperoxide; mCPBA: m-chloroperbenzoic acid; NaBO3, sodium perborate). (C) In-house X-ray photoinduced spectroscopy (XPS) elemental analysis of tin(IV) oxochloride prepared by refluxing in isopropanol. The atomic ratio of Sn:O:Cl:C of ∼1:2:2:3 is consistent with SnOCl2 coordinating with isopropanol at a ratio of 1:1. (D) Infrared spectrum of tin(IV) oxochloride in complex with pyridine. Marked peaks match those reported previously (Dehnicke, 1961). (E) Hypothetical structure of a tin oxochloride tetramer coordinated with pyridines, explaining the proposed 2:3 coordination ratio (Dehnicke, 1961). Similar ladder-like tin(IV)-oxo backbone structures have been reported for tin (IV) compounds (Holmes et al., 1987). Multiple histidine residues, when presented in close vicinity from a surface of a protein, are expected to replace these individual pyridines, as driven by entropy.
Figure 4 with 1 supplement

The inhibitor targets an IDR of TAF2 through histidines.
(A) Binding of GST-dTAF2 (1125–1221) to the lead compound 1 (ChemDiv 7241-4207) (yellow arrow head) in the microarray. GST antibody was used for detection. Recombinant GST protein was the control. (B) Alignment of dTAF2 and hTAF2 C-terminal IDRs, with the conserved repetitive motifs highlighted. (C–F) Surface plasmon resonance sensorgrams of synthetic tin(IV) oxochloride cluster binding to GST-dTAF2 (1125–1221) (C, D) or Halo-hTAF2 (990–1199) (E, F) fragment, under varying imidazole concentrations (C, E) or pH (D, F) (R.U.: resonance unit).
Figure 4—figure supplement 1
The intrinsically disordered nature of metazoan TAF2 C-terminus and the stringent conservation of and around the low-complexity sequences.
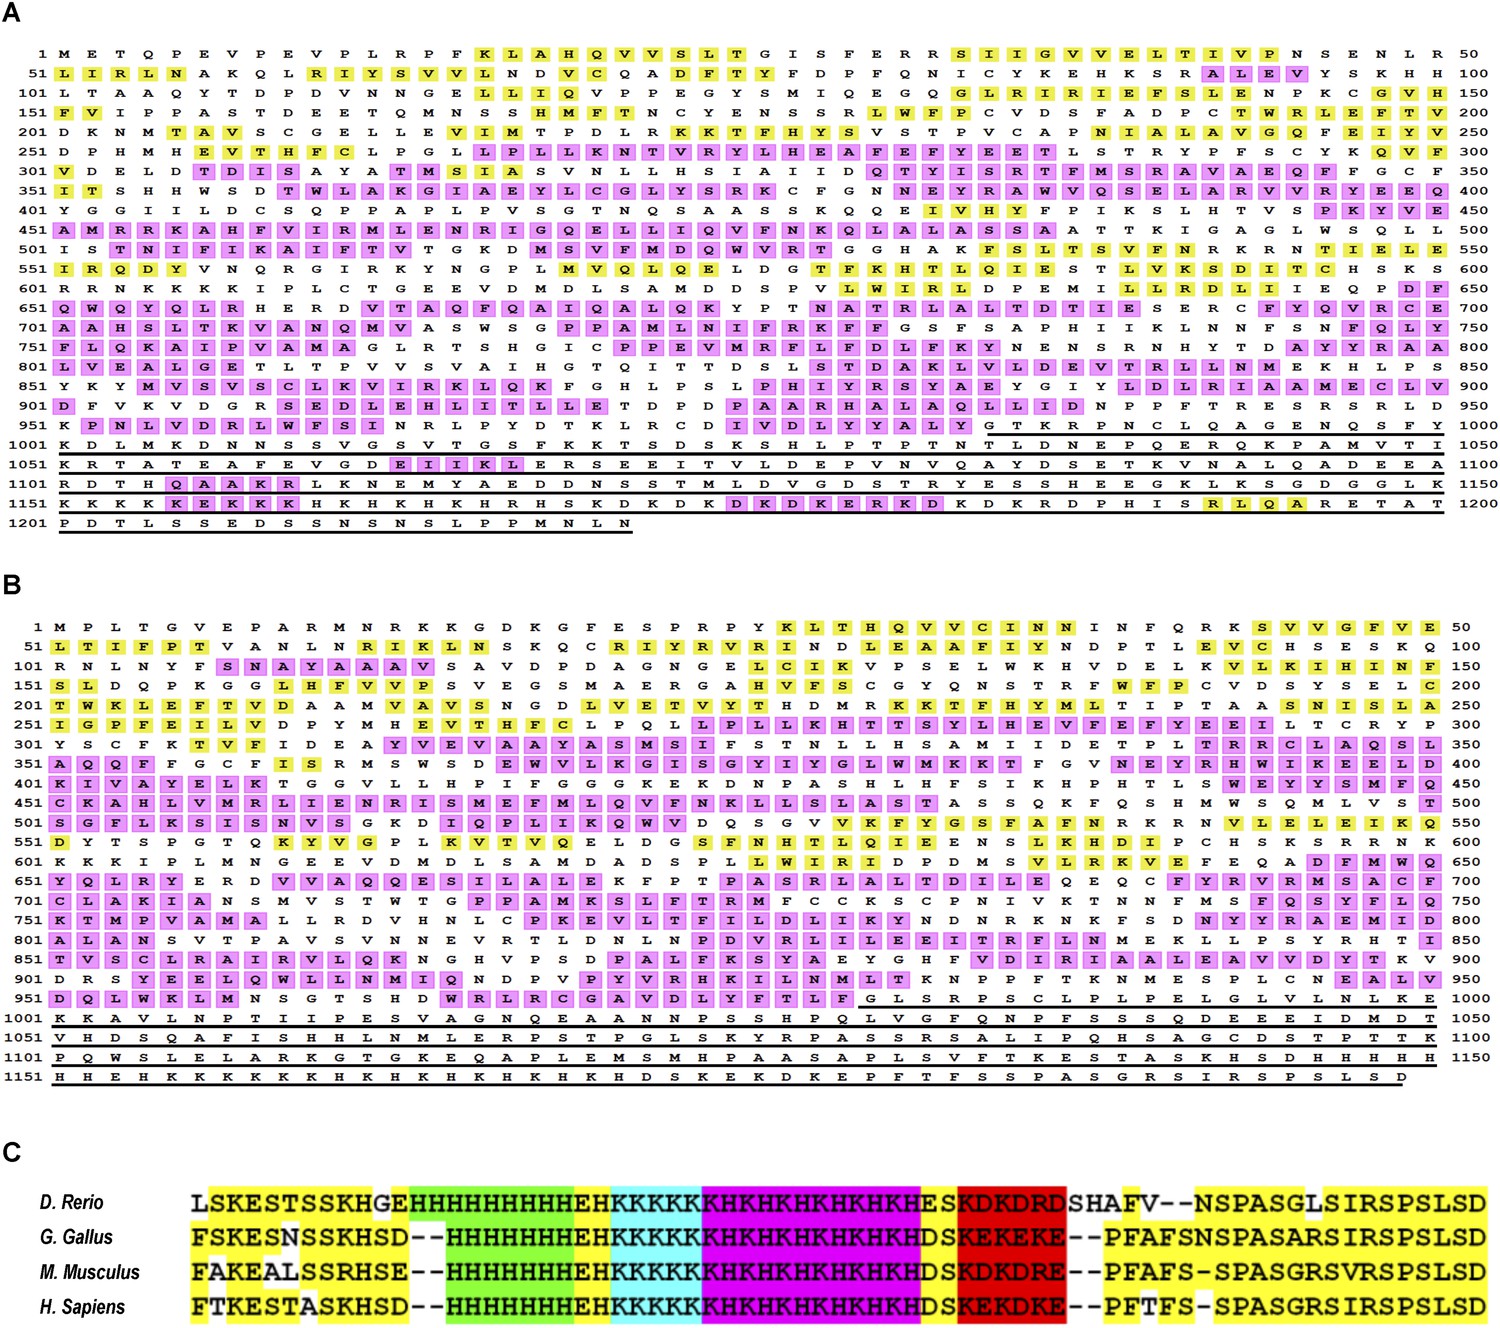
Full-length TAF2 proteins from Drosophila (A) or human (B) were analyzed for protein-disordered region (http://bioinf.cs.ucl.ac.uk/psipred/?disopred=1). The predicted α-helix and β-sheet structures are highlighted in purple and yellow, respectively, and the C-terminus-disordered regions are underscored. (C) Alignment of the very C-terminus of TAF2 proteins from multiple vertebrates. The low-complexity sequences and other well-conserved residues were highlighted in distinct colors.
Figure 5 with 1 supplement
The inhibitor and DNA synergistically bind to the TAF2 IDR.
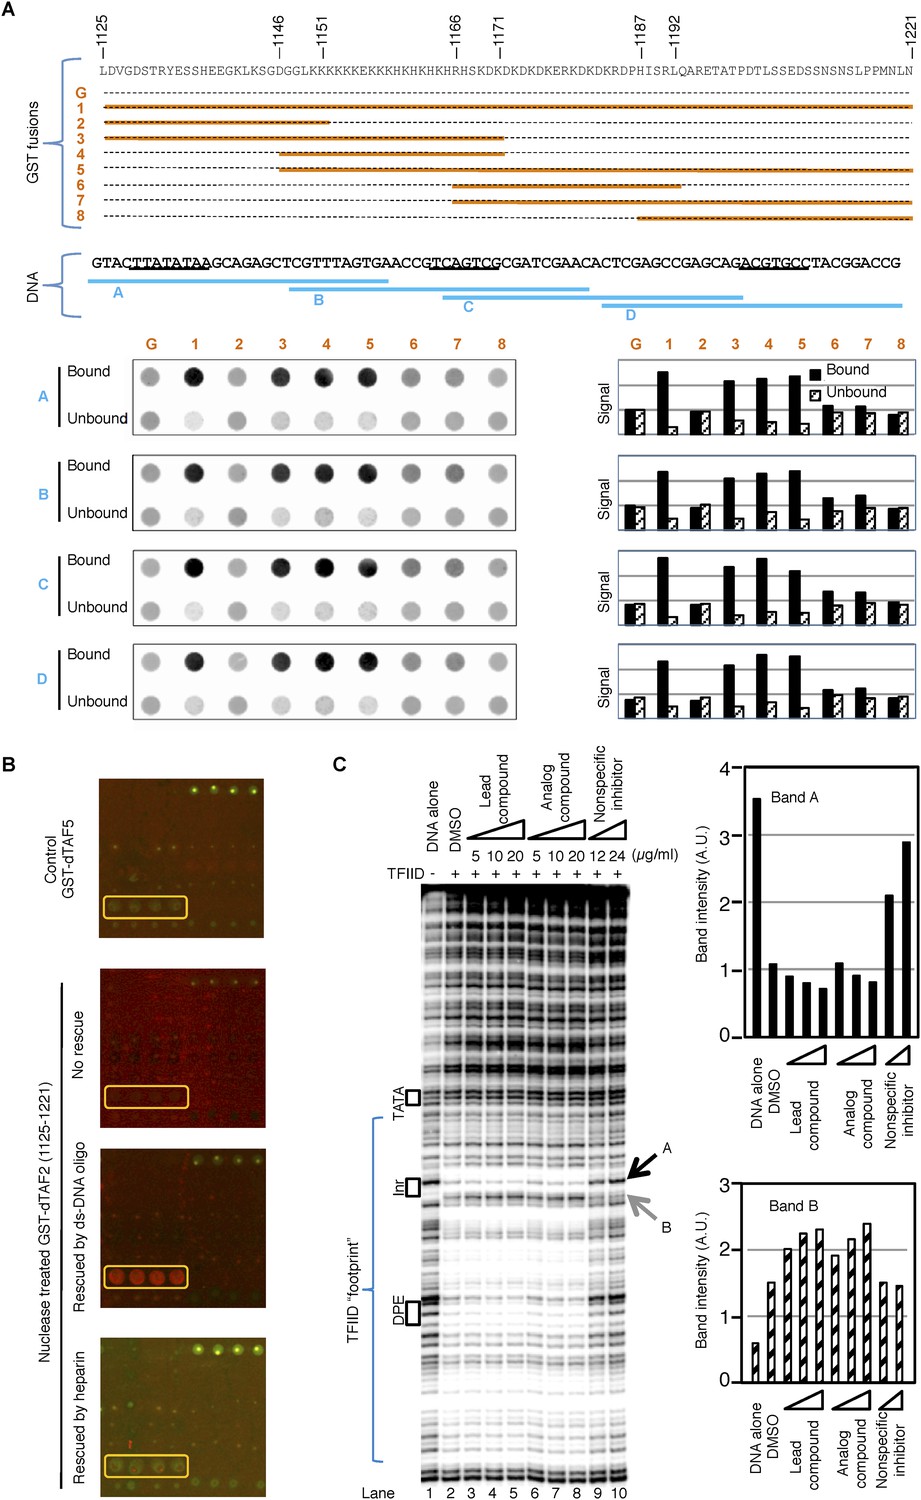
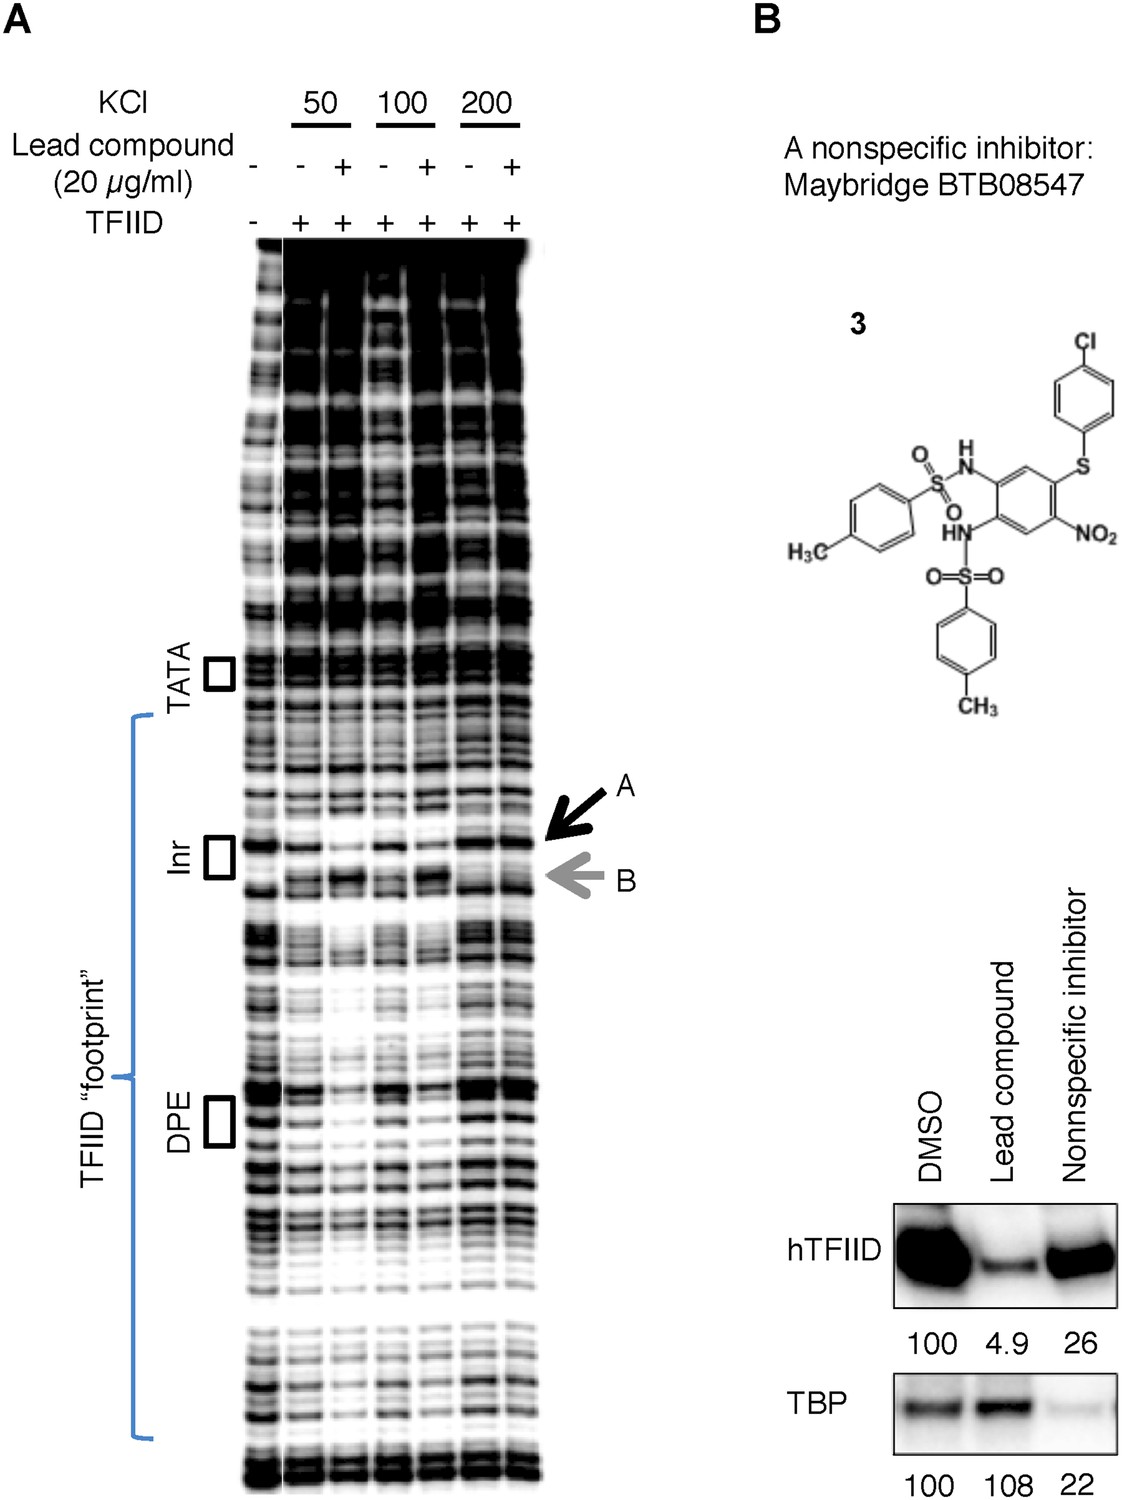
(A) GST pull-down of double-stranded (ds) DNA oligonucleotides by GST-dTAF2 fragments. Top, the GST fusions (G: GST alone). Middle, the four DNA fragments tested, which are parts of the SCP1 (Juven-Gershon et al., 2006) used in this study (sequence shown, with the TATA, Inr, and DPE elements, from left to right, underscored). Bottom, DNA staining raw images (left) and bar representation of the bound/unbound DNA signals (right). (B) Binding of nuclease-treated GST-dTAF2 (1125–1221) to the lead compound 1 (ChemDiv 7241-4207) printed in quadruplicates in the microarray (yellow rectangle), and its rescue by a double-stranded (ds)DNA oligonucleotide (1 µg/ml) or heparin (2 µg/ml). GST antibody was used for detection. Recombinant GST-dTAF5 was used as a negative control. (C) DNase I footprinting assay on TFIID-promoter binding, in the presence of the lead compound (1, ChemDiv 7241-4207), a structural analog (2, Princeton OSSK_462080), or an unrelated, non-specific (NS) inhibitor (Maybridge BTB08547, see Figure 5—figure supplement 1B). Shown is the digestion product of the end-labeled DNA template separated by gel electrophoresis. The DNA template contains the SCP1. Black boxes depict the positions of the TATA, Inr, and DPE elements, respectively. Blue bracket indicates the ‘footprint’ of TFIID. For simplicity, only two bands (denoted by arrowheads), which were protected (A) or intensified (B) upon TFIID binding, were selected for quantification (right).
Figure 5—figure supplement 1
(A) DNase I footprinting assay of TFIID-promoter binding and its enhancement by the specific inhibitor at different salt concentrations.
(B) A non-specific inhibitor (Maybridge BTB08574): its structure (top) and inhibition of both TFIID- and TBP-directed transcription (bottom). The lead compound used here was ChemDiv 7241-4207.
Figure 6 with 1 supplement

Tin(IV) oxochloride cluster specifically blocks de novo transcription initiation at the step of Pol II engagement.
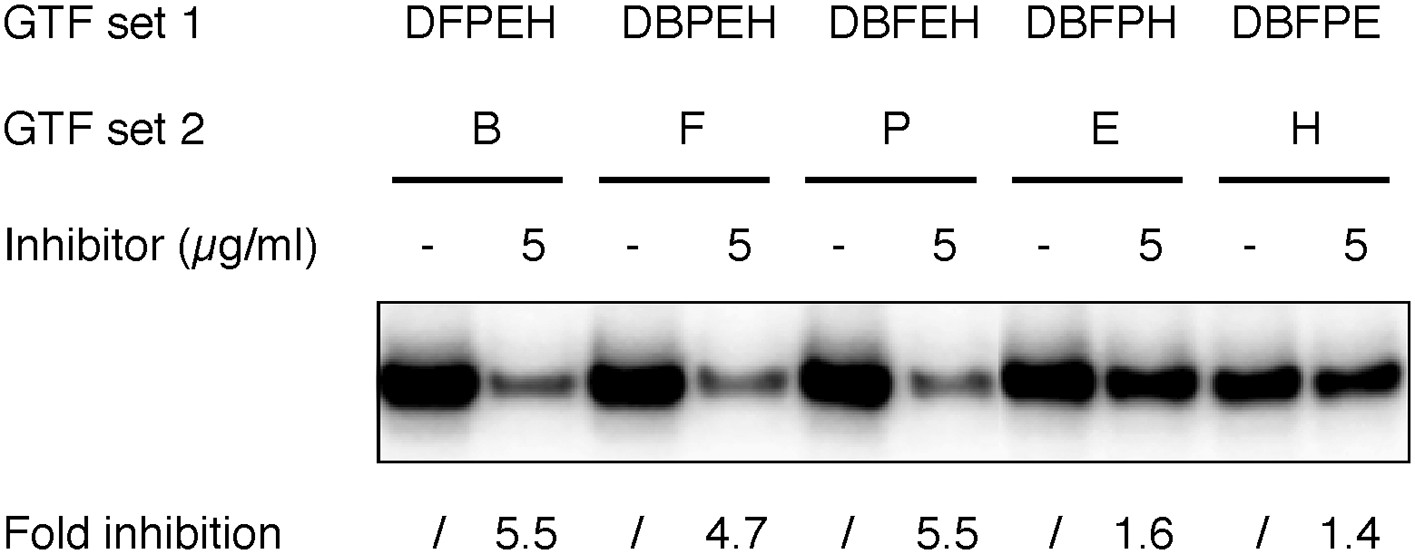
(A) Analysis of the first dinucleotide synthesis. Left, the scheme of the experiment. Green ‘A’ is where transcription starts. ATP and GTP are sufficient for the formation of the first phosphodiester bond at the SCP1. Right, the autoradiography image of the dinucleotide products. (B) Scheme of the step-wise PIC assembly perturbation experiment. The cartoon illustrates the question under investigation—which step of PIC assembly is inhibited. In box is the flow chart of the experiment. Inhibitor was added to the reaction after a subset of GTF (set 1) was incubated with the template DNA, followed by the addition of the rest of the protein factors (GTF set 2) for PIC assembly. All four nucleoside triphosphates (NTPs) were added in the end to allow RNA synthesis. (C) Gel image and quantification of transcription inhibition by treatment at different stages of PIC assembly. D, B, E, F, H, and P represent TFIID, TFIIB, TFIIE, TFIIF, TFIIH, and Pol II, respectively. ‘/’ indicated the lack of any protein factor in GTF set 1 or 2. On the left part (lanes 1–14), GTF set 1 contains protein factors added incrementally one by one (from none to the complete set) following the order of in PIC assembly (Roeder, 1996). On the right part (lanes 11–14), individual factors were omitted in GTF set 1. SnOCl2·pyridine was used at 5 µg/ml (A) or 2.5 µg/ml (B) as the inhibitor.
Figure 6—figure supplement 1
The originally purchased lead compound specifically blocks de novo transcription initiation at the step of Pol II engagement.
Refer to Figure 6 legends for more details. The inhibitor used here was ChemDiv 7241-4207 (original purchase).
Figure 7

DNase I footprinting assays monitoring PIC assembly and structural isomerization.
(A) Early steps of PIC assembly. Specified GTFs were incubated with the end-labeled DNA template, followed by DNase I digestion. Blue bracket highlights the TFIID footprint. The numbers are relative to the transcription start site (+1). (B) Arresting of the conformational isomerization. Top, the scheme. The inhibitor used here was SnOCl2·pyridine. Lanes 1 and 9 are 10 bp DNA ladder. Lanes 2 and 10 are digestion of naked DNA. The lower case ‘d’ and ‘f’ in lanes #11–14 reflect the use of less TFIID and TFIIF (together with the omission of spermidine and carrier nucleic acid in the reaction—see ‘Material and methods’ for detail). Letter abbreviations are explained in Figure 6 legend.
Figure 8 with 1 supplement
Template commitment of TFIID and its resistant to tin(IV) oxochloride inhibition during reinitiation.
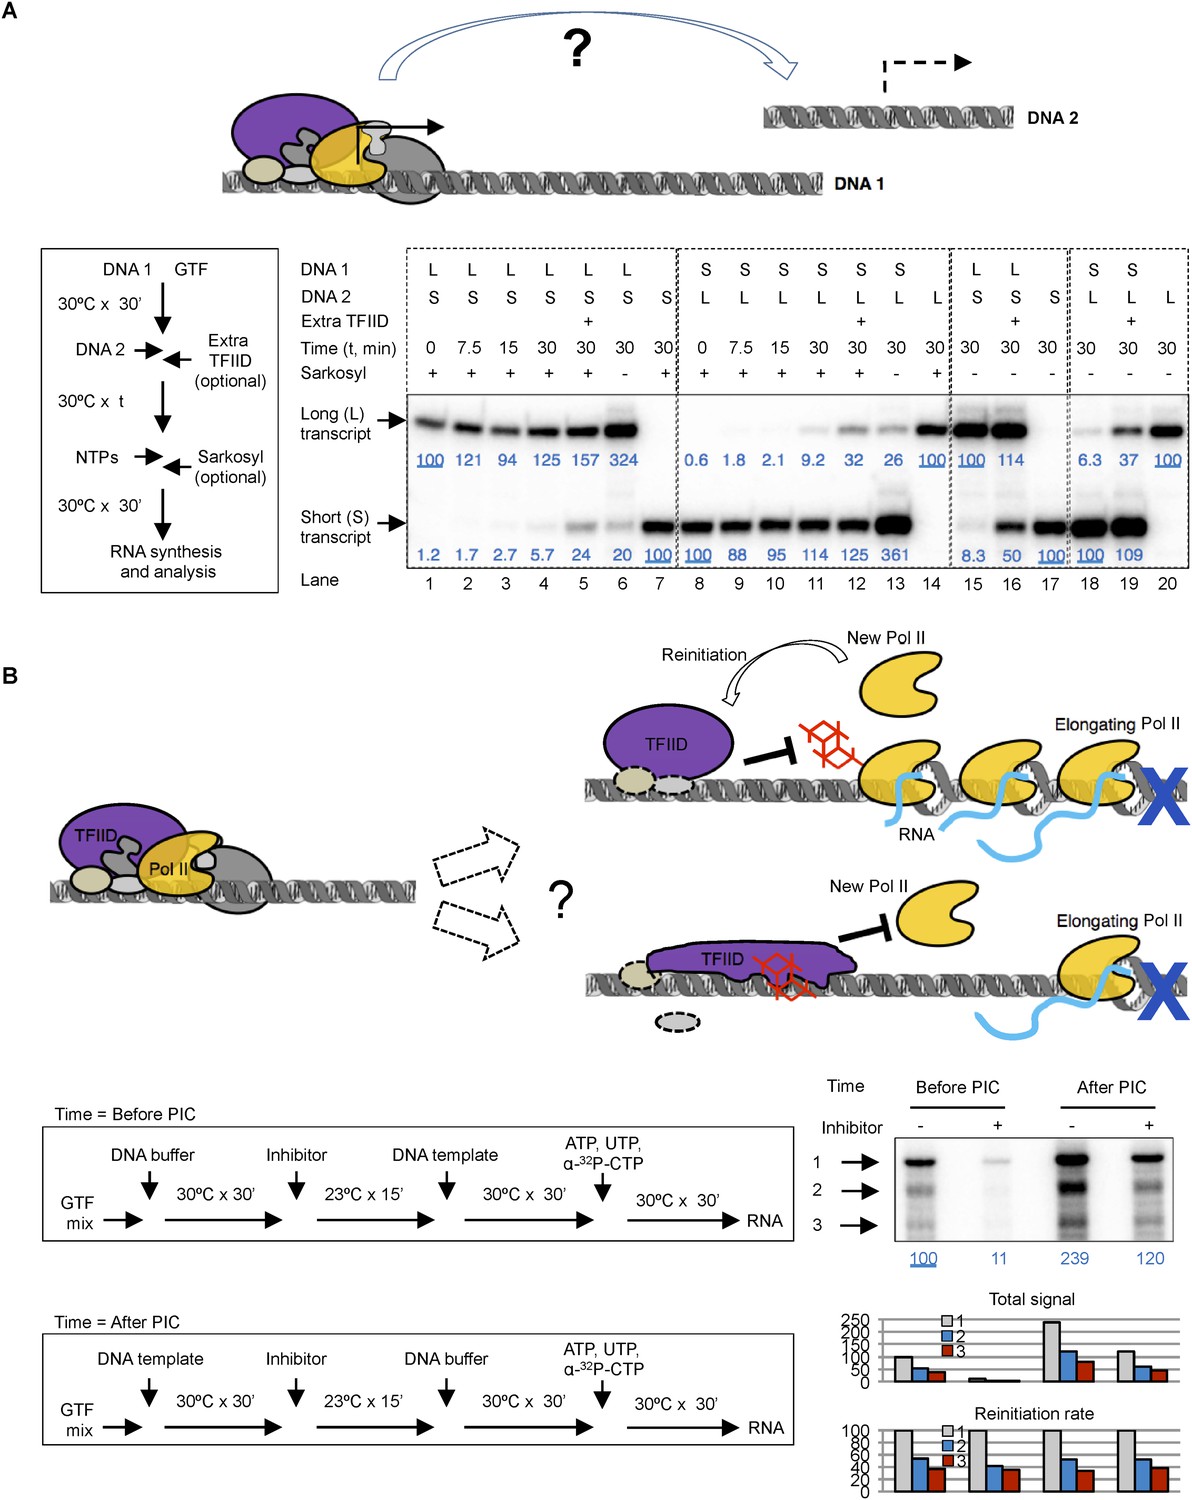
(A) Two-template assay to test the template commitment of GTFs. The cartoon illustrates the question. Bottom left is the experimental scheme. After PIC assembled on the first DNA template (DNA 1), the second DNA template (DNA 2) was added (as an option, onefold extra TFIID can also be added immediately following DNA 2) and incubated for specified time, followed by the addition of nucleoside triphosphates (NTPs) for RNA synthesis. Sarkosyl was added to a final concentration of 0.1% (within 30 s after the addition of NTPs) as an option to restrict transcription to a single-round. The two DNA templates both contain a SCP1, but lead to primer extension products of different length (L: long, 192 bases; S: short, 155 bases). Bottom right is the results, sub-divided into four groups (dashed boxes). The transcription signals were normalized within each group for each (L or S) specific primer extension product (shown in blue immediately under the specific bands). (B) Comparison of single-round transcription vs multiple-round transcription. The cartoon illustrates the question to address: whether TFIID in the reinitiation scaffold is sensitive to inhibition or not. Blue ‘x’ indicates the position of the first G residue where the first Pol II will be stalled in the absence of GTP. Bottom left is the scheme. ‘DNA buffer’ contained no template DNA. SnOCl2·pyridine was used as the inhibitor. Bottom right is the result. Black arrows indicate the bands corresponding to the first (1), second (2), and third (3) transcript synthesized from the DNA template. Blue numbers are the normalized quantification of the first transcript from each lane. All three band intensity is plotted as ‘Total signal’ (the first transcript of the first lane from the left was arbitrarily set as 100). Reinitiation rate was plotted by setting the first transcript of each lane as 100 (to calculate the chance of the second and third round of transcription to occur in each reaction).
Figure 8—figure supplement 1
Controls for reinitiation experiments.
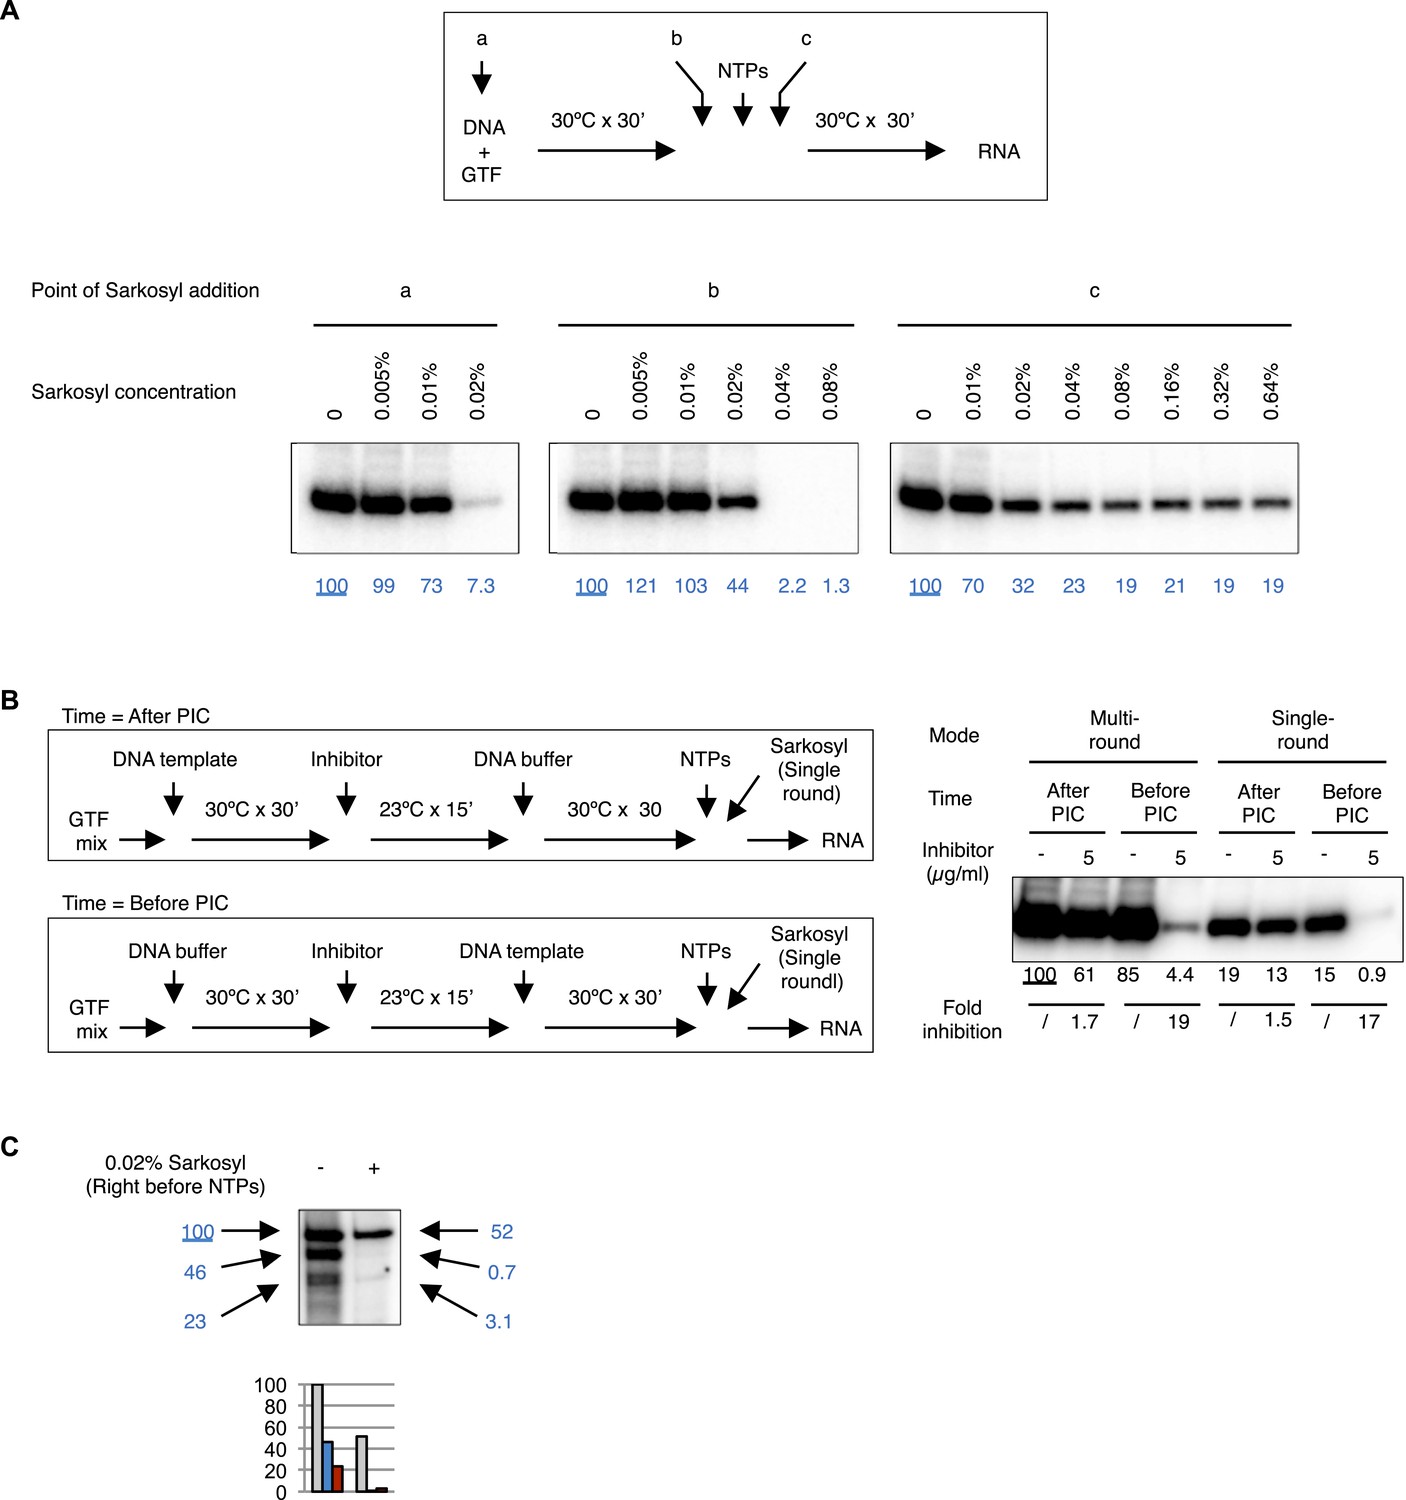
(A) Sarkosyl titration. Sarkosyl was added at the beginning of PIC assembly (a), immediately (within 30 s) before (b) or after (c) the addition of NTPs (top scheme), and the effect on transcription was detected by primer extension (bottom images). In blue are the normalized transcription signals. (B) Comparison of single-round transcription vs multiple-round transcription using Sarkosyl treatment. Left, the scheme. Right, the image of the primer extension products. The transcription signals were quantified, normalized, and fold of inhibition under each condition were calculated. 0.1% Sarkosyl was added within 30 s after NTPs to restrict transcription to a single round. (C) Sarkosyl control for the G-less cassette transcription. 0.02% Sarkosyl was added right before the addition of NTPs to prevent reinitiation. Black arrowheads points to the bands corresponding to the first, second, and third transcript synthesized from the same DNA templates, and their signals were quantified, normalized (the blue numbers), and plotted below the image.
Figure 9
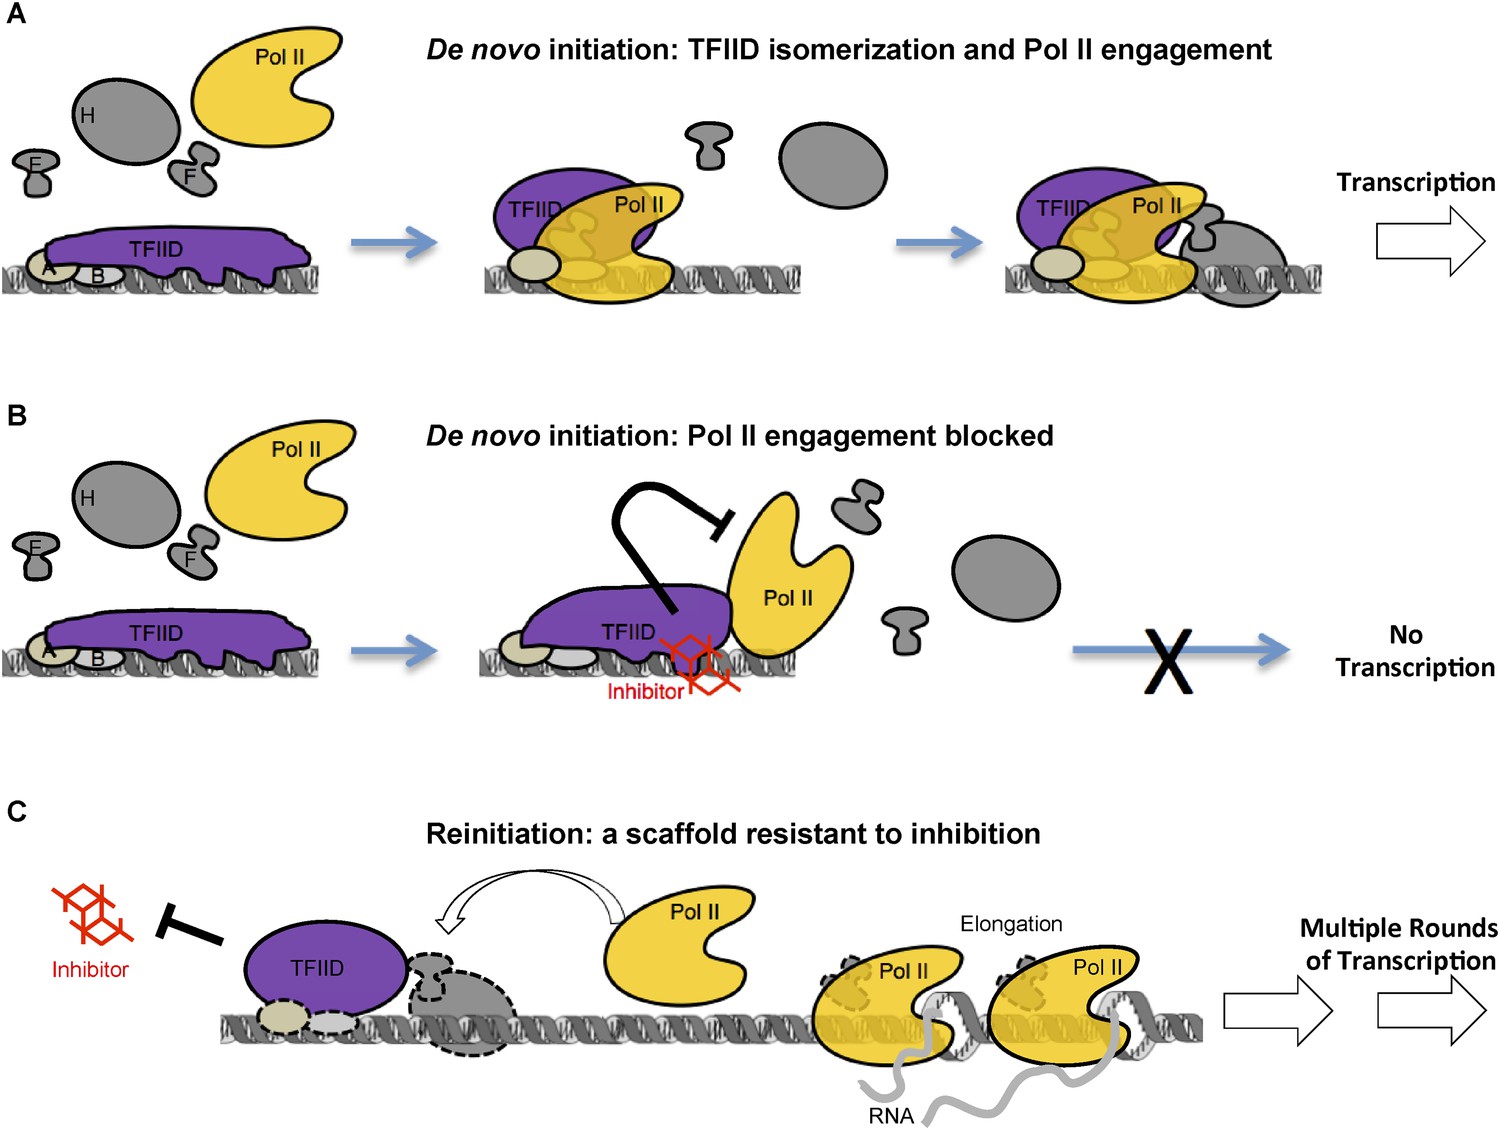
A model of inhibition that mechanistically distinguishes the two modes of transcription initiation.
(A) Initially, TFIID forms multiple contacts with an extended promoter DNA region that is stabilized by TFIIA and TFIIB. TFIIA doesn't affect transcription at this promoter with purified factors, but it does facilitate the TATA box protection by TFIID alone (Cianfrocco et al., 2013) or by TFIID together with TFIIB (ZZ and RT unpublished). We propose a critical isomerization step during de novo PIC assembly involving a TFIID conformational change (i.e., release of at least part of the promoter DNA, illustrated by the change in the shape of TFIID) to allow entry and engagement of Pol II. Once Pol II becomes engaged and further stabilized by other factors (TFIIE, TFIIF, etc) transcription can proceed. (B) The inhibitor, by binding and interfering with the TAF2 IDR, arrests TFIID isomerization and Pol II engagement, thus, blocking the assembly of a functional PIC. DNase I footprint assay reveals that Pol II molecules can still partially interact with the downstream portion of promoter DNA in the presence of the inhibitor. (C) Once the first round of Pol II engagement is accomplished and isomerization has occurred, the PIC intermediate establishes a state resistant to inhibition. After Pol II enters the elongation phase, TFIID remains at the isomerized state as part of a reinitiation scaffold. This reinitiation complex bypasses the initial stages of de novo PIC assembly where TFIID contacts an extended DNA region and thus is resistant to the inhibition by the tin(IV) oxochloride cluster. In addition, this shortcut may be a mechanism for the reinitiation scaffold to facilitate reloading of more Pol II molecules.
Download links
A two-part list of links to download the article, or parts of the article, in various formats.
Downloads (link to download the article as PDF)
Open citations (links to open the citations from this article in various online reference manager services)
Cite this article (links to download the citations from this article in formats compatible with various reference manager tools)
Chemical perturbation of an intrinsically disordered region of TFIID distinguishes two modes of transcription initiation
eLife 4:e07777.
https://doi.org/10.7554/eLife.07777


