KPNB1 mediates PER/CRY nuclear translocation and circadian clock function
- Perelman School of Medicine at the University of Pennsylvania, United States
- Howard Hughes Medical Institute, University of Pennsylvania Perelman School of Medicine, United States
Figures
Figure 1 with 2 supplements
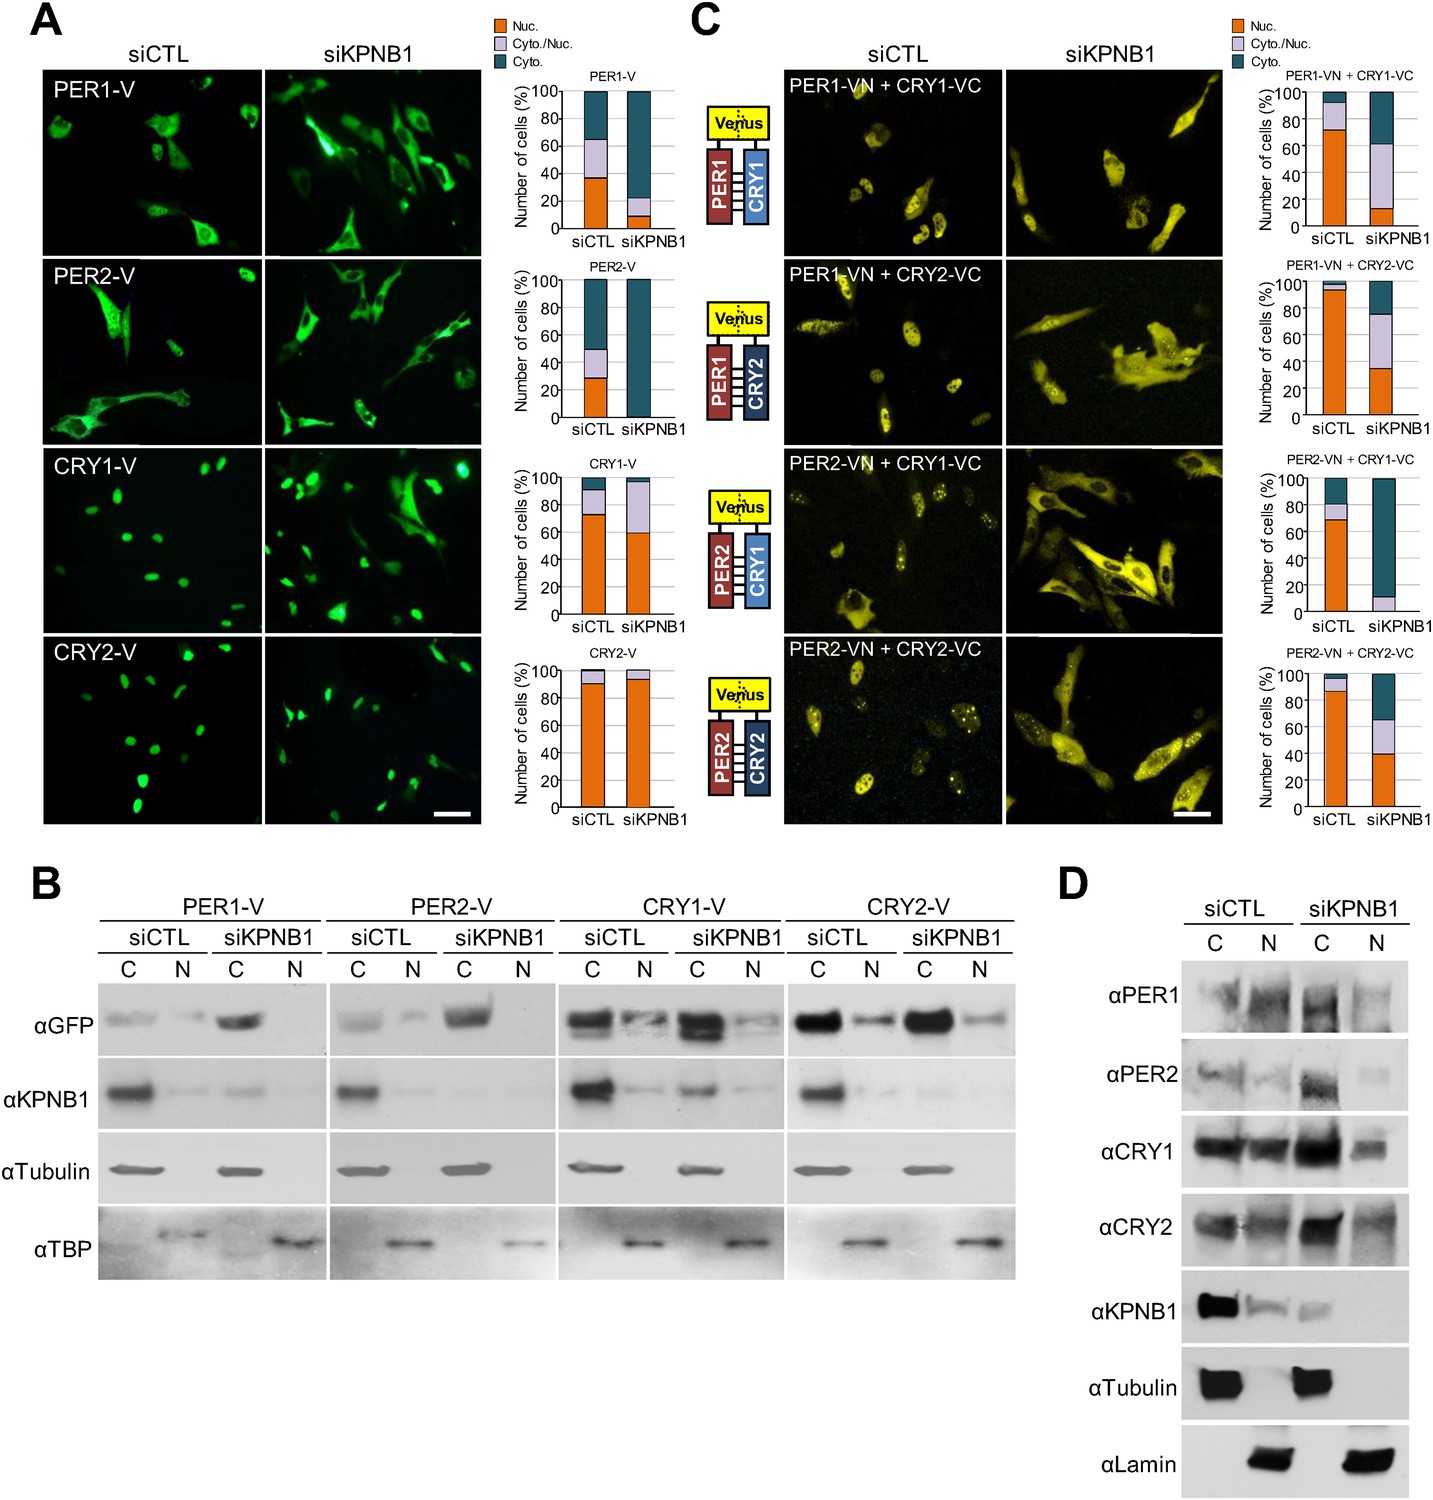
KPNB1 knockdown blocks nuclear translocation of PERs/CRYs complex.
(A) Fluorescence microscopic analysis of the effect of KPNB1 depletion on subcellular localization of PER1, PER2, CRY1, and CRY2. Representative fluorescence images of U2 OS cells expressing Venus-tagged PER1, PER2, CRY1, and CRY2 (PER1-V, PER2-V, CRY1-V, CRY2-V) in the presence of control and KPNB1 siRNA (left). Quantification of the subcellular distribution of the imaged cells (right). Subcellular localization is categorized as nuclear (Nuc.; orange), cytoplasmic and nuclear (Cyto./Nuc.; gray), and cytoplasmic (Cyto.; blue-green). More than 100 fluorescent cells for each of the images were evaluated. Scale bar: 30 µm. (B) Immunoblot analysis of nuclear and cytoplasmic extracts of U2 OS cells expressing PER1-V, PER2-V, CRY1-V, and CRY2-V in the presence of control and KPNB1 siRNA using the indicated antibodies to GFP for Venus fused proteins (αGFP), KPNB1 (αKPNB1), Tubulin for cytoplasmic fraction (C) marker (αTubulin), and TATA box binding protein (TBP) for nuclear fraction (N) marker (αTBP). Representative images from two independent experiments are shown. (C) Bi-molecular fluorescence complementation analysis of the effect of KPNB1 depletion on subcellular localization of PER1/2-CRY1/2 dimeric complex in various combinations in U2 OS cells. Representative fluorescence images of cells expressing Venus N terminal (VN) or C-terminal (VC)-tagged PER1, PER2, CRY1, and CRY2 (PER1-VN, PER2-VN, CRY1-VC, CRY2-VC) as indicated combinations in the presence of control (siCTL) and KPNB1 siRNA (siKPNB1) (left). Quantification of the subcellular distribution of the imaged cells (right). Subcellular localization is categorized as nuclear (Nuc.; orange), cytoplasmic and nuclear (Cyto./Nuc.; gray), and cytoplasmic (Cyto.; blue-green). More than fluorescent 100 cells for each of the images were evaluated. Scale bar: 30 µm. (D) Immunoblot analysis of nuclear and cytoplasmic extracts of U2 OS cells in the presence of control and KPNB1 siRNA using the indicated antibodies for endogenous PER1 (αPER1), PER1 (αPER2), CRY1 (αCRY1), CRY2 (αCRY2), KPNB1 (αKPNB1), Tubulin for cytoplasmic fraction (C) marker (αTubulin), and Lamin for nuclear fraction (N) marker (αLamin). Representative images from three independent experiments are shown.
Figure 1—figure supplement 1
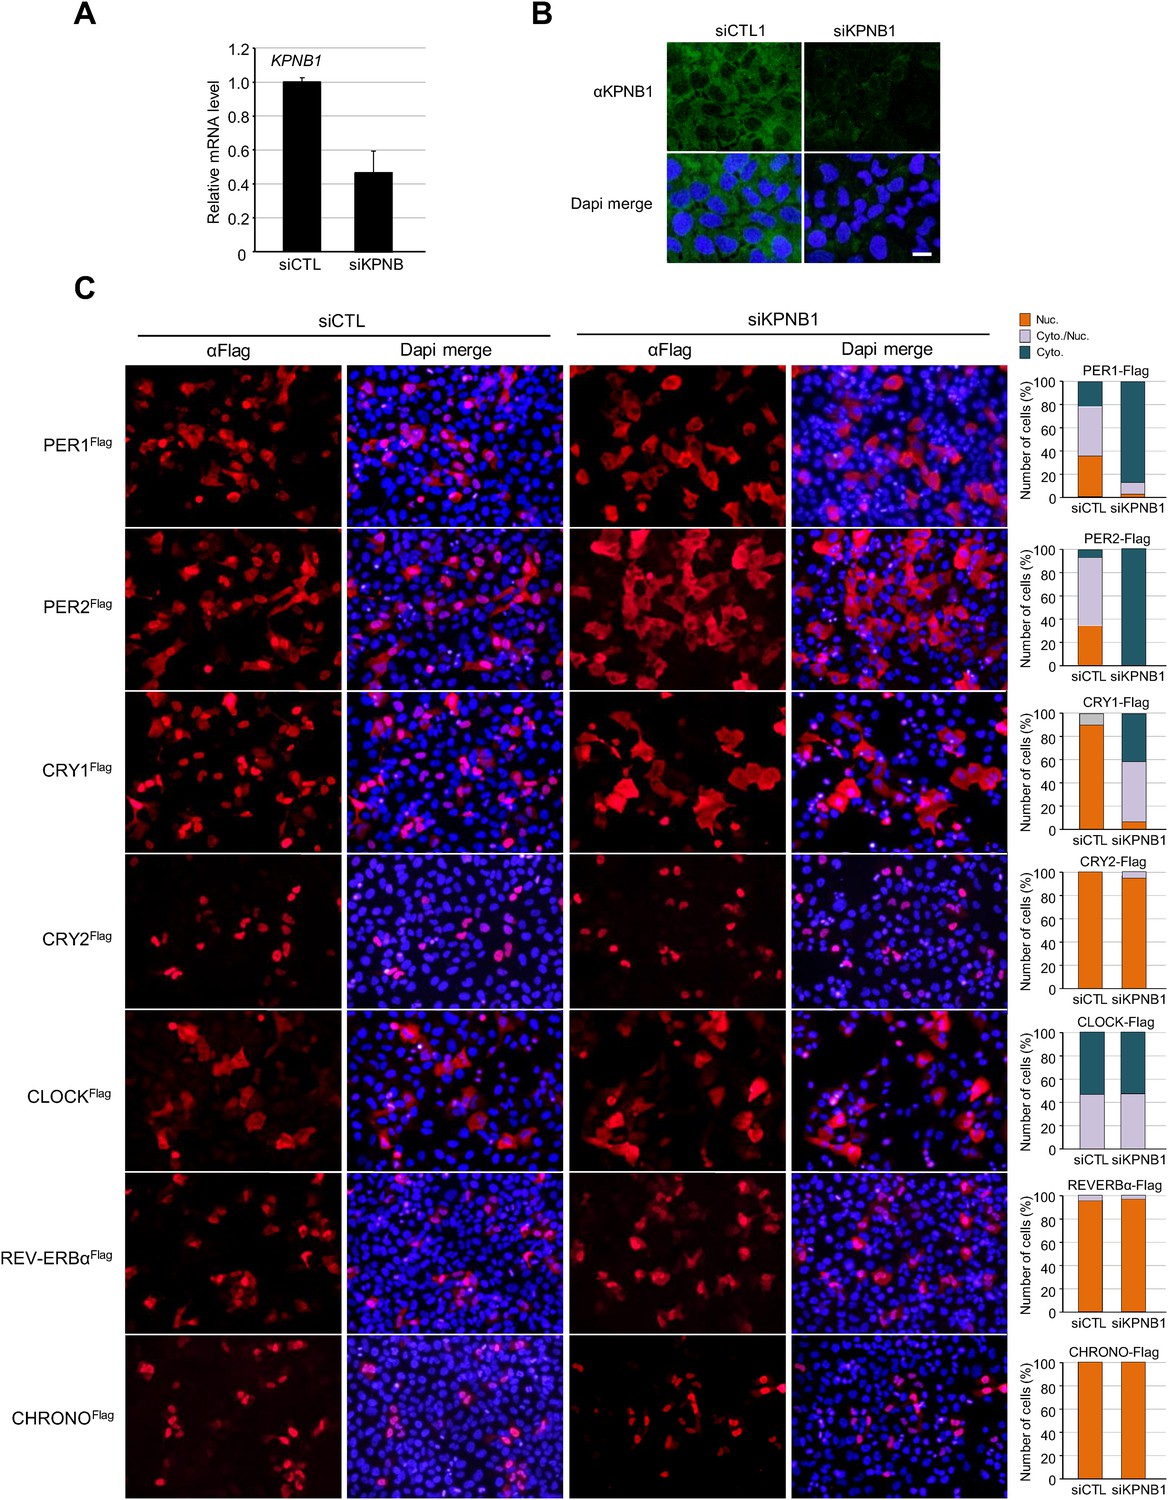
Inhibition of KPNB1 alters nuclear localization of core clock repressor proteins.
(A) Quantitative RT-PCR analysis of KPNB1 knockdown efficiency in control (siCTL) and KPNB1 siRNA (siKPNB1)-treated U2 OS cells. The data presented are the means ± S.E. of triplicate samples. (B) Representative images of IF detection of endogenous expression of KPNB1 using anti-KPNB1 (αKPNB1) in control and KPNB1 siRNA-treated U2 OS cells. Scale bar: 10 μm. (C) Fluorescence microscopic analysis of KPNB1 knockdown effect on subcellular localization of PER1, PER2, CRY1, and CRY1 in U2 OS cells. Representative images were captured after immunostaining cells expressing flag-tagged PER1, PER2, CRY1, CRY2, CLOCK, REV-VERBα, CHRONO (PER1Flag, PER2Flag, CRY1Flag, CRY2Flag, CLOCKFlag, REV-VERBαFlag, CHRONOFlag) in the presence of control or KPNB1 siRNA (left panels). The images were taken with fluorescence imaging microscopy using specific filter sets for TRITC (Red; Flag tagged protein) and DAPI (Blue; Nuclei). DAPI (Blue) merged images was presented in each of the image panels. For quantification analysis, subcellular localization is categorized as nuclear (Nuc.; orange), cytoplasmic and nuclear (Cyto./Nuc.; gray), and cytoplasmic (Cyto.; blue-green) (right panels). More than 100 cells for each of the images were evaluated. Scale bar: 50 μm.
Figure 1—figure supplement 2
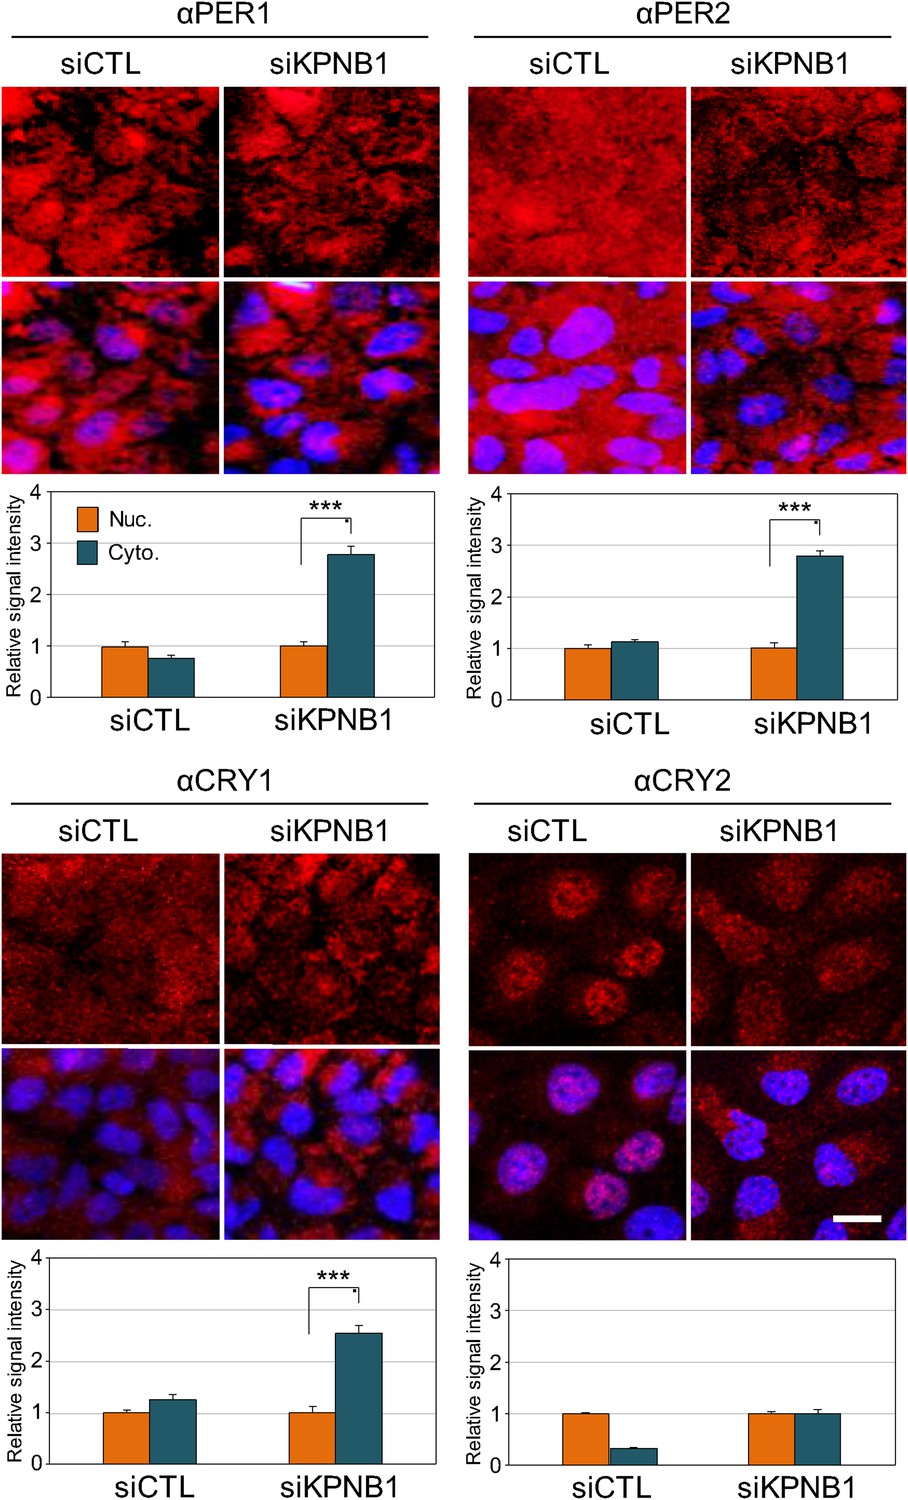
IF analyses of KPNB1 depletion effect on subcellular localization of endogenous PER1, PER2, CRY1, and CRY1.
Representative images were captured after immunostaining endogenous PER1, PER2, CRY1, and CRY2 with anti-PER1 (αPER1), anti-PER2 (αPER2), anti-CRY1 (αCRY1), or anti-CRY2 (αCRY2) in control (siCTL) and KPNB1 siRNA (siKPNB1)-treated U2 OS cells. DAPI (Blue) merged images was presented below each of the image panels. Scale bar: 20 μm. For quantification of subcellular localization, nuclear (Nuc.; orange) and cytoplasmic (Cyto.; blue-green) signals in cells (CTL, n = 10; siKPNB1, n = 10) for each of the image panels were measured using densitometer and presented in the bottom. Asteriks denote the statistical significance (***p < 0.0005, by Student's t-test).
Figure 2 with 1 supplement
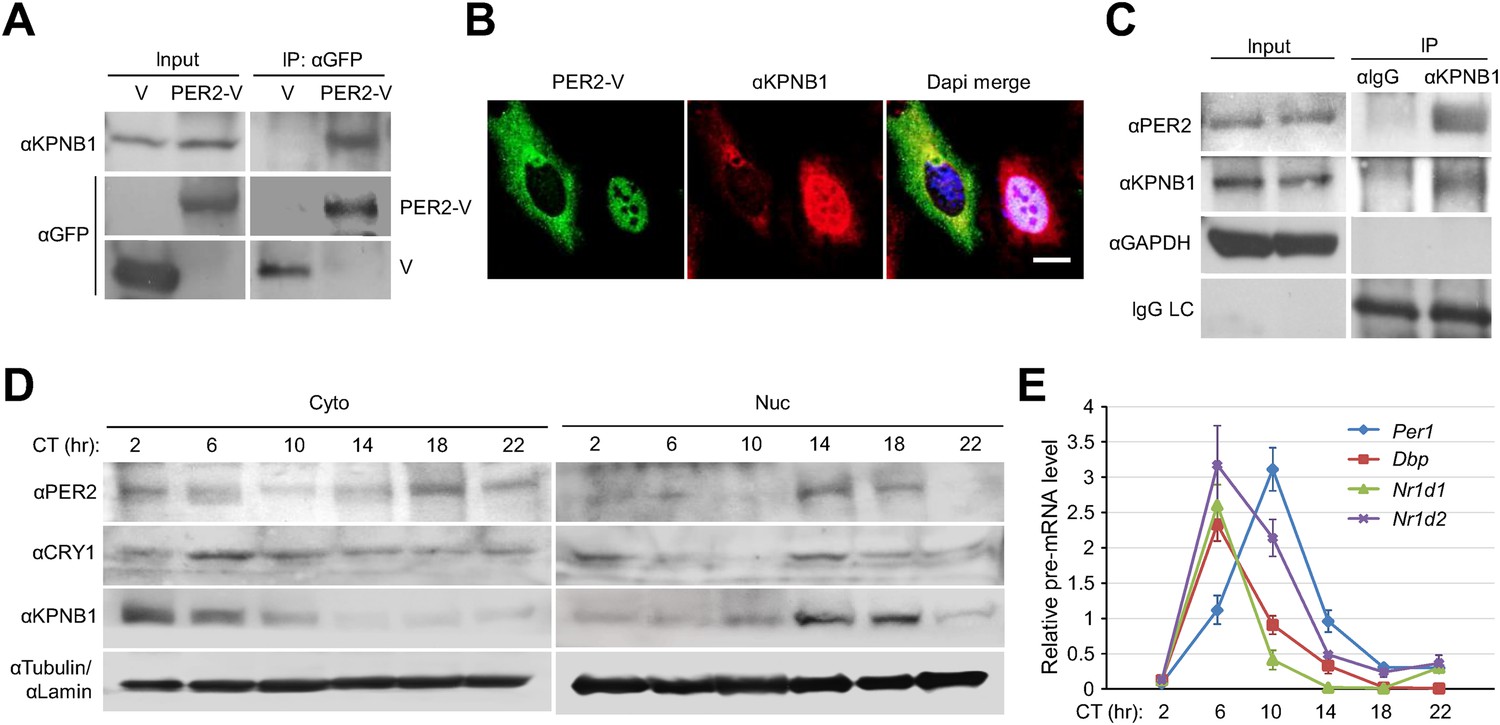
KPNB1 interacts with PER2 for circadian nuclear entry and repressor activity of PER/CRY.
(A) Immunoprecipitation (IP) analysis of interactions of KPNB1 with PER2. U2 OS cells were transfected with Venus-tagged PER2, and then immunoprecipitated with anti-GFP antibody (IP: αGFP). The immunoprecipitates were analyzed by immunoblotting with anti-KPNB1 (IB: αKPNB1) or anti-GFP antibody (IB: αGFP). Representative images from three independent experiments are shown. (B) Immunofluorescence (IF) analyses of subcellular colocalization of PER2 with KPNB1. U2 OS cells expressing PER2-V were fixed and immunostained with antibody to endogenous KPNB1. The representative images were captured by fluorescence imaging microscopy using specific filter sets for FITC (green; PER-V), TRITC (Red; αKPNB1), and DAPI (Blue; Nuclei). See Figure 2—figure supplement 1. Scale bar: 10 µm. (C) Coimmunoprecipitation of PER2 with endogenous KPNB1. Liver extracts were immunoprecipitated (IP) with anti-KPNB1 or control IgG antibodies, and the immunoprecipitated proteins were probed with antibodies to PER2, KPNB1 as well as GAPDH as negative control and IgG light chain as a positive control for the IP. Representative images from three independent experiments are shown. (D) Immunoblotting analysis using cytoplasmic and nuclear extracts prepared from mouse liver tissues collected at 4 hr interval as indicated for 24 hr in constant darkness (CT: Circadian time). Anti-PER2, anti-CRY1, and anti-KPNB1 antibodies were used for detecting endogenous PER2, CRY1, and KPNB1 proteins. Anti-Tubulin antibody (αTubulin) for cytoplasmic fraction (Cyto) marker and anti-Lamin (αLamin) for nuclear fraction (Nuc) marker were used for loading controls respectively. Representative images from two independent experiments are shown. (E) Circadian expressions of endogenous clock gene mRNAs (Per1, Dbp, Nr1d1, Nr1d2) were determined by quantitative RT-PCR analysis of mouse liver tissue samples collected at 4 hr interval as indicated for 24 hr in constant darkness (CT; Circadian time). The data presented are the means ± S.E. of triplicate samples.
Figure 2—figure supplement 1

KPNB1 interacts and colocalizes with PER2.
(A) IP analysis of interactions of KPNB1 with PER1, PER2, CRY1, and CRY2. U2 OS Cells were transfected with Venus-tagged PER1, PER2, CRY1, and CRY2 (PER1-V, PER2-V, CRY1-V, CRY2-V) and then immunoprecipitated with anti-GFP antibody (IP: αGFP). The immunoprecipitates were analyzed by immunoblotting with anti-KPNB1(IB: αKPNB1) or anti-GFP antibody (IB: αGFP). Representative images from three independent experiments are shown. (B) The intensity of the immunoprecipited protein bands in the data shown in (A) was quantified by densitometry (ImageJ), and the data are shown as means ± S.E. of three independent experiments. (C) IF analyses of subcellular colocalization of PER2 with KPNB1. U2 OS cells expressing PER2-V were fixed and immunostained with antibody to endogenous KPNB1. The representative images were captured by fluorescence imaging microscopy using specific filter sets for FITC (green; PER2-V), TRITC (Red; αKPNB1), and DAPI (Blue; Nuclei). Scale bar: 10 μm.
Figure 3 with 2 supplements
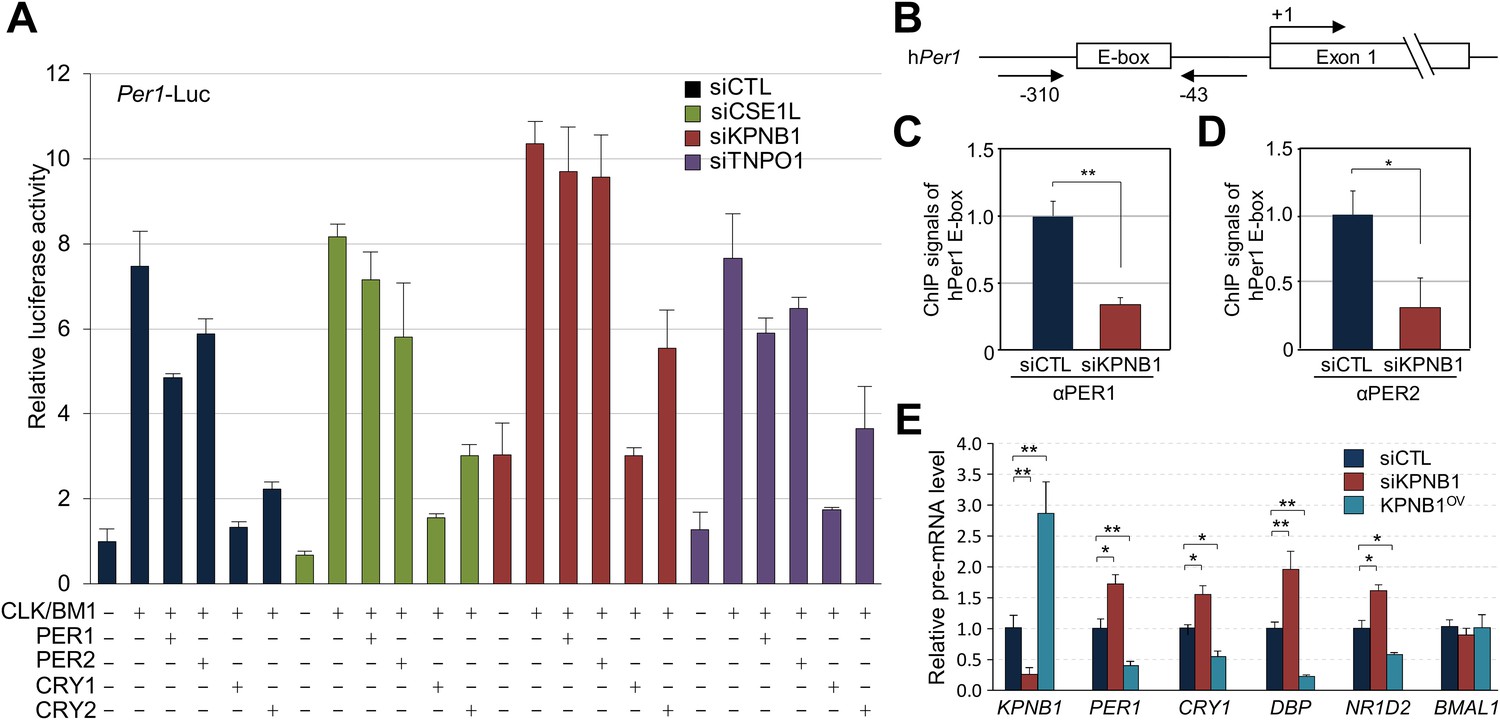
KPNB1 mediates PERs/CRYs-regulated transcription of E-box dependent clock genes.
(A) HEK293T cells were transiently transfected with Per1-Luc reporter construct alone or cotransfected with plasmids expressing CLOCK, BMAL1, PER1, PER2, CRY1, CRY2, in the presence of control (siCTL: black), CSE1L (siCSE1L: light green), KPNB1 (siKPNB1; gray red), and TNPO1 siRNA (siTNPO1: violet) as indicated. After 24 hr, the cells were lysed and Per1 promoter-driven luciferase activities were measured and normalized with pRL-TK activity. Results of one representative experiment of three independent experiments are shown. (B) Schematic diagram of the human PER1 promoter and primers used for ChIP assay. (C, D) ChIP assay of PER1 or PER2 binding to the E box in hPER1. Control (siCTL: black) and KPNB1 siRNA (siKPNB1; gray red)-treated cells (U2 OS) were subjected to ChIP assays using anti-PER1 (αPER1) or anti-PER2 (αPER2) antibody. ChIP DNA samples were quantified by quantitative real-time RT-PCR. The data presented are the means ± S.E. of triplicate samples (**p < 0.005, *p < 0.05, by Student's t-test). (E) Quantitative real-time RT-PCR analysis of expression of endogenous PER1, CRY1, DBP, REVERBβ, and BMAL1 mRNAs in control (siCTL: black), KPNB1-depleted (siKPNB1; gray red) or overexpressed (KPNB1OV; blue green) cells (U2 OS). The data presented are the means ± S.E. of triplicate samples (**p < 0.005, *p < 0.05, by Student's t-test).
Figure 3—figure supplement 1
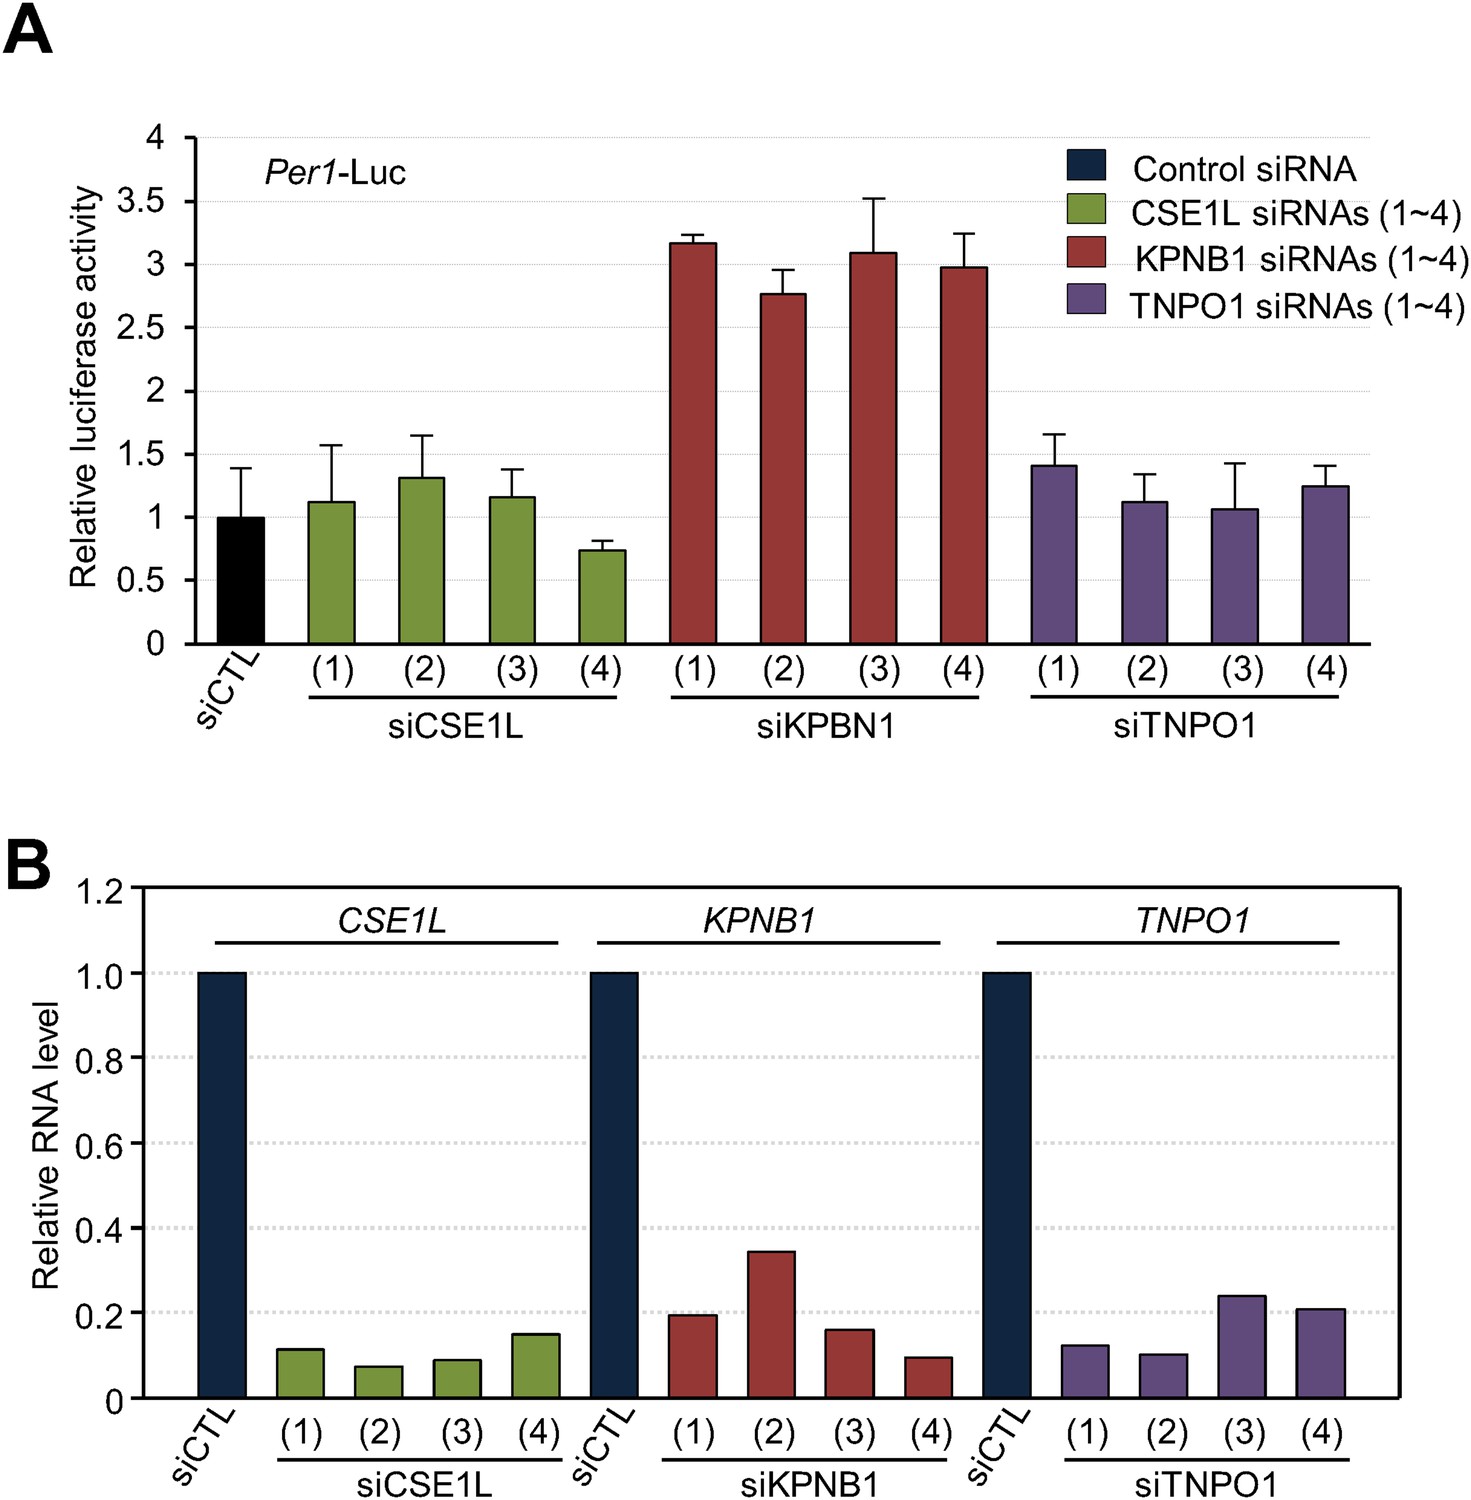
Depletion of KPNB1 reduces repressional activity of PER and CRY proteins.
(A) Effects of knockdown of TNPO1, KPNB1, CSE1L on Per1 promoter activity. HEK293T cells were transiently transfected with Per1-Luc reporter construct in the presence of control siRNA (siCTL: dark blue) or four siRNAs targeting each of CSE1L (siCSE1L 1–4: light green), KPNB1(siKPNB1 1–4; gray red), and TNPO1 siRNA (siTNPO1 1–4: violet) as indicated. After 24 hr, cells were lysed and Per1 promoter-driven luciferase activities were measured and normalized with pRL-TK activity. Results of one representative experiment of three independent experiments are shown. (B) Quantitative RT-PCR analysis of knockdown efficiencies of four siRNAs targeting each of CSE1L (siCSE1L 1–4: light green), KPNB1 (siKPNB1 1–4; gray red), and TNPO1 siRNA (siTNPO1 1–4: violet) introduced in HEK293T cells as indicated.
Figure 3—figure supplement 2
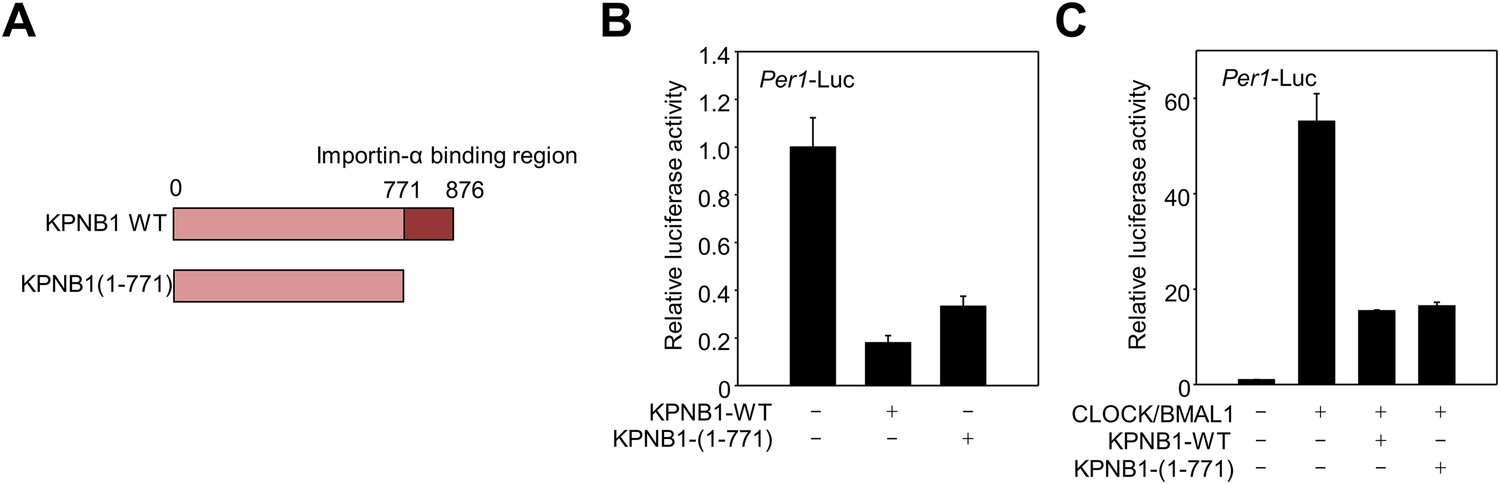
Deletion of KPNA2, importin α binding domain is not required for regulatory function of KPNB1 in clock gene transcription.
(A) Schematic illustration of full-length (1–876) and mutant (1–771) KPNB1 engineered with a deletion of the importin-α binding domain on the C-terminus. (B) Deletion of the importin-α binding domain does not affect the down-regulation of Per1 promoter activity by KPNB1. HEK293T cells were transiently transfected with Per1-Luc reporter construct alone (left) or cotransfected with plasmids expressing full-length and mutant KPNB1 (KPNB1-WT, KPNB1-[1–771]) as indicated combination. After 24 hr, cells were subjected to lysis and Per1 promoter-driven luciferase activities were measured and normalized with pRL-TK activity. The data presented are the means ± S.E. of triplicate samples. (C) Deletion of the importin-α binding domain does not affect the down-regulation of CLOCK-BMAL1-mediated Per1 transcription by KPNB1. HEK293T cells were transiently transfected with Per1-Luc reporter construct alone (left) or cotransfected with plasmids expressing CLOCK, BMAL1, full-length or importin-α binding domain deficient mutant of KPNB1 (KPNB1-WT, KPNB1-[1–771]) as indicated combination. Similar transcriptional analysis was performed, as in (B).
Figure 4 with 4 supplements

KPNB1 is required for circadian gene expression.
(A) Immunoblot analysis of KPNB1 knockdown efficiency with anti-KPNB1 (αKPNB1) in control (siCTL) and KPNB1 siRNA (siKPNB1)-treated U2 OS cells. Anti-GAPDH antibody (αGAPDH) was used as a loading control. (B) Bioluminescence recordings of dexamethasone (Dex)-synchronized control (siCTL) and increasing dose of KPNB1 siRNA (siKPNB1 0.5×/1×)-treated U2 OS cells expressing Per2 promoter-driven destabilized luciferase (left; pPer2-dLuc). The Bioluminescence recordings were detrended by a 24-hr moving average subtraction (right). (C) Altered rhythmic expression of KPNB1, PER1, PER2, and CRY1 transcripts by KPNB1 depletion. mRNA expressions of the target genes were determined by quantitative RT-PCR in control or KPNB1-depleted U2 OS cells over the course of 44 hr after 24 hr upon Dex treatment. The data are shown with the mean value of triplicate samples in each time point. (D) KPNB1 knockdown alters rhythmic nuclear accumulation of PER and CRY proteins. Immunoblotting analysis using cytoplasmic and nuclear extracts prepared from control or KPNB1-depleted U2 OS cells collected at 4 hr interval over the course of 44 hr after 24 hr of Dex treatment. Anti-PER2, anti-CRY1, anti CRY2, and anti-KPNB1 antibodies were used for detecting endogenous PER2, CRY1, CRY2 and KPNB1 proteins. Anti-Tubulin antibody (αTubulin) for cytoplasmic fraction (Cyto) marker and anti-TATA binding protein (αTBP) for nuclear fraction (Nuc) marker were used for loading controls respectively. Representative images from two independent experiments are shown.
Figure 4—figure supplement 1
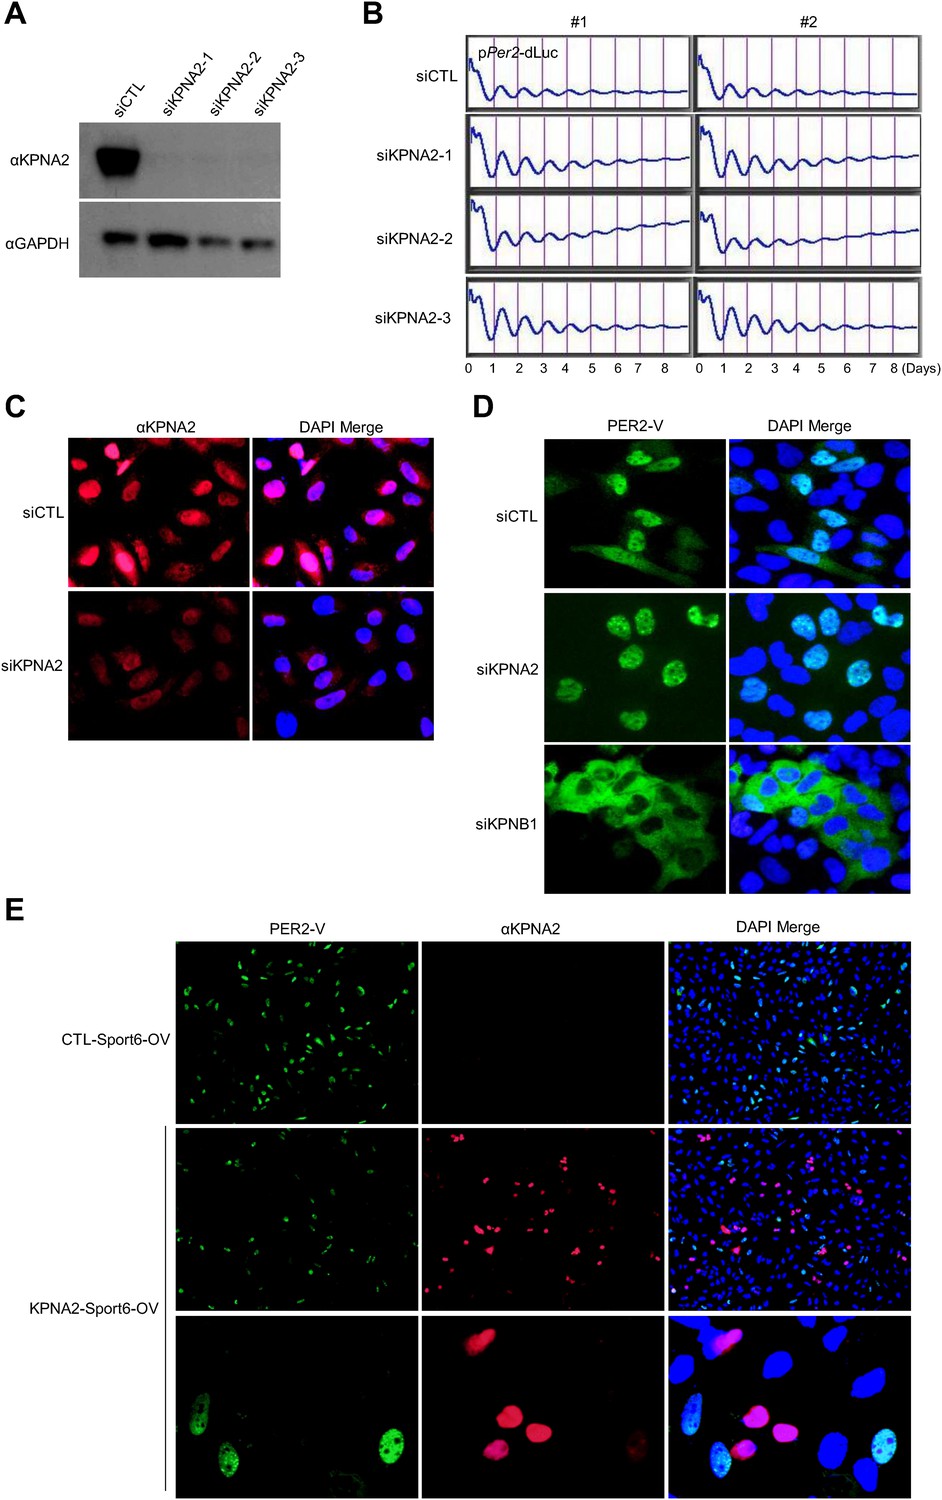
Inhibition of KPNA2 does not affect PER2 nuclear localization and cellular clock rhythmicity.
(A) Immunoblot analysis of KPNA2 (importin-α) knockdown efficiency with anti-KPNA2 (αKPNA2) in U2 OS cells treated with control siRNA (siCTL) or each of three KPNA2 siRNAs (siKPNA2-1, siKPNA2-2, siKPNA2-3). Anti-GAPDH antibody (αGAPDH) was used as a loading control. (B) KPNA2 depletion does not affect circadian promotor activity rhythm. 48 hr after treatment with control siRNA (siCTL) or each of three KPNA2 siRNAs (siKPNA2-1, siKPNA2-2, siKPNA2-3) in pPer2-dLuc reporter cells (U2 OS), the cells were synchronized with Dex and monitored in real-time bioluminescence recorder. (C) Representative images were captured after immunostaining endogenous KPNA2 with anti-KPNA2 (αPER1) in control (siCTL) and KPNB1 siRNA (siKPNB1)-treated U2 OS cells. (D) KPNA2 depletion does not affect subcellular localization of PER2. Fluorescence microscopic analysis of the effect of KPNA2 or KPNB1 depletion on subcellular localization of PER2. Representative fluorescence images of U2OS cells stably expressing PER2-Venus (PER2-V) in the presence of control (siCTL: upper panels), KPNA2 (siKPNA2: middle panels), or KPNB1 siRNA (siKPBN1: lower panels) were captured by fluorescence imaging microscopy using specific filter sets for FITC (green; PER2-V) and and DAPI (Blue; Nuclei). (E) Effect of KPNA2 overexpression on PER2 localization. Representative fluorescence images of U2 OS cells stably expressing PER2-Venus (PER2-V) with the transfection of control (CTL-Sport6-OV: upper panels [20×]) or KPNA2 encoding plasmids (KPNA2-Sport6-OV: middle [20×] and bottom panels). The bottom panels show highly magnified images representative of middle panel images. The images were captured by fluorescence imaging microscopy using specific filter sets for FITC (green; PER2-V), TRITC (Red; αKPNA2), and DAPI (Blue; Nuclei).
Figure 4—figure supplement 2
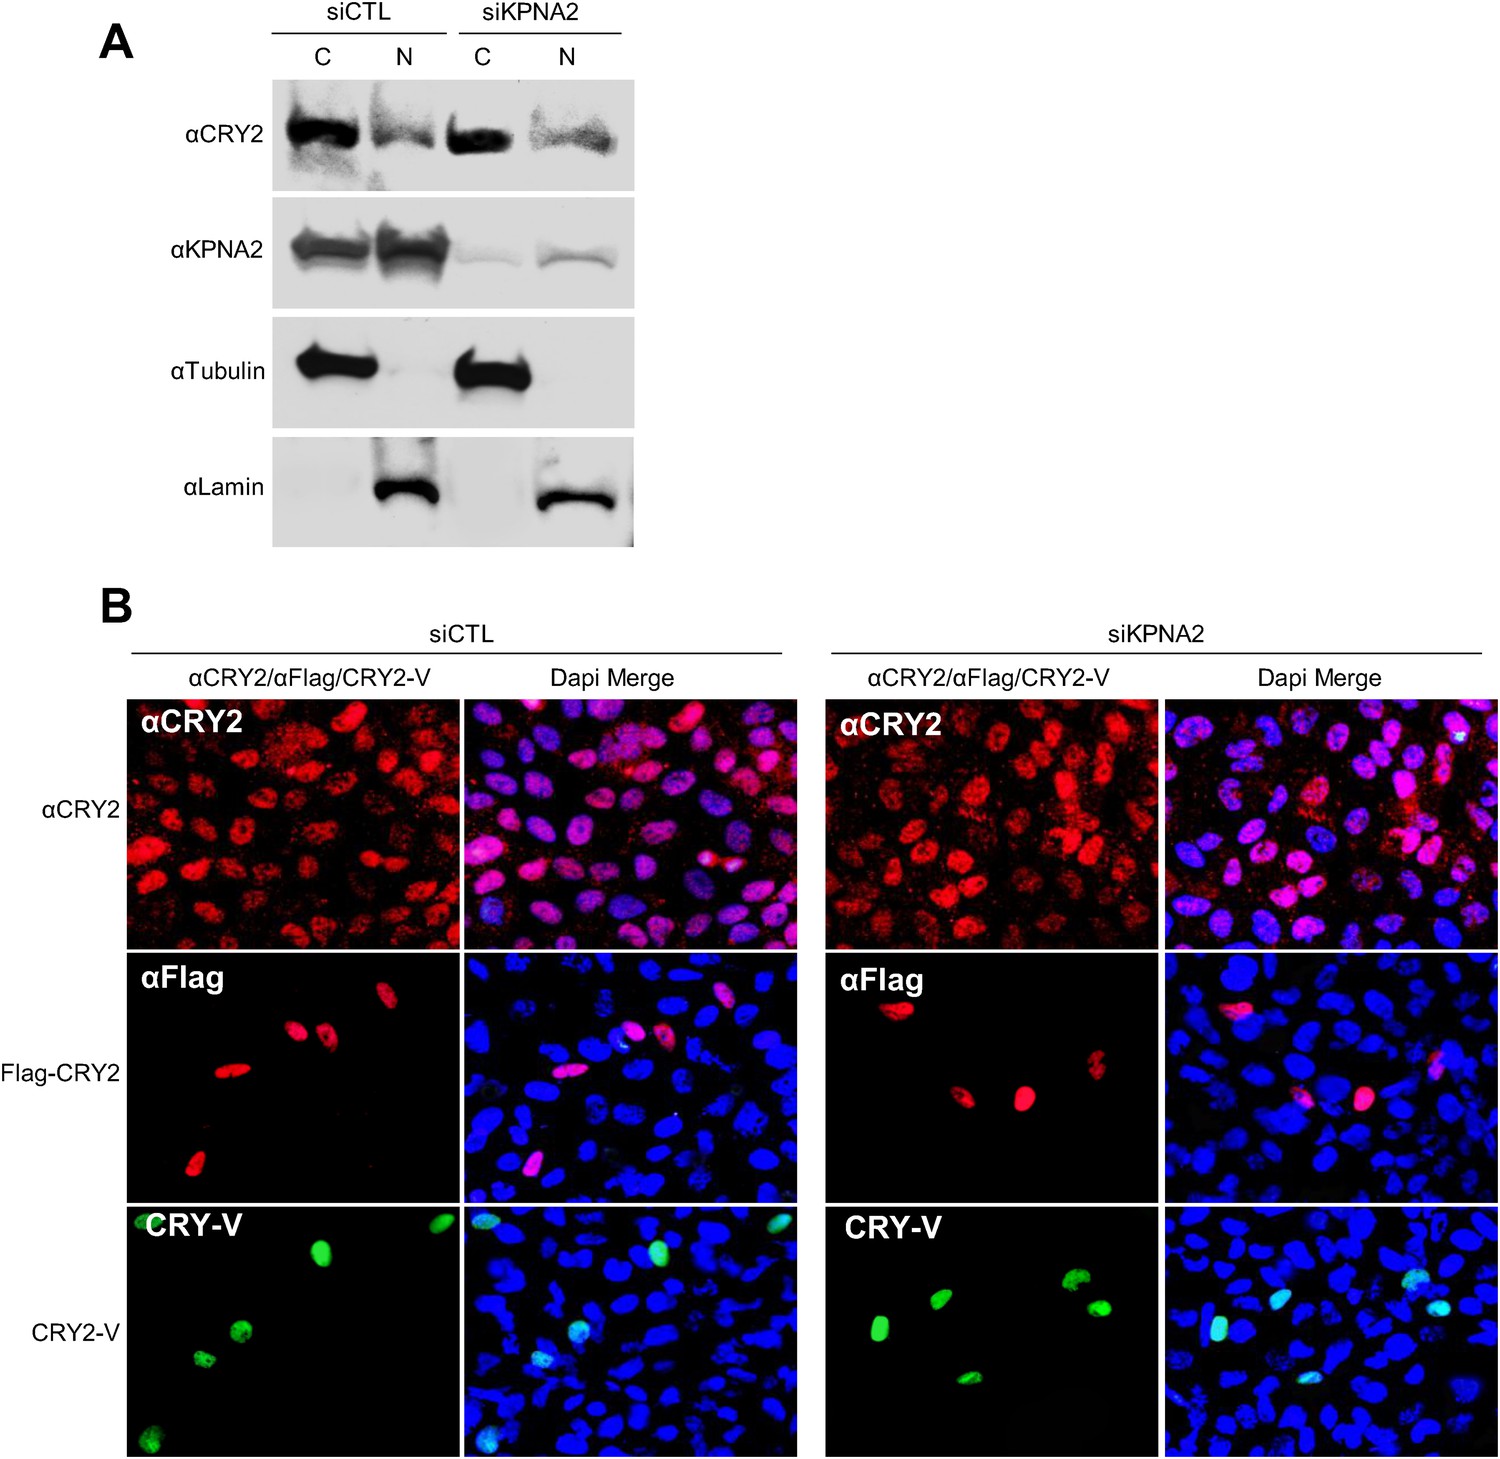
Inhibition of KPNA2 does not affect CRY2 nuclear localization.
(A) Immunoblot analysis of nuclear and cytoplasmic extracts of U2 OS cells in the presence of control and KPNA1 siRNA using the indicated antibodies for endogenous CRY2 (αCRY2) and KPNB1 (αKPNB1), Tubulin for cytoplasmic fraction (C) marker (αTubulin), and TATA binding protein (TBP) for nuclear fraction (N) marker (αTBP). (B) Fluorescence microscopic analysis of the effect of KPNA2 depletion on subcellular localization of CRY2. Representative fluorescence images of subcellular localization of endogenous CRY2 (upper panels), or ectopically expressed Flag-CRY2 (middle panels), CRY2-Venus (CRY2-V; lower panels) in U2 OS cells treated with control siRNA (siCTL; left panels) or KPNA2 siRNA (siKPNA2; right panels). The images were taken using specific filter sets for TRITC (Red; αCRY2, Flag-CRY2), FITC (green; PER2-V), and DAPI (Blue; Nuclei). DAPI (Blue) merged images was presented in each of the image panels.
Figure 4—figure supplement 3

Inhibition of KPNA1 (importin α5) does not significantly affect PER2 and CRY2 nuclear localization and cellular clock rhythmicity.
(A) Quantitative RT-PCR analysis of knockdown efficiencies of three siRNAs targeting KPNA1 (siKPNA1-1; gray red, siKPNA1-2; light green, siKPNA1-3; violet), introduced in U2 OS cells as indicated. (B) KPNA1 depletion does not affect circadian promotor activity rhythm. 48 hr after treatment with control siRNA (siCTL) or each of three KPNA1 siRNAs (siKPNA1-1, siKPNA1-2, siKPNA1-3) in pPer2-dLuc reporter cells, the cells were synchronized with Dex and monitored in real-time bioluminescence recorder. (C) KPNA1 depletion does not affect subcellular localization of PER2. Fluorescence microscopic analysis of the effect of KPNA1 or KPNB1 depletion on subcellular localization of PER2. Representative fluorescence images of U2 OS cells stably expressing PER2-Venus (PER2-V) in the presence of control (siCTL: upper panels), KPNA1 (siKPNA2: middle panels), or KPNB1 siRNA (siKPBN1: lower panels) were captured by fluorescence imaging microscopy using specific filter sets for FITC (green; PER2-V) and and DAPI (Blue; Nuclei). (D) Fluorescence microscopic analysis of the effect of KPNA1 depletion on subcellular localization of CRY2. Representative fluorescence images of subcellular localization of endogenous CRY2 (upper panels), or ectopically expressed Flag-CRY2 (middle panels), CRY2-Venus (CRY2-V; lower panels) in U2 OS cells treated with control siRNA (siCTL; left panels) or KPNA1 siRNA (siKPNA1; right panels). The images were taken using specific filter sets for TRITC (Red; αCRY2, Flag-CRY2), FITC (green; PER2-V), and DAPI (Blue; Nuclei). DAPI (Blue) merged images was presented in each of the image panels.
Figure 4—figure supplement 4
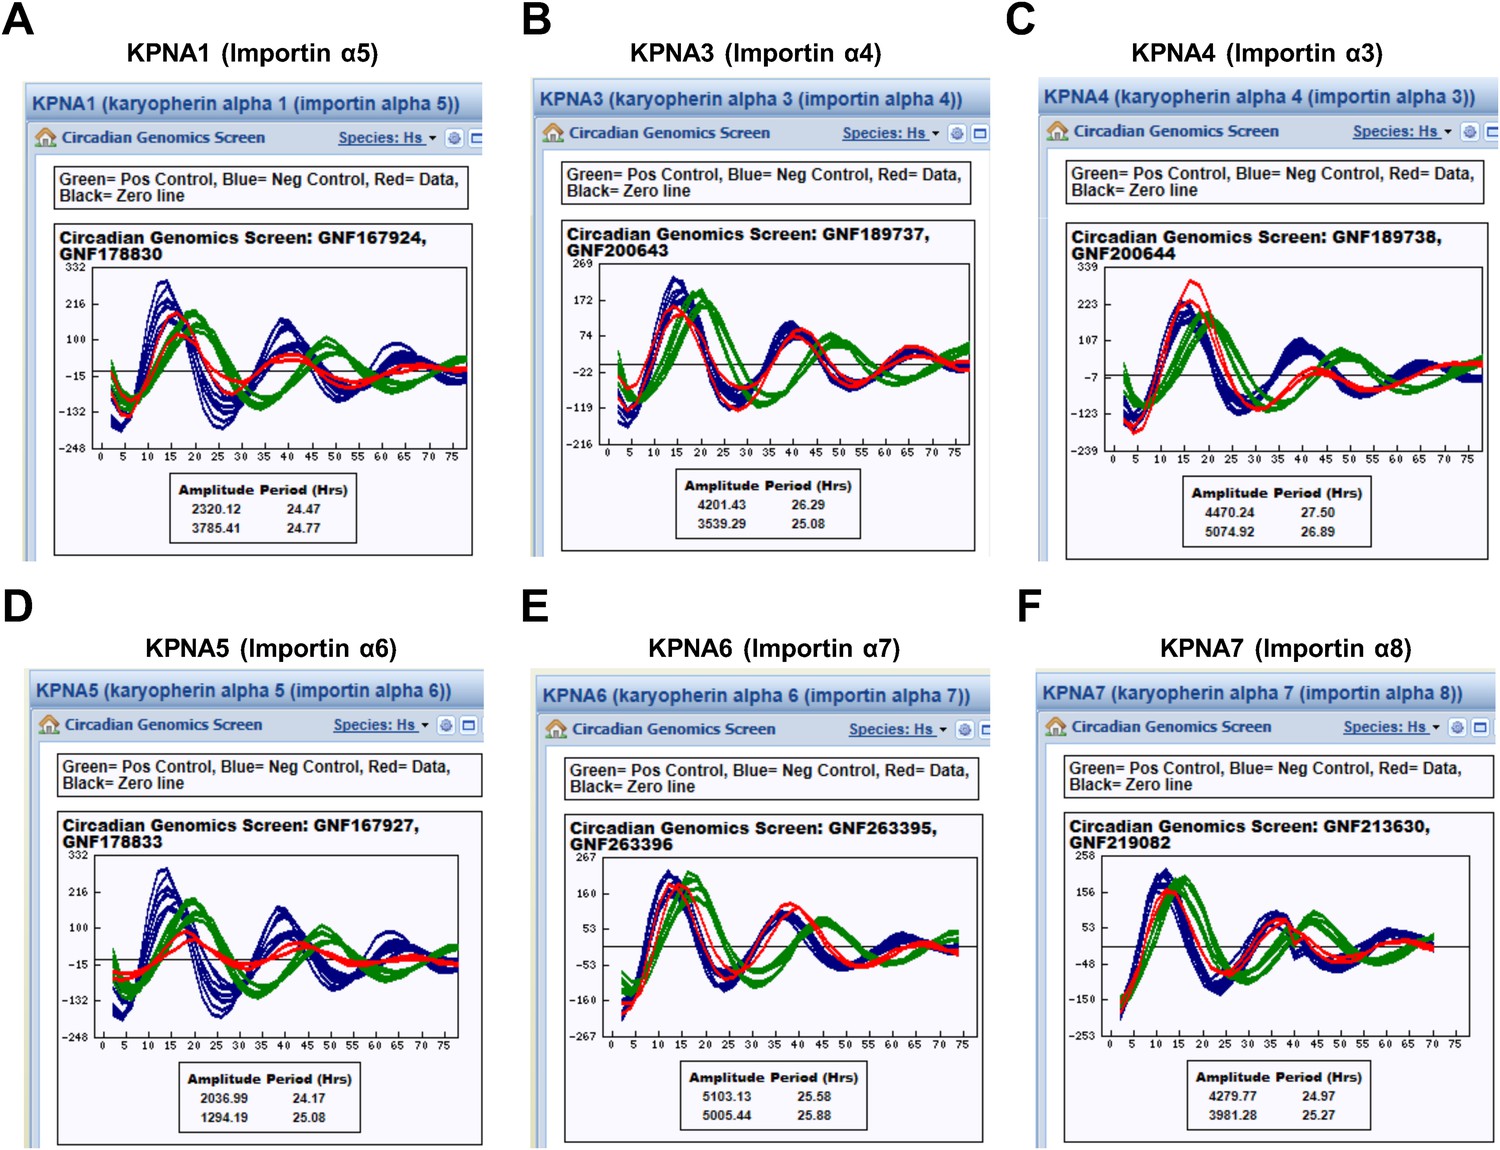
KPNA isoforms are not critical for cellular rhythmicity.
Knockdown of various KPNA isoforms does not significantly affect circadian promotor activity rhythm (Blue = Negative control [Control siRNA], Green = Positive control [CRY2 siRNA], Red = Data [Target KPNA siRNA]) (A) KPNA1 (importin α5), (B) KPNA3 (importin α4), (C) KPNA4 (importin α3), (D) KPNA5 (importin α6), (E) KPNA6 (importin α7), (F) KPNA7 (importin α8). Each of data set (A–F) was retrieved from BioGPS website; http://biogps.org (Wu et al., 2009; Zhang et al., 2009).
Figure 5
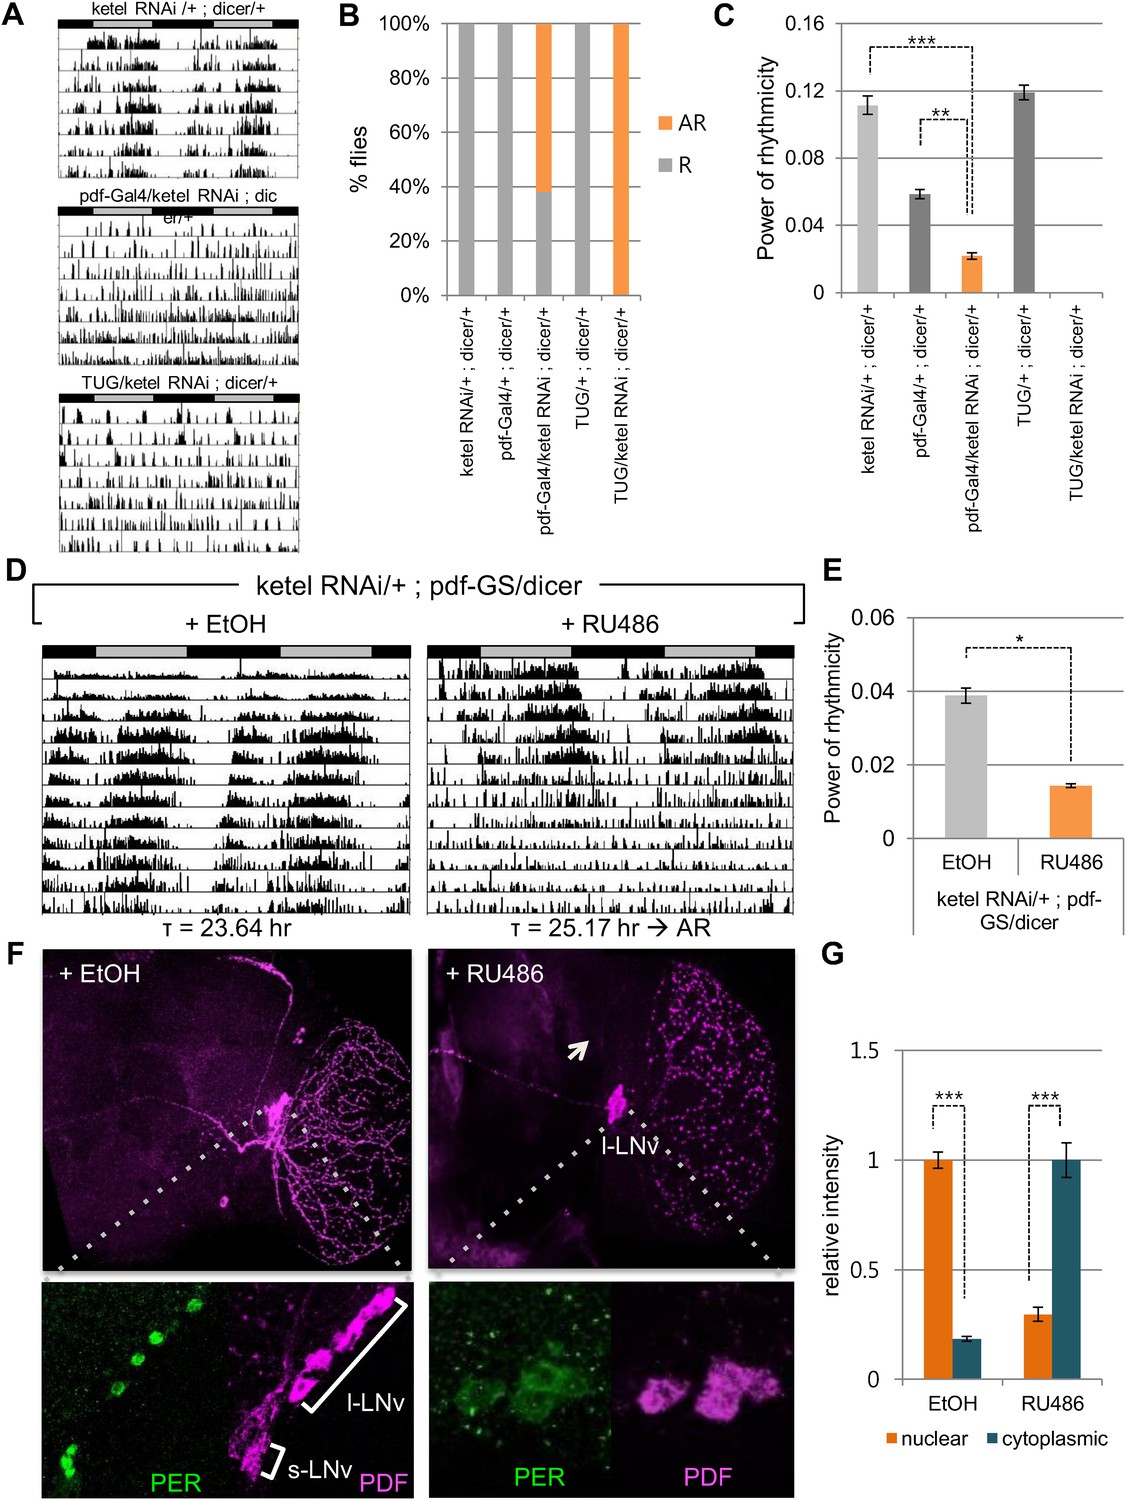
Inhibition of conserved importin β (ketel) abolishes circadian behavior in flies.
(A) Flies in which ketel was downregulated in PDF+ cells and in all clock neurons were assayed for rest/activity rhythms in constant dark (DD). (B) Summary of the circadian rhythms of various flies under DD. Quantification shows percentage of rhythmic (R, orange) and arrhythmic (AR, gray) flies (n = 16–26). (C) Some rhythmic Pdf-Gal4/+; dicer/+ flies showed weak rhythmicity with lower fast Fourier transform value compared to both ketel RNAi/+; dicer/+ and Pdf-GAL4/+; dicer/+ control flies (**p < 0.001, ***p < 0.0001, by Student's t-test) (See also Supplementary file 1). (D) ketel knockdown in PDF+ cells during adulthoods leads to a long period, which eventually degenerates into arrhythmia in DD. They were fed either 500 mM RU486 or ethanol (EtOH, vehicle control) from the time of entrainment. (E) Rhythm strength of rhythmic RU486-treated flies was lower than that of EtOH-treated control flies after 7 days in DD (*p < 0.05, by Student's t-test) (See also Supplementary file 1). (F, G) PDF expression in ketel knockdown flies was only detected in large lateral ventral neurons (l-LNvs), not in the small lateral ventral neurons (s-LNvs). Downregulation of KETEL in PDF+ cells impairs nuclear translocation of PER in l-LNvs. In RU486-treated flies, PER expression in l-LNvs was detected in cytoplasm at ZT1, a time when PER is nuclear in control flies (***p < 0.0001, by Student's t-test).
Figure 6
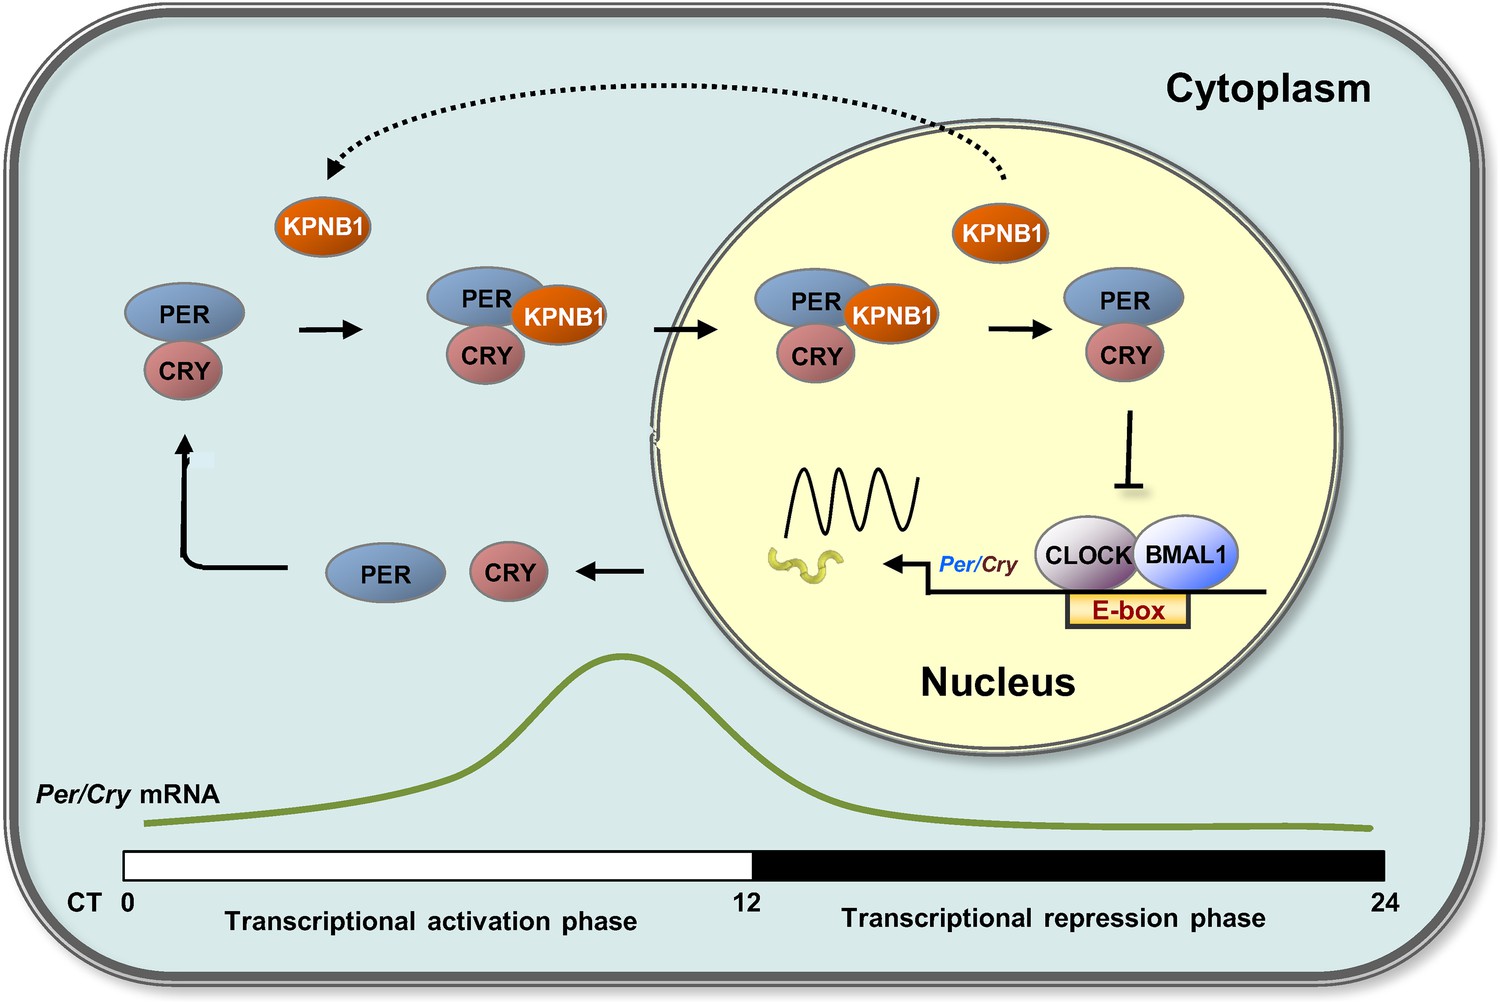
Proposed model for KPNB1 function in nuclear translocation of PERs/CRYs controlling negative feedback regulation of the molecular clock.
KPNB1 directly associates with PERs/CRYs and guides their nuclear entry thus facilitating negative feedback repression of CLOCK/BMAL1-mediated transcription of the repressor genes.
Additional files
-
Supplementary file 1
Effects of downregulating ketel genes on free-running circadian locomotor rhythms.
- https://doi.org/10.7554/eLife.08647.018
Download links
A two-part list of links to download the article, or parts of the article, in various formats.
Downloads (link to download the article as PDF)
Open citations (links to open the citations from this article in various online reference manager services)
Cite this article (links to download the citations from this article in formats compatible with various reference manager tools)
KPNB1 mediates PER/CRY nuclear translocation and circadian clock function
eLife 4:e08647.
https://doi.org/10.7554/eLife.08647


