Deployment of a retinal determination gene network drives directed cell migration in the sea urchin embryo
- Duke University, United States
Figures
Figure 1
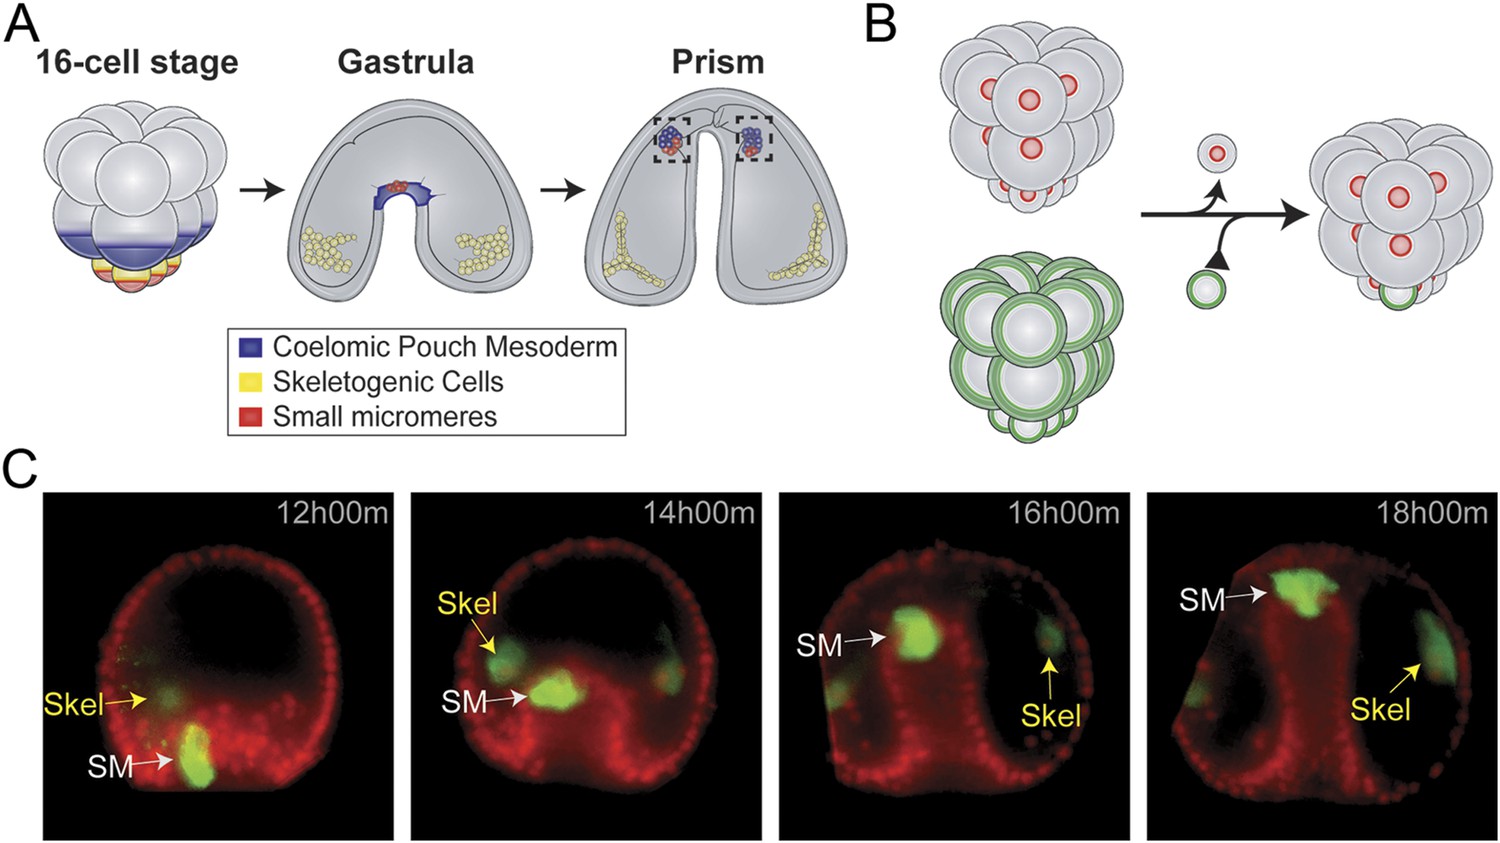
Small micromere movements during gastrulation.
(A) The small micromeres arise at the vegetal pole at the asymmetric fifth cleavage from the micromere lineage (red). During gastrulation, they remain at the tip of the gut. They migrate through the top of the blastocoel and enter the posterior half of the coelomic pouches by prism stage. (B) To study small micromere movements and migration at a higher resolution, membrane-GFP-labeled micromeres were transplanted to a H2b-RFP-labeled host. (C) Small micromeres actively changed shape throughout gastrulation (extend filopodia and lamellipodia) until they reach the tip of the archenteron. Skeletogenic lineages are labeled as ‘Skel’, and small micromeres are labeled as ‘SM’. See also, Video 1.
Figure 2
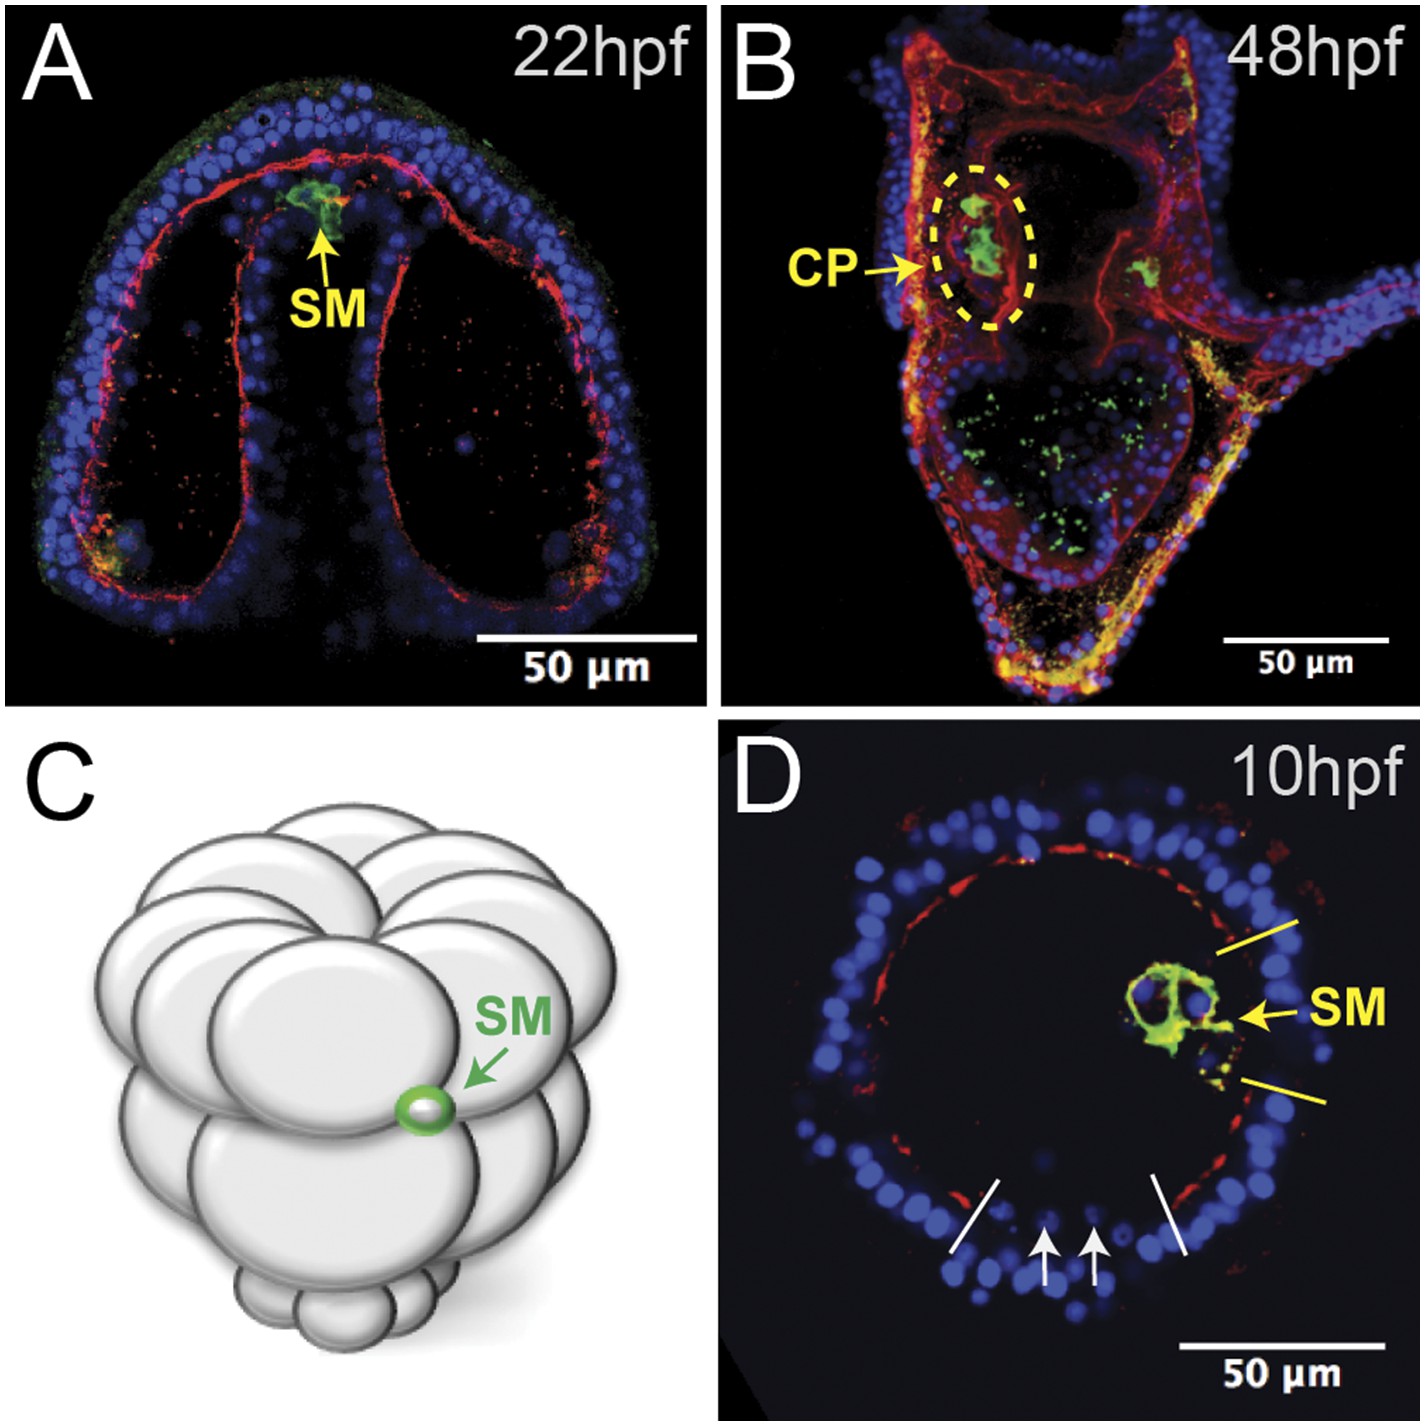
Laminin remodeling at the tip of the archenteron facilitates migration of the small micromeres to the posterior end of the coelomic pouch.
(A) Once the micromeres reach the tip of the gut, they undergo an epithelial–mesenchymal transition (EMT). By immunostaining, we see that laminin (red), at the time, is reduced as the small micromeres (SM, green) breach the top of the gut. (B) Once they reach the posterior coelomic pouch, laminin (red) surrounds the small micromeres (green) and NSM to encapsulate the coelomic pouch (yellow dashed circle). (C, D) Ectopically placed small micromeres underwent an EMT coincident with the endogenous EMT event of the skeletogenic cells. Laminin (red) is absent both at the site of skeletogenic cell ingression (indicated by white arrows at the site of ingression) and at the site of ectopic small micromere (SM, green) ingression (indicated by a yellow arrow).
Figure 3 with 1 supplement
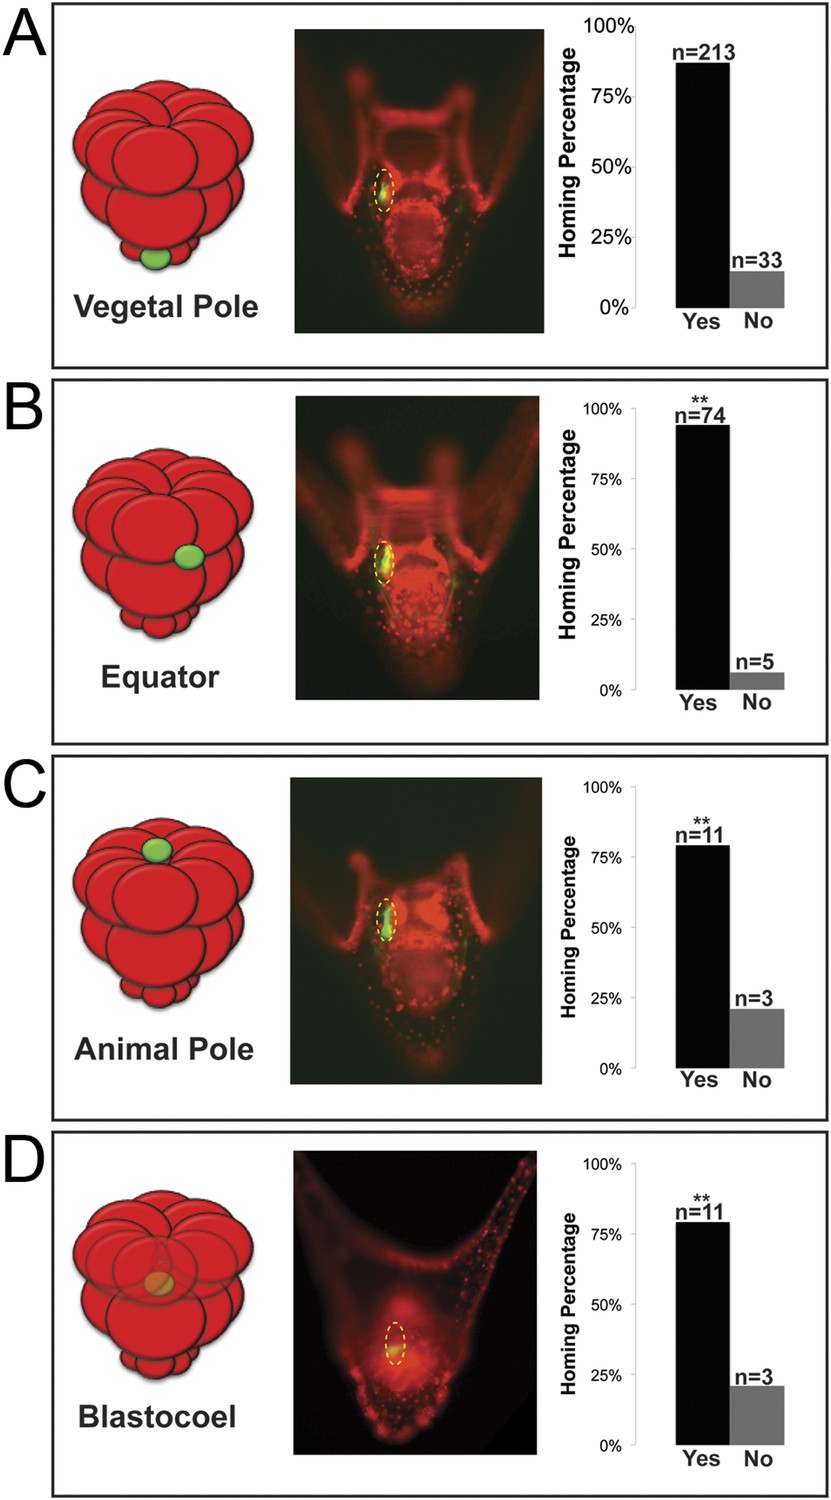
Ectopically placed micromeres are able to find their way to the coelomic pouches via a directed homing mechanism from any ectopic location.
(A) The endogenous, vegetal pole, (B) the equator (p < 0.004), (C) the animal pole (p < 0.004), or (D) inside of the blastocoel (p < 0.004). Illustrations on the left designate their ectopic placement (ectopic micromere = green, host embryo = red). Yellow dashed lines indicate the location of the whole coelomic pouch with the ectopically placed micromeres labeled in green. Graphs depict the percentage of embryos scored with the given ability to home (Yes vs No), ‘n’ equals the number of embryos scored with the phenotype, and p-values were calculated using a χ2 test. ‘**’ denotes a statistically significant (p < 0.05) p-value.
Figure 3—figure supplement 1
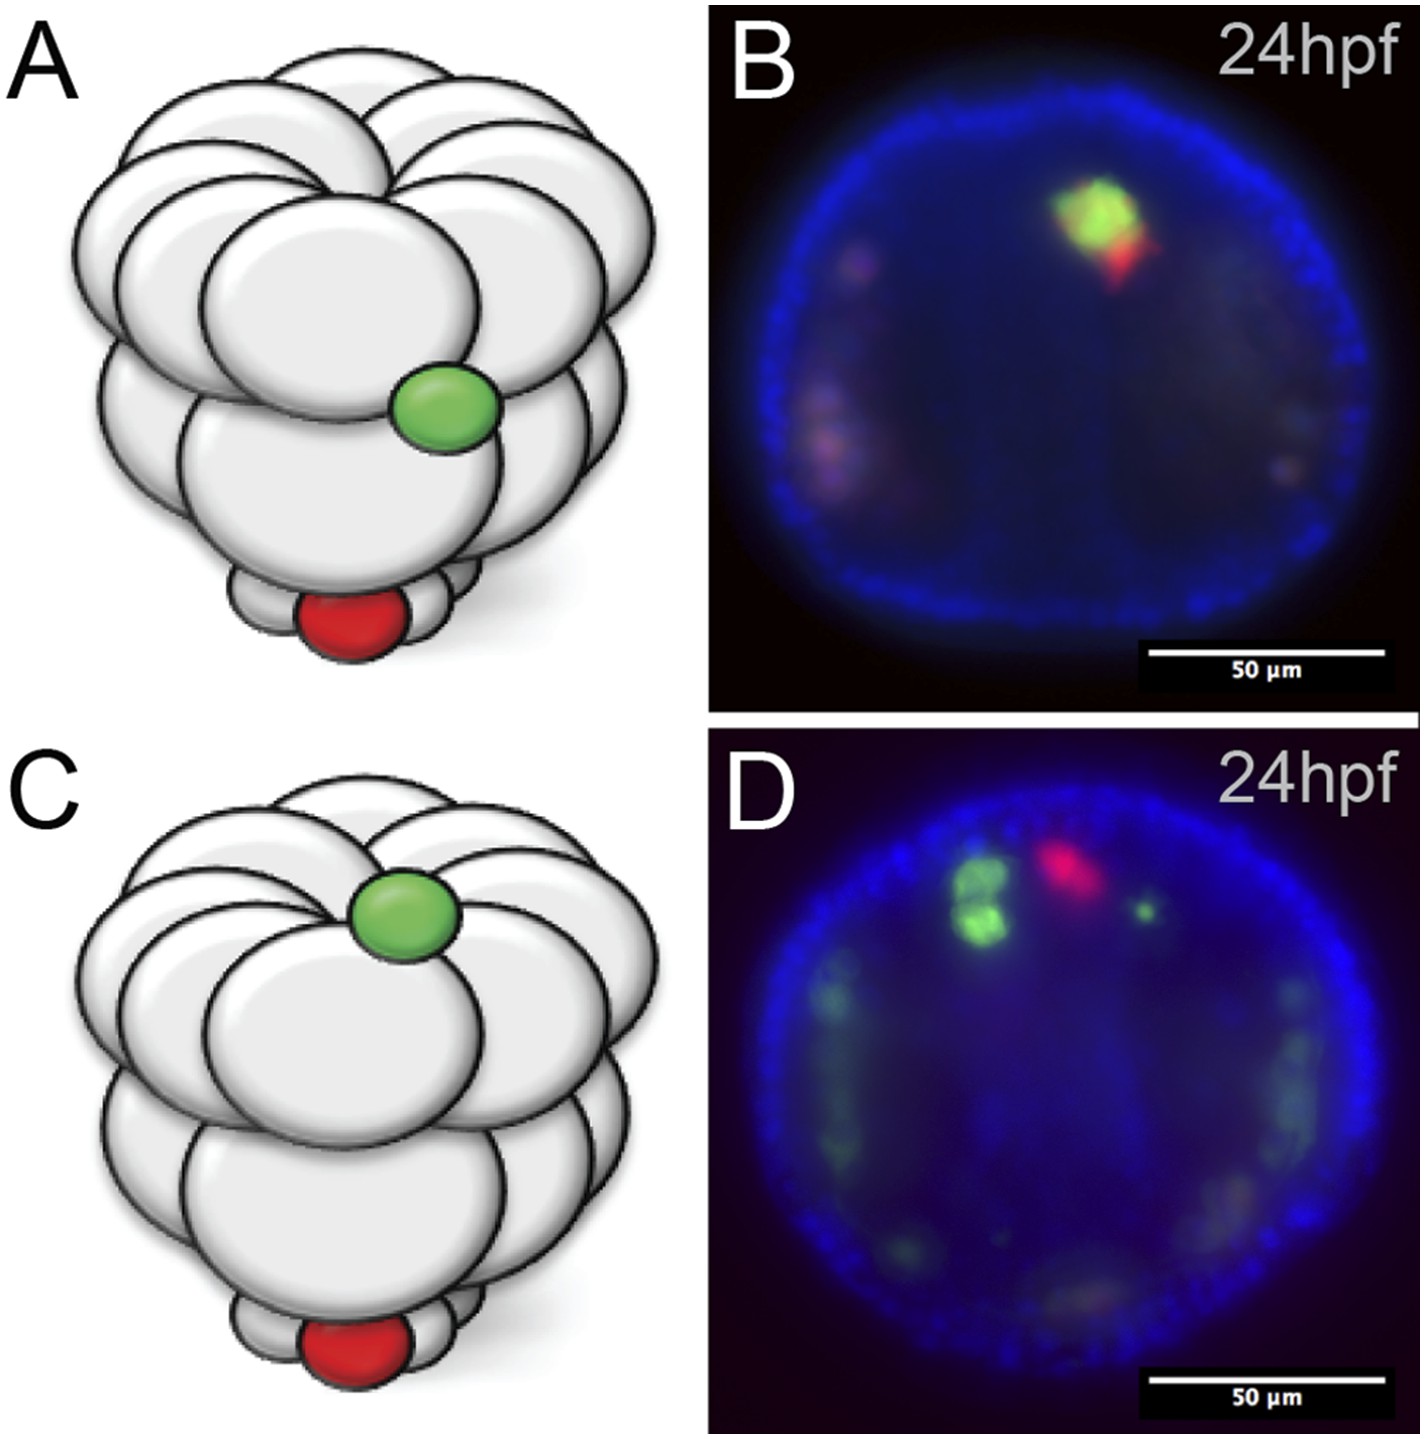
Ectopic small micromeres arrive at the coelomic pouches independently.
Small micromeres were ectopically placed as fourth division micromeres. The ectopic skeletogenic cells joined the endogenous skeletogenic cells while the ectopic small micromeres reached the coelomic pouch independently of the endogenous small micromeres (vegetally placed) no matter their starting location, either the equator (A, B) or the animal pole (C, D).
Figure 4
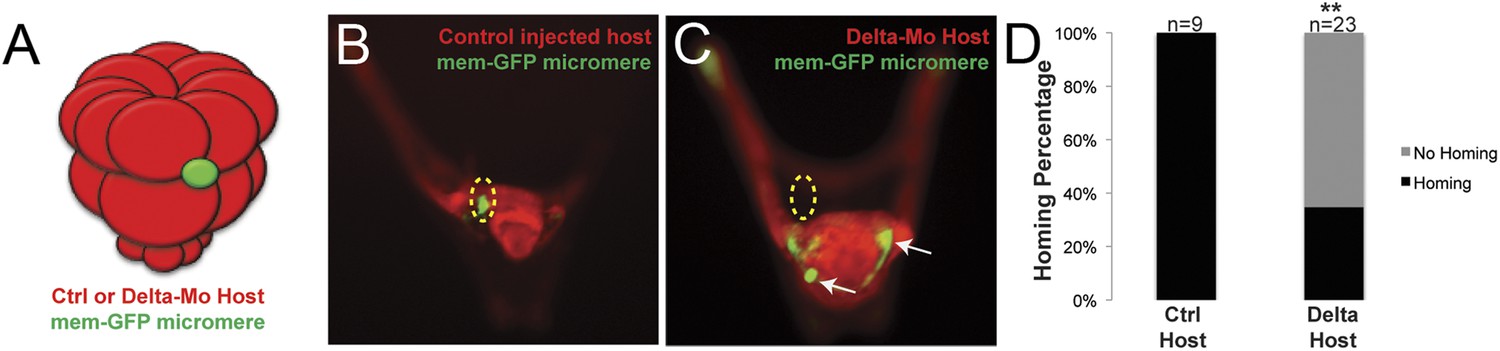
Specification of the non-skeletogenic mesoderm (NSM) by Delta signaling is required for homing.
Control micromeres labeled with membrane-GFP were ectopically transplanted to either a control TMR (red) host or a Delta–MO TMR (red) host (A). When control micromeres were transplanted to a control host, homing of the small micromeres occurs 100% (n = 9) of the time (B). When NSM specification was blocked in a host embryo using a delta morpholino, homing of transplanted control micromeres was significantly reduced and only homed 53% of the time (n = 23, p < 0.0001) (C, white arrows). (D) The graph depicts the percentage of embryos (Control Host vs Delta Host) seen with the given ability to home (Black = Homing vs Gray = No Homing), ‘n’ equals the number of embryos scored in each case, and p-values were calculated using a χ2 test. ‘**’ denotes a statistically significant (p < 0.05) p-value.
Figure 5 with 2 supplements
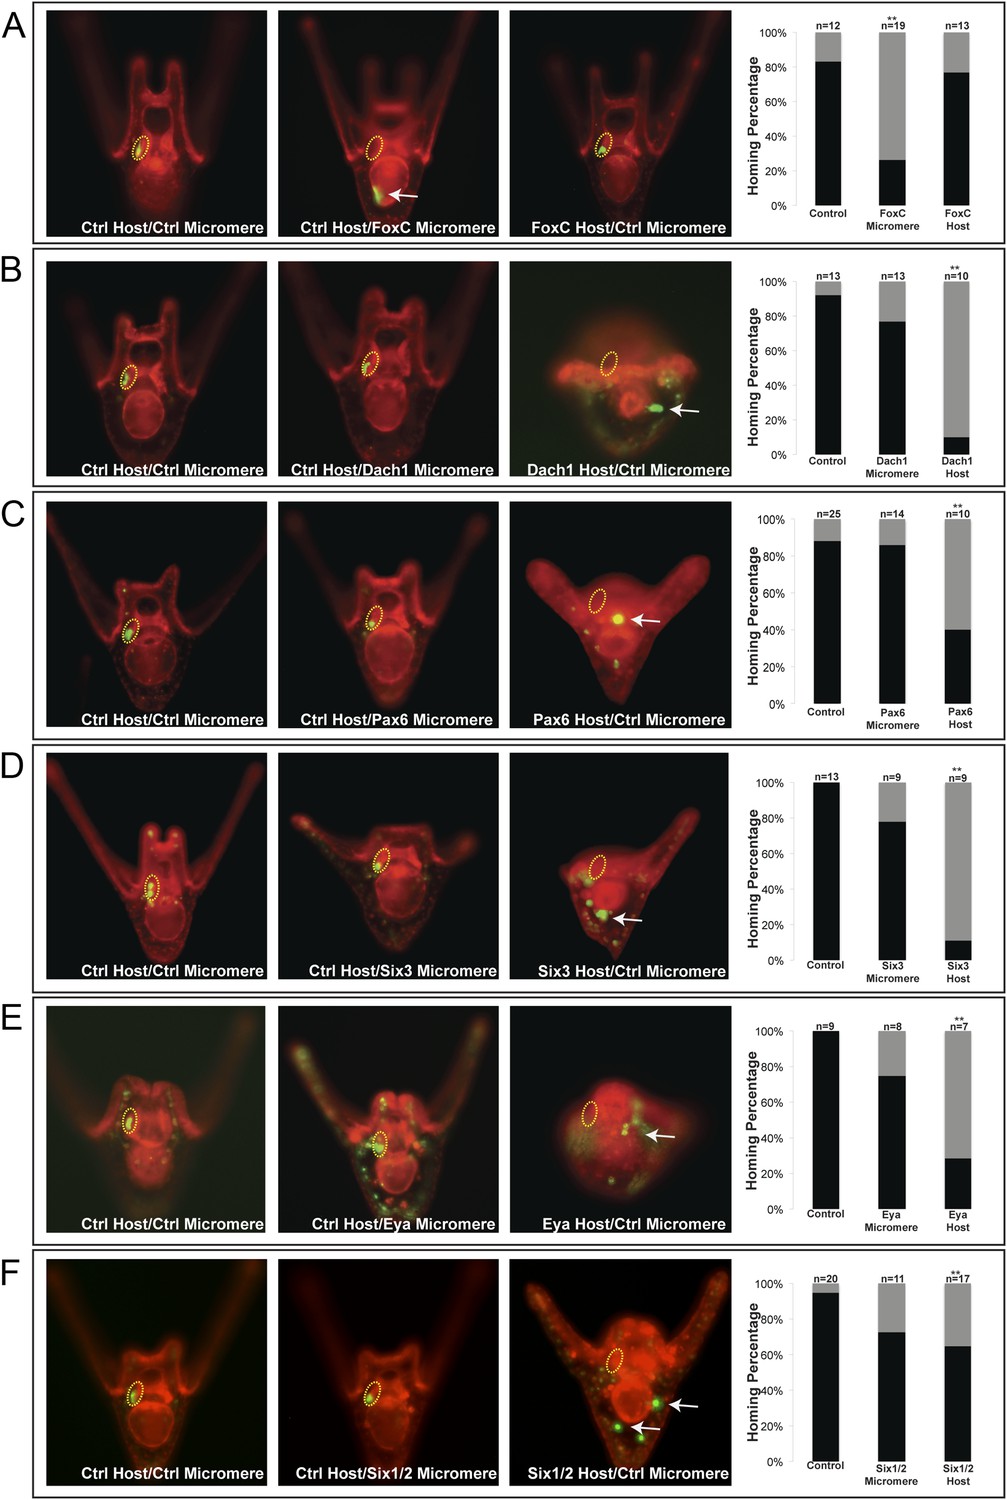
Homing is controlled by upstream transcription factors.
By selectively knocking down specific transcription factors in either an ectopically placed micromere or the host embryo, transcription factors for the homing were identified. (A) FoxC, a transcription factor expressed in the small micromeres and oral mesoderm was necessary for homing of the small micromere (n = 19, p < 0.001), but had no inhibitory effect on homing when knocked down in just the mesoderm (n = 13). (B) Dach1, an aboral mesoderm transcription factor, affected homing when knocked down in the mesoderm (n = 10, p < 0.0001) but did not affect homing when perturbed in the small micromere (n = 13). (C) Pax6, affected homing when knocked down in the mesoderm (n = 10, p < 0.004) but had no effect on homing when perturbed in the small micromere (n = 14). (D) Aboral mesoderm transcription factor, Six3 affected homing when knocked down in the mesoderm (n = 9, p < 0.00009) but had no effect homing when perturbed only in the small micromere (n = 9). (E) Aboral transcriptional co-activator, Eya, affected homing when knocked down in the mesoderm (n = 7, p < 0.002) but did not affect homing when perturbed in the small micromeres (n = 8). (F) Aboral transcription factor, Six1/2, affected homing when knocked down in the mesoderm, as well (n = 17, p < 0.02) and did not affect homing when knocked down in the micromere (n = 11). Yellow circles indicate the location of the coelomic pouch. White arrows indicate ‘lost’ micromeres. The graph depicts the percentage of embryos (Control Host vs MO micromere vs MO Host) seen with the given ability to home (Black-Homing vs Gray-No Homing), ‘n’ equals the number of embryos scored in each case p-values were calculated using a χ2 test. ‘**’ denotes a statistically significant (p < 0.05) p-value.
Figure 5—figure supplement 1
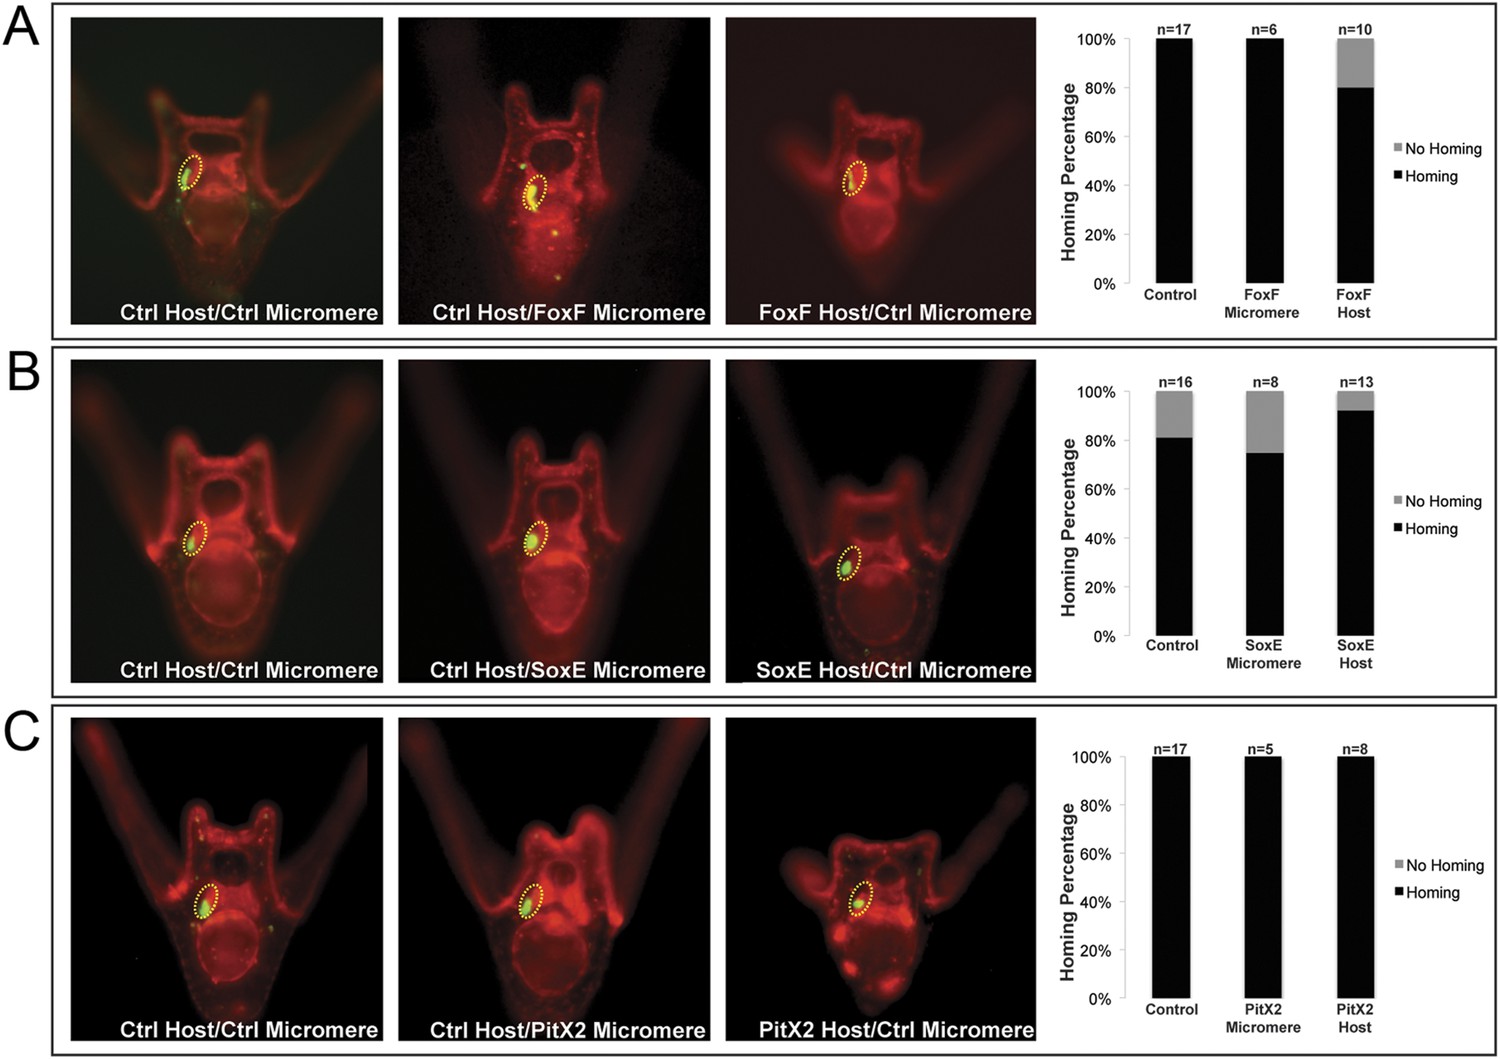
Coelomic pouch transcription factors that do not affect homing.
Transcription factors FoxF (A), SoxE (B), and PitX2 (C) are not seen to affect homing when they are perturbed in either the small micromeres or the NSM. The graph depicts the percentage of embryos (Control Host vs Delta Host) seen with the given ability to home (Black = Homing vs Gray = No Homing), ‘n’ equals the number of embryos scored in each case, and p-values were calculated using a χ2 test. No p-values were deemed significant.
Figure 5—figure supplement 2
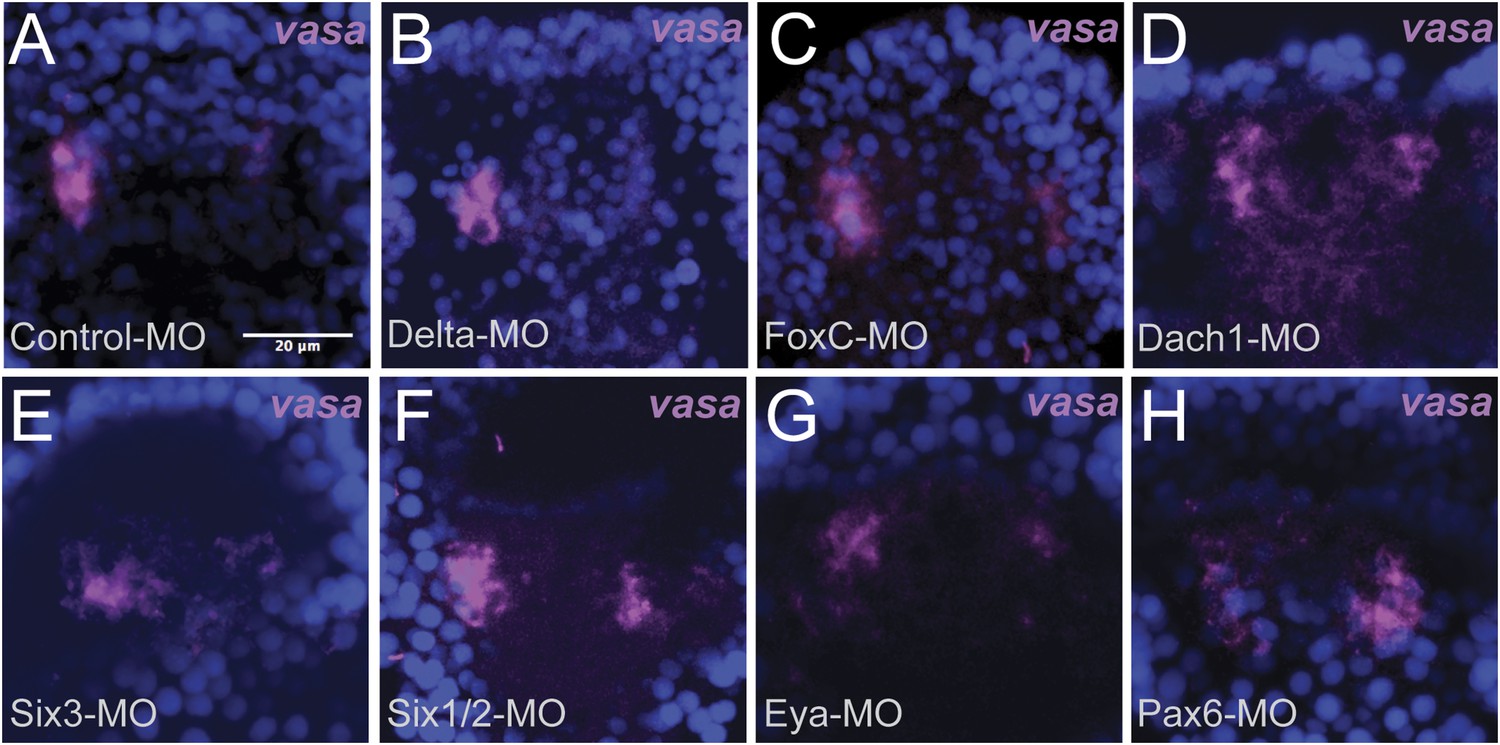
Whole embryo perturbation of coelomic pouch transcription factors assayed for vasa expression.
Embryos injected with a Control-MO and stained for vasa mRNA expression was seen to appropriately segregate small micromeres in the left and right coelomic pouches (A). Embryos perturbed for Delta (B), FoxC (C), Dach1 (D), Six3 (E), Six1/2 (F), Eya (G), and Pax6 (H) were assayed for vasa expression in the coelomic pouches to test whether migration defects were seen in endogenous knockdown situations. Small micromeres were seen to properly segregate to coelomic pouches, or in the case of Delta to the side of the archenteron (since there are no coelomic pouches in a Delta–MO) in each perturbation.
Figure 6 with 1 supplement
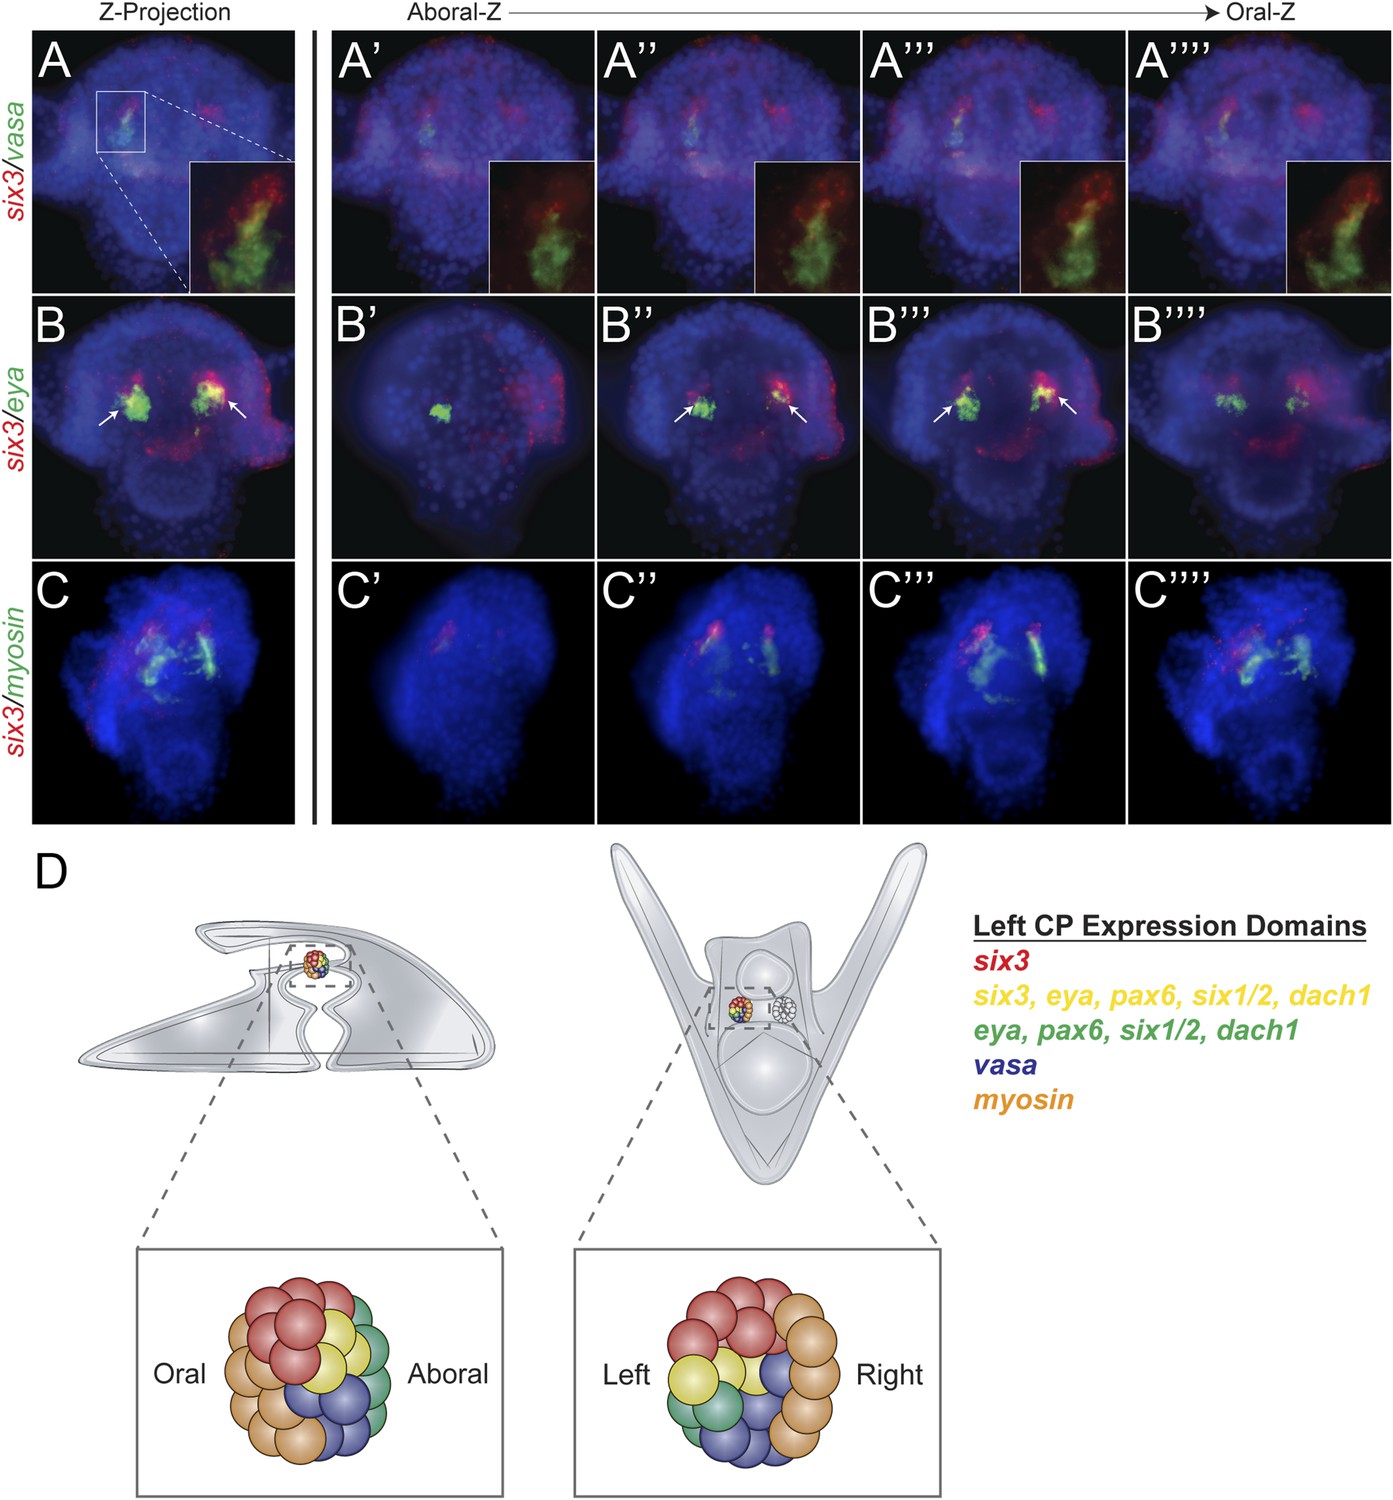
Expression domains within the coelomic pouch.
Double fluorescent in situ hybridization of six3 with vasa shows a tight apposition of their expression domains but a lack of co-localization (A–A′′′′). Z projection of six3 and vasa is seen in (A), and individual Z sections are seen from aboral to oral most locations in the embryo in (A′–A′′′′). Insets on panels A–A′′′′ show a zoomed perspective of just the left coelomic pouch apposed expression of six3 and vasa. six3 and eya were seen to overlap in the aboral coelomic pouch in both the Z projection (B) and Z sections (B′′ and B′′′) but not in Z sections (B′ or B′′′′). myosin expression was seen to be in the most oral expression domain of the coelomic pouch, distinct of six3 (C–C′′′′). An illustration demonstrating the expression domains observed in the coelomic pouch from our data and the data of Luo and Su, 2012 is displayed in (D) from both the lateral and oral views.
Figure 6—figure supplement 1
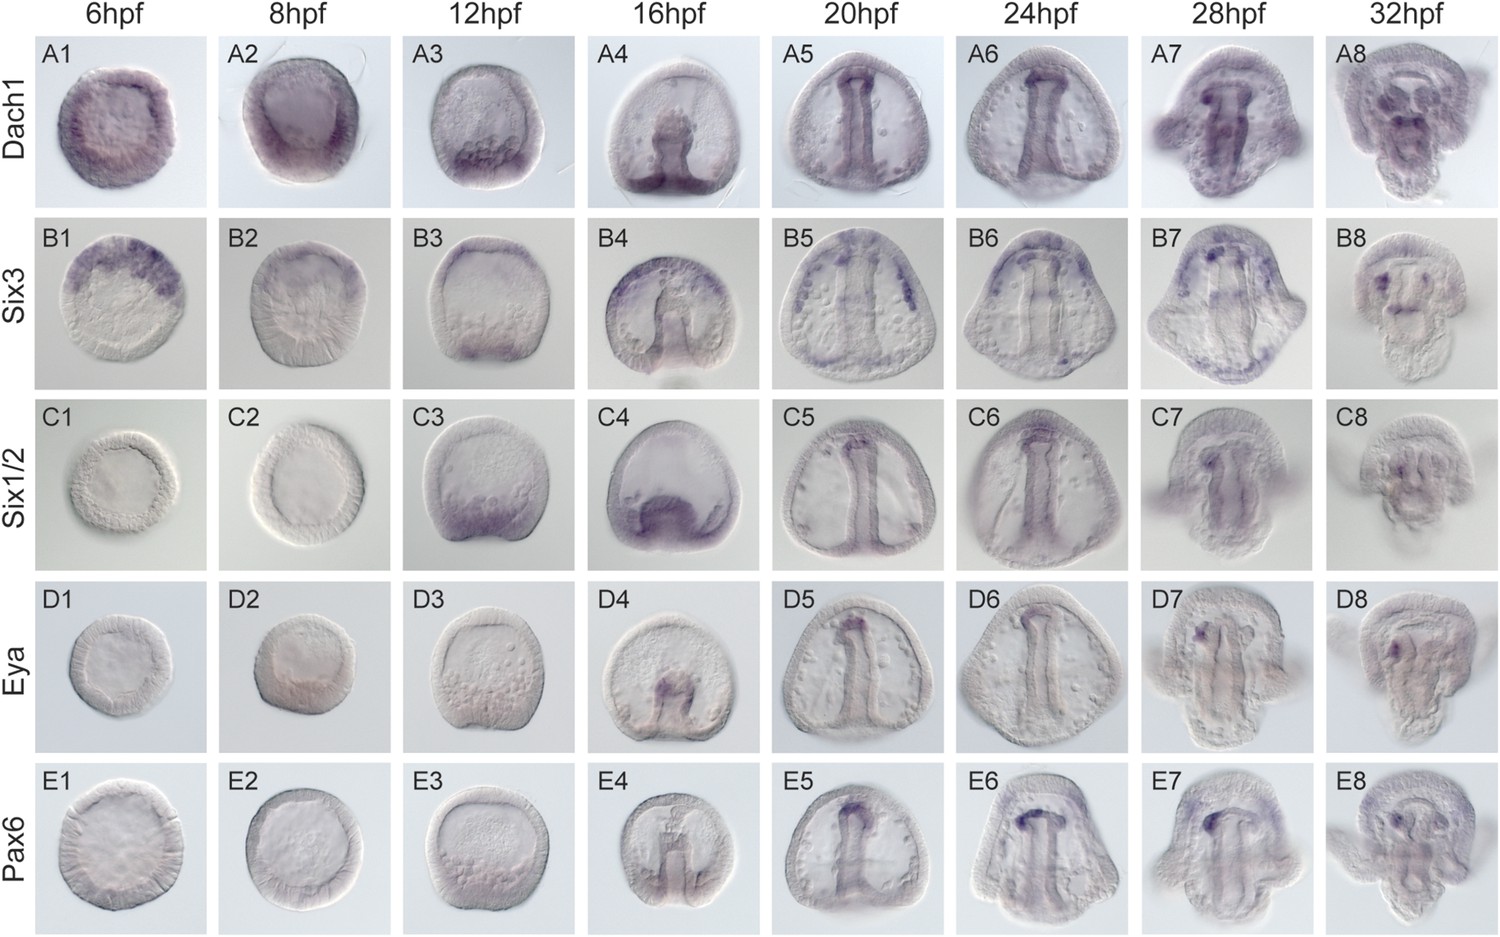
Spatial and temporal expression of homing genes by whole mount in situ hybridization.
Dach1, dachshund, is first detected early in development. It becomes spatially restricted around mesenchyme blastula to the coelomic pouch mesoderm (A3). During gastrulation, it is found throughout and at the tip of the archenteron in the presumptive coelomic pouch cells (A5-8) and is maintained in that tissue and gut throughout coelomic pouch coalescence with the small micromeres at the pluteus stage (A7-8). six3's earliest detectable expression is at early blastula (B1). It is found in the animal pole region, and expression in the coelomic pouch mesoderm begins around mesenchyme blastula (B3). Throughout gastrulation, six3 is found in the apical plate domain and the future coelomic pouch cells (B3-4). As was seen in Wei 2009, the six3 apical domain of expression is responsible for giving rise to neural fates. Post-gastrulation, six3 is expressed in both coelomic pouches (B8). Six1/2 is seen to be expressed in the NSM beginning at mesenchyme blastula (C3). It maintains expression in the NSM throughout early development and is in the coelomic pouches by early pluteus (C7). Genes activated at mid-gastrula stage at the tip of the archenteron and endure throughout gastrulation include foxc and eya. mRNA expression is detected in the coelomic pouch mesoderm at the tip of the archenteron and end up in the coelomic pouches. eya begins expression at mid-gastrula in the aboral coelomic pouch at the tip of the archenteron (D4). eya expression by 32 hpf is found in the left coelomic pouch (D8). pax6 expression begins at mid to late gastrula stage in the aboral coelomic pouch at the tip of the archenteron, roughly at the time of ectopic small micromere homing (E5), and by 32 hpf is found in the left coelomic pouch and two lateral patches of ectoderm presumed to be neural in fate (E8).
Figure 7 with 2 supplements
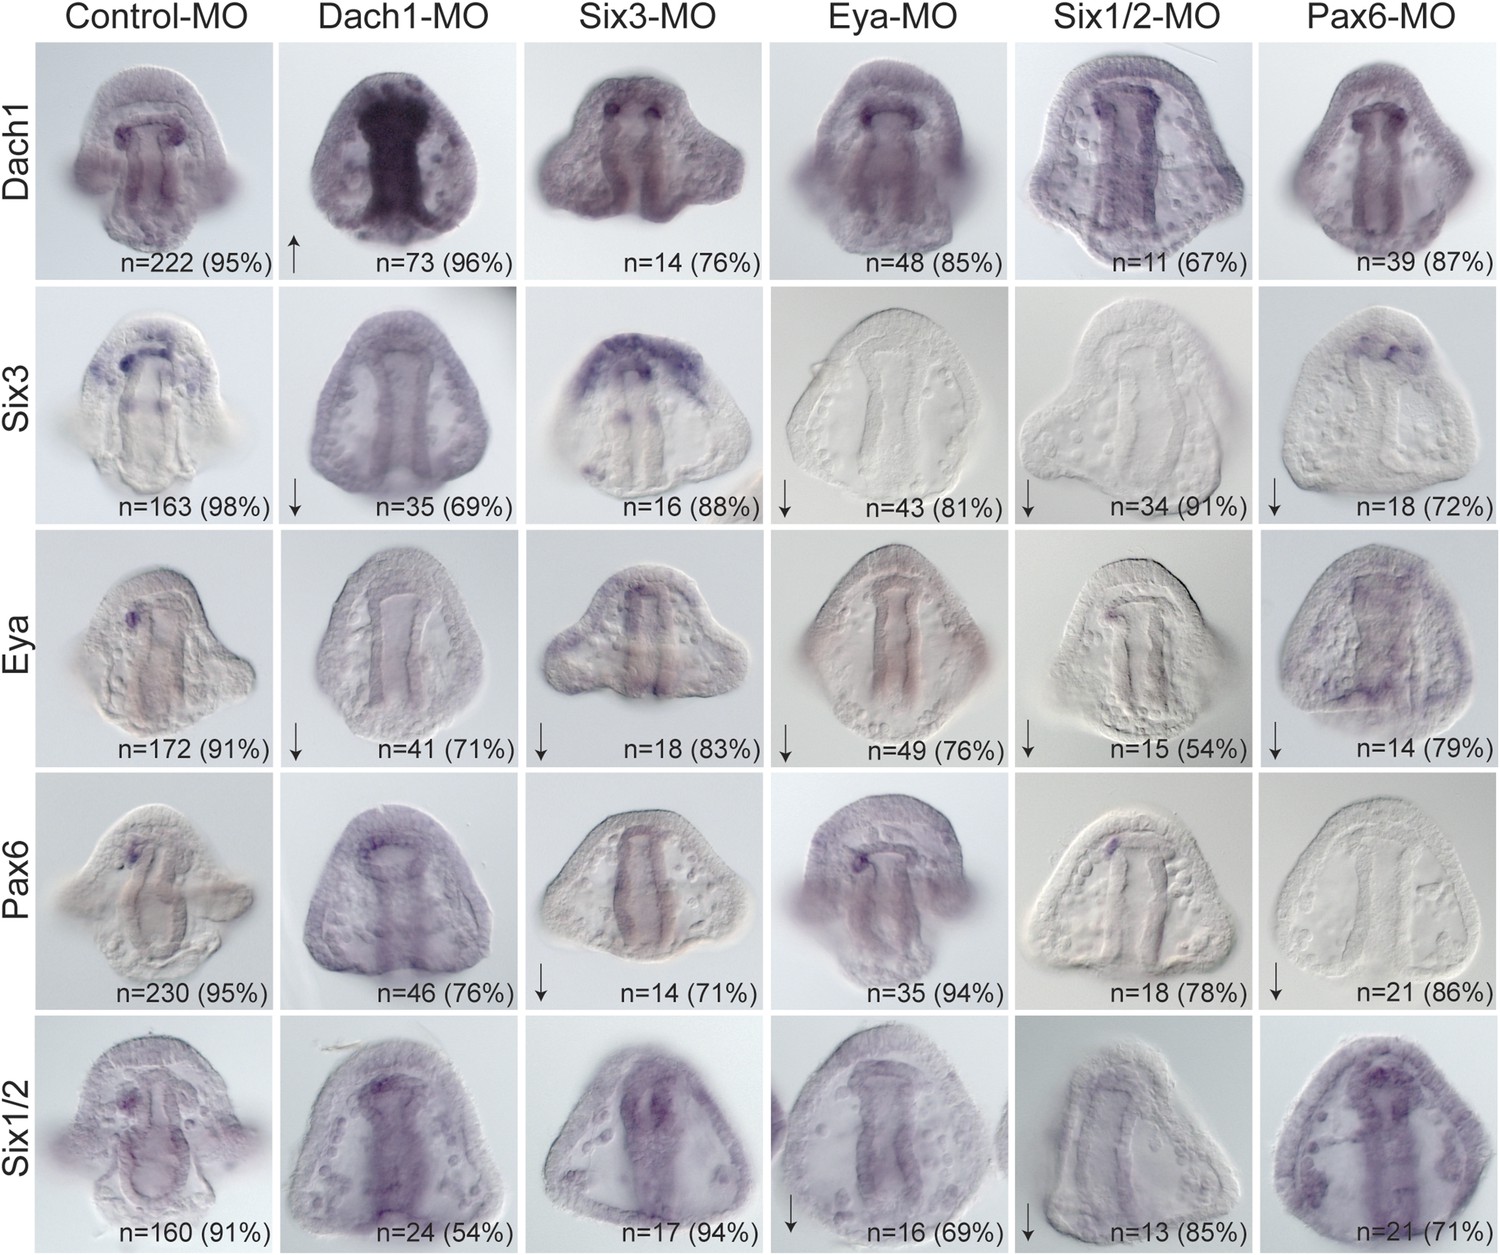
Perturbation analysis unveils regulatory linkages in a homing GRN.
Perturbations using a Dach1 morpholino (MO) showed Dach1 to be upstream of dach1, six3, and eya. A Six3-MO caused a downregulation of eya and pax6. Pertubations with an Eya-MO showed Eya to be upstream of six3, six1/2, and eya. Six1/2 is seen to be upstream of six3, eya, and six1/2. Finally, a Pax6-MO caused a downregulation of six3, eya, and pax6. Arrows represent up or downregulation seen for each panel. ‘n’ equals the total number of embryos scored, and the adjacent percentage designates the percent of embryos scored with the shown effect. Morpholino morphology phenotypes at 24 hpf and 48 hpf are presented in Figure 7—figure supplement 1. Unpublished morpholino data has been validated using a second, distinct morpholino (see Figure 7—figure supplement 2).
Figure 7—figure supplement 1
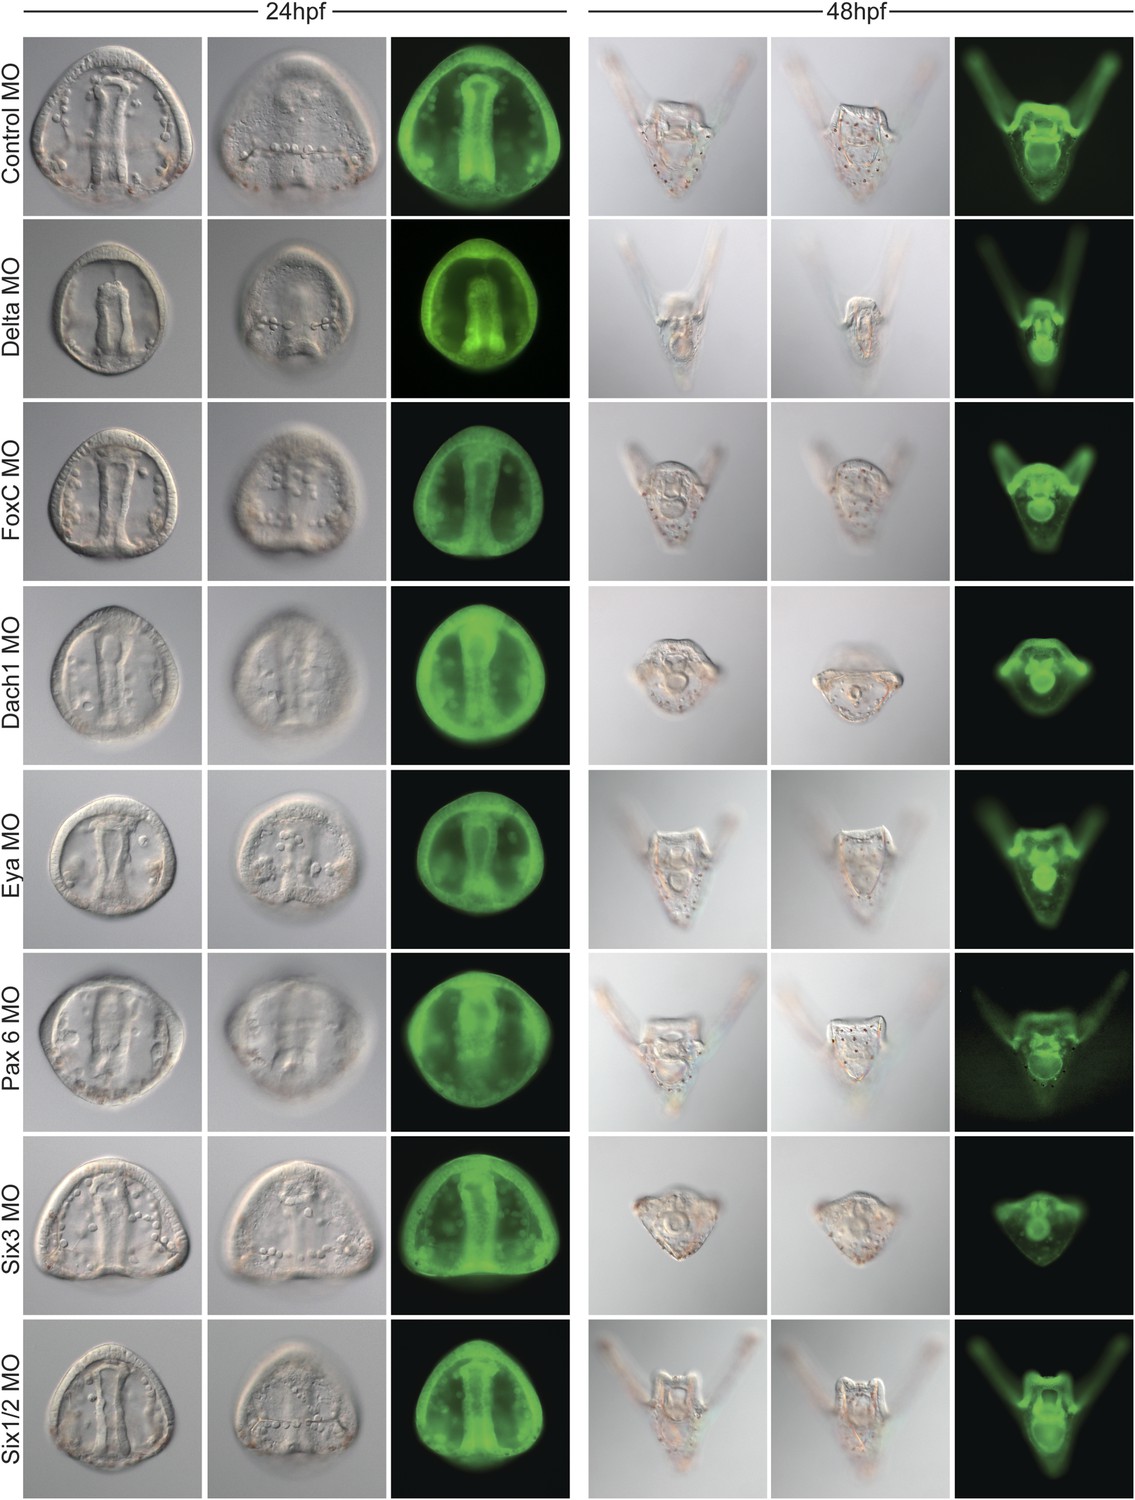
Morpholino phenotypes.
Morpholino morphologies and general health for all morpholinos used were assayed at 24 and 48 hpf. Each morpholino was imaged at two time points and multiple focal planes. GFP images are shown as proof of injection. Since many of the morphants display a short arm phenotype at 2 dpf, specific focus on their forming skeleton was focused at 24 hpf.
Figure 7—figure supplement 2
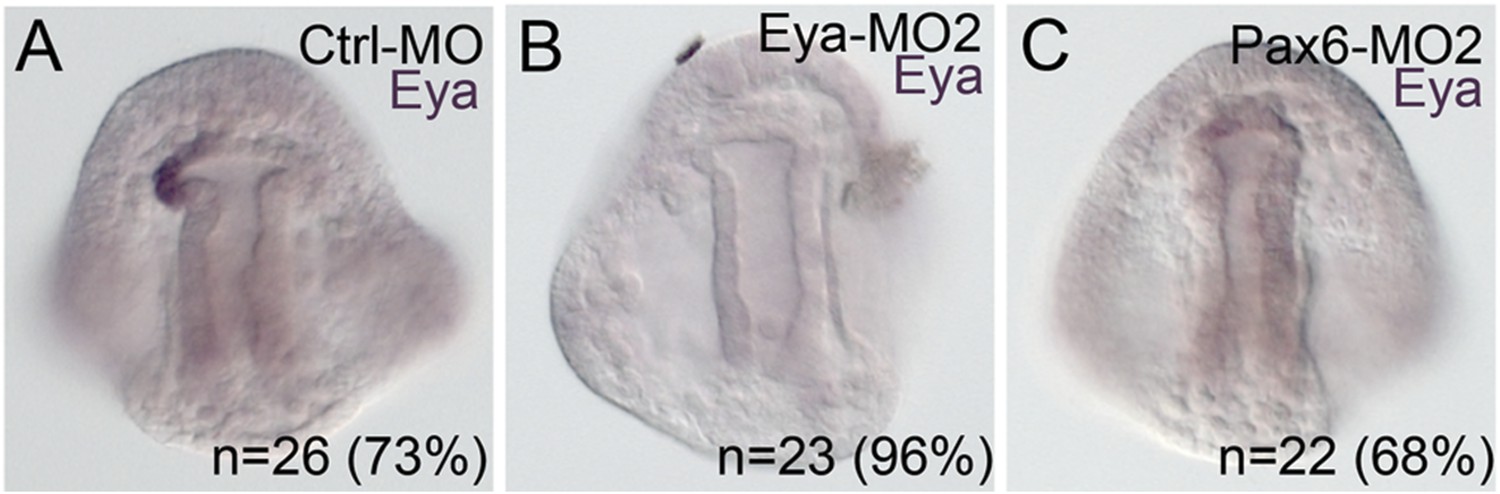
Morpholino effects seen in this paper that have not previously been validated were confirmed using a second morpholino designed in a location distinct to the site of the first morpholino.
(A) Using the same Ctrl-MO as was used in Figure 5, 73% of the time, eya mRNA expression is present in the pattern shown. (B) The second morpholino designed to the translation start site of Eya, matched results of the first morpholino with eya mRNA downregulated in 96% of cases. (C) The second Pax6 morpholino, also designed to block translation, also matched the perturbation effect of the first morpholino in that 68% of the embryos scored were downregulated for eya mRNA. N is equal to the number of embryos scored.
Figure 8 with 1 supplement
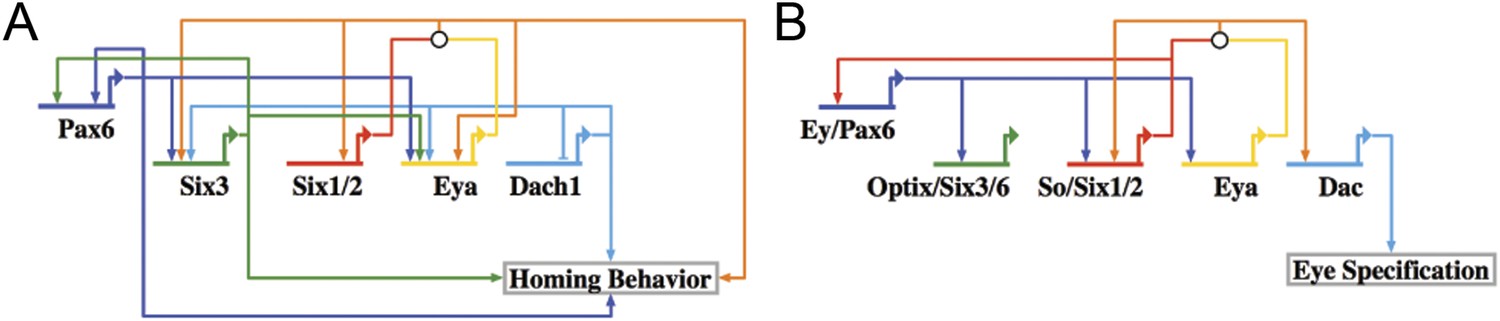
Homing GRN subcircuit shows striking resemblance to Drosophila RDGN.
(A) The perturbation analysis was mapped as a Biotapestry network model. (B) A retinal gene network subcircuit extracted from Drosophila (Kumar, 2009) shows a very similar circuit with few regulatory linkage changes in comparison.
Figure 8—figure supplement 1
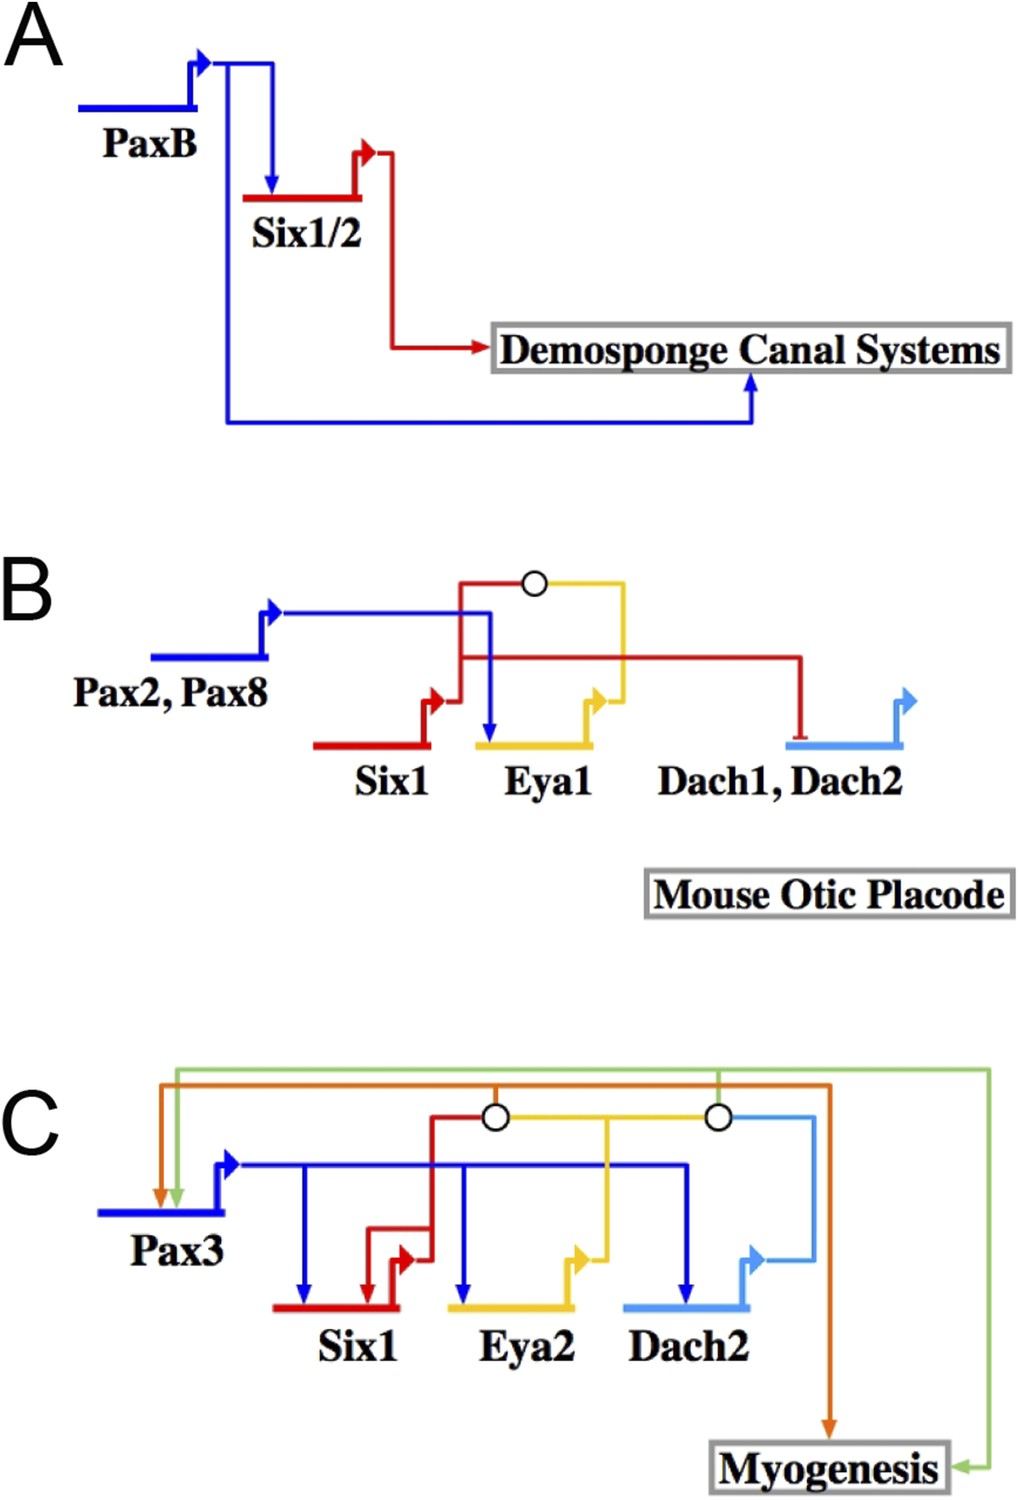
The RDGN subcircuit is conserved throughout evolution.
Similar putative GRN models were deduced based on publications in systems also known to utilize RDGN components and assembled in Biotapestry: (A) Demosponge canal systems, (B) vertebrate skeletal myogenesis, and (C) the mouse otic placode.
Videos
Video 1
Movement of small micromeres throughout gastrulation.
Membrane-GFP labeled micromeres were transplanted to a H2b-RFP-labeled host. An image was acquired every 3 min for 6 hr starting at 12 hr post fertilization. Videos were projected from multiple z-stacks (every 3 μm, spanning the blastocoel of the embryo) using SoftWorx for DeltaVision. AVIs were then rotated and translated (due to swimming embryos) in FIJI. Frame rate = 5 frames per second.
Tables
Table 1
Transplant efficacy for microsurgeries
Table 2
Plasmids used in this study
| Plasmid | Fragment | Accession number |
|---|---|---|
| Dach1 | Full CDS | KR181947 |
| Delta | Full CDS | KR181946 |
| Eya | Full CDS | KR181945 |
| FoxC | Full CDS | KR181944 |
| FoxF | Full CDS | KR181943 |
| Pax6 | Full CDS | KR181942 |
| PitX2 | Full CDS | KR181941 |
| Six3 | Full CDS | KR181940 |
| SoxE | Full CDS | KR181939 |
Table 3
Morpholino anti-sense oligonucleotide sequences used in this study
| MASO | MASO sequence | Morpholino type | Working concentration |
|---|---|---|---|
| LvPax6-MO1 | GTTGACCTGGCATAGCAGCATTTAC | Translation blocking | 1.2 mM |
| LvPax6-MO2 | CATGTCCCCGTGACCCATAGTTTTC | Translation blocking | 0.3 mM |
| LvEya-MO1 | GCGCTGAAGCTATTTGACATGCTGT | Translation blocking | 0.75 mM |
| LvEya-MO2 | GTTGAAACCTGTTTGACTGTAGGCC | Translation blocking | 1 mM |
| LvSix3-MO | ATGTTTCCGACTCCGTCCAAACCAT | Translation blocking (Wei et al., 2009) | 0.75 mM |
| LvSix1/2-MO | CCCAAGTCCGTGGCAAGGATAAGAT | Translation blocking (Ransick and Davidson, 2012) | 0.5 mM |
| LvDach1-MO | AGTAGGCGGTGGACTTCCCATTTTC | Translation blocking (Peter and Davidson, 2011) | 0.5 mM |
| LvFoxC-MO | TGAAGCGTACATTGGCATGGATGTT | Translation blocking (Andrikou et al., 2015) | 0.75 mM |
| LvDelta-MO | GTGCAGCCGATTCGTTATTCCTTT | Translation blocking (Sweet et al., 2002) | 0.4 mM |
| LvFoxF-MO | TCTAATTGAGTCATCTGGAGAGTGT | Translation blocking (Andrikou et al., 2015) | 0.75 mM |
| LvSoxE-MO | GCTCTAAACTCTCAGGGCTACTCAT | Translation blocking | 0.75 mM |
| LvPitX2-MO | ACTGGTTCATCGCTGCTGATTAATT | Translation blocking | 0.6 mM |
| Control-MO | CCTCTTACCTCAGTTACAATTTATA | Translation blocking | ExptDependent |
Download links
A two-part list of links to download the article, or parts of the article, in various formats.
Downloads (link to download the article as PDF)
Open citations (links to open the citations from this article in various online reference manager services)
Cite this article (links to download the citations from this article in formats compatible with various reference manager tools)
Deployment of a retinal determination gene network drives directed cell migration in the sea urchin embryo
eLife 4:e08827.
https://doi.org/10.7554/eLife.08827


