Distinct mechanisms define murine B cell lineage immunoglobulin heavy chain (IgH) repertoires
- Stanford University, United States
- HudsonAlpha Institute for Biotechnology, United States
- California Institute of Technology, United States
Figures
Figure 1 with 3 supplements

The B-1a IgH CDR3 sequences are much less diverse and recur more frequently than the CDR3 sequences expressed by FOB and MZB B subsets.
IgH CDR3 tree-map plots illustrating the IgH CDR3 nucleotide sequences expressed by indicated B cell subsets sorted from one 2-month old C57Bl/6 mouse. Each rectangle in a given tree-map represents a unique CDR3 nucleotide sequence and the size of each rectangle denotes the relative frequency of an individual sequence. The colors for the individual CDR3 sequences in each tree-map plot are chosen randomly thus do not match between plots. The numbers shown in the CDR3 tree-map plots highlight the highly reoccurring CDR3 sequences including PtC-binding CDR3 sequences. 1, ARFYYYGSSYAMDY, V1-55D1-1J4; 2, MRYGNYWYFDV, V11-2D2-8J1; 3, MRYSNYWYFDV, V11-2D2-6J1; 4, MRYGSSYWYFDV, V11-2D1-1J1. Lower middle panel: FACS plots showing the gating strategy used to sort the phenotypically defined each B cell subset from spleen (s) or peritoneal cavity (p). Note: peritoneal B-1a cells are well known to express CD11b, a marker expressed on many myeloid cells including macrophage and neutrophils. The level of CD11b expressed on peritoneal B-1a cells, however, is roughly 100 fold lower than the level of CD11b expressed on the myeloid cells. This drastic difference is sufficient to separate the CD11b+ B-1a cells from the myeloid cells if monoclonal anti-CD11b reagent is included in the dump channel (Figure 1—figure supplement 3).
Figure 1—figure supplement 1
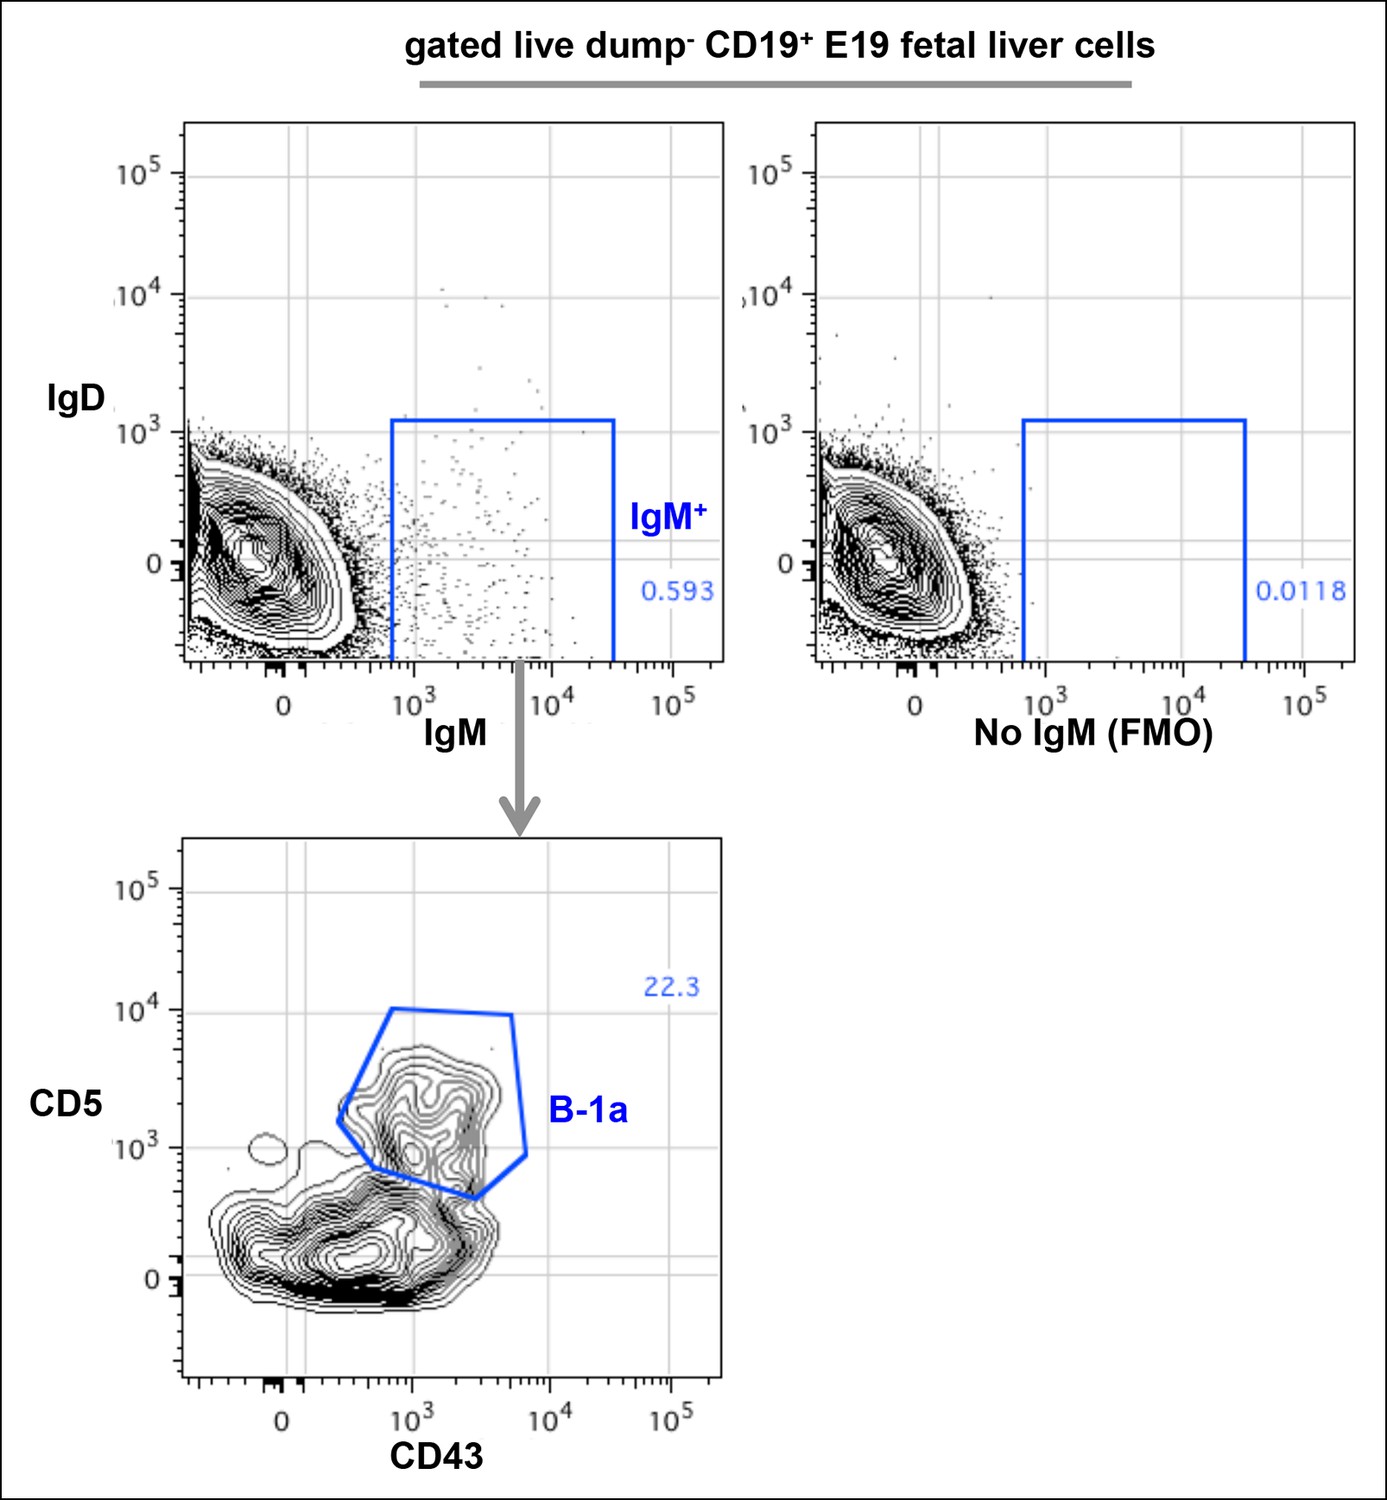
FACS plots showing CD43+ CD5+ IgM+ B-1a cells in E19 fetal liver.
Live dump- (CD11b- CD11c- Gr-1- F4/80- CD3- TCRαβ-) CD45+ CD19+ cells from E19 fetal liver of C57Bl/6 mouse were gated to show IgM and IgD expression. The boundary for IgM expression was determined from fluorescence-minus-one (FMO) control in which fluorescently labeled anti-mouse IgM antibodies are omitted from the staining sets (right plot). IgM+ IgD- cells were further gated to reveal CD43+ CD5+ B-1a cells.
Figure 1—figure supplement 2

Recurrent VH11-encoded PtC-binding V(D)J sequences.
(A-C) lists three VH11-encoded PtC-binding V(D)J sequences. In each plot, the first line of nucleotides is the obtained sequence read while the second line refers the germline reference sequence. The underlined nucleotides are CDR2 and CDR3.
Figure 1—figure supplement 3
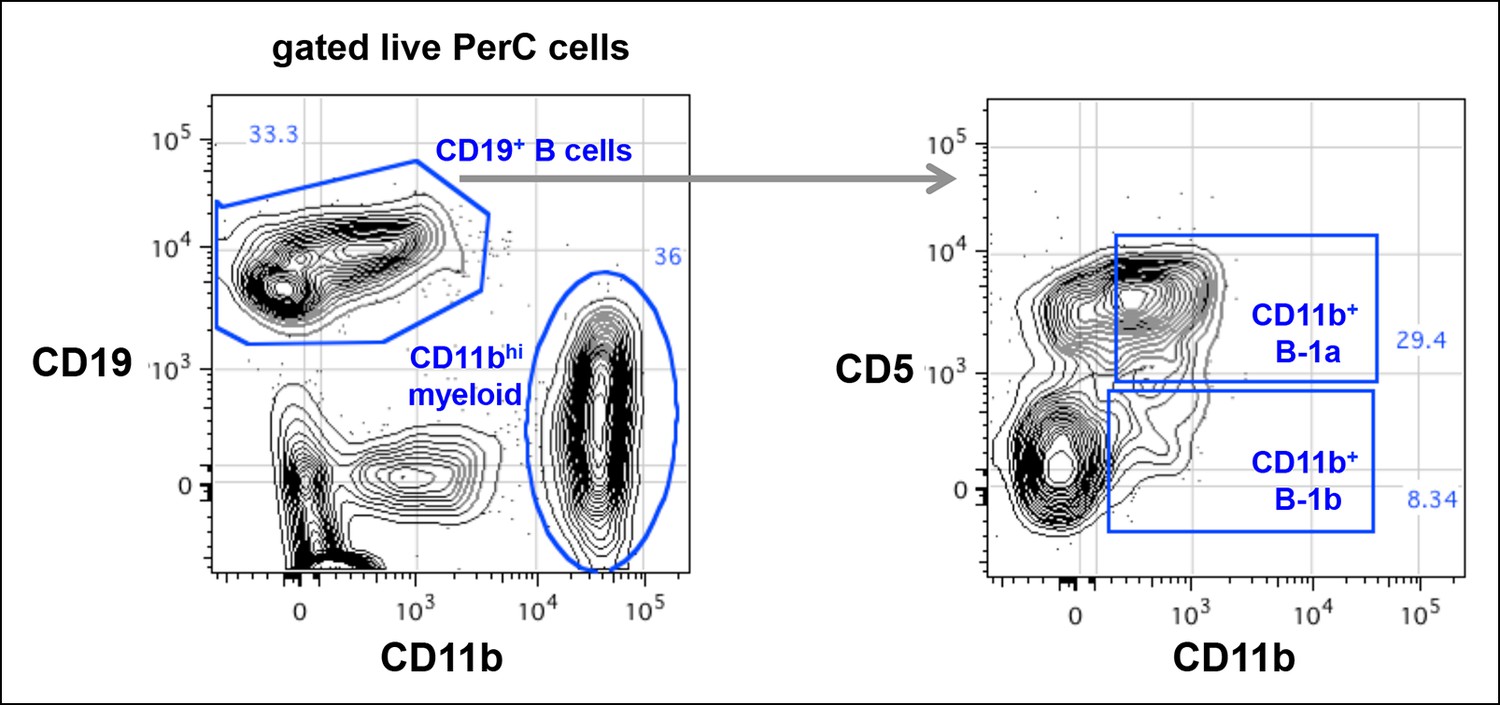
CD11b expression on peritoneal B-1a (CD5+) and B-1b (CD5-) is roughly 100-fold lower than the CD11b expression on myeloid cells.
Live cells from C57Bl/6 peritoneal cavity were gated to show CD19 and CD11b expression. The CD19 + B cells and CD11bhi myeloid cells were shown. The CD19+ B cells were gated to reveal CD5 and CD11b expression. CD11b+ B-1a and CD11b + B-1b cells were gated based on FMO control staining where anti-CD11b antibody was omitted in the staining.
Figure 2
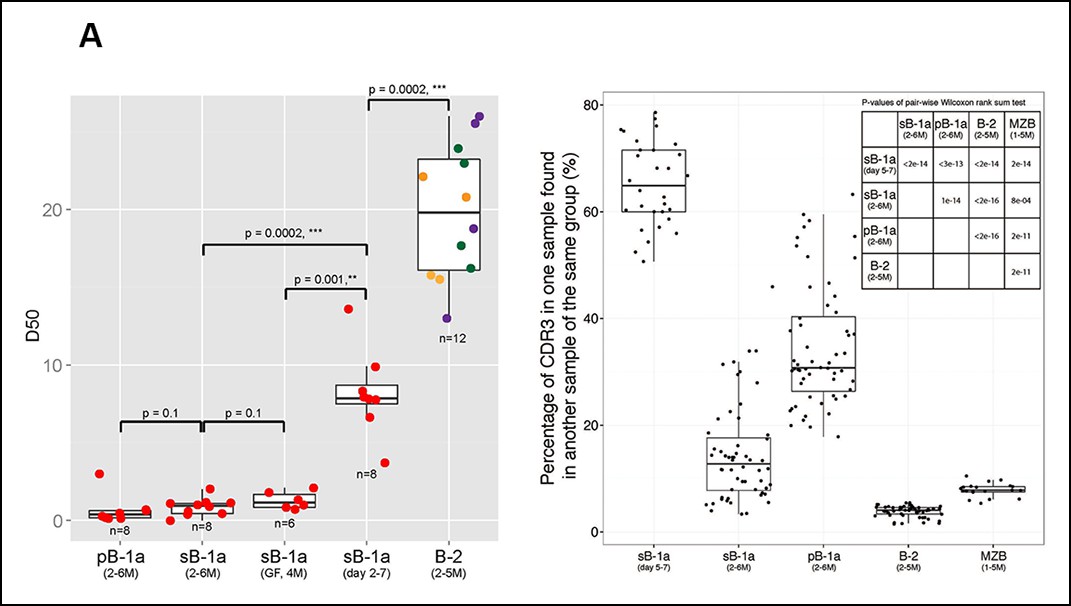
The B-1a pre-immune IgH repertoire is far more restricted than the pre-immune IgH repertoires expressed by splenic FOB, MZB and peritoneal B-2 cells.
(A) D50 metric analysis quantifying the IgH CDR3 diversity for B cell subsets from mice at the indicated age. Low D50 values are associated with less diversity. Each dot represents the data for a B cell sample from an individual mouse except for the 2 day splenic B-1a data, which are derived from sorted cells pooled from 8 mice. B-1a samples are labeled with red; B-2 samples include FOB (green, n = 4), pB-2 (purple, n = 4) and MZB (yellow, n = 4). The data for germ-free (GF) animals is discussed at the end of the Result section. (B) CDR3 peptide pair-wise sharing analysis of IgH repertoire similarity among multiple samples for each B cell group (n = 5-9). Each dot represents the percentage of common CDR3 peptides in one sample that are also found in another sample within a given group. For example, to compute the similarity between sample A and B, the percentage of CDR3 peptides in sample A that are also found in sample B (), together with the percentage of CDR3s in sample B that are also in sample A () are used as an indicator. For comparison of 6 splenic B-1a samples in 5-7 day group, there are 30 comparisons. Right upper: p values showing the statistical significance between two groups. Box plots represent the 10th, 25th, 50th, 75th and 90th percentiles here and in other figures.
Figure 3 with 2 supplements
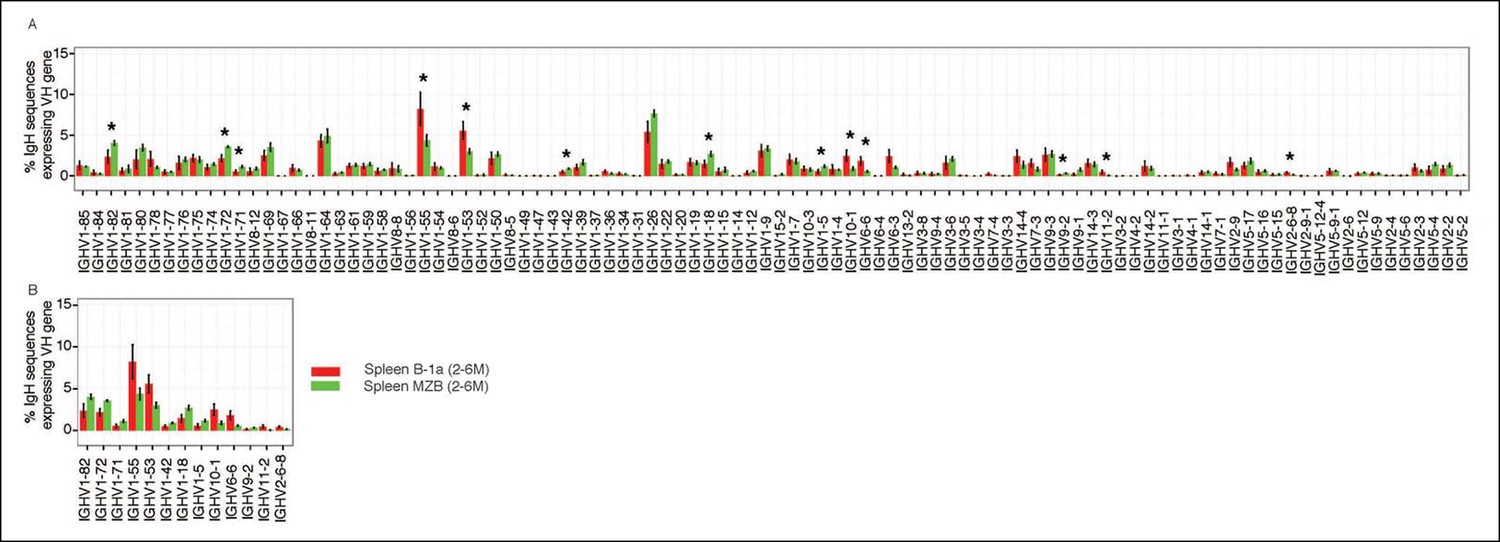
Comparison of VH gene usage by splenic B-1a vs MZB B cells.
(A) VH gene usage profile shown as the percentage of IgH sequences expressing the listed individual VH genes for individual B cell samples. The profiles are shown for adult splenic B-1a samples (n = 9, red) and for MZB samples (n = 5, green). VH genes (from left to right) are ordered in 5’- to 3’-direction bases on chromosome location; the IMGT VH gene nomenclature is used (Lefranc, 2003). (B) VH genes showing the statistically significant differences (Welch’s t-test p<0.05) between two groups are listed and also highlighted with asterisks in the plot. To minimize the impact of the clonal expansion on the VH gene usage profile, data are presented as the normalized distribution that counts each distinct CDR3 nucleotide sequence expressing a given VH gene as one, no matter how many times the sequence was detected. Note: VH12-3 encoded IgH sequences are not detected in this study due to the technical limitations that exclude the VH12-3 primer from the set of primers designed about three years ago and used for studies presented here. We have since corrected this problem so that VH12-3 primer is now part of our new set of primers. Comparison of sequence data obtained with old vs. the new set of primers shows that, aside from now detecting VH12-3 sequences with the new set of primers, the sequences obtained with both primer sets are highly similar (Figure 3—figure supplement 2).
Figure 3—figure supplement 1

VH gene usage profile pair-wise comparison of B cell groups.
The colors shown at the bottom right distinguish the B cell groups (n = 4-9). VH genes showing the statistically significant differences (Welch’s t-test p<0.05) between two groups are listed on the bottom (A' to F') and also highlighted with asterisks in each plot. The data for germ-free (GF) animals is discussed at the end of the Result section.
Figure 3—figure supplement 2
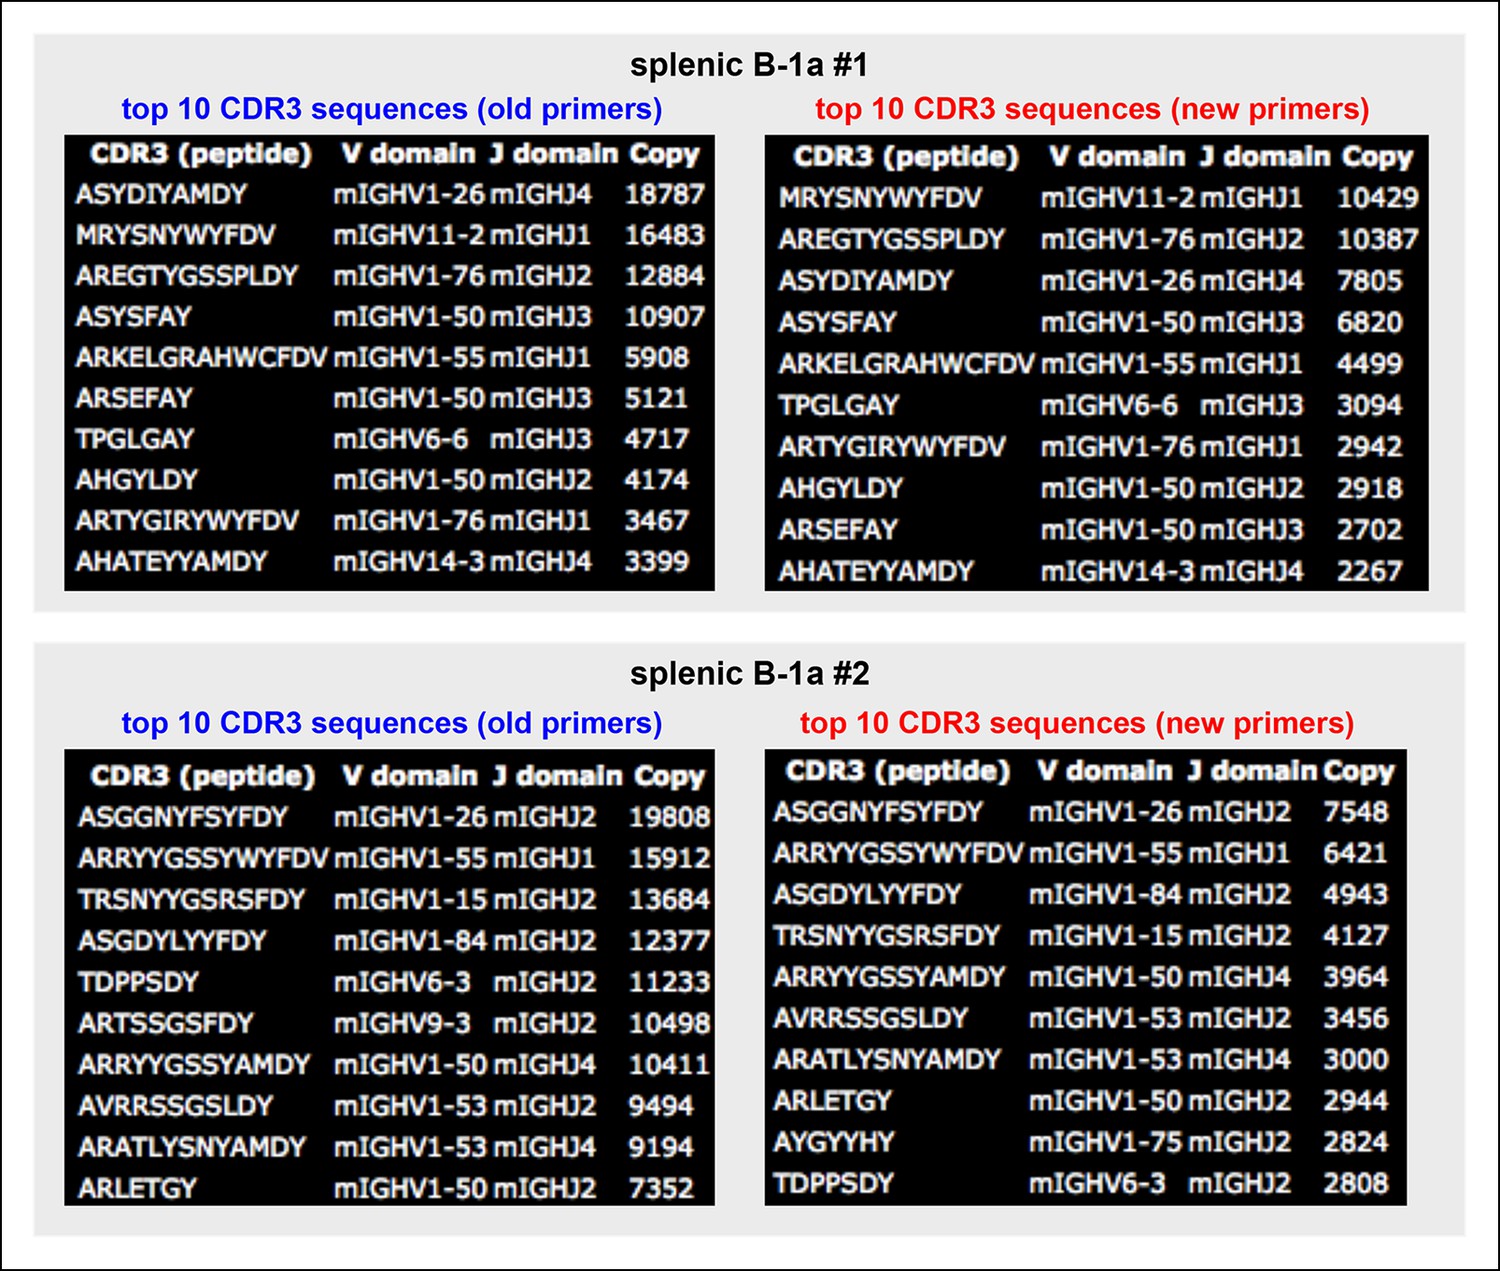
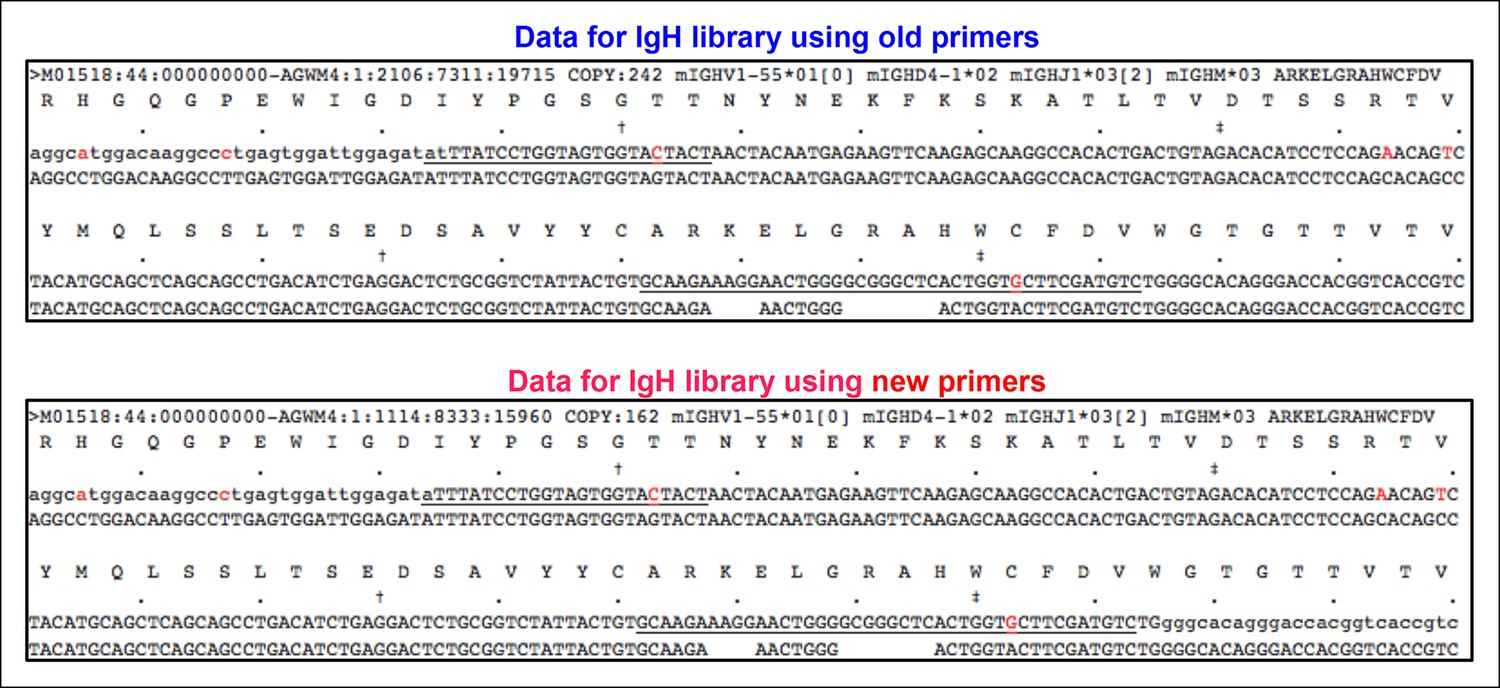
Almost identical top 10 highly recurring CDR3 sequences are detected for splenic B-1a IgH libraries obtained either with the old or new primer set.
We sorted two splenic B-1a populations individually from two 4 month old C57BL/6J mice. We extracted RNA from each population and divided each RNA into two parts. For one part, we prepared an amplified library using the old primer set; and for the other, we prepared an amplified library using the new primer set. We then sequenced these amplified IgH libraries. Analysis of the resultant sequences showed that the sequences obtained from the IgH libraries are highly similar, regardless of the primers used (old or new). In essence, the top 10 highly recurring CDR3 sequences (both peptide and V(D)J recombination) are almost identical and show similar representation order between each pair of libraries. As expected, we detected VH12-3 encoded sequences from the splenic B-1a IgH libraries prepared with the new primer set, and these VH12-3 encoded sequences included several published PtC-binding VH12-3 encode sequences, i.e., AGDYDGYWYFDV (VH12-3D2-4J1), AGDRDGYWYFDV (VH12-3D3-2J1), AGDRYGYWYFDV (VH12-3 D2-9 J1).
Figure 4
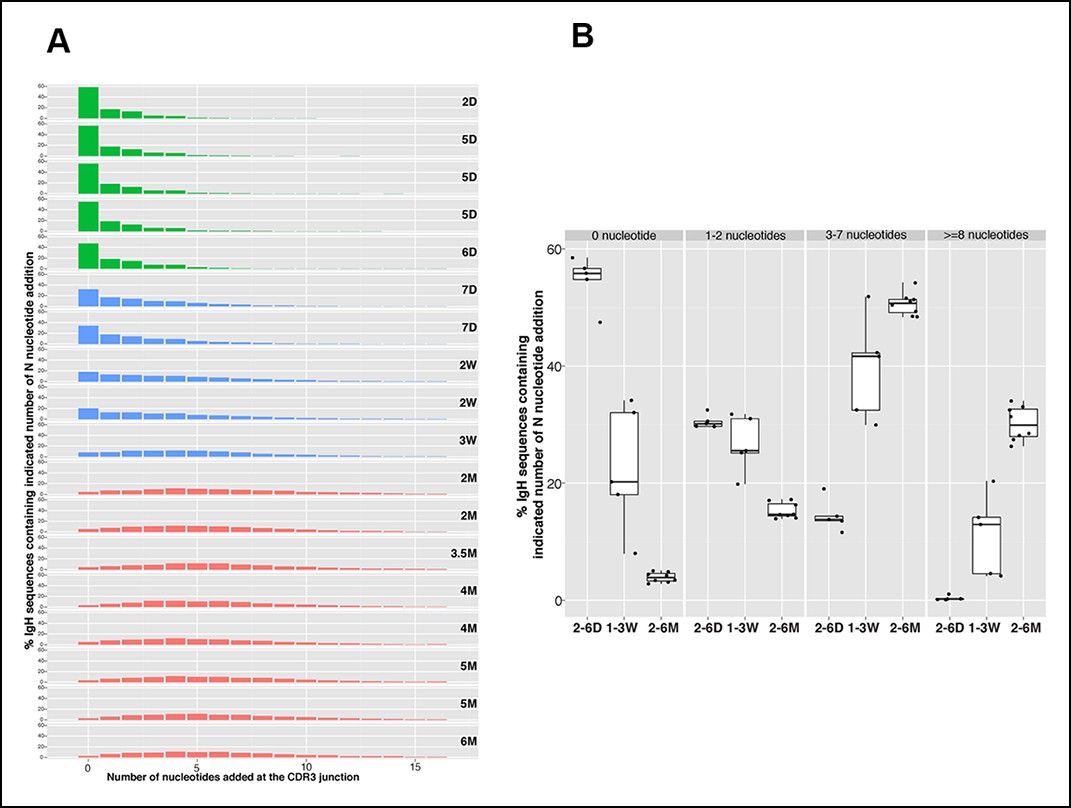
N nucleotide insertion distribution patterns for the B-1a pre-immune IgH repertoires during ontogeny.
(A) Percentage of IgH sequences containing the indicated number of N nucleotide insertions at the IgH CDR3 junctions (V-DJ + D-J) is shown for each spleen B-1a sample from mice at indicated ages (shown at the right). To minimize the impact of self-renewal on the N-addition profile, normalized data are presented. Thus, each distinct IgH sequence containing indicated N nucleotide insertions is counted as one regardless how many times this sequence was detected. Note that the N insertion pattern changes as animals age. Colors distinguish three age-related patterns: green, D2 to D6; blue, D7 to 3W; red, 2M to 6M. (B) Percentages of IgH sequences containing the indicated N-nucleotide insertions (shown at the top) for splenic B-1a samples at the indicated ages are shown. Each dot represents data from an individual mouse, except for day 2 sample, n = 5-7.
Figure 5 with 1 supplement
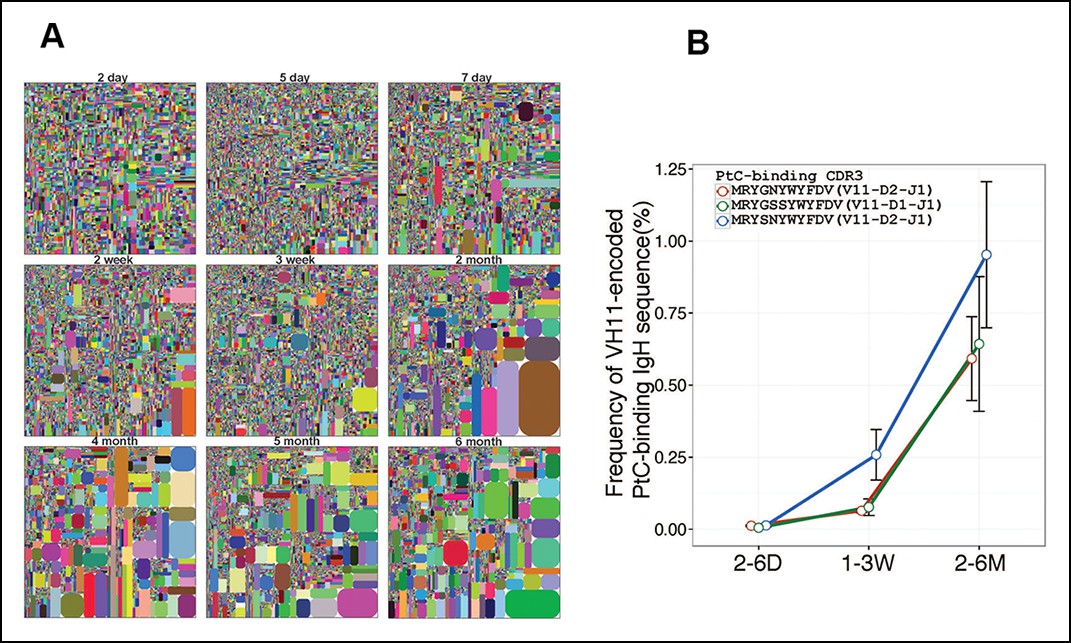
Certain V(D)J sequences increase progressively with age in the B-1a pre-immune IgH repertoire.
(A) IgH CDR3 tree map plots for splenic B-1a samples from mice at different ages are shown. Each plot represents data for an individual mouse, except for the day 2 sample. Recurrent sequences are visualized as larger contiguously-colored rectangles in each plot. (B) Relative frequencies of three PtC-binding IgH CDR3 sequences in indicated splenic B-1a sample groups (n = 5–8 for each group) are plotted with mouse age. Sequence information (peptide and V(D)J recombination) is shown at the top.
Figure 5—figure supplement 1
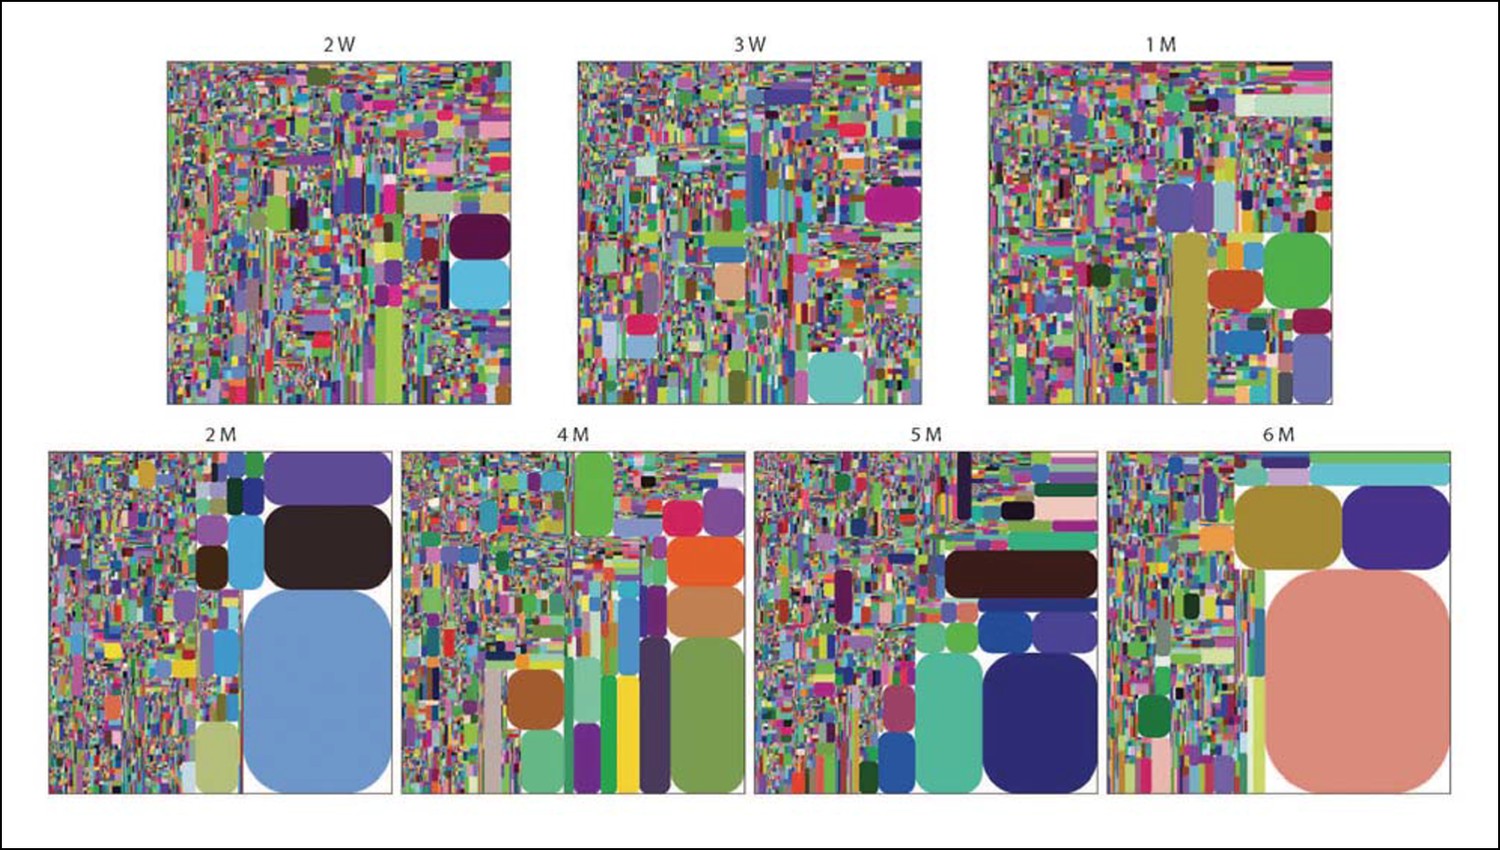
The peritoneal B-1a IgH repertoire is increasingly restricted during ontogeny.
IgH CDR3 tree map plots for peritoneal B-1a samples from different ontogenic stages. Each plot represents the data for a sample from an age-defined individual mouse, except for the 2 week, 3 week and 1 month samples, which are obtained from cells pooled from several mice. Recurrent sequences are visualized as larger contiguously-colored rectangles in each plot.
Figure 6 with 1 supplement
The level of convergent recombination in the B-1a IgH repertoire declines with age.
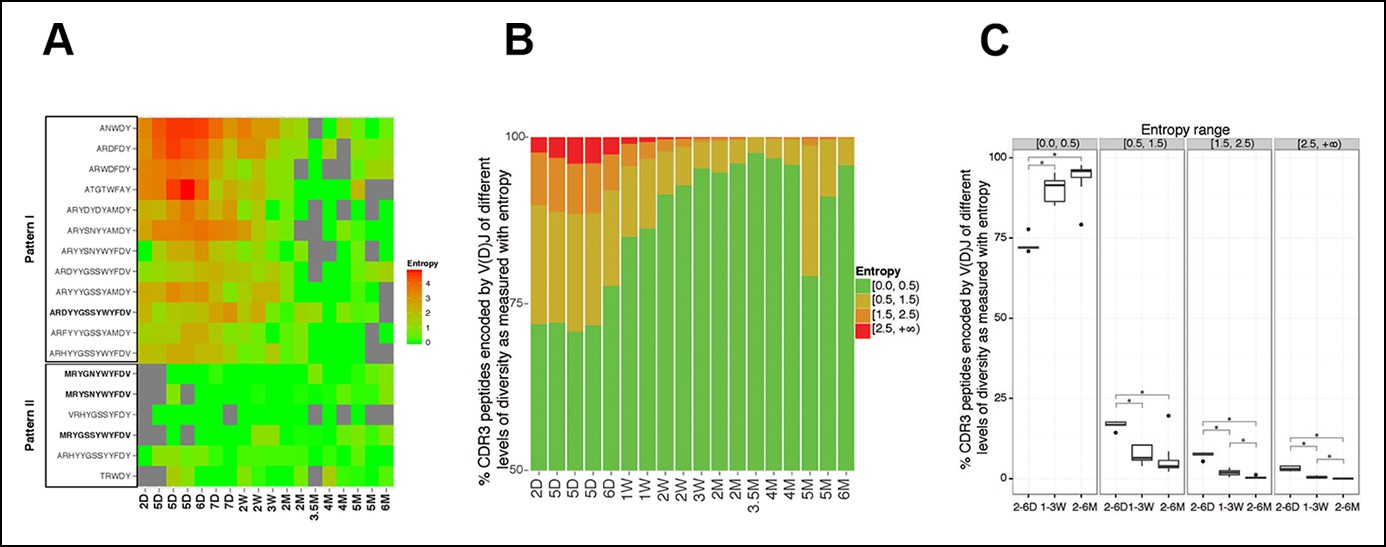
(A) Entropy heat map showing the diversity of V(D)J recombination events for each indicated CDR3 peptide (shown at the left) in splenic B-1a samples at different ages (shown at the bottom). The higher the entropy value, the more diverse the V(D)J recombinations for a given CDR3 peptide. CDR3 peptide sequences for T15 Id+ anti-PC (pattern I) and anti-PtC (pattern II) antibody are shown in bold. (B) The diversities of the V(D)J recombination for each CDR3 peptide for the indicated splenic B-1a samples (shown at the bottom) are quantified as entropy values (see Methods and materials), which are ranked into 4 ranges (shown at the right). For each sample, the frequencies of CDR3 peptide sequences belonging to each entropy range are shown as stacks. (C) Splenic B-1a samples are grouped based on age. For each group (n = 5–7), the frequencies of CDR3 peptide sequences belonging to each of four entropy ranges are shown. *p<0.05, Welch’s t-test.
Figure 6—figure supplement 1
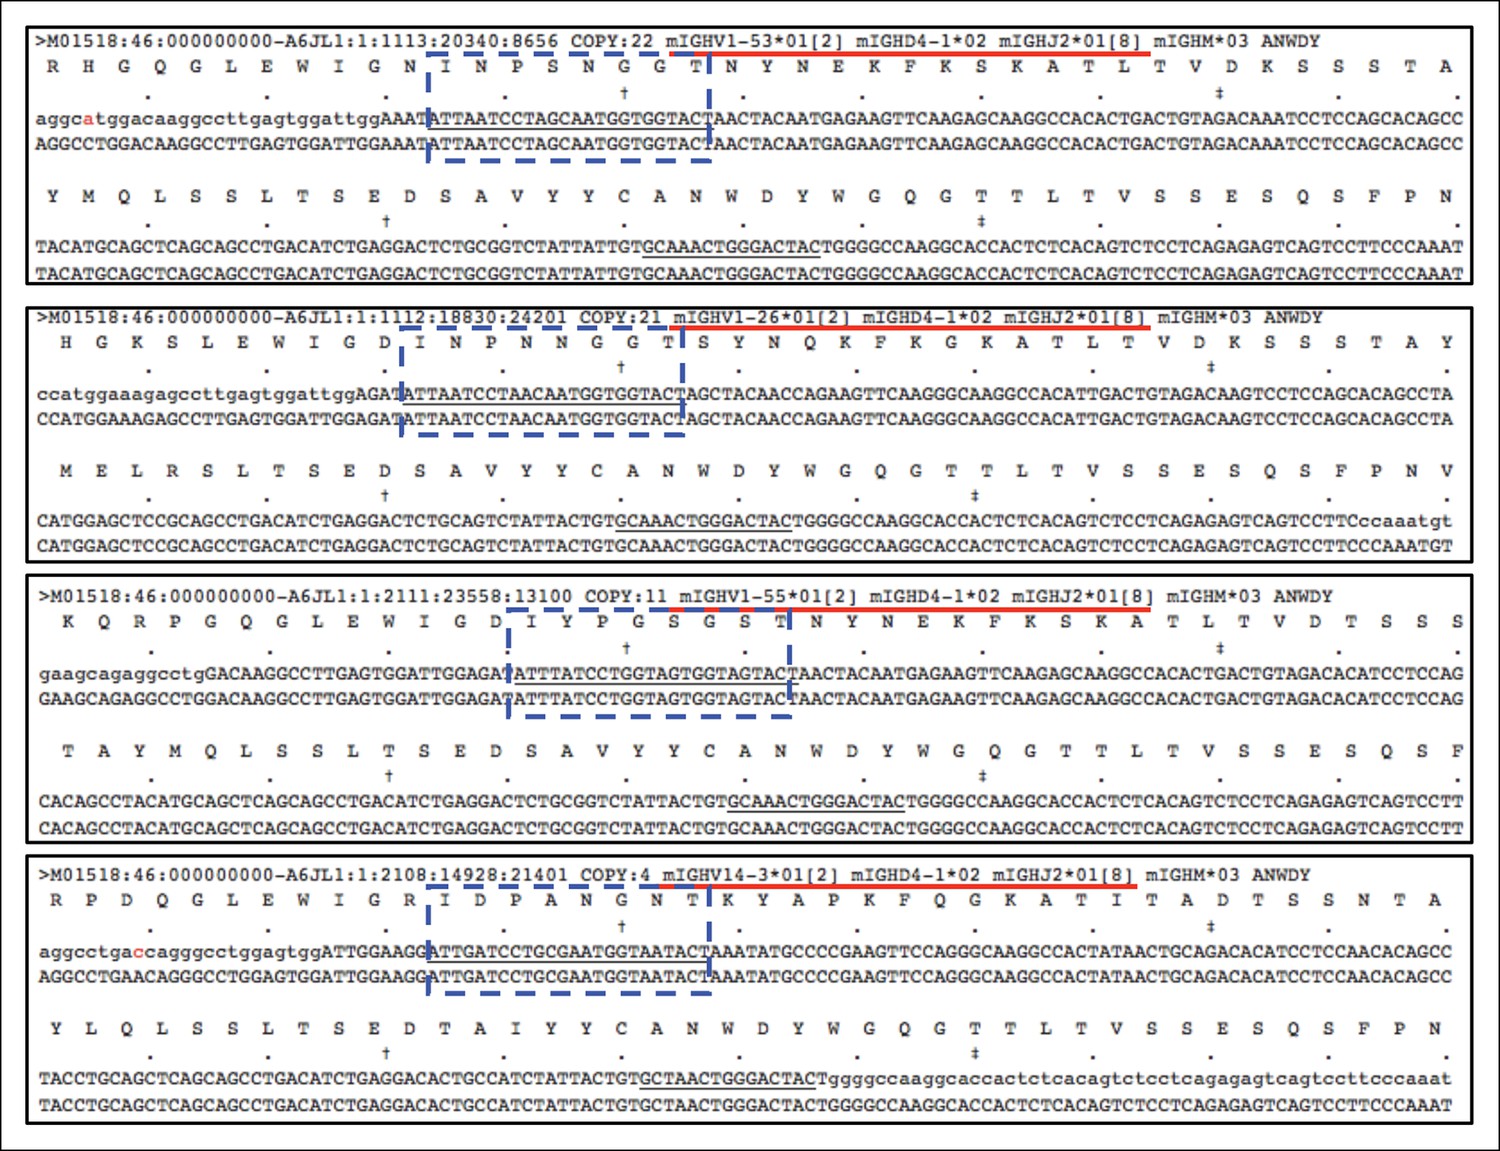
Distinct V(D)J sequences encoding the same CDR3 peptide differ in VH usage.
Plots showing an example, in which four different V(D)J sequences expressed by the 5 day splenic B-1a sample all encode the same CDR3 (ANWDY). Red line denotes the V(D)J recombination. CDR2 sequences are highlighted with the blue doted lined box. The V(D)J recombination (V14-3 D4-1 J2) shown in the bottom plot is the predominant V(D)J for ANWDY identified in adult splenic B-1a IgH repertoire.
Figure 7 with 3 supplements

AID-mediated SHM accumulates on splenic B-1a IgVH with age.
(A) Percentages of sequences containing > = 1 (red) or > = 2 (green) nucleotide changes for B cell samples from mice at the indicated ages are shown (n = 3-8). Seven B cell samples from 4-5 month old AID knockout mice include sB-1a (n = 4), pB-1a (n = 1), FOB (n = 1) and pB-2 (n = 1). Sequences with the identical V(D)J recombination encoding ARGAY CDR3 peptide obtained from splenic B-1a sample from 4 month old specific pathogen free mouse, (B) germ-free mouse (C) and AID knockout mouse (D) are listed. The nucleotide substitution is analyzed at the VH region stretching from the start of CDR2 (red box) to the beginning of CDR3 (yellow box). Obtained sequence (upper line) is aligned with the reference (lower line) for V1-80 (red), J3 (blue) and constant region of IgM isotype (orange). Mutations are highlighted with triangles; asterisks indicate mutations resulting in an amino acid change; red and blue triangles denote mutations in DGYW and WRCH motifs, respectively. (E) Numbers of mutations per 104 base pairs for indicated B cell group are shown. Each dot represents data from an individual sample (n = 3–8). The data for germ-free (GF) animals is discussed at the end of the Result section. Note: The mutation profiles for the splenic B-1a IgH libraries prepared by using either old (VH12-3 deficient) or new primer set (VH12-3 included) are highly similar (Figure 7—figure supplement 3).
Figure 7—figure supplement 1
Splenic B-1a cells do not contain cells expressing GC phenotype.
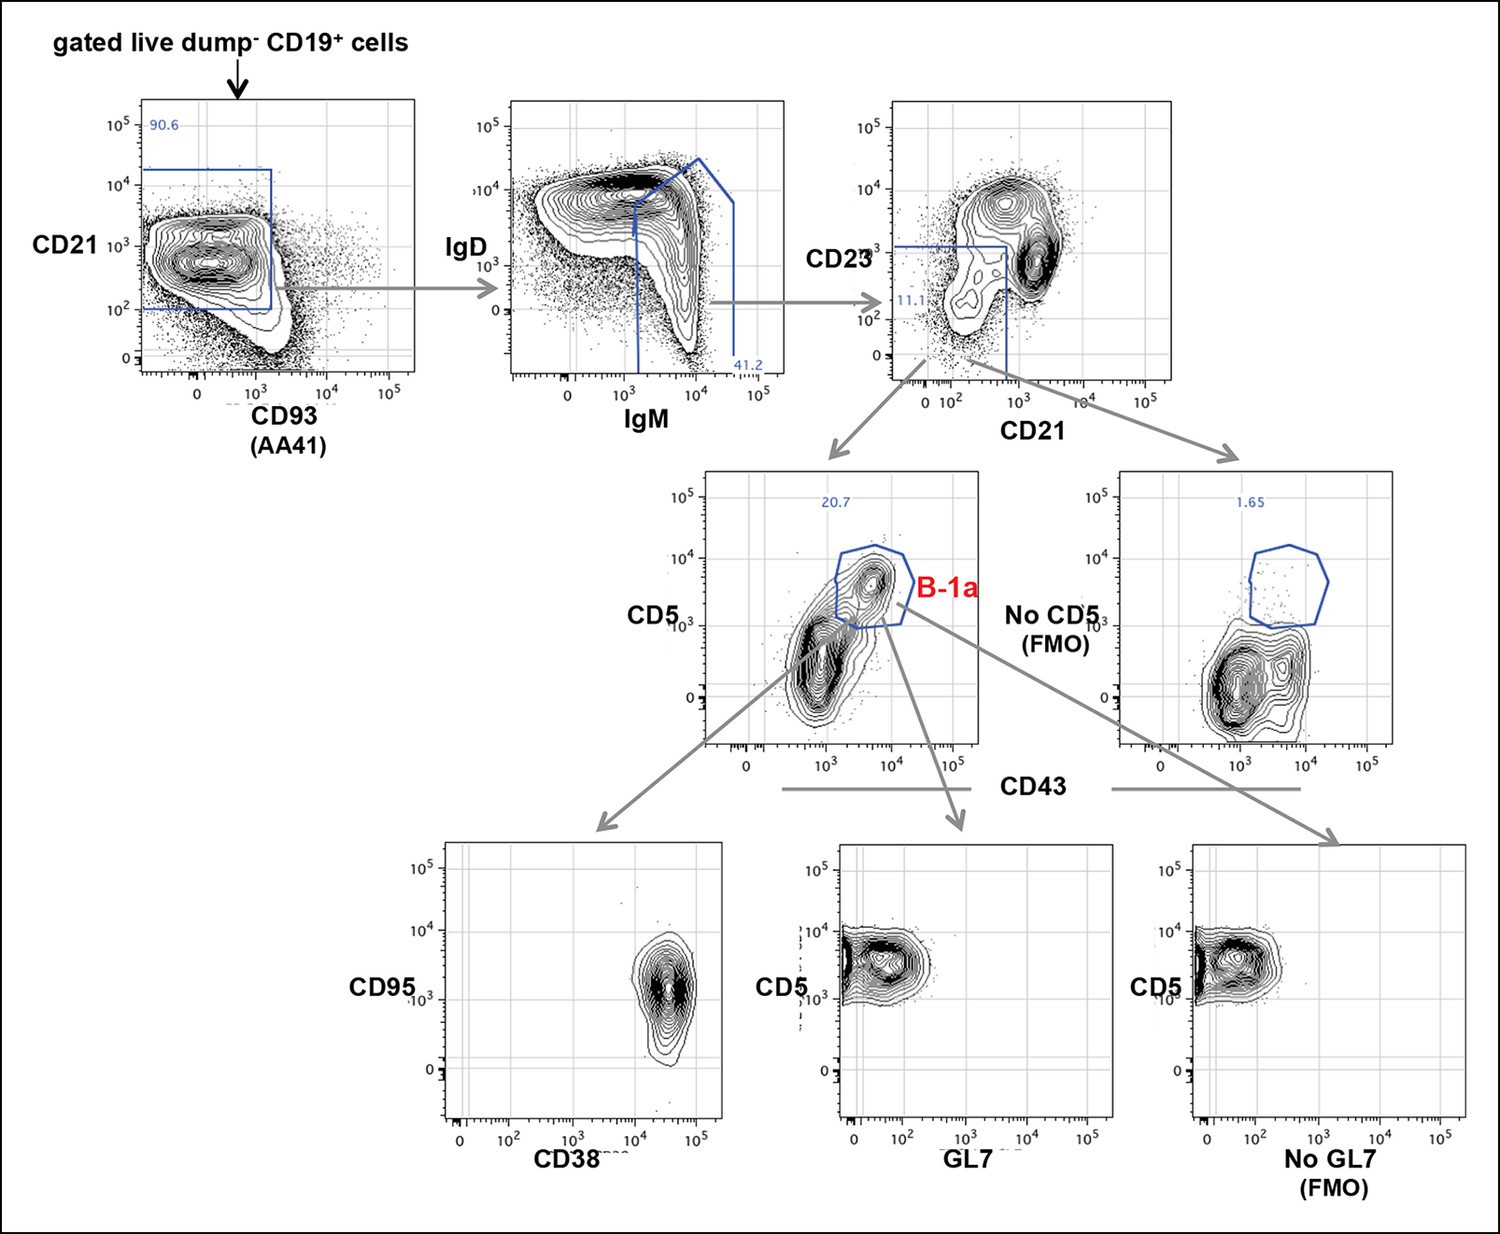
FACS analysis showing of live dump- CD19 + CD93 (AA41)- IgMHi IgD-/lo CD23- CD21-/lo B cells from spleen of 5 month old C57BL6/J mouse were gated to reveal CD43 + CD5 + B-1a cells, which were further gated to reveal GL7, CD38 and CD95 expression. GC B cells are GL7 + CD38-/lo CD95hi. The boundary for CD5 (rightmost middle plot) and GL7 (rightmost bottom plot) expression were determined from FMO controls in which fluorescently labeled anti-mouse CD5 or anti-mouse GL7 antibodies are omitted from the staining sets.
Figure 7—figure supplement 2

Percentage of sequences containing > = 4 nucleotides changes for each B cell group.
A, sB-1a (2-7d); B, sB-1a (2W-1M); C, sB-1a (2M); D, sB-1a (4-6M); E, sB-1a (GF, 4M); F, B cells (AIDKO, 4-5M); G, pB-1a (2-6M); H, FOB, pB-2 (2-5M); I, MZB (1-5M). Each dot represents the data for an individual B cell sample, n = 3-8.
Figure 7—figure supplement 3
Identical V(D)J recombination sequences containing identical mutated nucleotides are detected in sequence data sets for IgH libraries obtained by using either old or new primer set.
We sorted two splenic B-1a populations individually from two 4 month old C57BL/6J mice. We extracted RNA from each population and divided each RNA sample into two parts. For one part, we prepared an amplified library using the old primer set; and for the other, we prepared an amplified library using the new primer set. We then sequenced two pair of amplified IgH libraries. In two separate comparisons, we detected identical IgH sequences containing identical nucleotides substitutions in each library. One example is shown from comparing one pair of sequence data sets. Red nucleotides are the mutated bases. Upper line of sequence is the obtained sequence reads and the lower line of sequences is the V, D and J reference sequences.
Figure 8

Progressive increase in the splenic B-1a IgVH mutation frequency with age is accompanied by increased class-switching.
(A) Left panel: The frequencies of non-mutated or mutated (> = 1 nucleotide substitution) IgH sequences obtained from indicated B cell samples are shown; Right panel: The frequencies of sequences expressing class-switched isotypes (neither IgM nor IgD) among non-mutated or mutated sequences are shown. Each dot represents data from an individual sample (n = 5–6). p values are calculated based on the Nonparametric Wilcoxon test. (B) In each plot, the IgH sequences obtained from each splenic B-1a sample from 3.5–6 month old mice are divided into five categories, based on the number of mutated nucleotides (0, 1, 2, 3, 4, > = 5) per read. In each plot, the values shown at the top are the frequencies of sequences in each category. For each category of sequences, frequencies of the distinct isotype sequences are shown as stacks. A = IgA; D = IgD; G = IgG1 + IgG3 + IgG2c + IgG2b. Each plot represents the data for a splenic B-1a sample from an individual mouse reared under either specific pathogen free (SPF) (upper plots) or germ-free (GF) (lower plots) conditions. The data for germ-free (GF) animals is discussed at the end of the Result section.
Figure 9 with 1 supplement
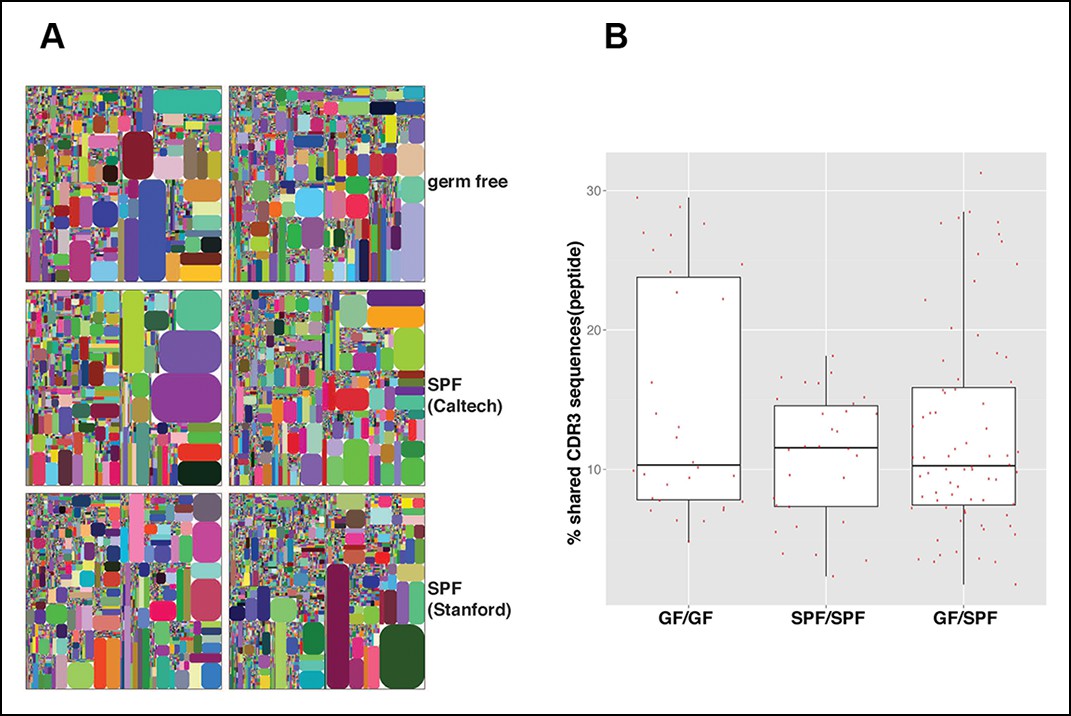
The B-1a IgH repertoires from mice raised in specific pathogen free condition are comparable to the B-1a IgH repertoire from age-matched germ-free mice.
(A) IgH CDR3 tree map plots for splenic B-1a cells from GF mice (upper panel), or SPF mice in Caltech animal facility (middle panel), or SPF mice in Stanford animal facility (bottom panel). Each plot represents the data for a sample from a 4 month old mouse. Recurrent CDR3 (nucleotide) sequences are visualized as larger contiguously-colored rectangles in each plot. (B) CDR3 peptide pair-wise sharing analysis of IgH repertoire similarity between multiple splenic B-1a samples from age-matched GF and SPF mice. GF mice (n = 6); SPF mice (n = 6). CDR3 peptide pair-wise analysis was conducted between GF mice (GF/GF), SPF mice (SPF/SPF) and GF vs. SPF mice (GF/SPF). Each dot represents the percentage of shared CDR3 peptide sequences between two mice. There was no statistical difference between each comparison.
Figure 9—figure supplement 1
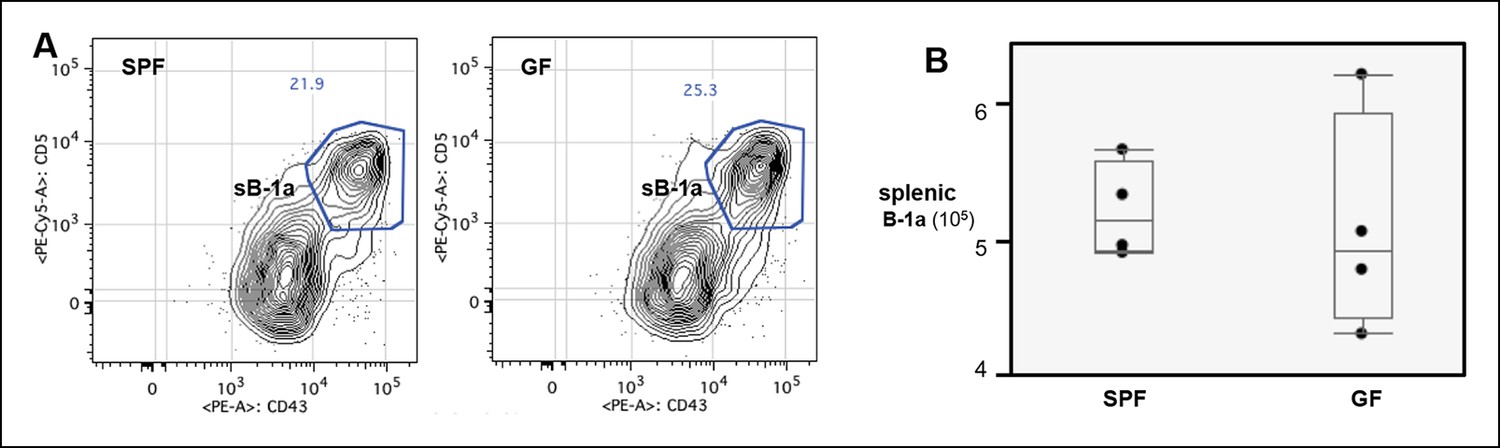
Normal splenic B-1a compartment in GF mice.
(A) FACS plot showing the B-1a population in spleen from SPF or GF mouse. Live dump- CD19 + CD93- IgMhi IgDlo CD23lo/- CD21- cells were gated to reveal CD5 + CD43 + B-1a cells. (B) Absolute number of splenic B-1a cells in GF and SPF mice. Each dot represents the data from an individual mouse. There is no significant difference shown between two groups.
Tables
Table 1
Summary of the sequences for 60 separately sorted B cell populations analyzed in this study.
| Sample | Id | Subset | Strain | Age | Condition | Mice | RNT* | RNU* | RPU* | CNT* | CNU* | CPU* |
|---|---|---|---|---|---|---|---|---|---|---|---|---|
| 1 | 7631 | FOB | WT | 2M | SPF | single | 1006030 | 151210 | 65871 | 903400 | 21240 | 20470 |
| 2 | 13966 | FOB | WT | 3.5M | SPF | single | 150812 | 31003 | 24801 | 130652 | 14911 | 14678 |
| 3 | 8706 | FOB | WT | 4M | SPF | single | 180365 | 53577 | 27817 | 159710 | 16901 | 16568 |
| 4 | 8702 | FOB | WT | 5M | SPF | single | 156681 | 54195 | 27728 | 136101 | 16951 | 16649 |
| 5 | 13967 | FOB | AID KO | 5M | SPF | single | 35967 | 14623 | 13203 | 27726 | 7187 | 7133 |
| 6 | 11161 | MZB | WT | 1M | SPF | single | 33548 | 19628 | 12744 | 25674 | 6584 | 6471 |
| 7 | 10658 | MZB | WT | 2M | SPF | single | 71458 | 26978 | 18278 | 61258 | 11512 | 11170 |
| 8 | 7630 | MZB | WT | 2M | SPF | single | 1032381 | 139832 | 62520 | 932353 | 20780 | 19792 |
| 9 | 8701 | MZB | WT | 4M | SPF | single | 214238 | 55075 | 26458 | 191065 | 15461 | 15021 |
| 10 | 8700 | MZB | WT | 5M | SPF | single | 118863 | 42310 | 22794 | 102894 | 14517 | 14180 |
| 11 | 13338 | MZB | WT | 4M | GF | single | 162754 | 39930 | 23611 | 141646 | 12939 | 12605 |
| 12 | 13343 | MZB | WT | 4M | GF | single | 595780 | 85497 | 45820 | 536072 | 19266 | 18480 |
| 13 | 11163 | pB-1a | WT | 1M | SPF | pool of 3 mice | 45882 | 11290 | 5596 | 41368 | 3237 | 3007 |
| 14 | 10660 | pB-1a | WT | 2M | SPF | single | 222324 | 17311 | 8630 | 207749 | 3891 | 3649 |
| 15 | 13018 | pB-1a | WT | 2M | SPF | single | 808879 | 36031 | 14817 | 753868 | 4769 | 4374 |
| 16 | 7628 | pB-1a | WT | 2M | SPF | single | 1784677 | 59458 | 22105 | 1706235 | 6601 | 5848 |
| 17 | 11160 | pB-1a | WT | 2W | SPF | pool of 8 mice | 65317 | 14700 | 7025 | 58034 | 4240 | 3704 |
| 18 | 10655 | pB-1a | WT | 3W | SPF | pool of 5 mice | 62875 | 12162 | 6622 | 57558 | 4180 | 3694 |
| 19 | 8705 | pB-1a | WT | 4M | SPF | single | 310077 | 28441 | 11886 | 287695 | 5063 | 4707 |
| 20 | 9870 | pB-1a | WT | 4M | SPF | single | 229100 | 26299 | 10469 | 211514 | 4745 | 4480 |
| 21 | 11165 | pB-1a | WT | 5M | SPF | single | 105410 | 19528 | 8926 | 95994 | 4435 | 4162 |
| 22 | 8707 | pB-1a | WT | 5M | SPF | single | 320252 | 29786 | 12423 | 296946 | 4722 | 4384 |
| 23 | 9861 | pB-1a | WT | 6M | SPF | single | 26613 | 5683 | 3235 | 23542 | 1521 | 1461 |
| 24 | 8704 | pB-1a | AID KO | 4M | SPF | single | 264340 | 33745 | 14519 | 245941 | 6648 | 6294 |
| 25 | 10657 | pB-2 | WT | 2M | SPF | single | 53953 | 23059 | 16883 | 44986 | 10084 | 9923 |
| 26 | 7629 | pB-2 | WT | 2M | SPF | single | 1315663 | 123472 | 47337 | 1238225 | 16925 | 16065 |
| 27 | 13969 | pB-2 | WT | 3.5M | SPF | single | 186817 | 24304 | 17689 | 170768 | 9089 | 8925 |
| 28 | 9862 | pB-2 | WT | 4M | SPF | single | 22591 | 13377 | 8737 | 17343 | 4382 | 4357 |
| 29 | 13973 | pB-2 | AID KO | 5M | SPF | single | 617893 | 62319 | 41165 | 566826 | 17536 | 16965 |
| 30 | 13000 | sB-1a | WT | 2d | SPF | pool of 8 mice | 29439 | 9542 | 4925 | 25369 | 3148 | 2758 |
| 31 | 10651 | sB-1a | WT | 5d | SPF | single | 123360 | 22472 | 10838 | 113161 | 7453 | 5976 |
| 32 | 10659 | sB-1a | WT | 5d | SPF | single | 210055 | 28140 | 12411 | 192662 | 7307 | 5812 |
| 33 | 9866 | sB-1a | WT | 5d | SPF | single | 52986 | 15600 | 6864 | 46580 | 4595 | 3837 |
| 34 | 10652 | sB-1a | WT | 6d | SPF | single | 172875 | 26437 | 12545 | 159304 | 7683 | 6365 |
| 35 | 9865 | sB-1a | WT | 7d | SPF | single | 71309 | 18446 | 8775 | 64241 | 5482 | 4941 |
| 36 | 9868 | sB-1a | WT | 7d | SPF | single | 201813 | 35069 | 14473 | 186227 | 7847 | 6843 |
| 37 | 10656 | sB-1a | WT | 2M | SPF | single | 369732 | 39603 | 19759 | 342914 | 9489 | 9048 |
| 38 | 13004 | sB-1a | WT | 2M | SPF | single | 185948 | 27952 | 13875 | 168522 | 7313 | 7022 |
| 39 | 7632 | sB-1a | WT | 2M | SPF | single | 1825218 | 102797 | 43190 | 1719246 | 12428 | 11144 |
| 40 | 11168 | sB-1a | WT | 2W | SPF | single | 536603 | 70201 | 28829 | 496671 | 11948 | 10913 |
| 41 | 13005 | sB-1a | WT | 2W | SPF | single | 98017 | 28331 | 15001 | 85489 | 8820 | 8207 |
| 42 | 10654 | sB-1a | WT | 3W | SPF | single | 146560 | 33814 | 19697 | 131091 | 11995 | 11451 |
| 43 | 13970 | sB-1a | WT | 3.5M | SPF | single | 170925 | 13809 | 9289 | 160480 | 4513 | 4273 |
| 44 | 13335 | sB-1a | WT | 4M | SPF | single | 22175 | 4822 | 3449 | 18683 | 1131 | 1090 |
| 45 | 13342 | sB-1a | WT | 4M | SPF | single | 283072 | 23668 | 12947 | 262744 | 5357 | 5032 |
| 46 | 8699 | sB-1a | WT | 4M | SPF | single | 142838 | 19151 | 9938 | 130915 | 4370 | 4086 |
| 47 | 9863 | sB-1a | WT | 4M | SPF | single | 73676 | 16599 | 8713 | 65571 | 4233 | 4092 |
| 48 | 11167 | sB-1a | WT | 5M | SPF | single | 501367 | 38912 | 17336 | 463863 | 7573 | 7163 |
| 49 | 8708 | sB-1a | WT | 5M | SPF | single | 577114 | 52723 | 22272 | 531508 | 9146 | 8441 |
| 50 | 9867 | sB-1a | WT | 6M | SPF | single | 113492 | 20612 | 10625 | 101791 | 4563 | 4343 |
| 51 | 13965 | sB-1a | AID KO | 4M | SPF | single | 177782 | 16419 | 12281 | 164189 | 6539 | 6293 |
| 52 | 13971 | sB-1a | AID KO | 4M | SPF | single | 517141 | 34159 | 22031 | 482543 | 8966 | 8395 |
| 53 | 13968 | sB-1a | AID KO | 5M | SPF | single | 427671 | 30839 | 20510 | 396974 | 9162 | 8545 |
| 54 | 13972 | sB-1a | AID KO | 5M | SPF | single | 706116 | 36217 | 23255 | 660874 | 9294 | 8744 |
| 55 | 13001 | sB-1a | WT | 4M | GF | single | 43507 | 8734 | 4855 | 38947 | 2318 | 2249 |
| 56 | 13002 | sB-1a | WT | 4M | GF | single | 47203 | 8683 | 4820 | 42279 | 2053 | 1965 |
| 57 | 13003 | sB-1a | WT | 4M | GF | single | 213347 | 22246 | 11068 | 197769 | 4705 | 4449 |
| 58 | 13017 | sB-1a | WT | 4M | GF | single | 532250 | 40497 | 17375 | 501908 | 7019 | 6398 |
| 59 | 13337 | sB-1a | WT | 4M | GF | single | 28559 | 6322 | 4417 | 24047 | 1544 | 1486 |
| 60 | 13341 | sB-1a | WT | 4M | GF | single | 388208 | 28942 | 14837 | 360727 | 5674 | 5144 |
| Id is a unique identifier for the sequence run | ||||||||||||
| RNT*, total raw nucleotide sequences | ||||||||||||
| RNU*, unique raw nucleotide sequences | ||||||||||||
| RPU*, unique raw peptide sequences | ||||||||||||
| CNT*, total clean nucleotide sequences | ||||||||||||
| CNU*, unique clean nucleotide sequences | ||||||||||||
| CPU*, unique clean peptide sequences | ||||||||||||
| Sequence statistics | RNT* | RNU* | RPU* | CNT* | CNU* | CPU* | ||||||
|---|---|---|---|---|---|---|---|---|---|---|---|---|
| Total | 1.9E + 07 | 2.1E + 06 | 1.1E + 06 | 1.8E + 07 | 4.9E + 05 | 4.7E + 05 | ||||||
| Mean | 319865 | 35610 | 17848 | 295174 | 8233 | 7762 | ||||||
| % CV | 122 | 86 | 74 | 125 | 61 | 63 | ||||||
Table 2
Top 10 highly recurring CDR3 sequences (peptide and V(D)J recombination) detected in each of the listed splenic B-1a samples.
| sB-1a samples | Top 10 IgH CDR3 sequences | |||
|---|---|---|---|---|
| Id | Age | Peptide | V(D)J | |
| 11168 | 2 weeks | 1 | ANDY | V1-53 J2 |
| 2 | AKHGYDAMDY | V2-9 D2-9 J4 | ||
| 3 | ARRYYGSSYWYFDV | V1-55 D1-1 J1 | ||
| 4 | ANWDY | V1-53 D4-1 J2 | ||
| 5 | MRYSNYWYFDV | V11-2 D2-6 J1 | ||
| 6 | ARDAYYWYFDV | V7-1 J1 | ||
| 7 | ATDYYAMDY | V1-26 J4 | ||
| 8 | ARFYYYGSSYAMDY | V1-55 D1-1 J4 | ||
| 9 | AIYYLDY | V1-53 D2-8 J2 | ||
| 10 | ARHYGSSYWYFDV | V2-6-2 D1-1 J1 | ||
| 10654 | 3 weeks | 1 | ARRYYGSSYWYFDV | V1-55 D1-1 J1 |
| 2 | ARSYSNYVMDY | V1-76 D2-6 J4 | ||
| 3 | ARYYGSNYFDY | V7-3 D1-1 J2 | ||
| 4 | ARGASYYSNWFAY | V1-55 D2-6 J3 | ||
| 5 | ALTGTAY | V1-53 D4-1 J3 | ||
| 6 | ARAGAGWYFDV | V5-9 D4-1 J1 | ||
| 7 | TYSNY | V6-6 D2-6 J2 | ||
| 8 | ARTGTYYFDY | V1-53 D4-1 J2 | ||
| 9 | AMVDY | V1-64 D2-9 J2 | ||
| 10 | ARWGTTVVGY | V1-7 D1-1 J2 | ||
| 7632 | 2 months | 1 | MRYGNYWYFDV | V11-2 D2-8 J1 |
| 2 | MRYSNYWYFDV | V11-2 D2-6 J1 | ||
| 3 | MRYGSSYWYFDV | V11-2 D1-1 J1 | ||
| 4 | ATFSY | V1-55 J2 | ||
| 5 | ARFYYYGSSYAMDY | V1-55 D1-1 J4 | ||
| 6 | ARIPNWVWYFDV | V1-55 D4-1 J1 | ||
| 7 | ARWDTTVVAPYYFDY | V1-7 D1-1 J2 | ||
| 8 | ARDYYGSSWYFDV | V1-26 D1-1 J1 | ||
| 9 | TYYDYDLYAMDY | V14-4 D2-4 J4 | ||
| 10 | ARFITTVVATRYWYFDV | V1-9 D1-1 J1 | ||
| 8699 | 4 months | 1 | ARSADYGGYFDV | V1-64 D2-4 J1 |
| 2 | ARGAY | V1-80 J2 | ||
| 3 | ARSYYDYPWFAY | V1-76 D2-4 J3 | ||
| 4 | ARRWLLNAMDY | V1-9 D2-9 J4 | ||
| 5 | ARPYYYGSSPWFAY | V1-69 D1-1 J3 | ||
| 6 | ARNDYPYWYFDV | V1-4 D2-4 J1 | ||
| 7 | ARSGDY | V1-64 J2 | ||
| 8 | ARVIGDY | V1-53 D2-14 J4 | ||
| 9 | ARANY | V1-55 J3 | ||
| 10 | AVNWDYAMDY | V1-84 D4-1 J4 | ||
| 8708 | 5 months | 1 | ASLTY | V1-55 J2 |
| 2 | TCNYH | V14-4 D2-8 J4 | ||
| 3 | LIGRNY | V1-55 D2-14 J2 | ||
| 4 | MRYSNYWYFDV | V11-2 D2-6 J1 | ||
| 5 | AKQPYYGSSYWYFDV | V2-3 D1-1 J1 | ||
| 6 | AGSSYAYYFDY | V1-66 D1-1 J2 | ||
| 7 | ARRGIDLLWYHYYAMDY | V1-26 D2-8 J4 | ||
| 8 | ARKSSGSRAMDY | V7-3 D3-2 J4 | ||
| 9 | ASYAMDY | V7-3 J4 | ||
| 10 | ARLYYGNSYWYFDV | V1-55 D2-8 J1 | ||
| 9867 | 6 months | 1 | ARKYYPSWYFDV | V1-55 D1-1 J1 |
| 2 | AREGGKFY | V1-7 J2 | ||
| 3 | AKSSGYAMDY | V1-55 D3-2 J4 | ||
| 4 | ARWVITTVARYFDV | V1-85 D1-1 J1 | ||
| 5 | ARGFY | V1-80 J2 | ||
| 6 | AKEGGYYVRAMDY | V1-55 D1-2 J4 | ||
| 7 | ARSMDY | V1-80 J4 | ||
| 8 | ASAMDY | V1-64 J4 | ||
| 9 | TKGGYHDYDDGAWFVY | V1-53 D2-4 J3 | ||
| 10 | ARKFYPSWYFDV | V1-55 J3 | ||
-
Table lists the top 10 highly recurring CDR3 sequences (peptide and V(D)J recombination) shown in the individual CDR3 tree-map plot of the splenic B-1a samples from 2 week to 6 month old mice (Figure 5A). For each splenic B-1a sample, the Id number and mouse age are shown in column 1 and column 2 respectively.
Table 3
Certain V(D)J sequences are positively selected and conserved in adult B-1a pre-immune IgH repertoires.
| CDR3 peptide | Predominant V(D)J | CDR3 junction diversity | Representation in indicated repertoire | |||||||
|---|---|---|---|---|---|---|---|---|---|---|
| splenic B-1a (2d-6M) | splenic B-1a (2-6M) | addition | deletion | PerC B-1a (2W-6M) | splenic B-1a (4M germ free) | FOB (2-5M) | MZB (1-5M) | |||
| 1 | TRWDY | 17/20 | V6-6 J2 | 8/9 | TGG | J2(8) | 11/11 | 5/6 | 1/8 | 0/7 |
| 2 | MRYSNYWYFDV | 17/20 | V11-2 D2-6 J1 | 9/9 | 0 | 0 | 11/11 | 6/6 | 1/8 | 1/7 |
| 3 | MRYGNYWYFDV | 18/20 | V11-2 D2-8 J1 | 9/9 | 0 | 0 | 11/11 | 6/6 | 1/8 | 1/7 |
| 4 | MRYGSSYWYFDV | 17/20 | V11-2 D1-1 J1 | 9/9 | 0 | 0 | 11/11 | 6/6 | 1/8 | 1/7 |
| 5 | VRHYGSSYFDY | 15/20 | V10-1 D1-1 J2 | 5/9 | 0 | J2(1) | 11/11 | 3/6 | 0/8 | 0/7 |
| 6 | ARHYYGSSYYFDY | 19/20 | V5-6-1 D1-1 J2 | 9/9 | 0 | 0 | 11/11 | 6/6 | 2/8 | 0/7 |
| 7 | ARLDY | 20/20 | V1-53 J2 | 7/9 | CTg/a | J2(8) | 10/11 | 4/6 | 0/8 | 1/7 |
| 8 | ARDYYGSSYWYFDV | 19/20 | V7-1 D1-1 J1 | 6/9 | 0 | V7-1(3) | 9/11 | 5/6 | 1/8 | 1/7 |
| 9 | ARDYYGSSWYFDV | 19/20 | V1-26 D1-1 J1 | 7/9 | G | J1(3) | 2/11 | 4/6 | 0/8 | 1/7 |
| 10 | ANWDY | 19/20 | V14-3 D4-1 J2 | 6/9 | 0 | V14-3(2)J2(8) | 5/11 | 2/6 | 0/8 | 0/7 |
| 11 | ATGTWFAY | 18/20 | V1-19 D4-1 J3 | 5/9 | 0 | V1-19(2) | 6/11 | 2/6 | 0/8 | 1/7 |
| 12 | ARYYYGSSYAMDY | 19/20 | V7-3 D1-1 J4 | 8/9 | 0 | V7-3(1)J4(4) | 10/11 | 3/6 | 3/8 | 3/7 |
| 13 | ARYSNYYAMDY | 18/20 | V1-39 D2-6 J4 | 6/9 | 0 | J4(2) | 8/11 | 1/6 | 0/8 | 0/7 |
| 14 | ARDFDY | 19/20 | V1-64 J2 | 6/9 | G | J2(3) | 1/11 | 3/6 | 1/8 | 1/7 |
| 15 | ARYYSNYWYFDV | 17/20 | V1-9 D2-6 J1 | 6/9 | 0 | 0 | 4/11 | 1/6 | 0/8 | 0/7 |
| 16 | ARYDYDYAMDY | 17/20 | V1-39 D2-4 J4 | 6/9 | 0 | J4(3) | 7/11 | 1/6 | 0/8 | 0/7 |
| 17 | ARHYYGSSYWYFDV | 18/20 | V2-6-2 D1-1 J1 | 6/9 | 0 | 0 | 6/11 | 2/6 | 1/8 | 3/7 |
| 18 | ARFYYYGSSYAMDY | 19/20 | V1-55 D1-1 J4 | 6/9 | T | J4(4) | 8/11 | 3/6 | 1/8 | 1/7 |
| 19 | ARWDFDY | 19/20 | V1-7 J2 | 6/9 | TGGG | J2(3) | 1/11 | 3/6 | 1/8 | 1/7 |
| 20 | ARGAY | 19/20 | V1-80 J3 | 5/9 | GGG | J3(8) | 7/11 | 6/6 | 1/8 | 1/7 |
| 21 | ARRFAY | 18/20 | V1-26 J3 | 7/9 | C/A | J3(8) | 9/11 | 3/6 | 1/8 | 1/7 |
| 22 | ARRDY | 18/20 | V1-55 J2 | 5/9 | AGg/a | J2(8) | 6/11 | 3/6 | 1/8 | 1/7 |
| 23 | ASYDGYYWYFDV | 18/20 | V1-55 D2-9 J1 | 8/9 | CTATG | V1-55(1) | 9/11 | 5/6 | 0/8 | 0/7 |
| 24 | ASYAMDY | 16/20 | V7-3 J4 | 8/9 | 0 | V7-3(5)J4(4) | 9/11 | 6/6 | 0/8 | 1/7 |
| 25 | ARRYYFDY | 17/20 | V1-78 J2 | 7/9 | CGg/cT | 0 | 8/11 | 2/6 | 0/8 | 0/7 |
| 26 | ARNYYYFDY | 15/20 | V1-53 D1-2 J2 | 8/9 | t/a | 0 | 10/11 | 2/6 | 0/8 | 0/7 |
| 27 | ARYYGNYWYFDV | 15/20 | V3-8 D2-8 J1 | 5/9 | 0 | 0 | 5/11 | 2/6 | 0/8 | 0/7 |
| 28 | ARRYYGSSYWYFDV | 15/20 | V1-55 D1-1 J1 | 7/9 | CGG | 0 | 10/11 | 5/6 | 1/8 | 1/7 |
| 29 | ARRLDY | 13/20 | V1-22 J2 | 7/9 | CGAC | J2(6) | 8/11 | 2/6 | 0/8 | 1/7 |
| 30 | ARFAY | 18/20 | V1-80 J3 | 4/9 | 0 | J3(4) | 2/11 | 3/6 | 0/8 | 0/7 |
-
Column 1: CDR3 peptide sequences identified to be shared in >80% of splenic B-1a samples (20 samples from mice ranging from 2 day to 6 month old); Column 2: for each shared CDR3 peptide, a single V(D)Jrearrangement sequence is selected and conserved in over 70% of adult B-1a samples (9 samples, 2-6 month old); Columns 3 and 4: nucleotides added or deleted in CDR3 junctions; Columns 5-8: the representation of each selected V(D)J sequence within the indicate repertoires (age and number of samples are shown for each group). Rows 2-4 are PtC-binding CDR3 sequences; Row 8 is CDR3 sequence for T15 Id+ anti-PC antibody. The data for germ-free animals is discussed at the end of the Result section.
Table 4
MZB IgH repertoires use different V(D)J recombination sequences to encode the same CDR3 peptide as that of B-1a anti-PC T15Id+.
| MZB sample Id | Age (Months) | V(D)J recombination |
|---|---|---|
| 7630 | 2 | V1-76 D1-1 J1 and V1-39 D1-1 J1 |
| 10658 | 2 | V1-76 D1-1 J1 |
| 8700 | 4 | V1-72 D1-1 J1 and V8-12 D1-1 J1 |
| 8701 | 5 | V1-58 D1-1 J1 and V1-61 D1-1 J1 |
| 13338 | 4 | V1-61 D1-1 J1 and V5-16 D1-1 J1 |
-
Column 1: individual MZB samples tested; column 2: age of mouse for each MZB sample; column 3: for each MZB sample, V(D)J recombination events that encode ARDYYGSSYWYFDV, which is the CDR3 peptide associated with B-1a anti-PC T15Id+.
Table 5
B cell samples that show minimal or low level mutations in IgVH rarely express class-switched transcripts.
| Sample Id | subset | age | strain | non-mutated or mutated sequences (%) | IgM (%) | IgD (%) | IgG1(%) | IgG3 (%) | IgG2c (%) | IgG2b (%) | IgE (%) | IgA (%) | |
|---|---|---|---|---|---|---|---|---|---|---|---|---|---|
| 13965 | sB-1a | 4M | AIDKO | non-mutated | 98.2 | 99.5 | 0.5 | ||||||
| mutated | 1.8 | 100 | |||||||||||
| 13968 | sB-1a | 5M | AIDKO | non-mutated | 99 | 100 | |||||||
| mutated | 1 | 100 | |||||||||||
| 13971 | sB-1a | 4M | AIDKO | non-mutated | 98.4 | 99.6 | 0.4 | ||||||
| mutated | 1.6 | 100 | |||||||||||
| 13972 | sB-1a | 4M | AIDKO | non-mutated | 100 | 99.9 | 0.1 | ||||||
| 8704 | pB-1a | 4M | AIDKO | non-mutated | 98.2 | 99.9 | 0.1 | ||||||
| mutated | 1.8 | 100 | |||||||||||
| 13973 | pB-2 | 5M | AIDKO | non-mutated | 100 | 91.6 | 8.4 | ||||||
| 8700 | MZB | 5M | WT | non-mutated | 99.8 | 99.9 | 0.1 | ||||||
| 8701 | MZB | 4M | WT | non-mutated | 98.6 | 99.9 | 0.1 | ||||||
| 7630 | MZB | 2M | WT | non-mutated | 99.5 | 99.9 | 0.1 | ||||||
| 10658 | MZB | 2M | WT | non-mutated | 100 | 100 | |||||||
| 8702 | FOB | 5M | WT | non-mutated | 99.8 | 98.6 | 1.4 | ||||||
| 13966 | FOB | 3.5M | WT | non-mutated | 99.5 | 99.7 | 0.3 | ||||||
| 7631 | FOB | 2M | WT | non-mutated | 99.3 | 72.9 | 27.1 | ||||||
| 7629 | pB-2 | 4M | WT | non-mutated | 98.4 | 88.4 | 11.5 | ||||||
| mutated | 1.6 | 89 | 11 | ||||||||||
| 13969 | pB-2 | 3.5M | WT | non-mutated | 99.5 | 90.1 | 9.9 | ||||||
| 13974 | sB-1a | day 2 | WT | non-mutated | 99.2 | 99.8 | 0.2 | ||||||
| 13000 | sB-1a | day 2 | WT | non-mutated | 99.2 | 100 | |||||||
| 10659 | sB-1a | day 5 | WT | non-mutated | 99.2 | 100 | |||||||
| 9866 | sB-1a | day 5 | WT | non-mutated | 100 | 100 | |||||||
| 10651 | sB-1a | day 5 | WT | non-mutated | 99.7 | 100 | |||||||
| 10652 | sB-1a | day 6 | WT | non-mutated | 99.4 | 100 | |||||||
| 9868 | sB-1a | day 7 | WT | non-mutated | 99.3 | 99.9 | 0.1 | ||||||
| 9865 | sB-1a | day 7 | WT | non-mutated | 99.5 | 99.6 | 0.4 | ||||||
| 11168 | sB-1a | 2W | WT | non-mutated | 99.1 | 99.9 | 0.1 | ||||||
| 13005 | sB-1a | 2W | WT | non-mutated | 99.5 | 100 | |||||||
| 10654 | sB-1a | 3W | WT | non-mutated | 95.8 | 100 | |||||||
| mutated | 4.2 | 100 | |||||||||||
| 11160 | pB-1a | 2W | WT | non-mutated | 99 | 100 | |||||||
| 10655 | pB-1a | 3W | WT | non-mutated | 99.2 | 100 | |||||||
| 11163 | pB-1a | 1M | WT | non-mutated | 99.1 | 99.9 | |||||||
| 7632 | sB-1a | 2M | WT | non-mutated | 88.1 | 99.1 | 0.9 | ||||||
| mutated | 11.9 | 99.9 | 0.1 | ||||||||||
| 10656 | sB-1a | 2M | WT | non-mutated | 88.1 | 99.8 | 0.2 | ||||||
| mutated | 11.9 | 100 | |||||||||||
| 13004 | sB-1a | 2M | WT | non-mutated | 97.7 | 99.9 | |||||||
| mutated | 2.3 | 94 | 6 | ||||||||||
| 13018 | pB-1a | 2M | WT | non-mutated | 91.8 | 100 | |||||||
| mutated | 8 | 100 | |||||||||||
| 13660 | pB-1a | 2M | WT | non-mutated | 92.2 | 100 | |||||||
| mutated | 7.6 | 100 | |||||||||||
| 7628 | pB-1a | 2M | WT | non-mutated | 92.3 | 99.5 | 0.4 | 0.1 | |||||
| mutated | 7.1 | 99.6 | 0.2 | 0.2 | |||||||||
| 8705 | pB-1a | 4M | WT | non-mutated | 93.8 | 99.7 | 0.3 | ||||||
| mutated | 4.4 | 99.9 | |||||||||||
| 9870 | pB-1a | 4M | WT | non-mutated | 86.4 | 99.9 | |||||||
| mutated | 12.6 | 99.9 | |||||||||||
| 11165 | pB-1a | 5M | WT | non-mutated | 98.1 | 99.9 | |||||||
| mutated | 1.5 | 100 | |||||||||||
| 8707 | pB-1a | 5M | WT | non-mutated | 91.6 | 97.2 | 0.1 | 2 | 0.5 | 0.1 | 0.1 | ||
| mutated | 6.2 | 97.9 | 0.1 | 2 | |||||||||
| 9861 | pB-1a | 6M | WT | non-mutated | 82.4 | 99.6 | 0.4 | ||||||
| mutated | 17.5 | 100 | |||||||||||
-
Table lists each individual B cell sample (labeled as distinct Id number) from wild-type (WT) or AID-deficient (AIDKO) mice. The mouse age and sample subset information are also shown. For each sample, the sequences are divided into non-mutated or mutated (> = 1 nucleotide change) categories, the frequencies of each category are shown. For each category, the frequencies of sequences with each isotype are also shown.
Table 6
Both the mutated and non-mutated IgH sequences obtained from splenic B-1a cells in 4-6 month old animals contain class-switched Ig.
| sample Id | subset | age | condition | non-mutated or mutated sequences (%) | IgM (%) | IgD (%) | IgG1(%) | IgG3 (%) | IgG2c (%) | IgG2b (%) | IgE(%) | IgA(%) | |
|---|---|---|---|---|---|---|---|---|---|---|---|---|---|
| 9867 | sB-1a | 6M | SPF | non-mutated | 50 | 95.8 | 2.7 | 0.6 | 0.8 | 0.1 | |||
| mutated | 50 | 65 | 0.03 | 16.8 | 4.3 | 4.8 | 9.1 | ||||||
| 8699 | sB-1a | 4M | SPF | non-mutated | 56 | 99.5 | 0.3 | 0.1 | 0.1 | ||||
| mutated | 44 | 89.9 | 3.4 | 2 | 1.3 | 3.4 | |||||||
| 9863 | sB-1a | 4M | SPF | non-mutated | 74.1 | 93.9 | 0.2 | 3.6 | 1 | 1.3 | |||
| mutated | 25.9 | 44.2 | 41 | 9.7 | 3.7 | 1.4 | |||||||
| 13970 | sB-1a | 3.5M | SPF | non-mutated | 74.1 | 92.7 | 0.5 | 3.7 | 1.7 | 1.3 | |||
| mutated | 25.9 | 92.1 | 2.5 | 0.5 | 4.8 | 0.1 | |||||||
| 13342 | sB-1a | 4M | SPF | non-mutated | 88.9 | 97.6 | 0.5 | 0.8 | 0.6 | 0.2 | 0.3 | ||
| mutated | 11.1 | 85.2 | 0.3 | 0.2 | 7.3 | 7 | |||||||
| 13337 | sB-1a | 4M | GF | non-mutated | 69.7 | 98.5 | 0.1 | 0.8 | 0.4 | 0.1 | |||
| mutated | 30.3 | 79 | 15.3 | 5 | 0.7 | ||||||||
| 13003 | sB-1a | 4M | GF | non-mutated | 74.8 | 97.2 | 0.3 | 0.2 | 0.5 | 0.2 | 1.6 | ||
| mutated | 25.2 | 89.8 | 1.1 | 2.3 | 1.2 | 5.6 | |||||||
| 13341 | sB-1a | 4M | GF | non-mutated | 78.2 | 99 | 0.1 | 0.2 | 0.1 | 0.6 | |||
| mutated | 21.8 | 72.2 | 9.6 | 5.5 | 12.6 | 0.1 | |||||||
| 13017 | sB-1a | 4M | GF | non-mutated | 80.9 | 95.6 | 0.4 | 2 | 1 | 1 | |||
| mutated | 19.1 | 79 | 0.2 | 7.9 | 3.9 | 8.9 | 0.1 | ||||||
| 13002 | sB-1a | 4M | GF | non-mutated | 88.5 | 97.4 | 0.5 | 0.6 | 0.2 | 1.3 | |||
| mutated | 11.5 | 63.8 | 14.8 | 8.4 | 13 | ||||||||
-
Table lists individual splenic B-1a cell sample sorted from 4-6 month old C57BL6/J mice reared under either specific pathogen free (SPF) or germ-free (GF) condition. For each sample, the sequences are divided into non-mutated or mutated (> = 1 nucleotide change) categories, the frequencies of each category are shown. For each category, the frequencies of sequences expressing each isotype are shown. The data for germ-free animals is discussed at the end of the result section.
Table 7
Top 10 highly recurring CDR3 sequences (peptide and V(D)J recombination) detected in listed splenic B-1a samples from age-matched SPF and GF mice.
| sB-1a samples (4 months) | Top 10 IgH CDR3 sequences | ||
|---|---|---|---|
| Peptide | V(D)J | ||
| germ-free #1 | 1 | MRYGSSYWYFDV | V11-2 D1-1 J1 |
| 2 | ARGAY | V1-80 J2 | |
| 3 | ARNPDGYYTYYYAMDY | V2-2 D2-9 J4 | |
| 4 | ARDPFYYYGSSYWYFDV | V5-16 D1-1J1 | |
| 5 | MRYSNYWYFDV | V11-2 D2-6 J1 | |
| 6 | AITRAY | V1-55 J3 | |
| 7 | ARRYYGSSYWYFDV | V1-55 D1-1 J1 | |
| 8 | ARSDYYGSSSLSY | V1-26 D1-1 J2 | |
| 9 | ASGGNYFDY | V1-75 J2 | |
| 10 | ARSLYN | V1-9 J2 | |
| germ-free #2 | 1 | ARNYGSSYDY | V1-53 D1-1 J2 |
| 2 | TRPSYYGSDY | V14-4 D1-1 J2 | |
| 3 | TRESYDGYYVWYAMDY | V5-9-1 D2-9 J4 | |
| 4 | ARGDY | V14-3 J2 | |
| 5 | ASNWAY | V1-53 D4-1 J2 | |
| 6 | MRYSNYWYFDV | V11-2 D2-6 J1 | |
| 7 | AKGDYYGSSYYFDY | V1-9 D1-1 J2 | |
| 8 | VRHGPRAFDY | V10-1 D3-2 J2 | |
| 9 | ARLNGDY | V1-69 J2 | |
| 10 | MRYGNYWYFDV | V11-2 D2-8 J1 | |
| specific pathogen free #1 (from Caltech) | 1 | ASYSNSDV | V3-6 D2-6 J1 |
| 2 | ARVSYSRAMDY | V14-3 D2-6 J4 | |
| 3 | ARSGNYGAMDY | V1-7 D2-8 J4 | |
| 4 | ASRLRSTFAY | V2-6-8 D1-1 J3 | |
| 5 | ARVTTVHAMDY | V1-55 D1-1 J4 | |
| 6 | ARNYGSSYWYFDV | V1-53 D1-1 J1 | |
| 7 | ARTPNWEARDY | V1-55 D4-1 J4 | |
| 8 | ARRYYGSSYWYFDV | V1-55 D1-1 J1 | |
| 9 | ARPLLYRYYFDY | V1-75 D2-6 J2 | |
| 10 | ARNYGSSYDWYFDV | V1-9 D1-1 J1 | |
| specific pathogen free #2 (from Caltech) | 1 | ARGGIYYDYDEVYYYAMDY | V1-55 D2-4 J4 |
| 2 | MRYSNYWYFDV | V11-2 D2-6 J1 | |
| 3 | ARDYYGSSWYFDV | V1-26 D1-1 J1 | |
| 4 | MRYGNYWYFDV | V11-2 D2-8 J1 | |
| 5 | MRYGSSYWYFDV | V11-2 D1-1 J1 | |
| 6 | ARYYDGYYGYYAMDY | V1-26 D2-4 J4 | |
| 7 | ALITTWYFDV | V1-78 D1-2 J1 | |
| 8 | ARHYYGSSWGY | V1-53 D1-1 J2 | |
| 9 | ARSFSPYYFDY | V1-26 J2 | |
| 10 | ARSHGYYPFDY | V1-54 D2-9 J2 | |
| specific pathogen free #1 (from Stanford) | 1 | ARSADYGGYFDV | V1-64 D2-4 J1 |
| 2 | ARGAY | V1-80 J2 | |
| 3 | ARSYYDYPWFAY | V1-76 D2-4 J3 | |
| 4 | ARRWLLNAMDY | V1-9 D2-9 J4 | |
| 5 | ARPYYYGSSPWFAY | V1-69 D1-1 J3 | |
| 6 | ARNDYPYWYFDV | V1-4 D2-4 J1 | |
| 7 | ARSGDY | V1-64 J2 | |
| 8 | ARVIGDY | V1-53 D2-14 J4 | |
| 9 | ARANY | V1-55 J3 | |
| 10 | AVNWDYAMDY | V1-84 D4-1 J4 | |
| specific pathogen free #2 (from Stanford) | 1 | ARGNY | V1-80 J2 |
| 2 | ARWVYYGSSSYWYFDV | V1-54 D1-1 J1 | |
| 3 | ARSSNYAMDY | V1-78 D2-11 J4 | |
| 4 | ARYYYGSNYAMDY | V7-3 D1-1 J4 | |
| 5 | ARGAY | V1-80 J2 | |
| 6 | ARRYYGSSYWYFDV | V1-55 D1-1 J1 | |
| 7 | ARSPYYSNYEGYFDV | V1-72 D2-6 J1 | |
| 8 | ARKNYGSSYWYFDV | V1-55 D1-1 J1 | |
| 9 | ARLEIYYGNYGRVFDV | V1-80 D2-8 J2 | |
| 10 | ARRDYYGSSYVLAY | V1-9 D1-1 J3 | |
-
Table lists the top 10 highly recurring CDR3 sequences (peptide and V(D)J recombination) shown in each of CDR3 tree-map plot (Figure 9A).
Download links
A two-part list of links to download the article, or parts of the article, in various formats.
Downloads (link to download the article as PDF)
Open citations (links to open the citations from this article in various online reference manager services)
Cite this article (links to download the citations from this article in formats compatible with various reference manager tools)
Distinct mechanisms define murine B cell lineage immunoglobulin heavy chain (IgH) repertoires
eLife 4:e09083.
https://doi.org/10.7554/eLife.09083


