SPOP mutation leads to genomic instability in prostate cancer
- Weill Cornell Medical College, United States
- Institute of Cancer Research, United Kingdom
- The Royal Marsden, United Kingdom
- University of Trento, Italy
Figures
Figure 1 with 5 supplements
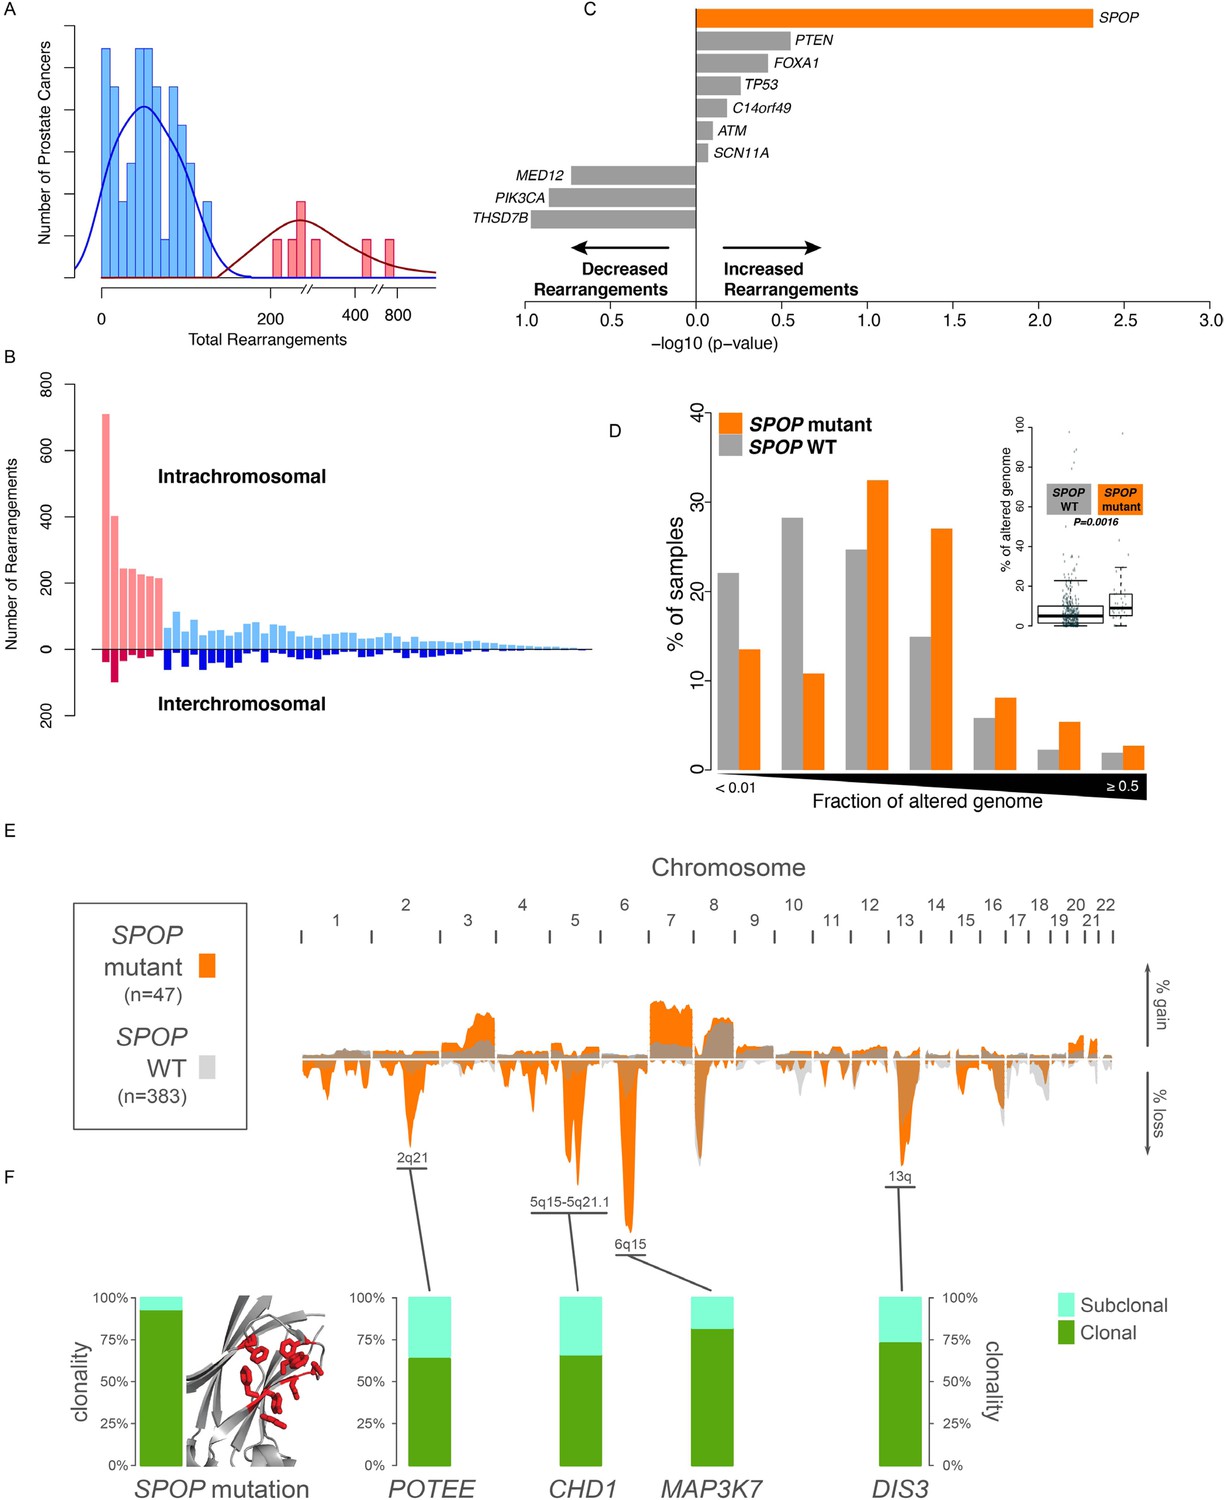
SPOP mutant prostate cancer displays increased genomic rearrangements.
(A) Distribution analysis of genomic rearrangements from 55 clinically localized prostate cancers distinguishes two subpopulations. (B) Increased total rearrangements are driven by intrachromosomal rather than interchromosomal rearrangements. 55 clinically localized prostate cancers ordered (right to left) according to total rearrangements; numbers of intrachromosomal and interchromosomal rearrangements are displayed. (C) Association of recurrent point mutations with intrachromosomal rearrangements. X-axis shows (−log10) p-value. (D) SPOP mutant prostate cancers harbor increased total somatic copy number aberration (SCNA) burden. The fraction of altered genome, partitioned into bins covering a range from <0.01 to ≥0.5, is shown as a histogram for SPOP WT and SPOP mutant tumors. Inset: the percentage of altered genome is significantly increased in SPOP mutant prostate cancers (p = 0.0016, two-sample Wilcoxon-Mann-Whitney test). (E) Frequency of somatic copy number alterations in 430 clinically localized prostate cancers. SPOP-mutant cancers (orange) and SPOP-wild-type tumors (gray). Length of bars indicates the frequency of copy number alterations. (F) Clonality of selected alterations associated with genomic rearrangements, in 430 clinically localized prostate cancers.
Figure 1—figure supplement 1
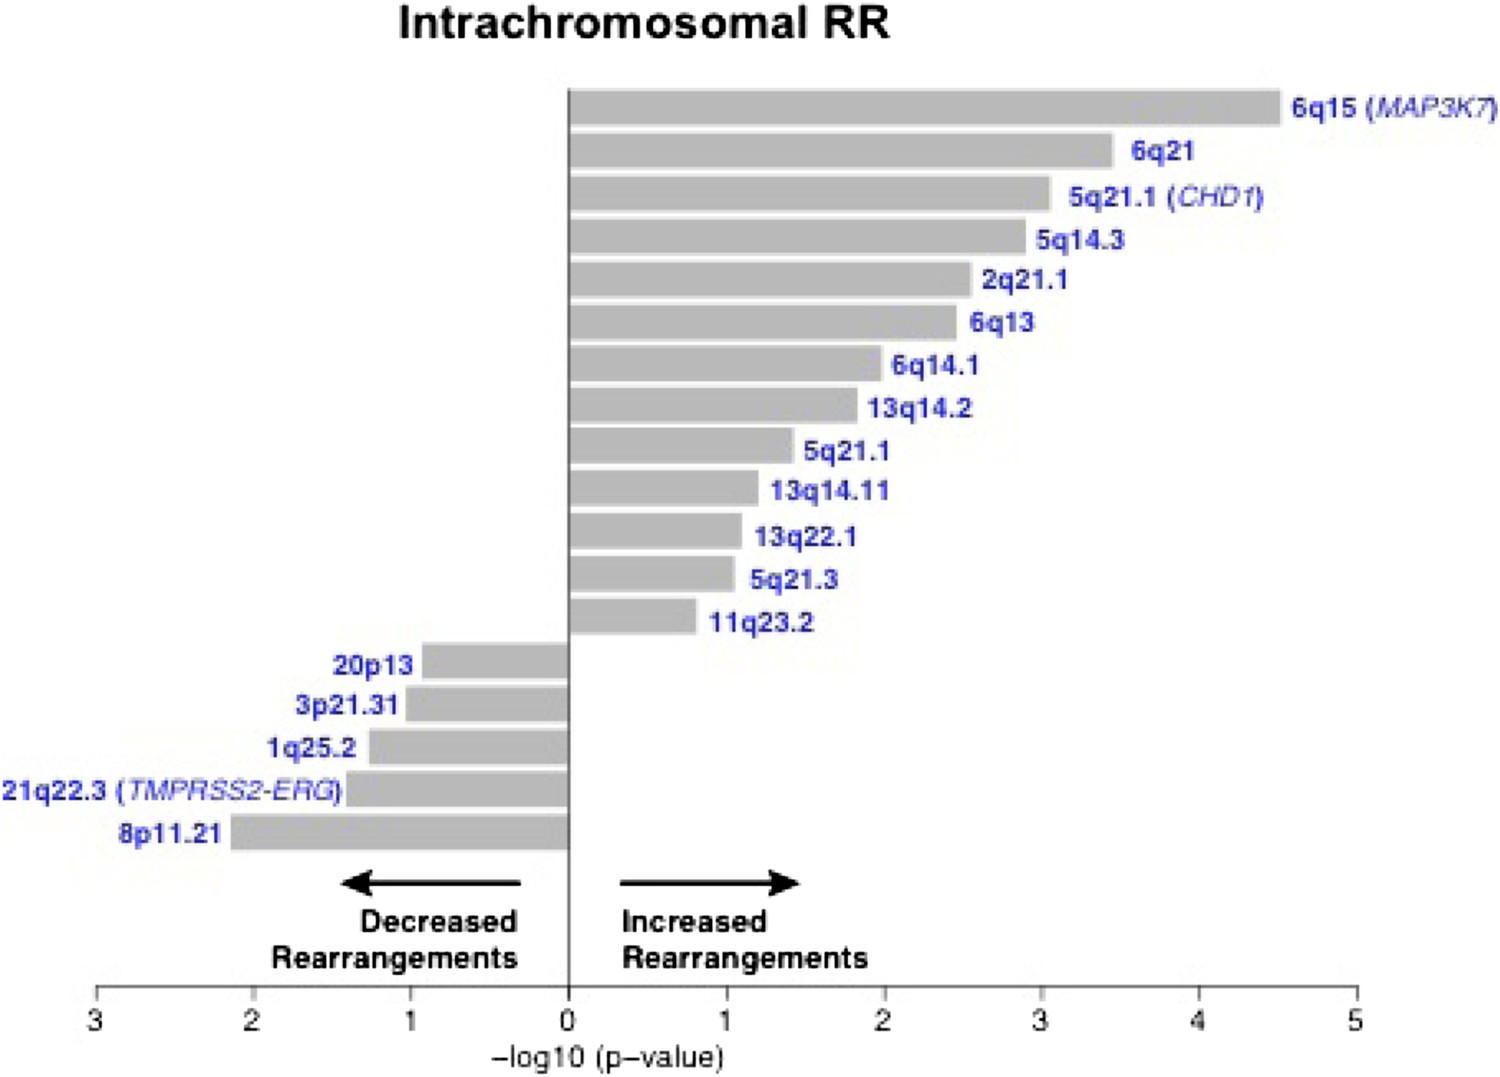
Association of recurrent SCNAs with intrachromosomal rearrangements.
Cytobands undergoing deletion are labeled blue. X-axis shows (−log10) p-value.
Figure 1—figure supplement 2

Association of recurrent SCNAs or point mutations with interchromosomal rearrangements.
Cytobands undergoing deletion are labeled blue, PM refers to recurrent point mutations. ‘ERG rearrangement’ was determined by FISH assay. X-axis shows (−log10) p-value.
Figure 1—figure supplement 3
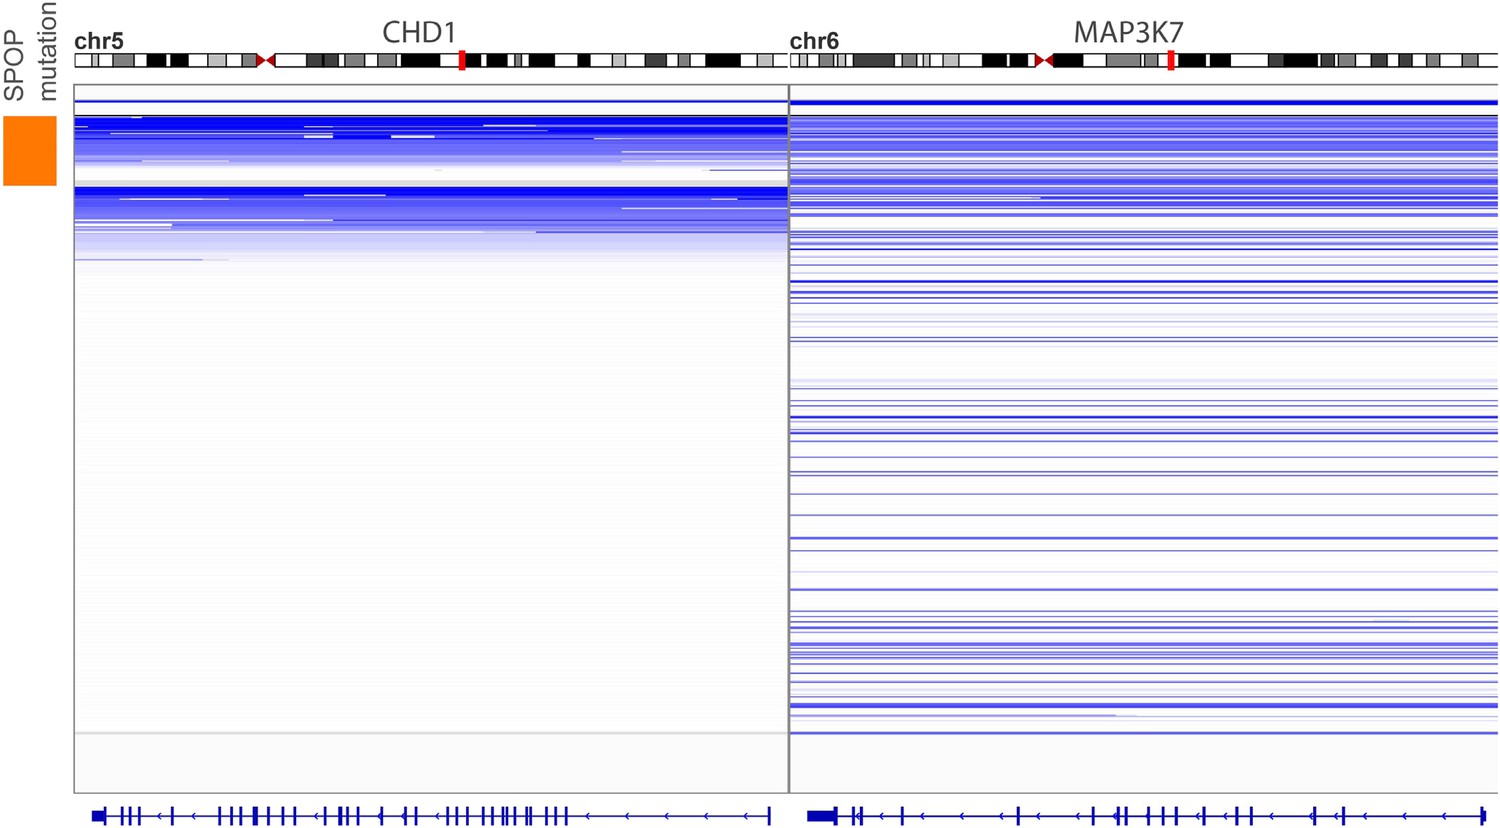
Genomic view of CHD1 and MAP3K7 areas in 430 prostate cancers sorted by SPOP mutation status.
Blue indicates genomic deletion.
Figure 1—figure supplement 4

Genomic burden of three subset of prostate cancers defined by the aberration state of SPOP, CHD1, and MAP3K7.
No increased signal is detected with respect to the SPOP class.
Figure 1—figure supplement 5
Evolution graphs built from prostate cancer sequencing data.
These data were generated based on a previously published algorithm to build tumor evolution paths (Baca et al., 2013; Prandi et al., 2014).
Figure 2 with 4 supplements
SPOP mediates DNA damage repair.
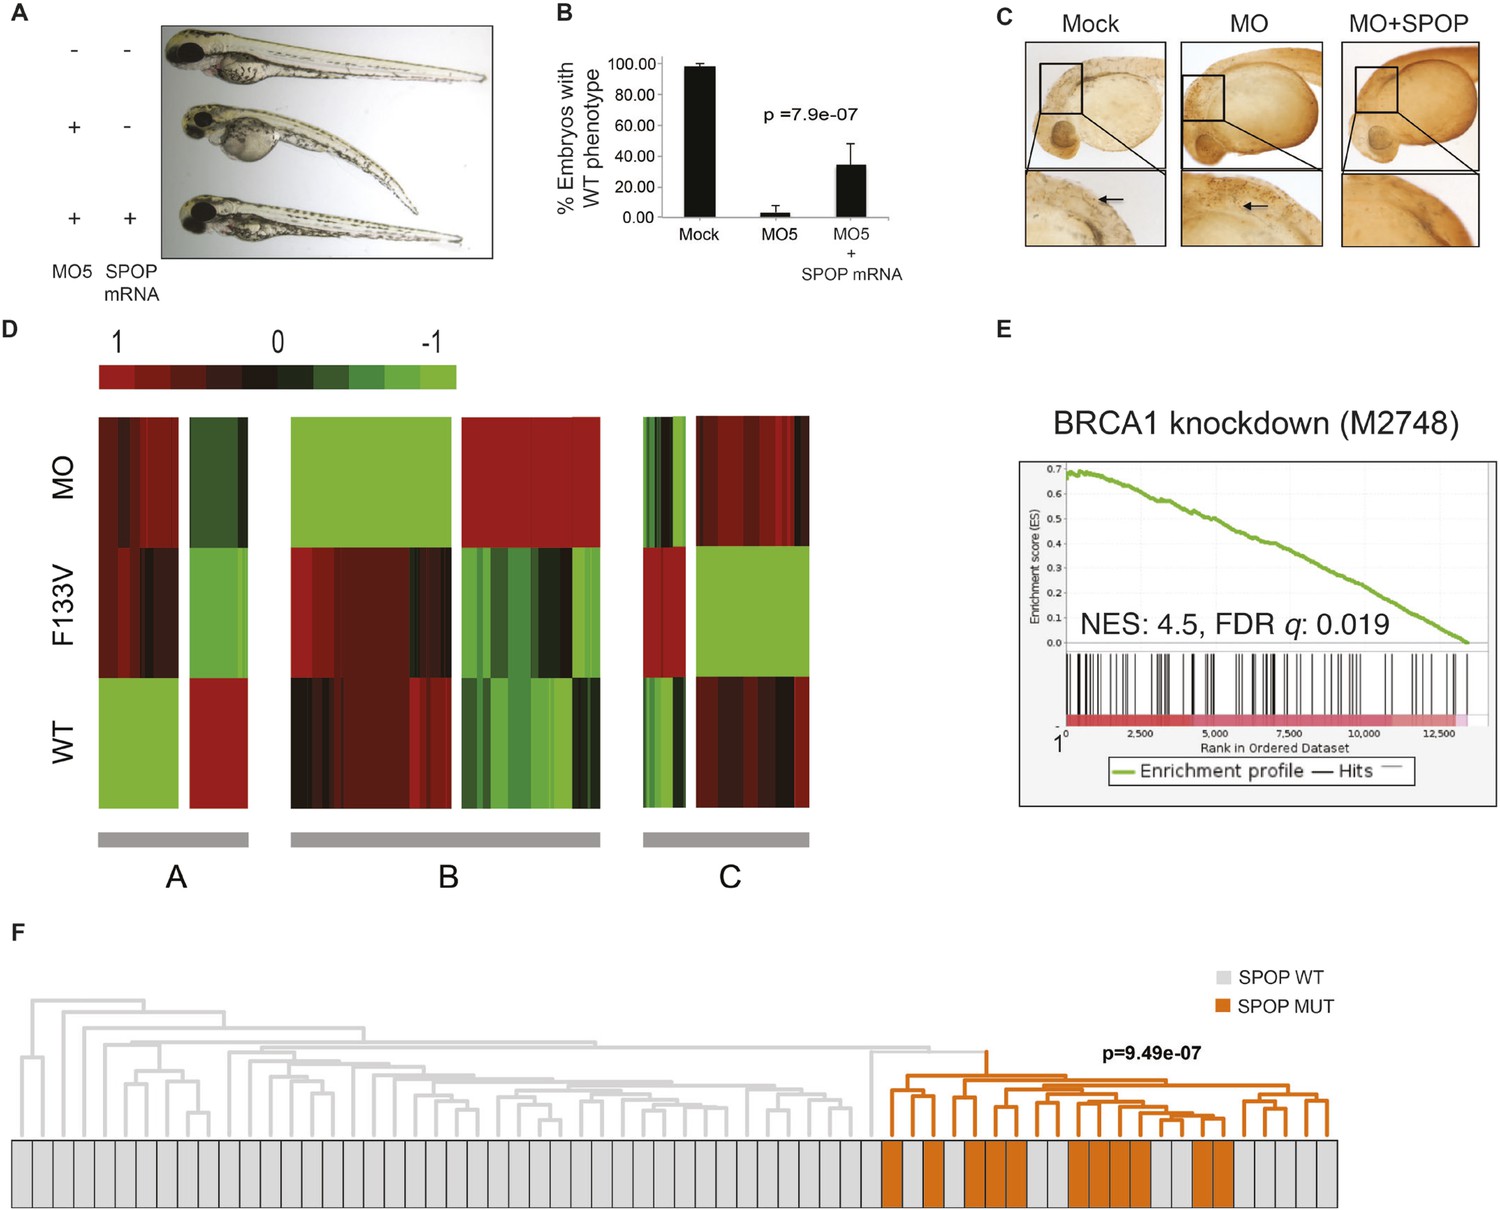
(A) Evaluation of SPOP function during zebrafish development. Phenotype of morpholino-mediated Spop knockdown (MO5) in zebrafish embryos at 70 hr post fertilization (hpf). Injection of human SPOP mRNA (250 pg) rescued the phenotype. (B) Quantification of the rescue of SPOP phenotype after ectopic expression of human SPOP mRNA. Results are represented as s.e.m. (C) Whole mount TUNEL assay to determine apoptosis in zebrafish embryos. Arrows point to apoptotic cells (brown). Shown are representative images. (D) Heatmap representation of gene expression differences in zebrafish embryos ectopically expressing SPOP-wt or SPOP-F133V compared to SPOP knockdown by morpholino (MO). The list of genes can be found in Figure 2—figure supplement 3. Number of genes per block: A (198), B (429), C (223). (E) Gene set enrichment analysis (GSEA) of RNA sequencing data derived from zebrafish embryos expressing SPOP-wt or SPOP-F133V (24 hpf). Enrichment plot for the BRCA1 gene signature is shown. Molecular Signatures Database (MSigDB) systematic name indicated in brackets. (NES) Normalized Enrichment Score. (FDR) False Discovery Rate. (F) Dendrogram of human primary prostate cancer cases based on BRCA1 knockdown genes (MSigDB: M2748). Unsupervised clustering of RNA-seq data from human primary prostate cancer with wild-type (n = 53) or mutant SPOP (n = 11), performed on the BRCA1 knockdown gene signature (M2748) identified in zebrafish embryos by GSEA as shown in (E).
-
Figure 2—source data 1
List of genes contained in blocks A, B, and C in the heatmap in Figure 2D.
Provided as excel file.
- https://doi.org/10.7554/eLife.09207.010
-
Figure 2—source data 2
Results from GSEA comparing zebrafish embryos ectopically expressing SPOP-wt or -F133V.
Provided as excel file.
- https://doi.org/10.7554/eLife.09207.011
Figure 2—figure supplement 1
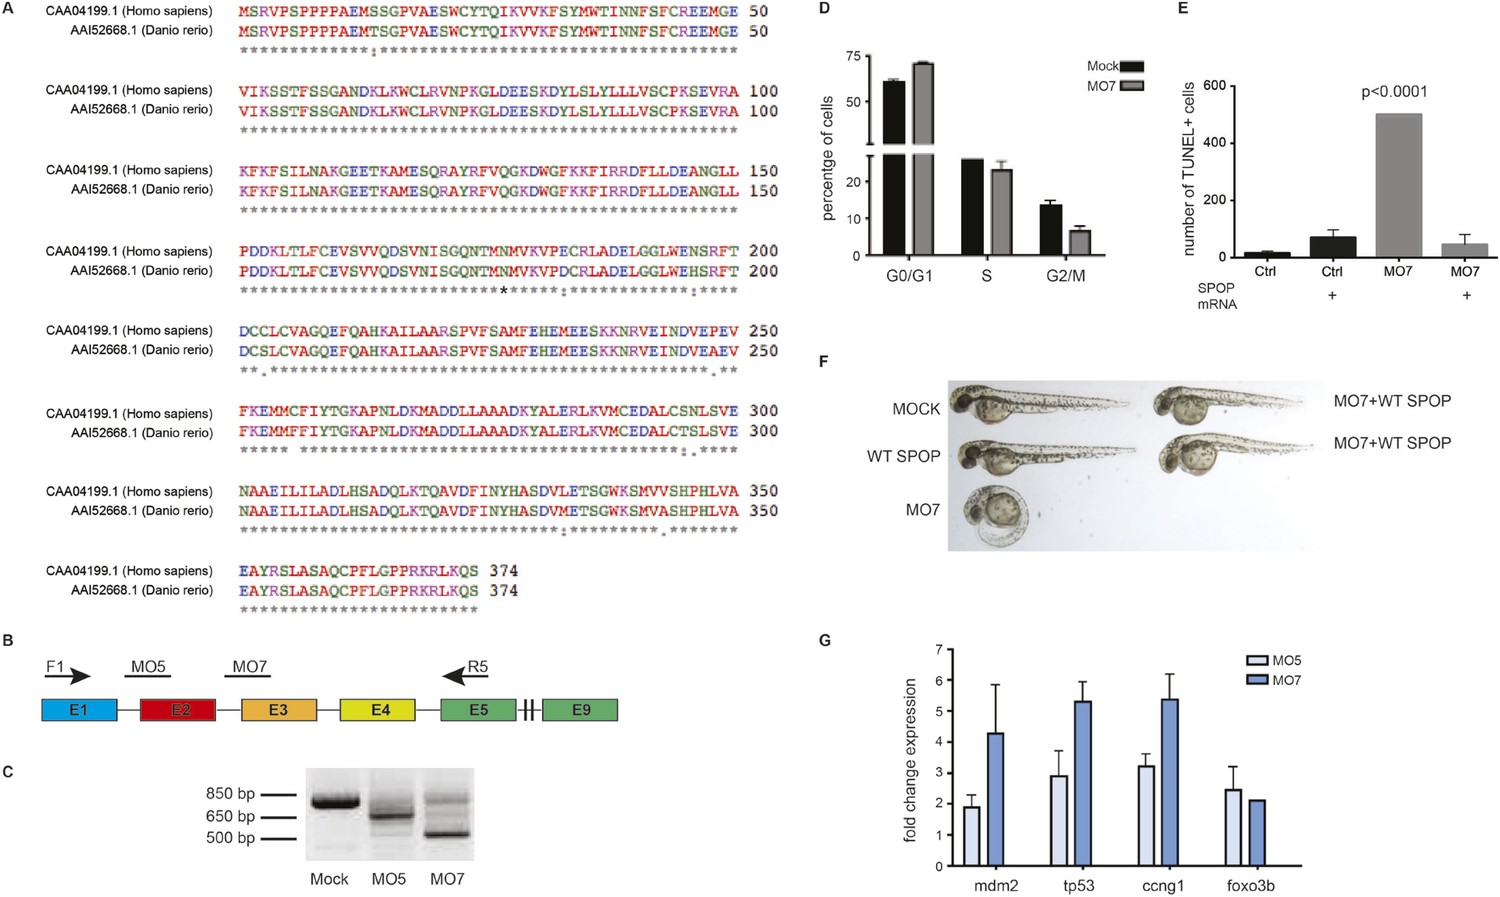
Spop knockdown in zebrafish using morpholinos results in a developmental phenotype.
(A) Multiple protein sequence alignment of SPOP from Homo sapiens and zebrafish (Danio rerio) reveals 97.3% identity between humans and zebrafish on the amino acid level. (B) Schematic representation of zebrafish SPOP mRNA. Colored boxes indicate exons. MO5 and MO7 indicate the targeted sites of the SPOP-specific morpholinos. F1 and R5 indicate the sites were the primers bind, which were used to amplify exons 1–5 for molecular validation of morpholino efficiency. (C) Image of an agarose gel used to analyze zebrafish SPOP splice variants after morpholino treatment. (D) Propidium iodide-based cell cycle analyses of cells from zebrafish embryos (24 hr) treated with or without SPOP-specific morpholino. (E) Quantification of TUNEL-positive cells in the midbrain area of zebrafish embryos (24 hpf) treated with SPOP morpholino or in combination with WT-SPOP mRNA as shown in Figure 2C. (F) Example of zebrafish embryos (48 hpf) injected with a second splice-blocking morpholino (MO7). Rescue of the effects of MO7 on zebrafish development by coinjecting WT-SPOP mRNA. (G) qPCR-based validation of differentially expressed transcripts identified by RNA-seq.
Figure 2—figure supplement 2
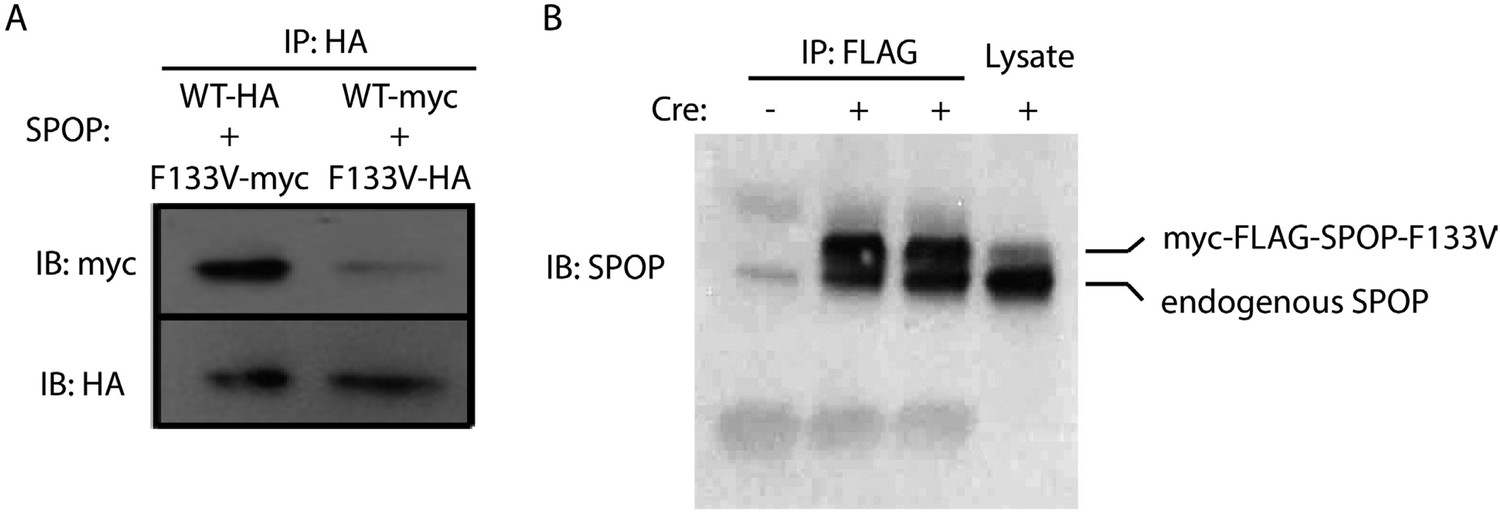
SPOP wt and F133V form heterodimers.
(A) 22Rv1 cells transfected with SPOP wt and F133V constructs tagged with HA or myc underwent immunoprecipitation (IP) with anti-HA antibody followed by immunoblot for HA and myc. (B) Mouse prostate cells with Cre-inducible SPOP-F133V with a FLAG tag underwent immunoprecipitation (IP) with anti-FLAG antibody followed by immunoblot for SPOP. Upper band is flag-tagged mutant SPOP; lower band is endogenous SPOP.
Figure 2—figure supplement 3
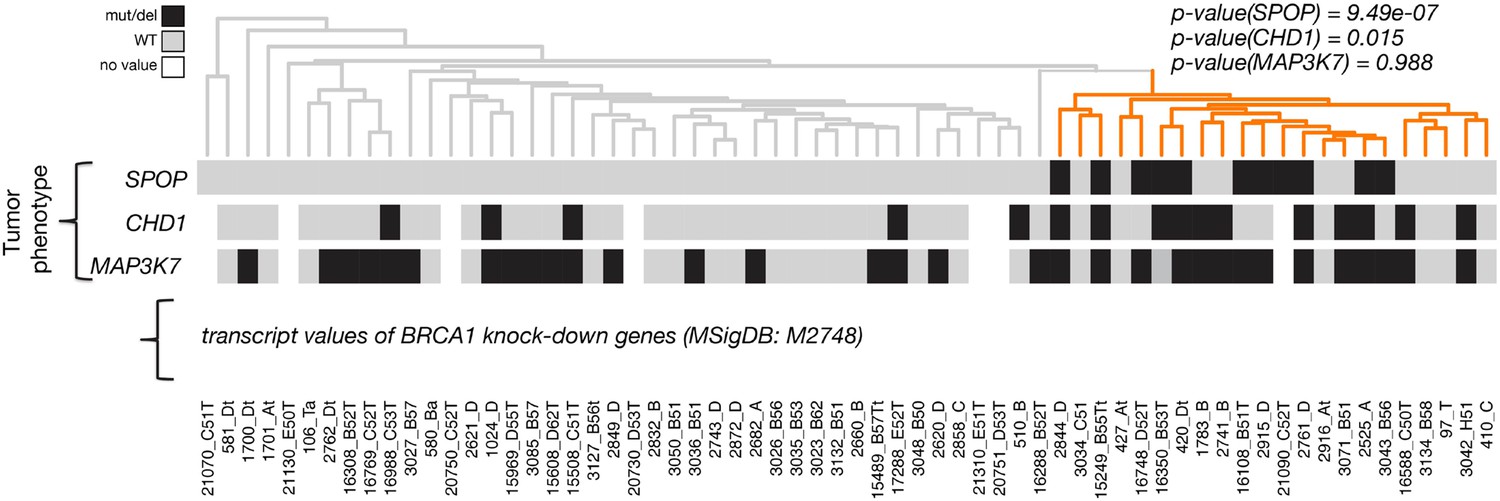
Dendrogram of human primary prostate cancer cases based on BRCA1 knockdown genes (MSigDB: M2748).
Unsupervised clustering of RNA-seq data from human primary prostate cancer annotated for status of SPOP mutation, CHD1 deletion, and MAP3K7 deletion, performed on the BRCA-1 knockdown gene signature (M2748).
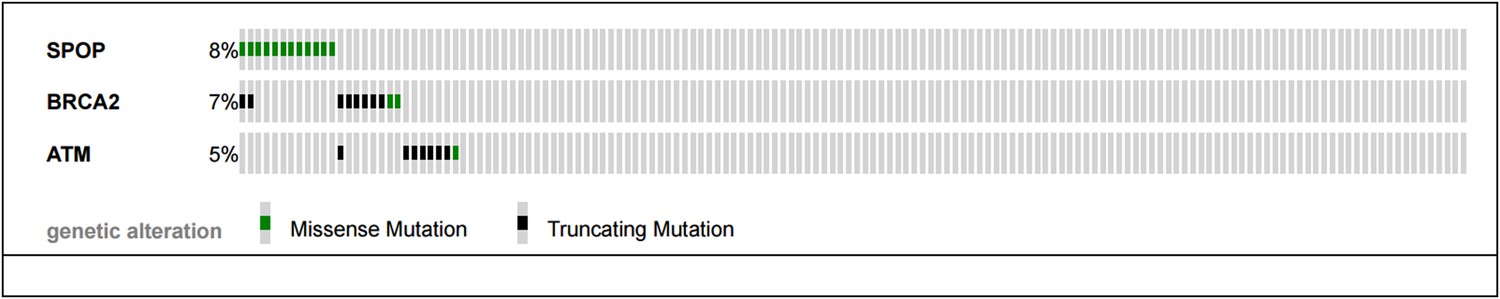
Figure 2—figure supplement 4
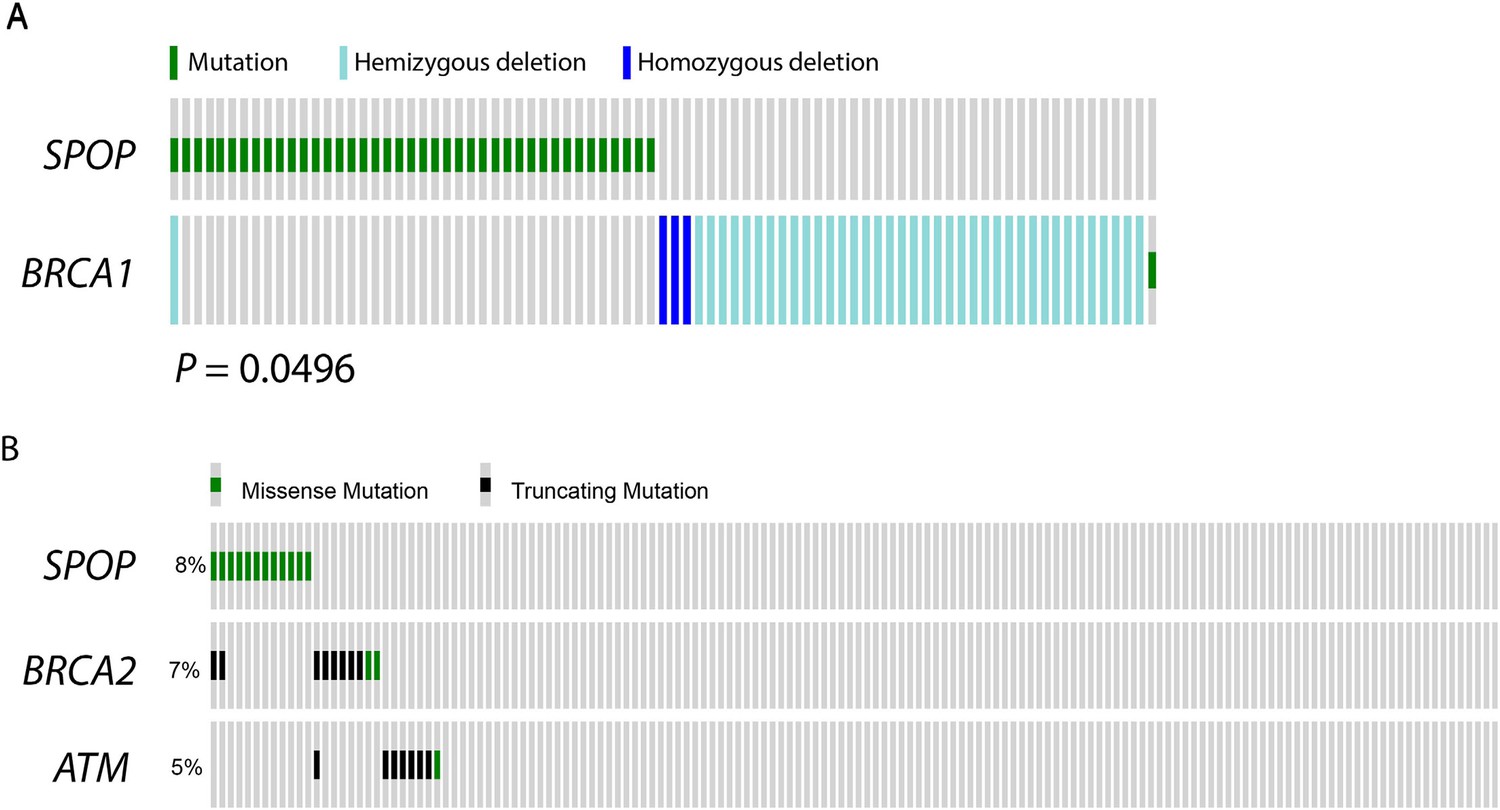
SPOP mutation and alterations in DNA repair genes in prostate cancer.
(A) SPOP mutation and somatic BRCA1 gene alterations are mutually exclusive in primary prostate cancer. The cBio portal oncoprint tool was used to graphically summarize the mutations in SPOP and genomic deletions and mutations in BRCA1 in 402 human prostate cancer samples. Samples with no alterations are not displayed. SPOP mutations and BRCA1 alterations are mutually exclusive (one-tail Fisher's test, p-value = 0.0496). (B) SPOP mutation and DNA repair pathway alterations in castration-resistant prostate cancer. The cBio portal oncoprint tool was used to graphically summarize the mutations in SPOP and mutations in BRCA2 and ATM in 150 metatstaic castration-resistant prostate cancer samples.
Figure 3 with 3 supplements
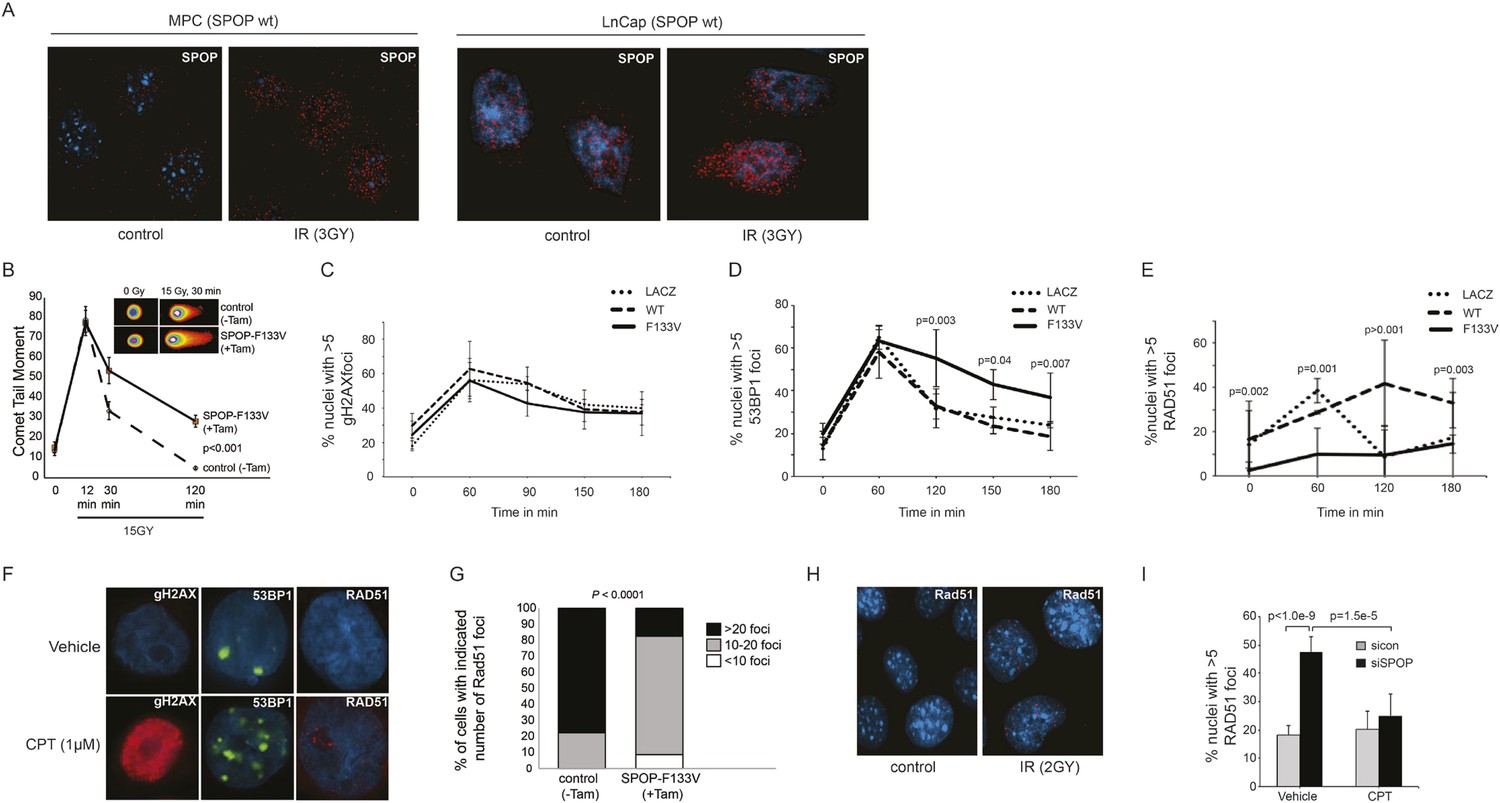
SPOP mutation impairs HDR and promotes NHEJ and SPOP-wt modulates DSB repair activity similar to BRCA1.
(A) SPOP forms nuclear foci after induction of DNA damage by γ-irradiation (3GY) in prostate cells derived from transgenic mice (MPC) and human LNCaP cells. Red represents nuclear Spop protein foci. Blue represents nuclear DNA stained with DAPI. (B) MPC expressing Cre-inducible SPOP-F133V was infected with tamoxifen-inducible Cre (CreERT2), and DNA damage was assessed after IR with comet assays. Inset: representative cells showing comet tails after IR. (C, D, E) Quantification of γH2AX, 53BP1, or RAD51 foci in RWPE cells overexpressing WT or F133V mutant SPOP after camptothecin (CPT) (1 μM) induced DNA damage. Time indicates the observation interval in minutes including double strand break (DSB) induction (0–60 min) and recovery (60–180 min). Shown are the percentages of cells for each genotype with more than 5 foci per nucleus. Results are represented as s.e.m. (F) Representative pictures showing γH2AX, RAD51, or 53BP1 foci (red or green). Blue represents nuclear DNA stained with DAPI. (G) Quantification of Rad51 foci in γ-irradiated (2GY) MPC with tamoxifen-inducible SPOP-F133V. Rad51 foci were counted 30 min post irradiation. (H) Representative pictures showing Rad51 foci in mouse prostate epithelial cells before and after γ-irradiation (2GY). (I) Quantification of RAD51 foci in RWPE cells treated with siSPOP or control siRNA and subsequently exposed to CPT (1 μM, 1 hr).
Figure 3—figure supplement 1
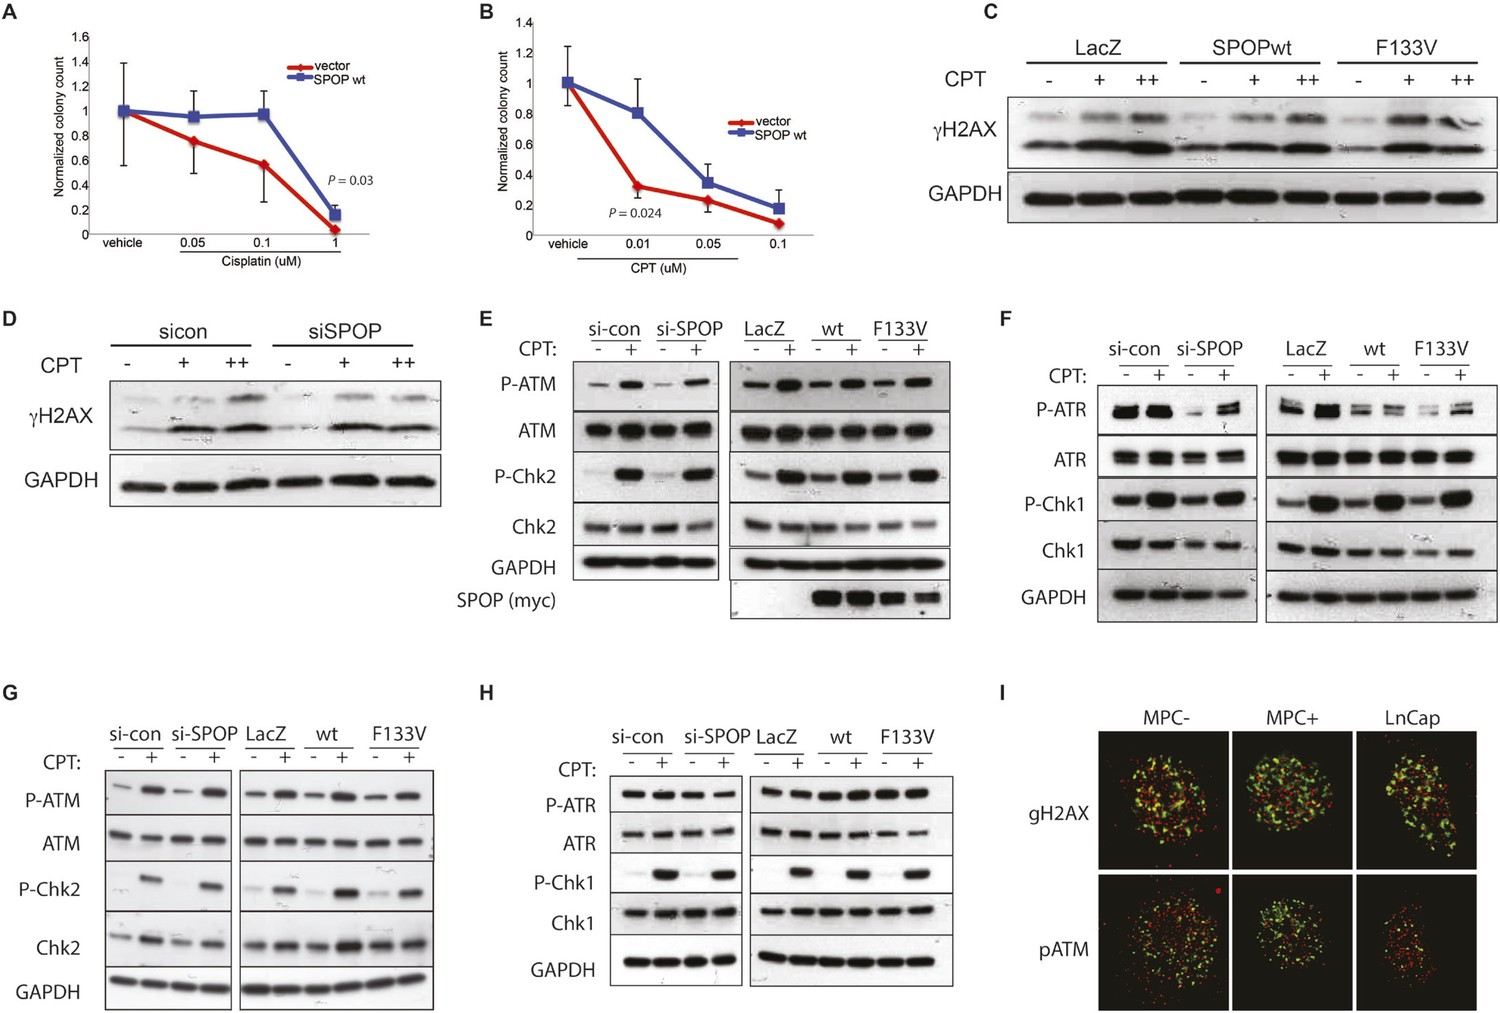
SPOP and response to DSB.
(A, B) Clonogenic assay measuring survival of stable SPOP-expressing 22Rv1 cells after CPT or cisplatin treatment. (C) Western blot for the DSB marker γH2AX using protein lysates from RWPE cells before and after CPT treatment (30 min) in RWPE cells either ectopically expressing SPOP-wt or -F133V or (D) treated with control (sicon) or SPOP targeting siRNA (siSPOP). (E–H) Western blot for DNA damage signaling proteins using protein lysates from 22Rv1 (E, F) or RWPE (G, H) cells before and after CPT treatment (30 min). Cells either ectopically expressed SPOP-wt or SPOP-F133V or were treated with control (sicon) or SPOP-targeting siRNA (siSPOP). (I) Immunofluorescence-based partial colocalization of SPOP (red) and early DNA damage markers gH2AX or pATM (green). MPC-expressing Cre-inducible SPOP-F133V was transduced with tamoxifen-inducible Cre (CreERT2). MPC were treated with 4-OH tamoxifen or vehicle and exposed to ionizing radiation (3GY).
Figure 3—figure supplement 2
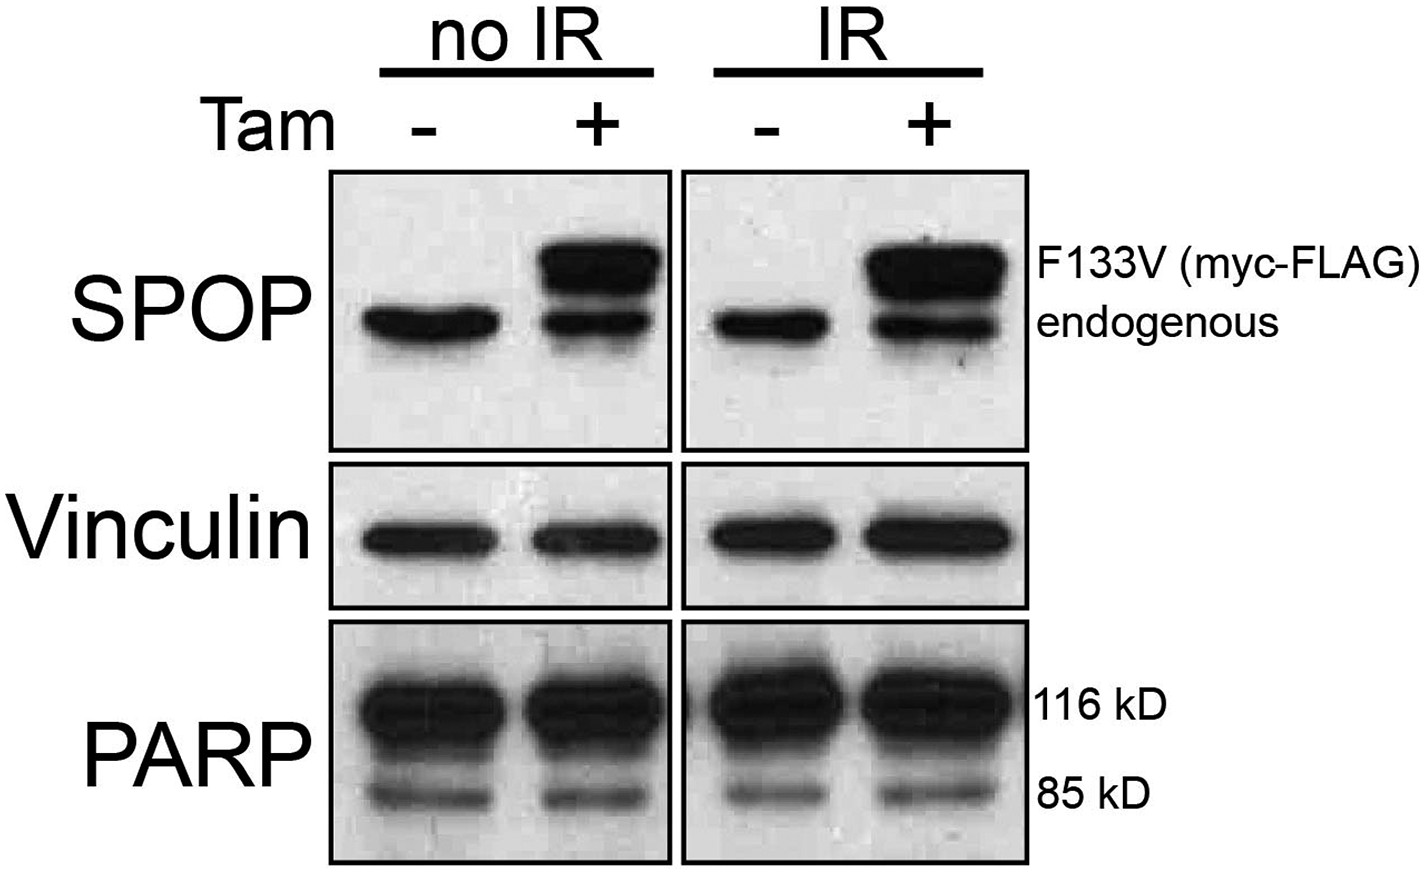
Prostate cells derived from transgenic mice (MPC) expressing Cre-inducible SPOP-F133V were infected with tamoxifen-inducible Cre (CreERT2) and treated with 4-OH tamoxifen (+Tam) or vehicle (−Tam) and exposed to 15 GY IR followed by Immunoblot for SPOP, PARP, and vinculin (loading control) blot after 3 hr recovery.
https://doi.org/10.7554/eLife.09207.018
Figure 3—figure supplement 3

SPOP mutation impairs HDR-DSB repair and promotes NHEJ.
(A-F) Quantification of 53BP1 and RAD51 foci in 22RV1 and RWPE cells ectopically expressing SPOP-wt or SPOP-F133V after camptothecin (CPT) (1 μM) or gamma irradiation (3GY)-induced DNA damage. Time indicates the observation interval in minutes including DSB induction (0–60 min) and recovery (60–1440 min). Shown are the percentages of cells for each genotype with more than 5 foci per nucleus. (G, H) Representative pictures of 53BP1 or RAD51 foci (green). Blue represents nuclear DNA stained with DAPI. (I) Quantification of 53BP1 foci in RWPE ectopically expressing SPOP-wt, SPOP-F102C or SPOP-F133V mutant SPOP after CPT (1 μM, 1 hr)-induced DNA damage. (J) Immunofluorescence staining of MYC-tagged SPOP in RWPE cells confirms nuclear localization. Blue indicates DAPI-stained DNA. Green foci indicate SPOP protein. Error bars represent s.e.m. (K) Propidium iodide-based cell cycle analyses of RWPE cells.
Figure 4
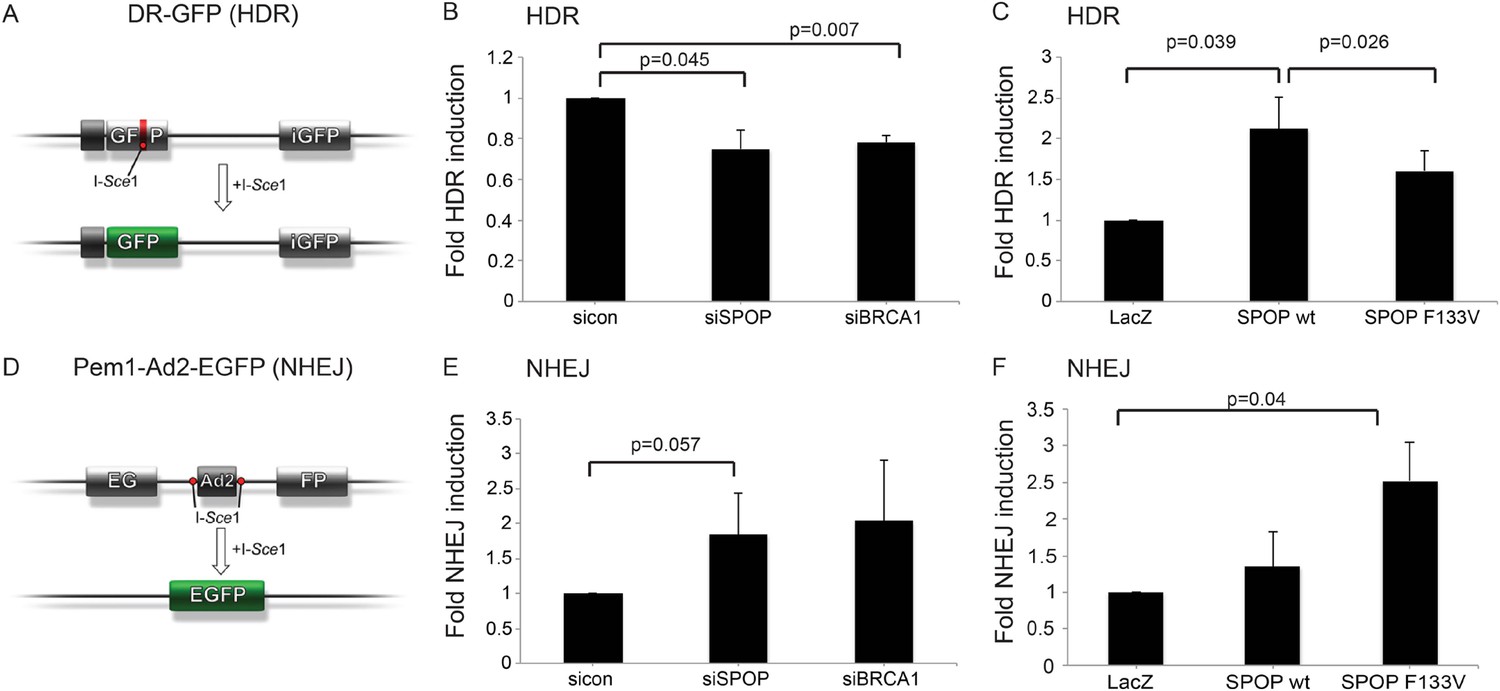
SPOP modulates DSB repair activity similar to BRCA1.
(A) Schematic overview of the DR-GFP assay used to measure homology-directed repair (HDR) activity. (B, C) Analysis of the HDR-activity in HEK 293 cells with siRNA knockdown of SPOP or BRCA1 and ectopically expressing SPOP-wt or SPOP-F133V. (D) Schematic overview of the Pem1-Ad2-EGFP assay used to measure NHEJ-activity. (E, F) Analysis of the NHEJ-activity in HEK 293 cells with siRNA knockdown of SPOP or BRCA1 and ectopically expressing SPOP-wt or SPOP-F133V. All results are represented as s.e.m.
Figure 5 with 1 supplement
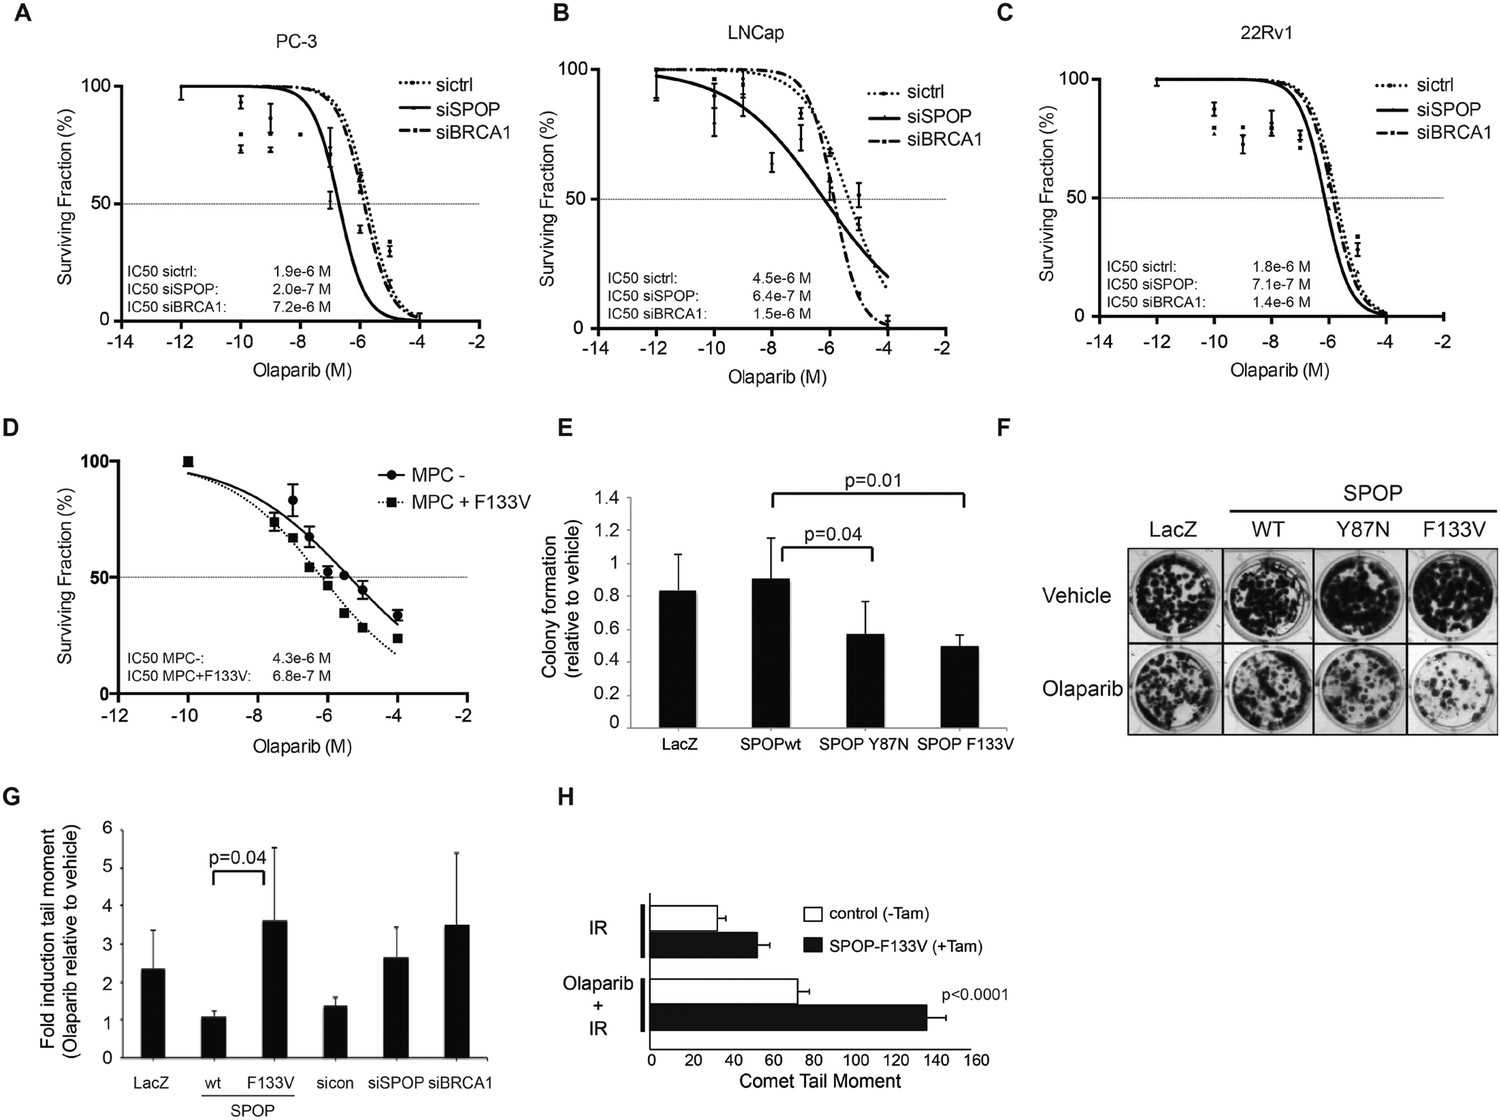
SPOP mutation sensitizes cells to therapeutic PARP inhibition.
(A–D) Analysis of sensitivity to the PARP inhibitor olaparib in irradiated (5GY) prostate cancer (PC-3, LNCaP, 22Rv1) and mouse prostate epithelial cells (MPC) after SPOP knockdown (siSPOP) or tamoxifen-inducible SPOPF133V expression. BRCA1 knockdown (siBRCA1) and non-targeting siRNA (sictrl) served as positive or negative control. The IC50 of olaparib for each genotype is indicated in Molar (M). (E) Analysis of the sensitivity of most frequently occurring prostate-specific SPOP mutants Y87N and F133V to olaparib in clonogenic assays using HEK293 cells. (F) Representative examples from the clonogenic assay used to assess long-term survival in HEK293 cells stably expressing SPOP-wt or SPOP mutants. (G) Impact of SPOP mutation on induction of genomic instability in 22Rv1 cells after olaparib (1 μM) treatment as measured by comet assay. Increased genomic instability was measured by an increase in the tail moment. (H) Genomic instability in tamoxifen-inducible SPOP-F133V expressing mouse prostate cells after γ-irradiation (15GY) with and without olaparib (1 μM) treatment as measured by comet assay. All results are represented as s.e.m.
Figure 5—figure supplement 1
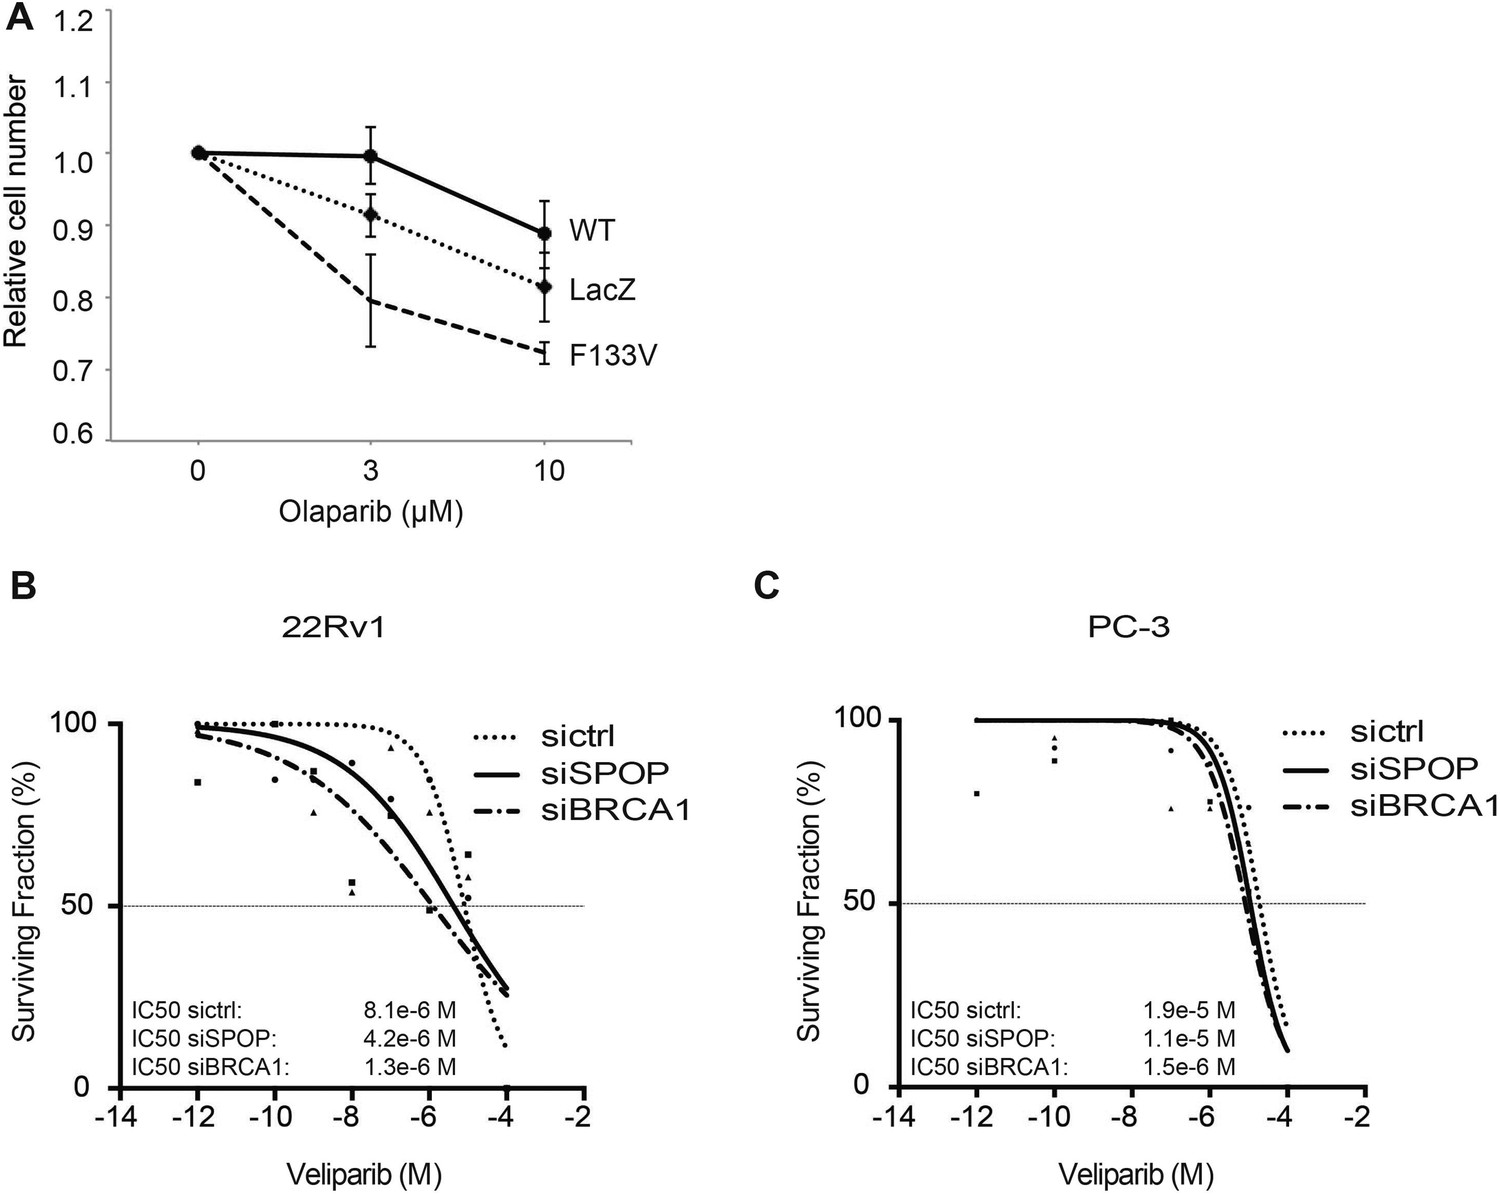
SPOP mutation and loss sensitize prostate cancer cells to therapeutic PARP inhibition.
(A) In vitro drug sensitivity assay of 22Rv1 cells expressing SPOP-wt or SPOP-F133V. Cells were treated with the indicated concentrations of olaparib for 96 hr. LacZ was used as empty control expression vector. (B, C) In vitro drug sensitivity assay of 22Rv1 and PC-3 cells treated with control siRNA (sictrl), SPOP, or BRCA1 targeting siRNA (siSPOP, siBRCA1). After irradiation (5GY) cells were treated with the PARP-1 inhibitor veliparib for 96 hr. IC50 values for each genotype are indicated in Molar (M).
Figure 6
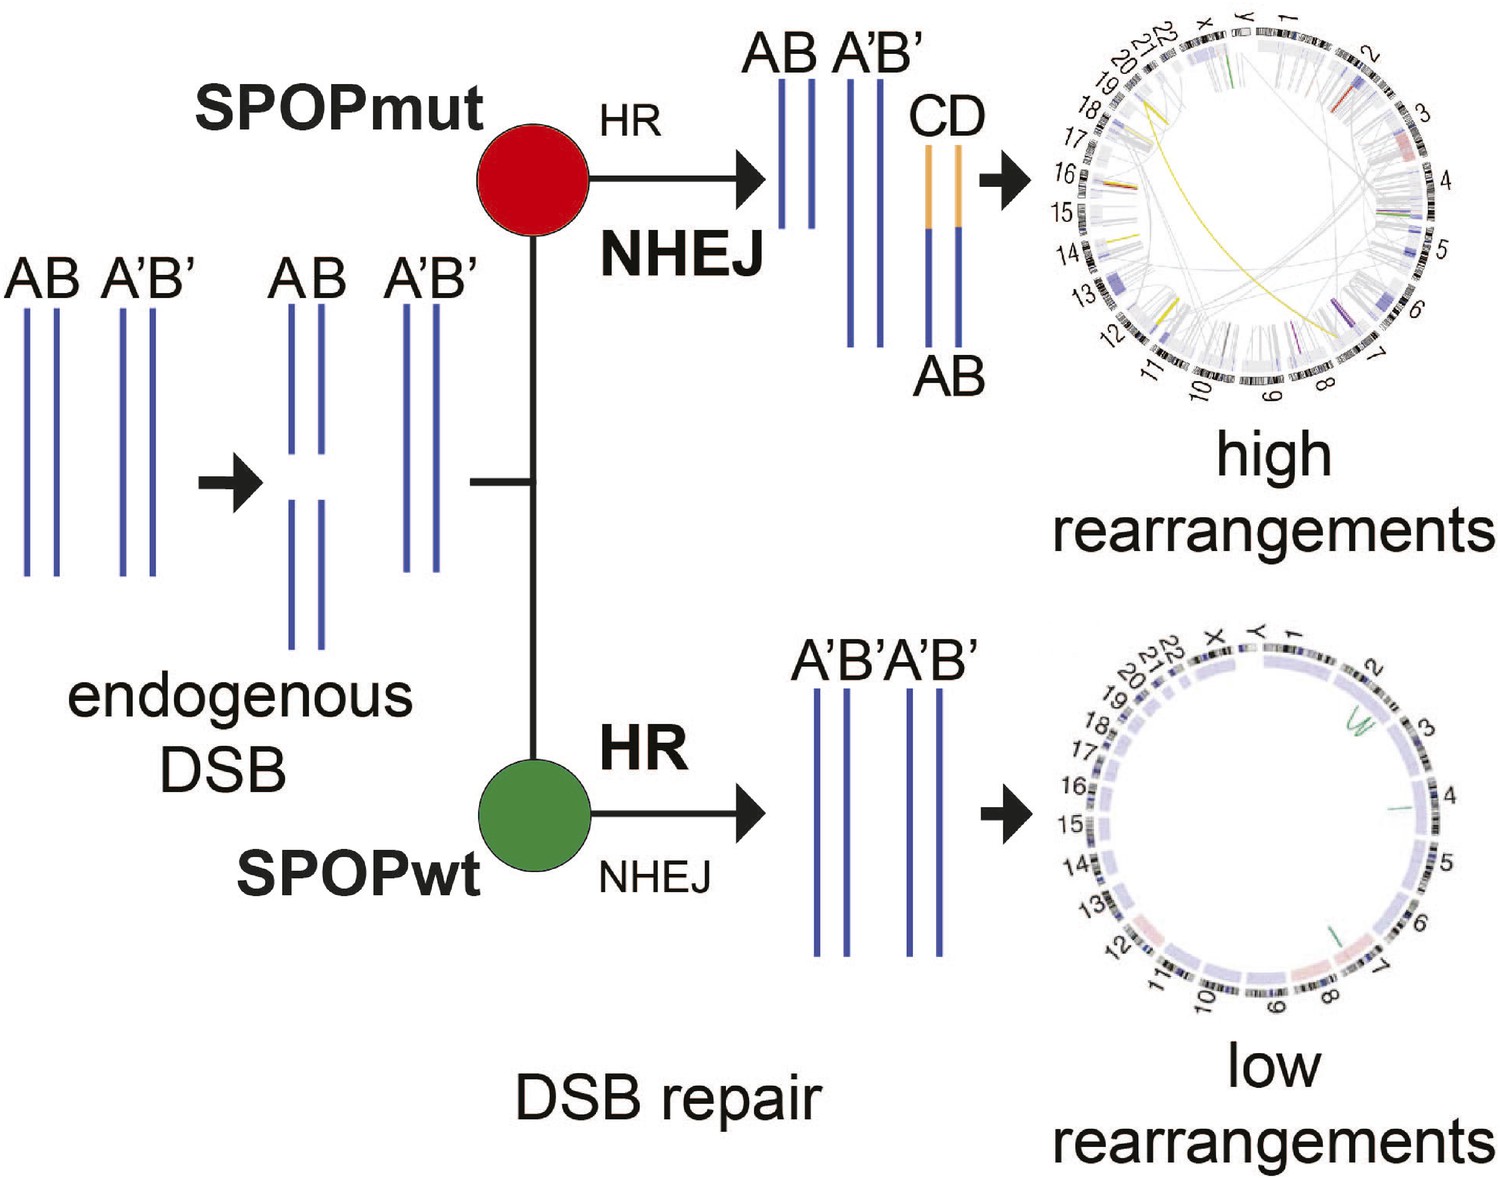
Proposed model of the effects of SPOP mutation on genome instability.
In prostate epithelial cells, SPOP-wt promotes error-free HR and maintains genome stability. SPOP mutation impairs HR repair and promotes error-prone NHEJ, leading to increased genomic instability.
Author response image 1

Author response image 2
Additional files
-
Supplementary file 1
Sequences of antisense-morpholino's targeting Spop as well as primers used in this study.
- https://doi.org/10.7554/eLife.09207.024
Download links
A two-part list of links to download the article, or parts of the article, in various formats.
Downloads (link to download the article as PDF)
Open citations (links to open the citations from this article in various online reference manager services)
Cite this article (links to download the citations from this article in formats compatible with various reference manager tools)
SPOP mutation leads to genomic instability in prostate cancer
eLife 4:e09207.
https://doi.org/10.7554/eLife.09207


