ETO family protein Mtgr1 mediates Prdm14 functions in stem cell maintenance and primordial germ cell formation
- Stanford University School of Medicine, United States
- University of Chicago, United States
- National Institute of Environmental Health Sciences, United States
Figures
Figure 1 with 1 supplement
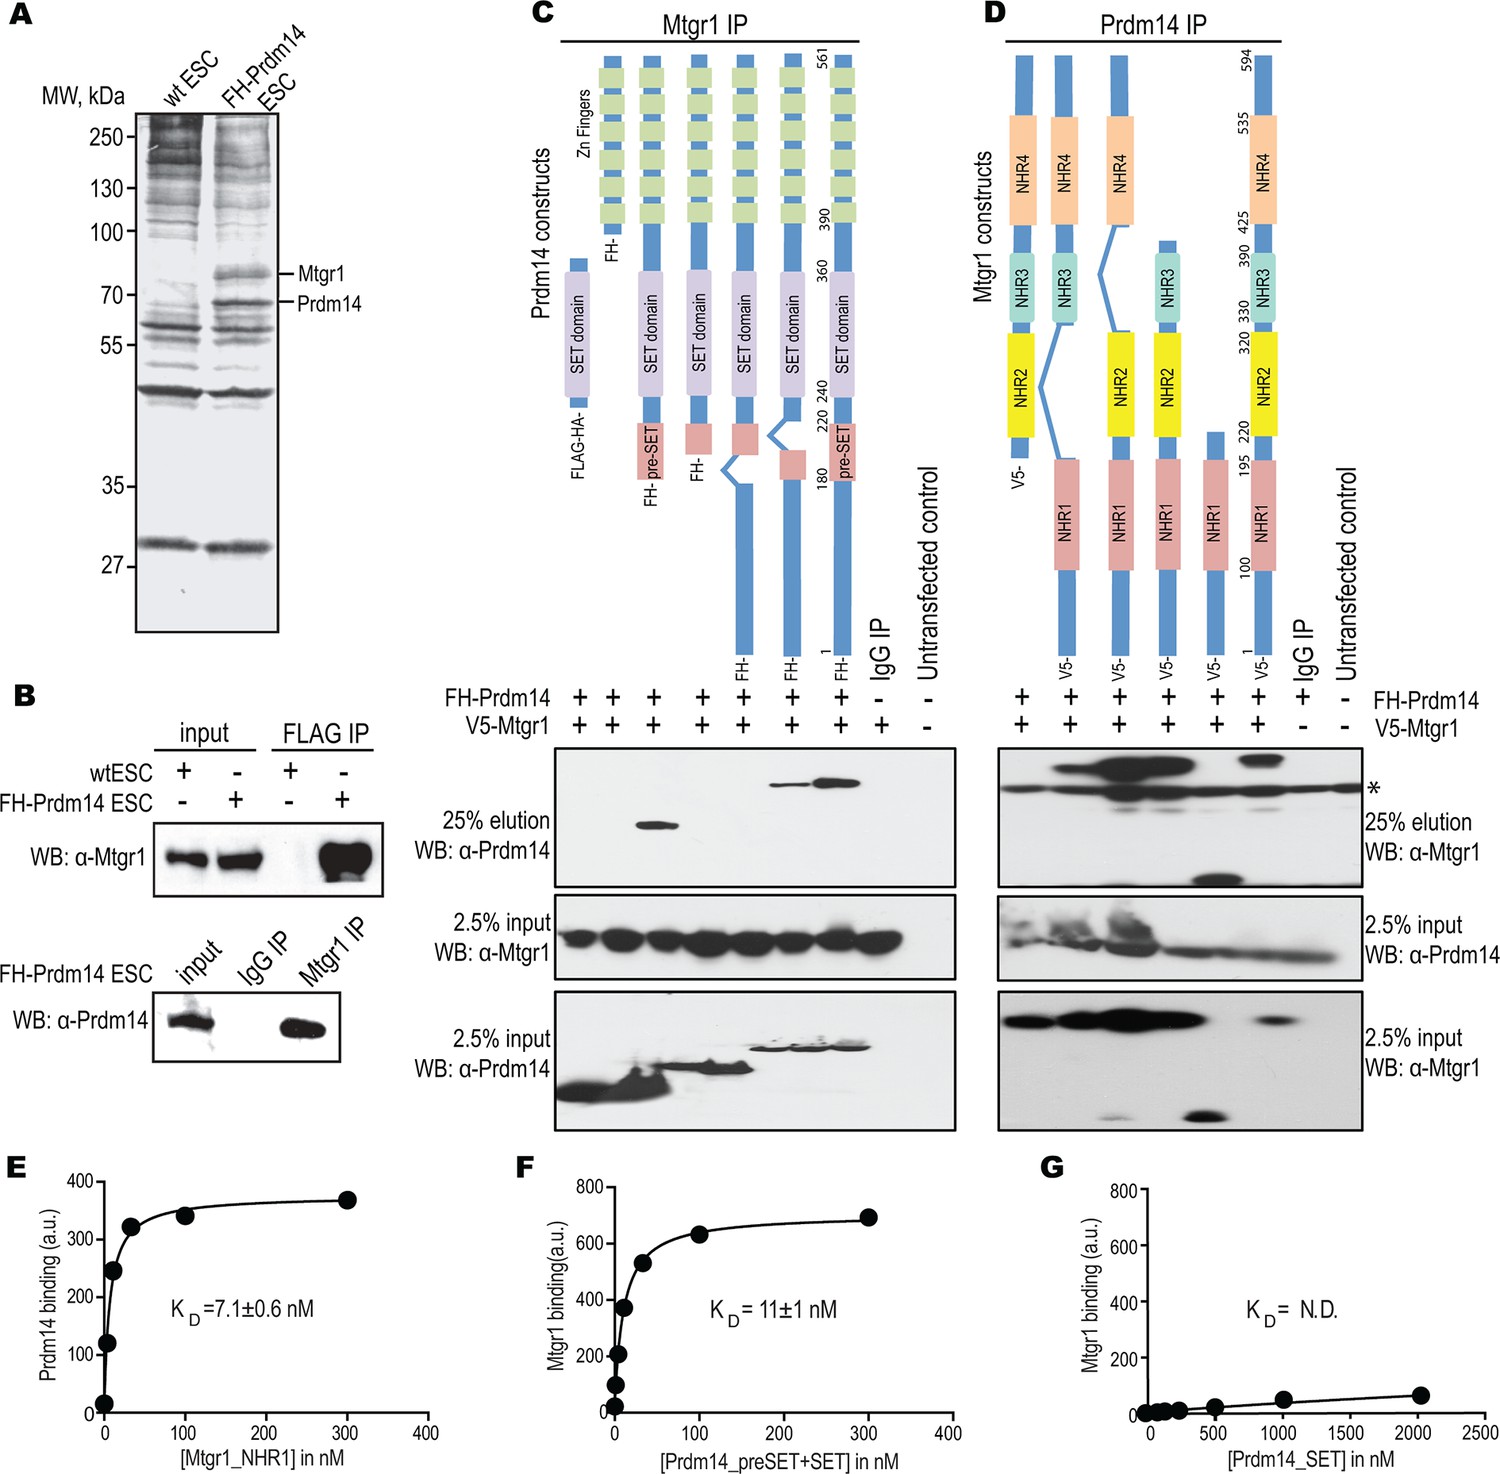
Prdm14 directly binds to the ETO family protein, Mtgr1.
(A) Two-step immunoaffinity purification of Prdm14-associated proteins. FLAG–HA immunoprecipitations were performed from wild-type (wt) or FH-Prdm14 mESC extracts, followed by visualization of polypeptides by SDS-PAGE-silver stain and mass spectrometry identification. Polypeptides corresponding to Mtgr1 and Prdm14 are highlighted. (B) Reciprocal Mtgr1 and Prdm14 co-immunoprecipitations from FH-Prdm14 mESCs. (C, D) Identification of the Prdm14-Mtgr1 interaction regions. Co-immunoprecipitations were performed in HEK293 cells transfected with full-length V5-tagged Mtgr1 and distinct FH-Prdm14 constructs (C) or full-length FH-Prdm14 and distinct V5-Mtgr1 constructs (D), as indicated in the top diagrams; co-immunoprecipitated proteins were visualized by immunoblotting with α-HA (Prdm14) and α-V5 (Mtgr1) antibodies (top left and right panels, respectively). Tagged Prdm14 and Mtgr1 levels in the input extracts are shown in the bottom panels. (E) Recombinant biotinylated Prdm14 (pre-SET+SET) was immobilized on streptavidin-coated beads and incubated with recombinant Mtgr1 (NHR1), and changes in fluorescence (SAV-Dylight650) were measured. (F, G) Recombinant biotinylated Mtgr1 (NHR1) was immobilized on streptavidin-coated beads and incubated with (F) Prdm14 (pre-SET+SET) or (G) Prdm14 (SET) and changes in fluorescence (SAV-Dylight650) were measured. The error bars and the errors for the KD values are the standard deviation (n = 3). The curves show the best fit of the 1:1 binding model using the GraphPad software. * indicates non-specific bands. HEK, human embryonic kidney; Mtgr1, myeloid translocation gene related 1; MW, molecular weight marker; NHR1, nervy homology region 1. N.D., not determined.
-
Figure 1—source data 1
List of proteins recovered from the Prdm14 IP-MS experiment.
- https://doi.org/10.7554/eLife.10150.004
Figure 1—figure supplement 1
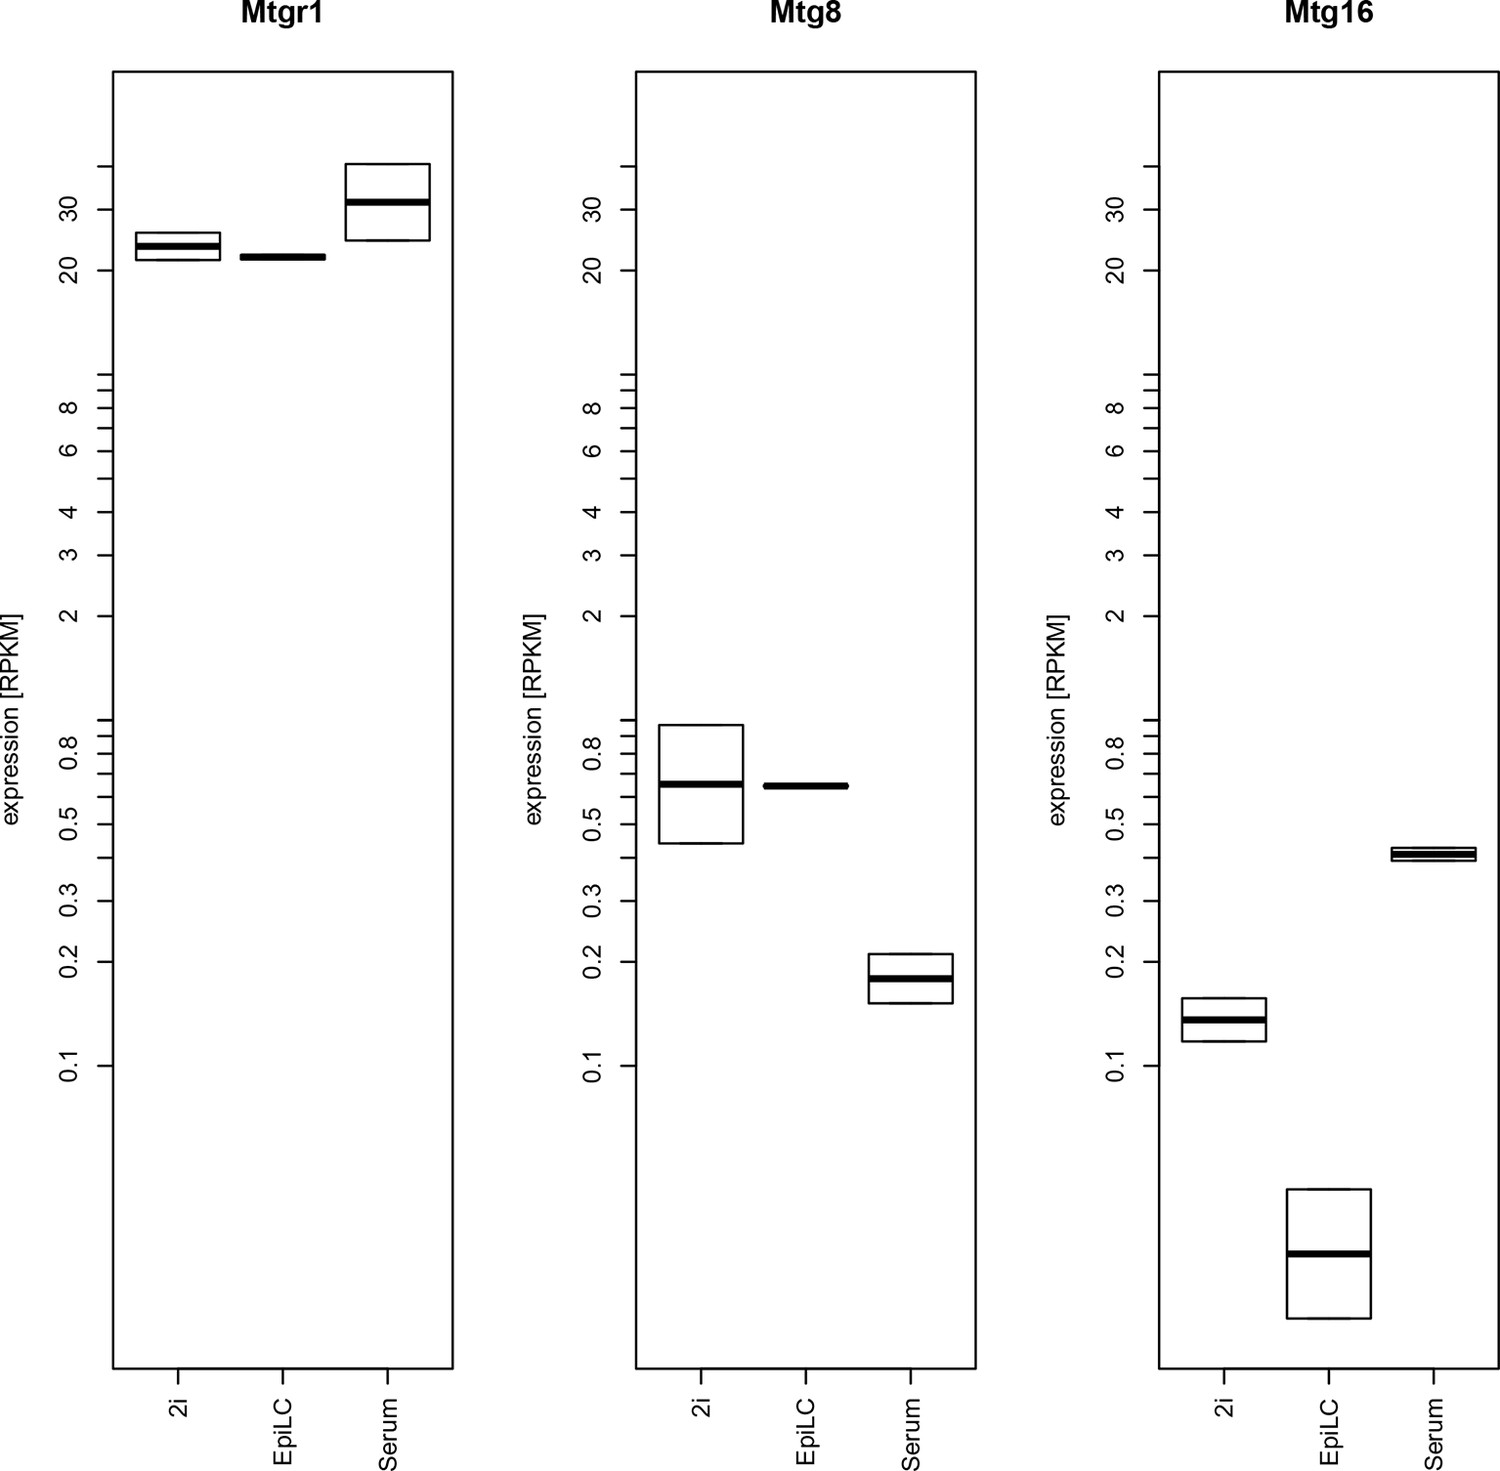
Expression levels of mRNAs encoding ETO proteins.
Plotted are RPKM values for Mtgr1, Mtg1 and Mtg16 obtained in RNA-seq experiments from mESC grown under serum+LIF or 2i+LIF conditions or from EpiLCs. EpiLCs, epiblast-like cells; LIF, leukemia inhibitory factor; mESC, mouse embryonic stem cell; Mtgr1, myeloid translocation gene related 1; RNA-seq, RNA sequencing; RPKM, reads per kilobase of exon per million reads mapped.
Figure 2 with 2 supplements
Prdm14 and Mtgr1 co-occupy genomic targets.
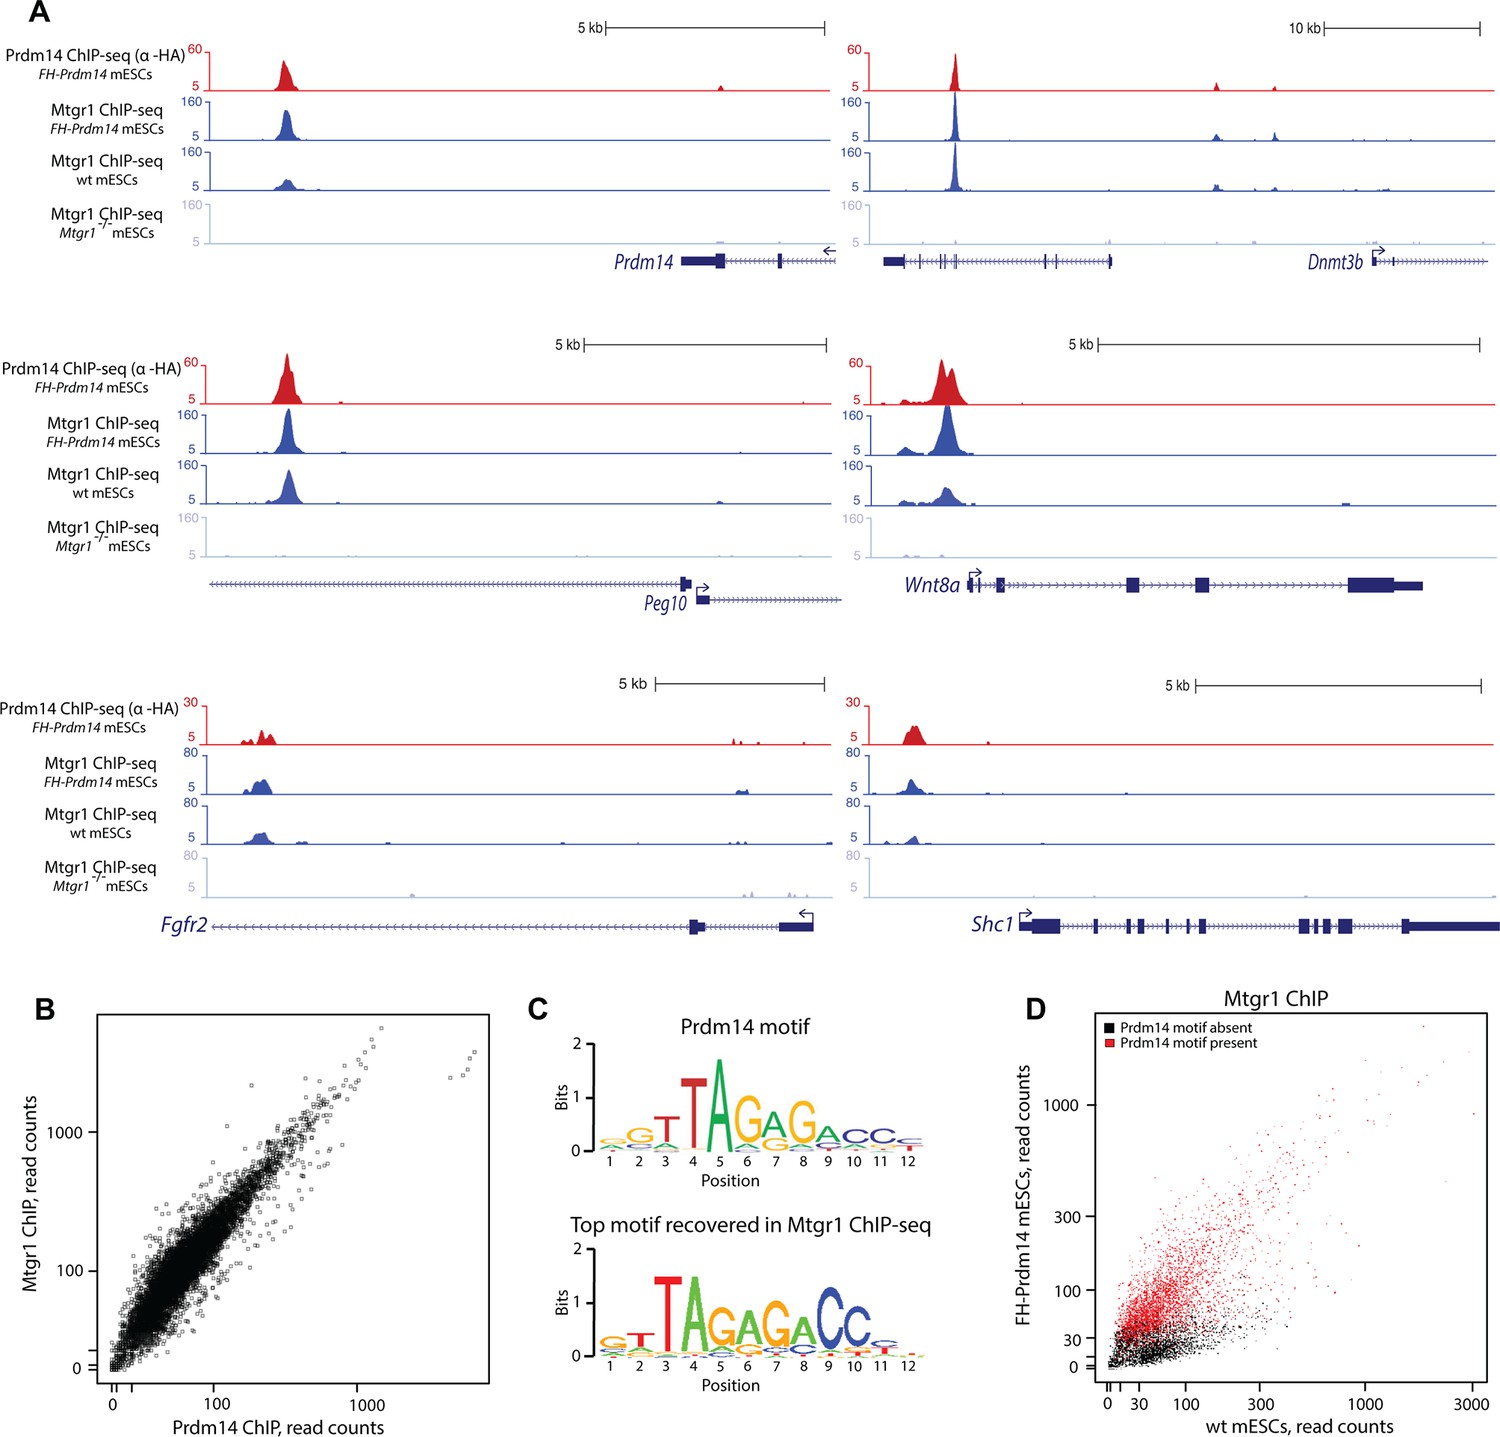
(A) Prdm14 and Mtgr1 ChIP-seq enrichments at selected gene loci. Tracks represent sequence tag enrichments as determined by Quest software. (B) Scatter plot of Prdm14 and Mtgr1 genomic occupancies in FH-Prdm14 mESC line. (C) The top sequence motif recovered in Mtgr1 ChIP-seq corresponds to the Prdm14 motif, as defined previously (Ma et al. 2011). Logos for the consensus motifs were generated using SeqPos. (D) Scatter plot of Mtgr1 genomic occupancy in wt and FH-Prdm14 mESC lines. The plot is colored based on the presence of Prdm14 motif (red, motif is present, p-value <10-3; black, motif is absent). ChIP-seq, chromatin immunoprecipitation with sequencing; mESC, mouse embryonic stem cell; Mtgr1, myeloid translocation gene related 1.
Figure 2—figure supplement 1
Genomic occupancy of Mtgr1.
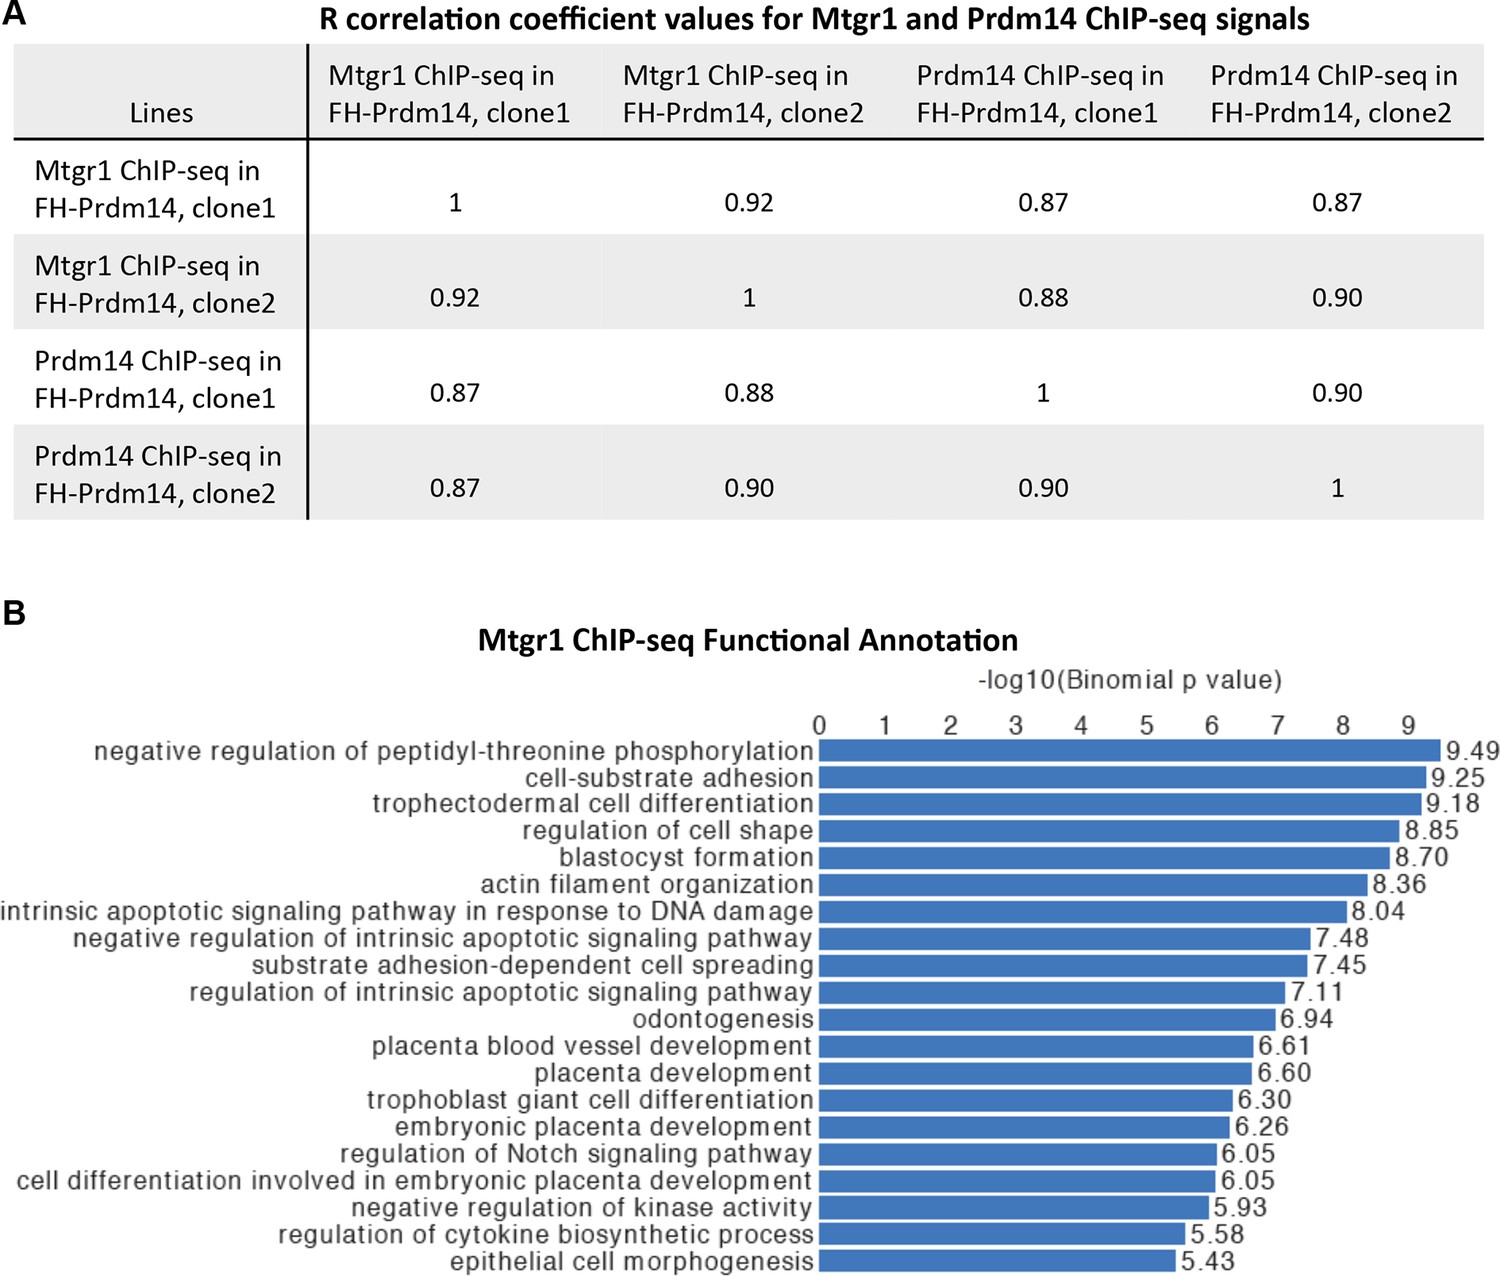
(A) Correlation coefficient, R, between Mtgr1 and Prdm14 (anti-HA) ChIP-seq genomic occupancy levels in two different clonal FH-Prdm14 mESC lines. (B) Functional annotation categories of the Mtgr1 binding sites in FH-Prdm14 mESCs as determined by GREAT. ChIP-seq, chromatin immunoprecipitation with sequencing; GREAT, genomic regions enrichment of annotations tool; mESCs, mouse embryonic stem cell; Mtgr1, myeloid translocation gene related 1.
Figure 2—figure supplement 2

Genomic occupancy of Mtgr1 at Prdm14 motif-lacking sites.
(A) Genomic tracks at select Prdm14 motif-lacking Mtgr1 binding sites. Note that these sites lack Prdm14 binding and Mtgr1 peaks are present in wt cells, but not in the FH-Prdm14-overexpressing line. (B) Aggregate plots of Mtgr1 ChIP-seq enrichments at Prdm14 motif-containing (left) or Prdm14 motif-lacking (right) Mtgr1 sites from indicated ESC cell lines. (C) Top five motifs recovered from the Mtgr1-binding sites where Prdm14 motif was absent. ChIP-seq, chromatin immunoprecipitation with sequencing; ESC, embryonic stem cell; Mtgr1, myeloid translocation gene related 1; wt, wild type.
Figure 3 with 6 supplements
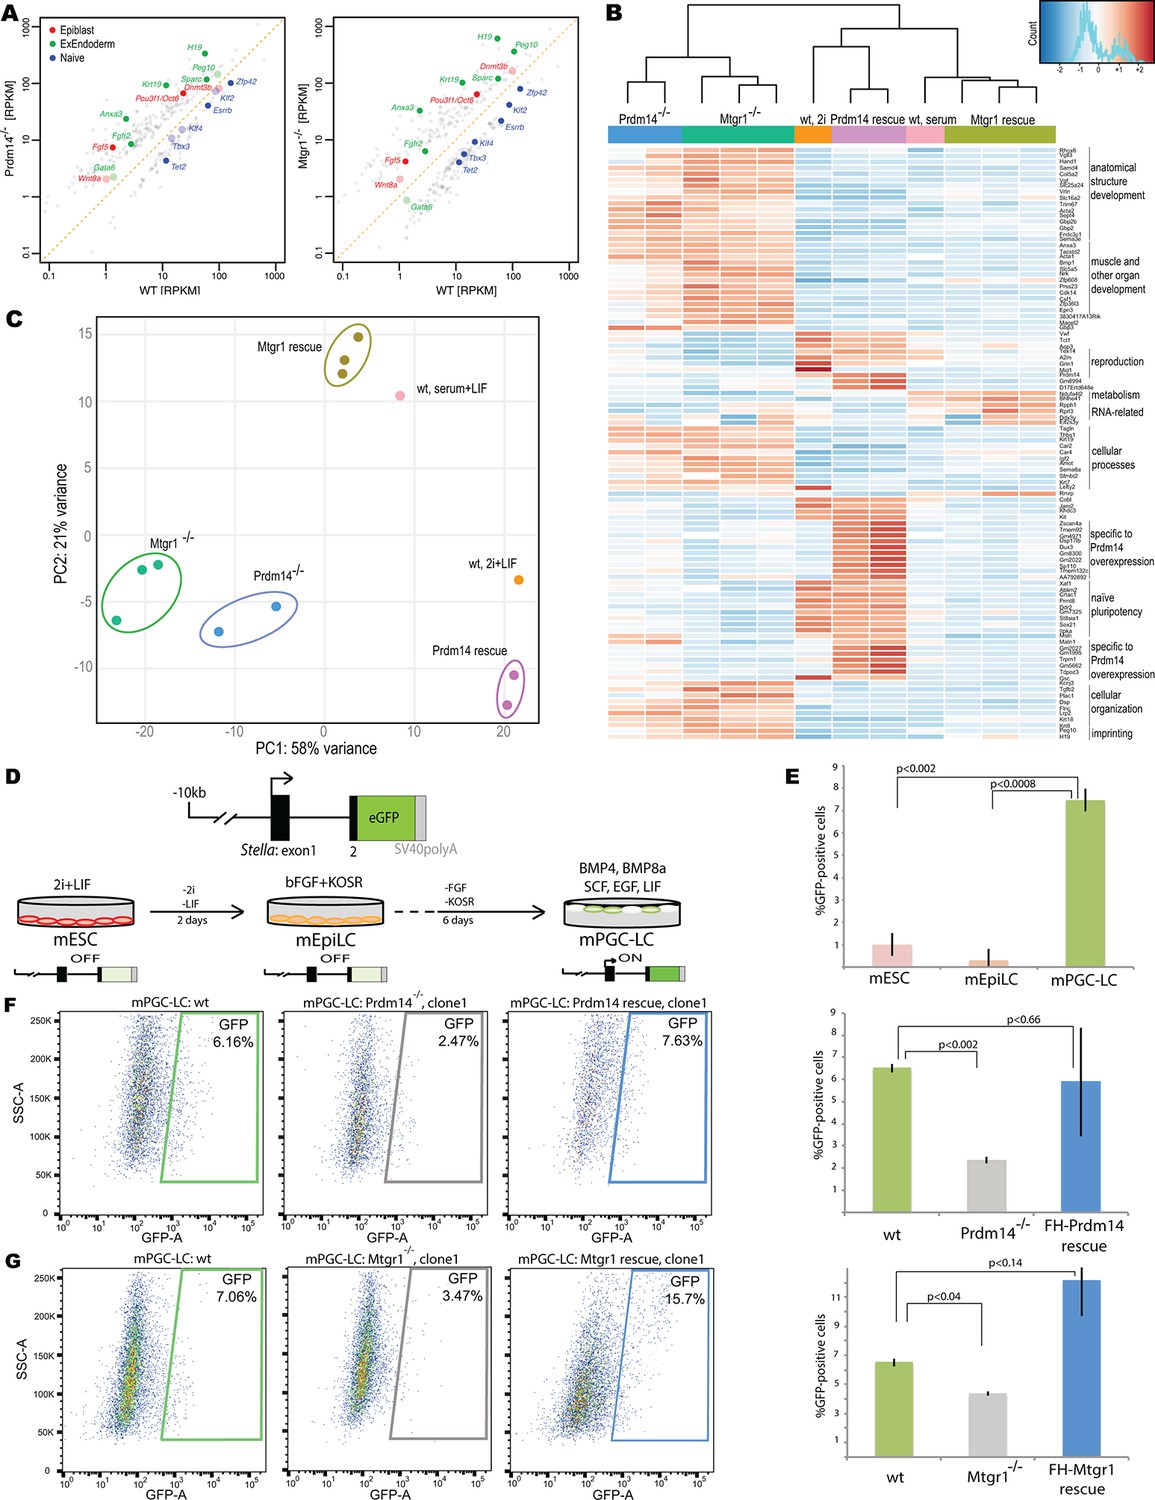
Loss of Mtgr1 phenocopies requirement for Prdm14 in safeguarding pluripotency and PGC induction.
(A) RNA-seq from Prdm14−/− cells or Mtgr1−/− cells (y-axis) were compared to wt cells (x-axis) and expression values (RPKM) of all significantly changed transcripts were plotted. Select transcripts corresponding to those enriched in the post-implantation epiblast, extraembryonic endoderm or naïve pluripotent mESC are highlighted in red, green or blue, respectively; shaded colors indicate no significant difference. (B) Heatmap displaying top 100 variable genes between wt mESCs grown under naïve 2i+LIF or serum+LIF conditions, Prdm14−/− (2 clones) or Mtgr1−/− (3 clones) cells, and their respective rescue lines. Clustering represents sample divergence. (C) Principal component analysis on the same populations as in B. (D) mESC to mEpiLC transition followed by PGC-LC induction using defined media in cells containing Stella:GFP reporter. Schematic of the Stella:GFP transgene reporter that contains a 10kb 5’ upstream sequence and includes exon 1 and part of exon 2 fused in-frame with eGFP, followed by the SV40 polyadenylation sequence (Payer et al. 2006). The reporter is active in mPGC-LCs when Stella expression is activated. (E) Quantification of the GFP signal in wt cells during the mESC to mEpiLC and further to mPGC-LC transition. (F) FACS plots and gated quantification of GFP signal as a measure of mPGC-LC induction from wt cells, Prdm14−/− cells or Prdm14 rescue clones. (G) FACS plots and quantification of GFP signal as a measure of PGC-LC induction from wt cells, Mtgr1−/− cells or Mtgr1 rescue clones. FACS, fluorescence-activated cell sorting; GFP, green fluorescent protein; LIF, leukemia inhibitory factorm; EpiLCs, mouse epiblast-like cells; mESCs, mouse embryonic stem cell; mPGC-LCs, mouse primordial germ cell-like cells; Mtgr1, myeloid translocation gene related 1; RPKM, reads per kilobase of exon per million reads mapped; wt, wild-type.
Figure 3—figure supplement 1
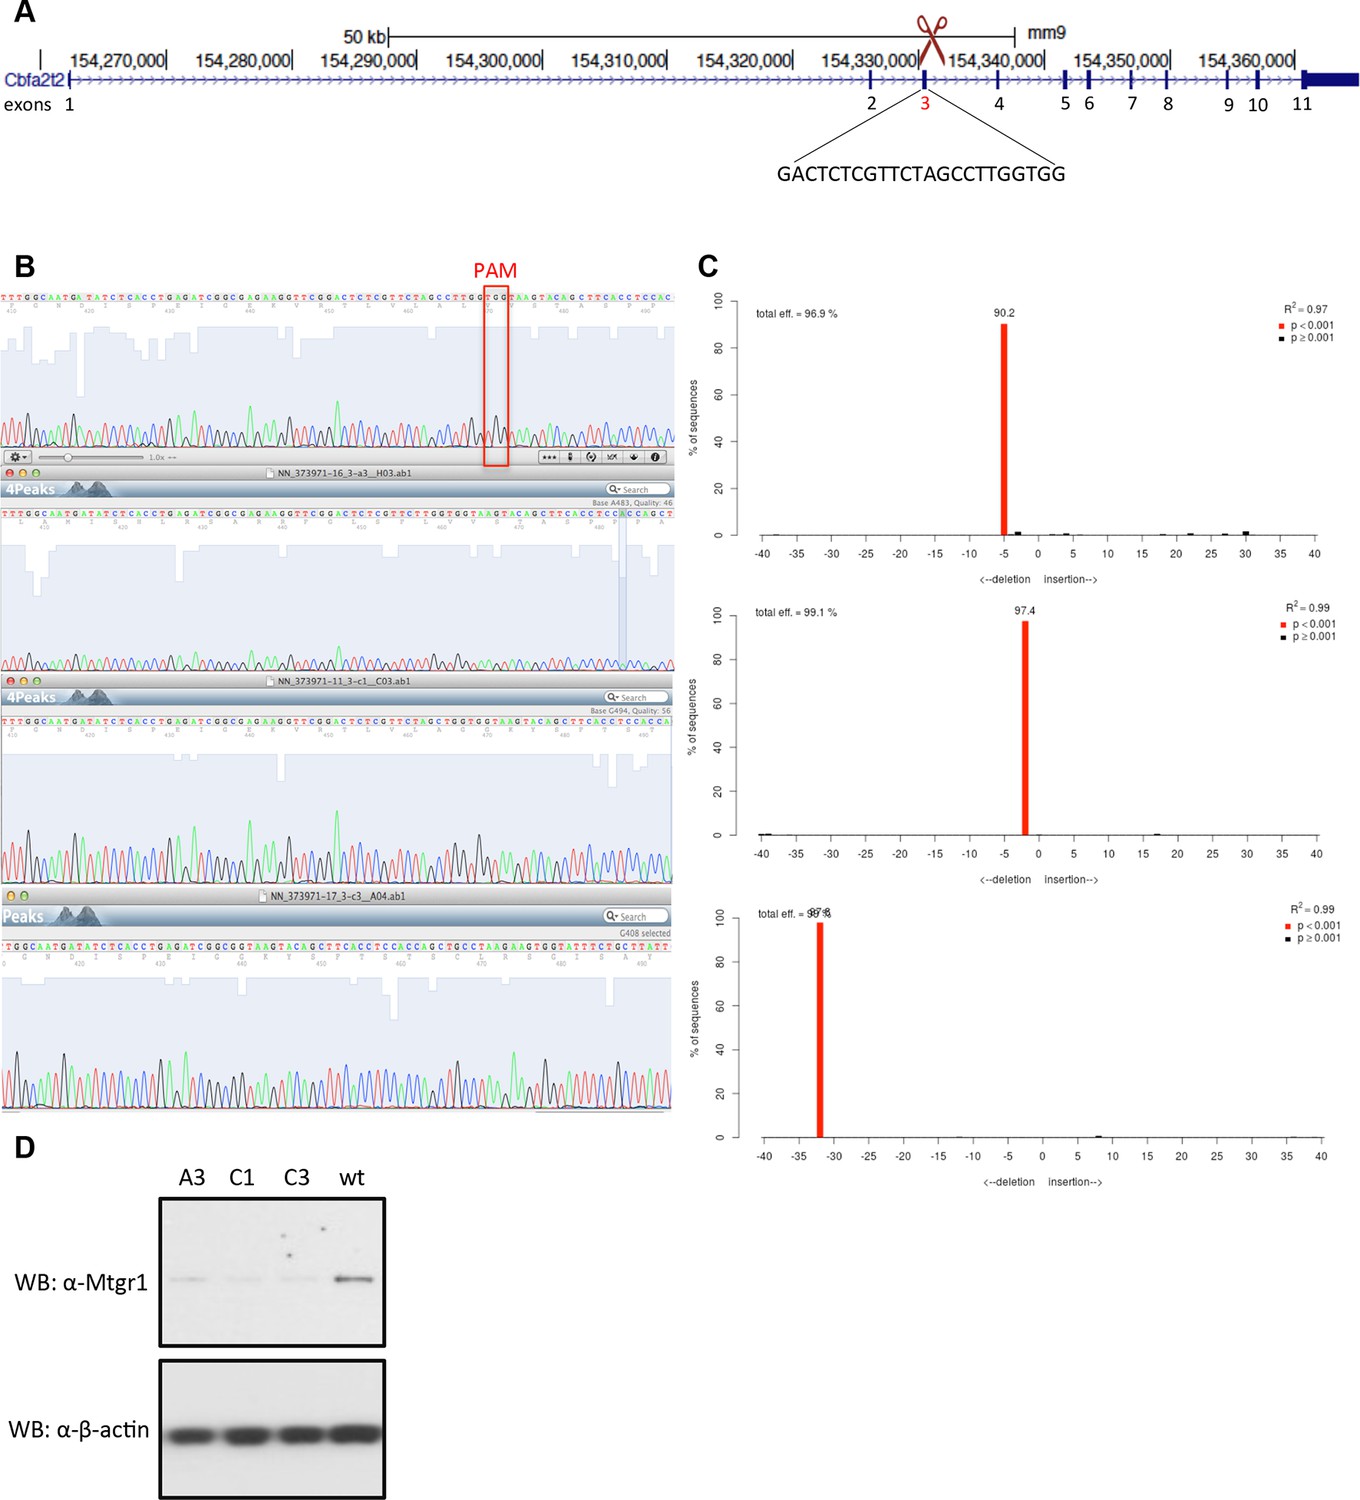
Generation of Mtgr1-null line in Stella:GFP mESCs using CRISPR-Cas9 system.
(A) Schematic of the Mtgr1 gene and sequence of the guide RNA (http://crispr.mit.edu/). (B) Genomic and cDNA were extracted and chromatograms of the wt (top), mutant A3 line (clone 1), mutant C1 line (clone 2), and mutant C3 line (clone 3) are shown. (C) Indel spectrum centered around the PAM sequence was performed using software TIDE (http://tide.nki.nl/). Clones A3, C1, and C3 are shown, they all produce aberrant transcript. (D) Western blotting of the whole cell lysate from the wt, A3, C1 and C3 mESC Stella:GFP line. CRISPR, clustered regularly interspaced short palindromic repeat; GFP, green fluorescent protein; PAM, protospacer adjacent motif; mESCs, mouse embryonic stem cells; Mtgr1, myeloid translocation gene related 1; wt, wild type.
Figure 3—figure supplement 2
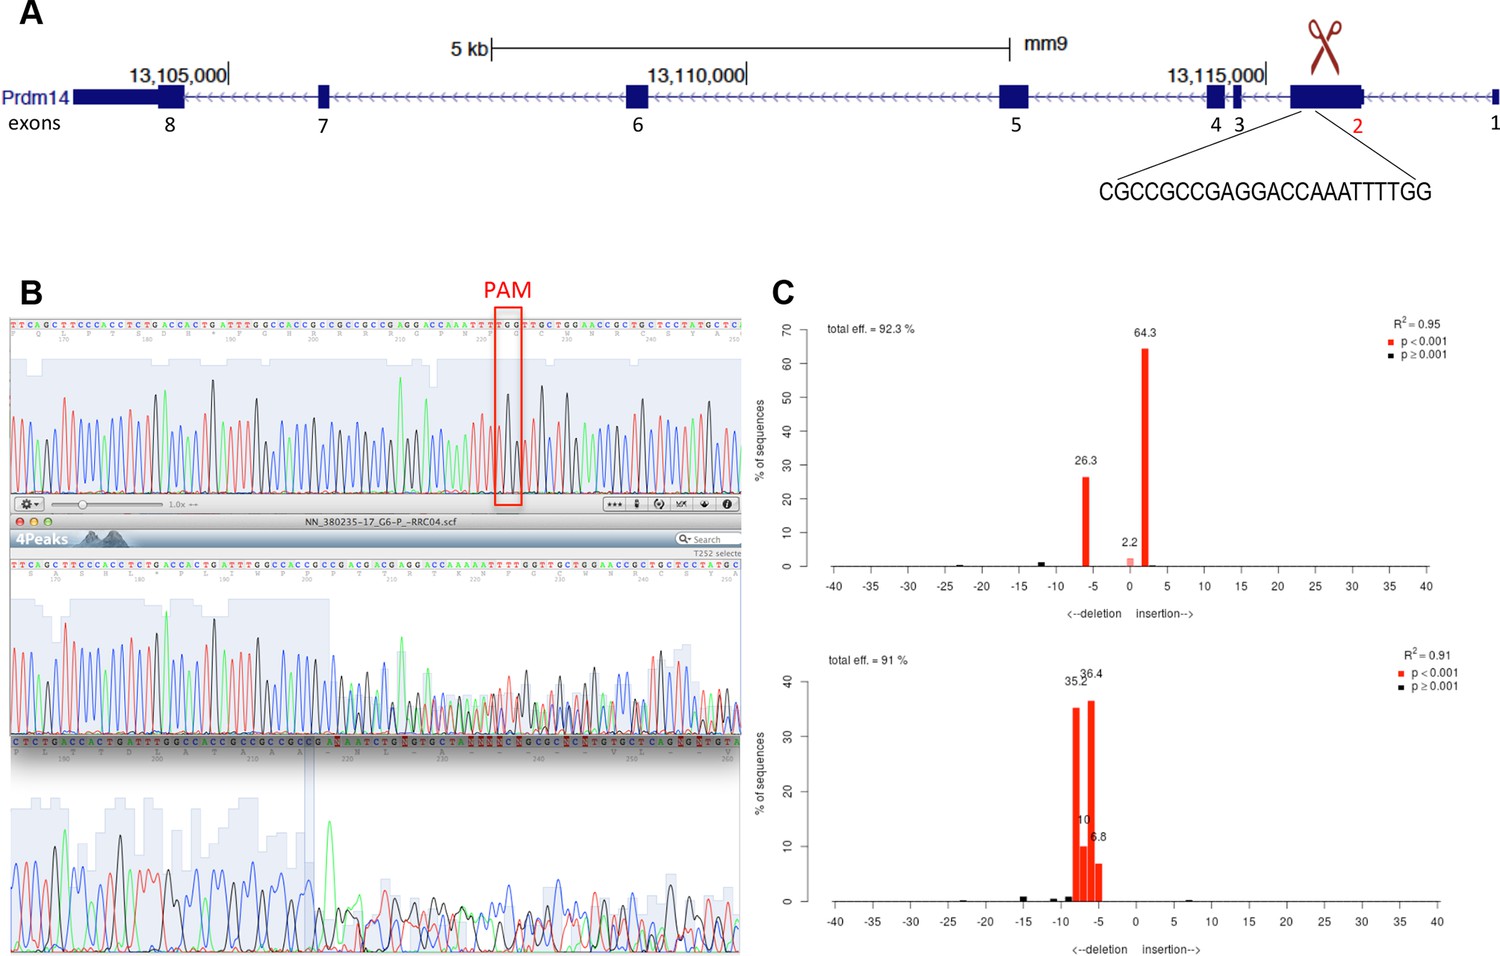
Generation of Prdm14-null line in Stella:GFP mESCs using CRISPR-Cas9 system.
(A) Schematic of the Prdm14 gene and sequence of the guide RNA (http://crispr.mit.edu/). (B) Genomic and cDNA were extracted and chromatograms of the wt (top), mutant G6 line (clone 1), and mutant F10 line (clone 2) are shown. (C) Indel spectrum centered around the PAM sequence was performed using software TIDE (http://tide.nki.nl/). Clone G6 is shown on top and clone F10 below. Clones G6 and F10 produce aberrant transcript. cDNA, complementary DNA; CRISPR, clustered regularly interspaced short palindromic repeat; GFP, green fluorescent protein; mESCs, mouse embryonic stem cells; wt, wild type.
Figure 3—figure supplement 3
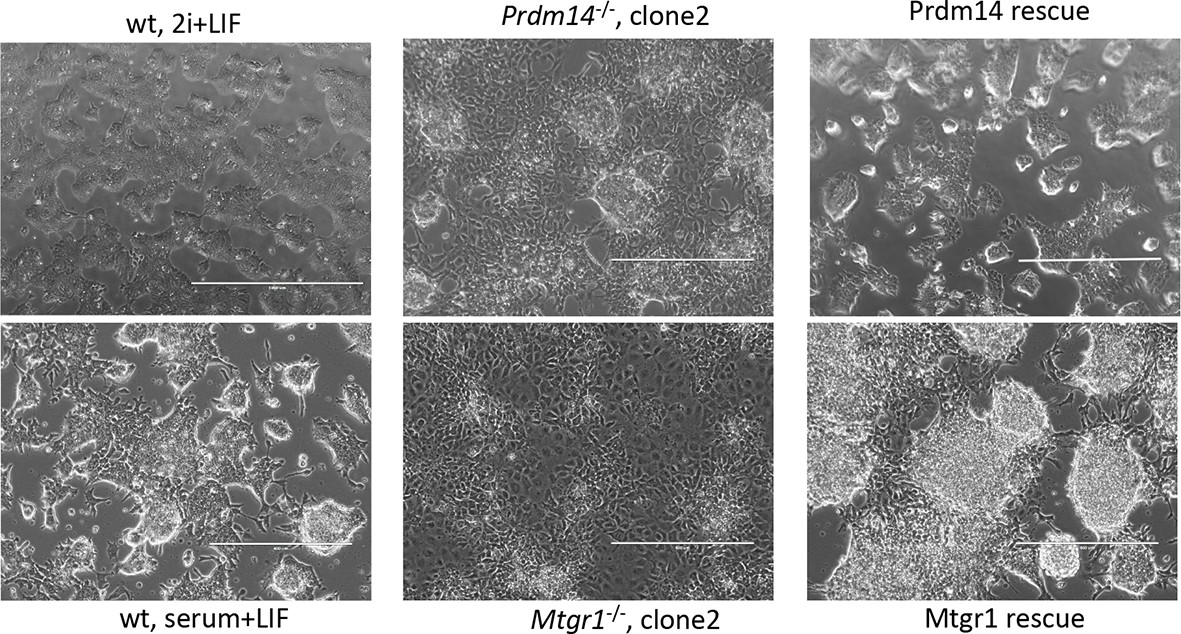
Morphological changes associated with loss of Prdm14 or Mtgr1.
Brighfield images of cell morphology from wt ESCs, Prdm14−/− or Mtgr1−/−ESCs or those reconstituted with wt FH-Prdm14 or FH-Mtgr1, respectively, all grown under serum+LIF conditions; wt ESC maintained in 2i+LIF are included for relative comparisons (upper left image). ESC, embryonic stem cell; LIF, leukemia inhibitory factor; Mtgr1, myeloid translocation gene related 1; wt, wild type.
Figure 3—figure supplement 4

Additional analyses of RNA-seq datasets.
(A) RNA-seq from Prdm14−/− cells or Mtgr1−/− cells (y axis) were compared with respective rescue lines (x axis) and expression values (RPKM) of all significantly changed transcripts were plotted. The transcripts of specific genes are highlighted in red, green or blue as indicated; shaded colors indicate no significant difference. (B) Scatter plot of genes upregulated at least twofold upon loss of either Prdm14 or Mtgr1. Highlighted in blue are genes significant for Mtgr1-null cells only, red – Prdm14-null only, magenta – genes significantly upregulated in both cell lines. Mtgr1, myeloid translocation gene related 1; RNA-seq, RNA sequencing; RPKM, reads per kilobase of exon per million reads mapped.
Figure 3—figure supplement 5
Expression of differentiation markers in embryoid bodies derived from wt or Mtgr1−/− ESCs.
(A) RT-qPCRs analyses of indicated markers in EBs induced from wt or Mtgr1−/− ESCs and cultured for four days in suspension after LIF withdrawal; shown relative to wt mESCs cultured under serum+LIF conditions. (B) RT-qPCRs analyses of select markers in EBs induced from wt or Mtgr1−/− ESCs and cultured for eight days in suspension after LIF withdrawal; shown relative to wt mESCs cultured under serum+LIF conditions. ESCs, embryonic stem cells; LIF, leukemia inhibitory factor; Mtgr1, myeloid translocation gene related 1; RT-qPCRs, quantitative reverse transcription-polymerase chain reaction; wt, wild type.
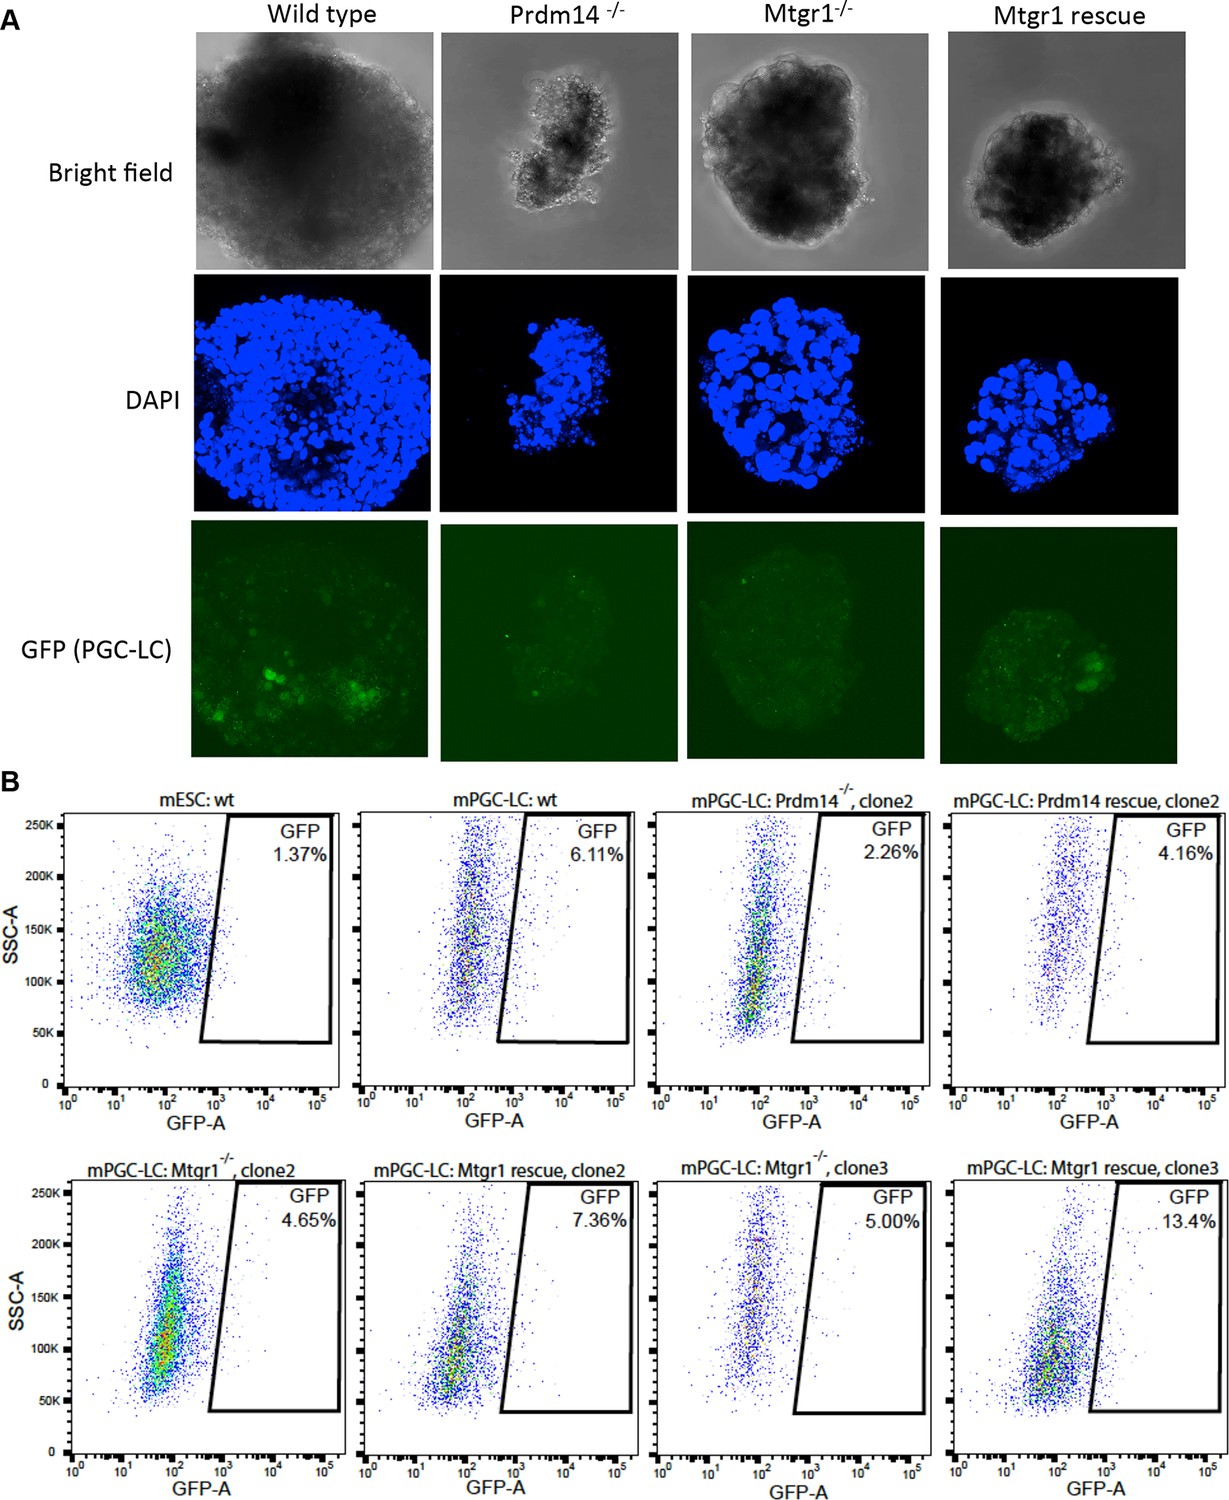
Figure 3—figure supplement 6

Loss of Mtgr1 results in defect in PGC-LC induction.
(A) Imaging of fixed mPGC-LCs on day 6 of differentiation using bright field, DAPI (stained with Hoechst) and GFP channels. Imaging was done using z-stacks and maximum projection was taken afterwards. (B) FACS on the Stella:GFP line in ES state or PGC-LC state as indicated. Wt cells or Prdm14-null, Mtgr1-null or respective rescue lines were used. DAPI, 4',6-diamidino-2-phenylindole; GFP, green fluorescent protein; FACS, fluorescence-activated cell sorting; mPGC-LCs, mouse primordial germ cell-like cells; wt, wild type; Mtgr1, myeloid translocation gene related 1.
Figure 4 with 3 supplements

Generation of PRDM14-binding monobodies.
(A) Schematic of the monobody scaffold. The β strands and loops are labeled and the diversified residues are marked as red spheres. The amino acid sequences of the monobody library and monobody clones. In the library designs, ‘X’ denotes a mixture of 30% Tyr, 15% Ser, 10% Gly, 5% Phe, 5% Trp, and 2.5% each of all the other amino acids except for Cys; ‘O’, a mixture of Asn, Asp, His, Ile, Leu, Phe, Tyr, and Val; ‘U’, a mixture of His, Leu, Phe, and Tyr; ‘Z’, a mixture of Ala, Glu, Lys, and Thr (Koide et al. 2012). A hyphen indicates a deletion. (B) Titration curves of Mb(hPRDM14_S4) and Mb(hPRDM14_S14) to human PRDM14 and mouse Prdm14. The error bars are the standard deviation (n = 3). The curves show the best fit of the 1:1 binding model. (C) Binding of Mb(S4) and Mb(S14) expressed on yeast surface to 50 nM of hPRDM14 and its homologues, mouse Prdm14, human PRDM12 and human PRDM6. (D) Competitive binding assay for Mtgr1 and monobodies. Binding of 10 nM Mtgr1 to biotinylated Prdm14 immobilized on streptavidin coated M280 beads in the absence and presence of 500 nM purified monobodies, Mb(S4) and Mb(S14). (E) Co-immunoprecipitation of FLAG–HA tagged Prdm14 expressed in mESC using Mb(S4), Mb(S14), α-FLAG M2 antibody or a negative control antibody (‘IgG’). Antibodies used for Western blotting are indicated with the blots. E, elution; FT, flow through; Mtgr1, myeloid translocation gene related 1.
Figure 4—figure supplement 1
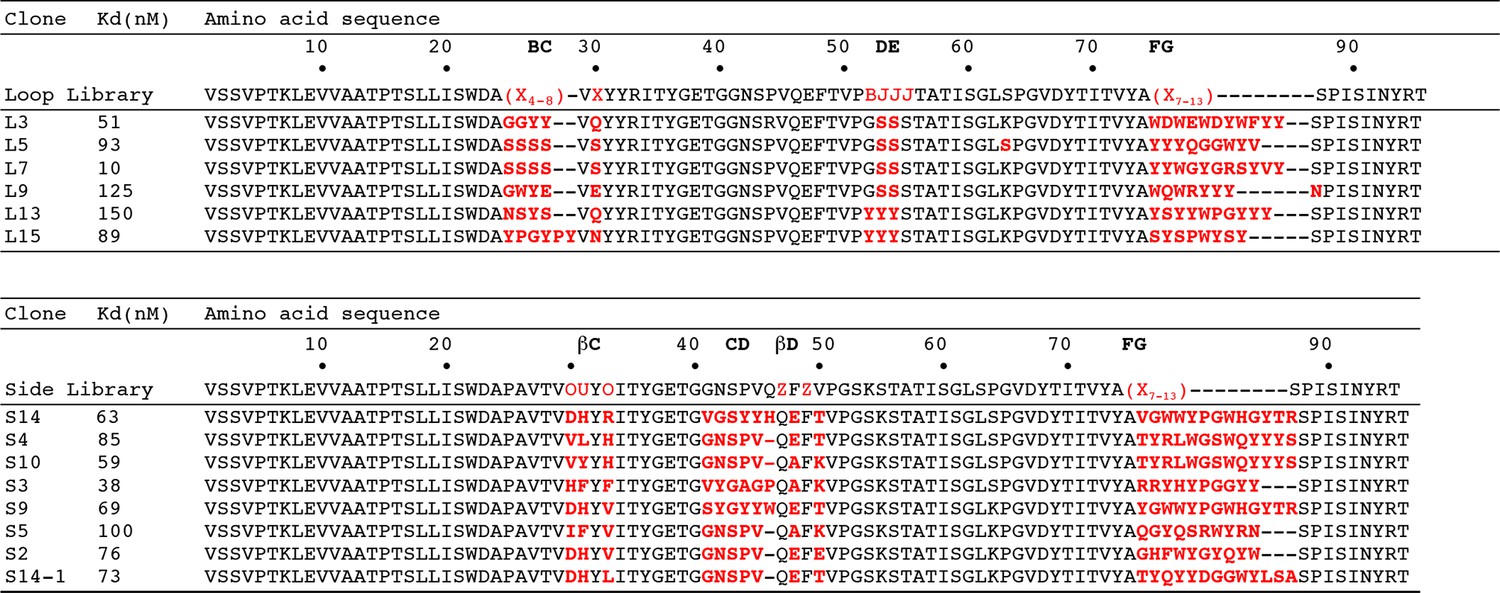
Sequences of monobodies selected against human PRDM14 and their KD values to hPRDM14 measured in yeast display format.
Two types of libraries were used, loop and side library. In the library designs, 'X' denotes a mixture of 30% Tyr, 15% Ser, 10% Gly, 5% Phe, 5% Trp, and 2.5% each of all the other amino acids except for Cys, 'B', a mixture of Gly, Ser and Tyr, 'J', a mixture of Ser and Tyr, 'O', a mixture of Asn, Asp, His, Ile, Leu, Phe, Tyr, and Val, 'U', a mixture of His, Leu, Phe and Tyr, 'Z', a mixture of Ala, Glu, Lys and Thr (Koide et al. 2012). A hypen indicates a deletion.
Figure 4—figure supplement 2
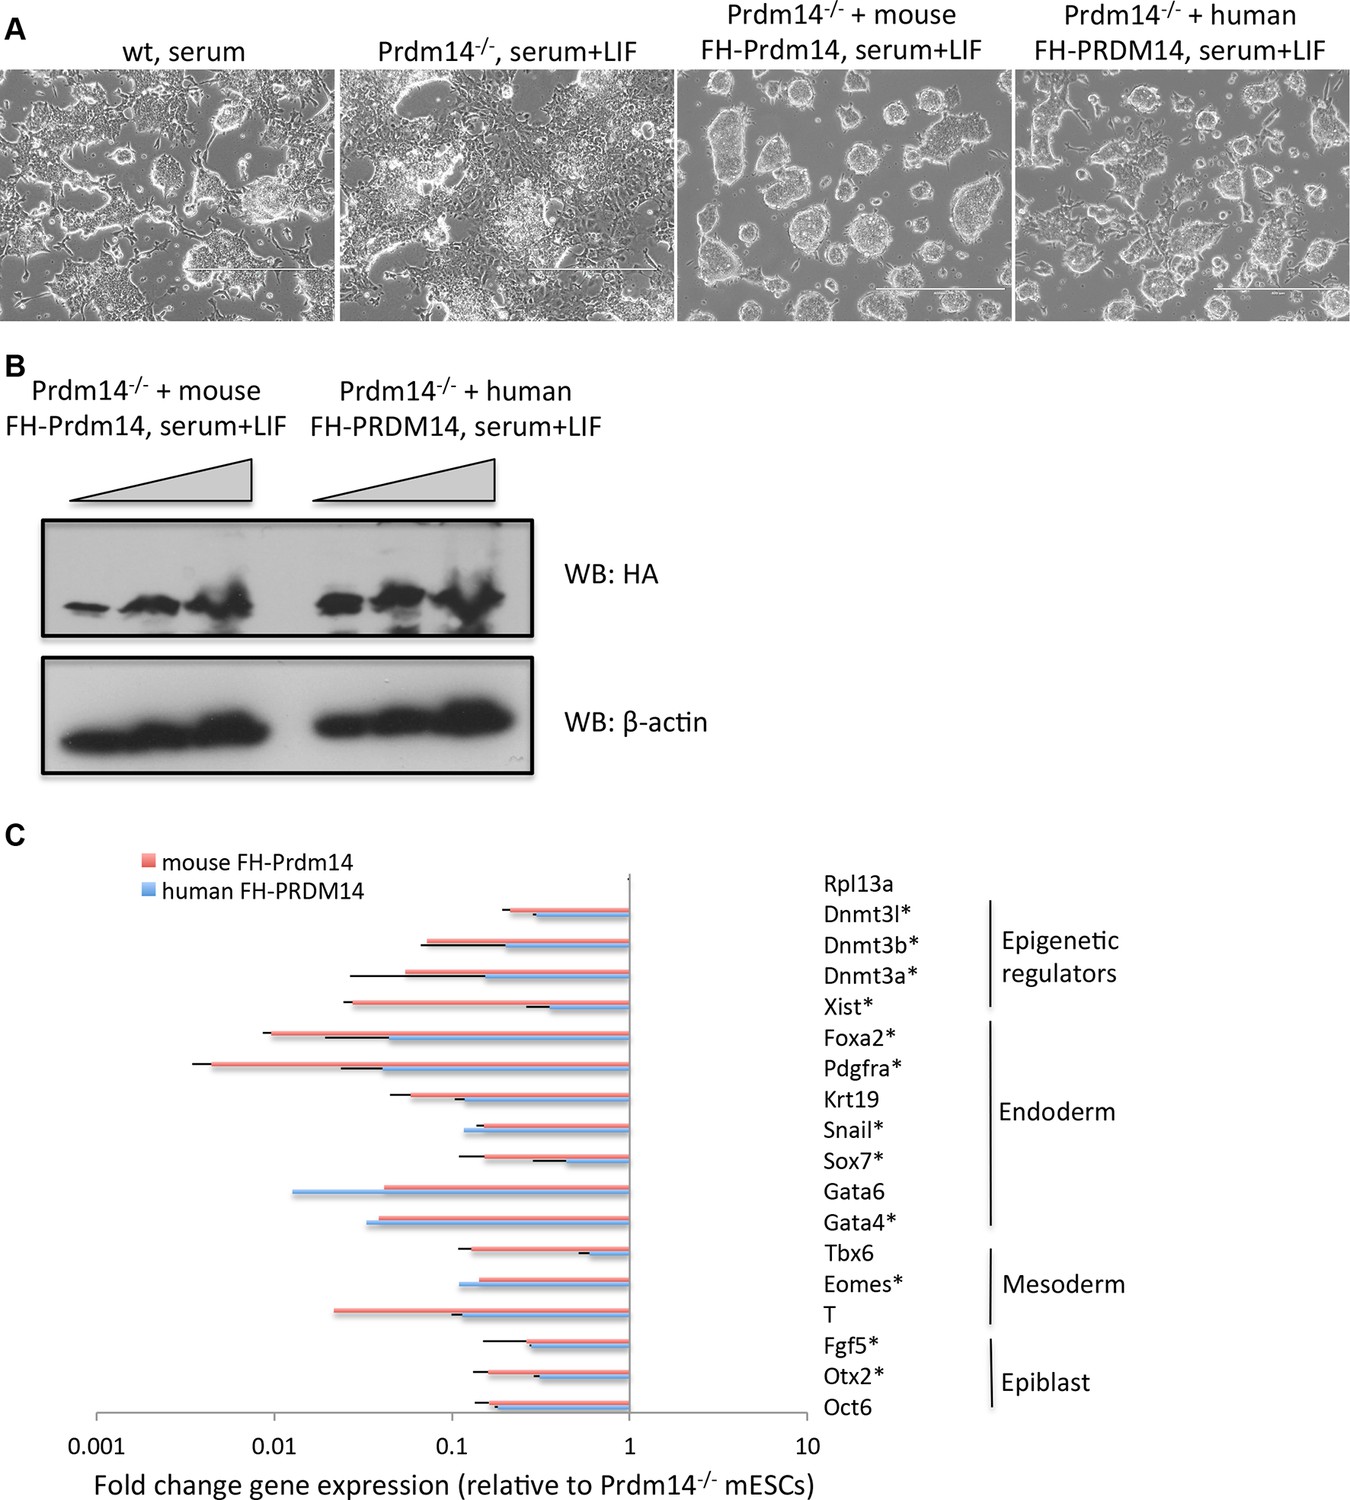
Human PRDM14 can substitute for the mouse Prdm14 in mESCs.
(A) Morphological changes in Prdm14−/− mESCs and those reconstituted with mouse or human FH-PRDM14 cDNA, respectively. Note that all lines were grown under serum+LIF conditions. (B) Western blot shows that both human and mouse Prdm14 proteins were expressed at similar levels in the reconstituted lines. (C) RT-qPCRs measuring changes in gene expression in lines reconstituted with human or mouse Prdm14 relative to the Prdm14−/− line. Genes marked with an asterisk denote direct mouse Prdm14 targets from ChIP-seq. ChIP-seq, chromatin immunoprecipitation with sequencing; LIF, leukemia inhibitory factor; RT-qPCRs, quantitative reverse transcription-polymerase chain reaction.
Figure 4—figure supplement 3
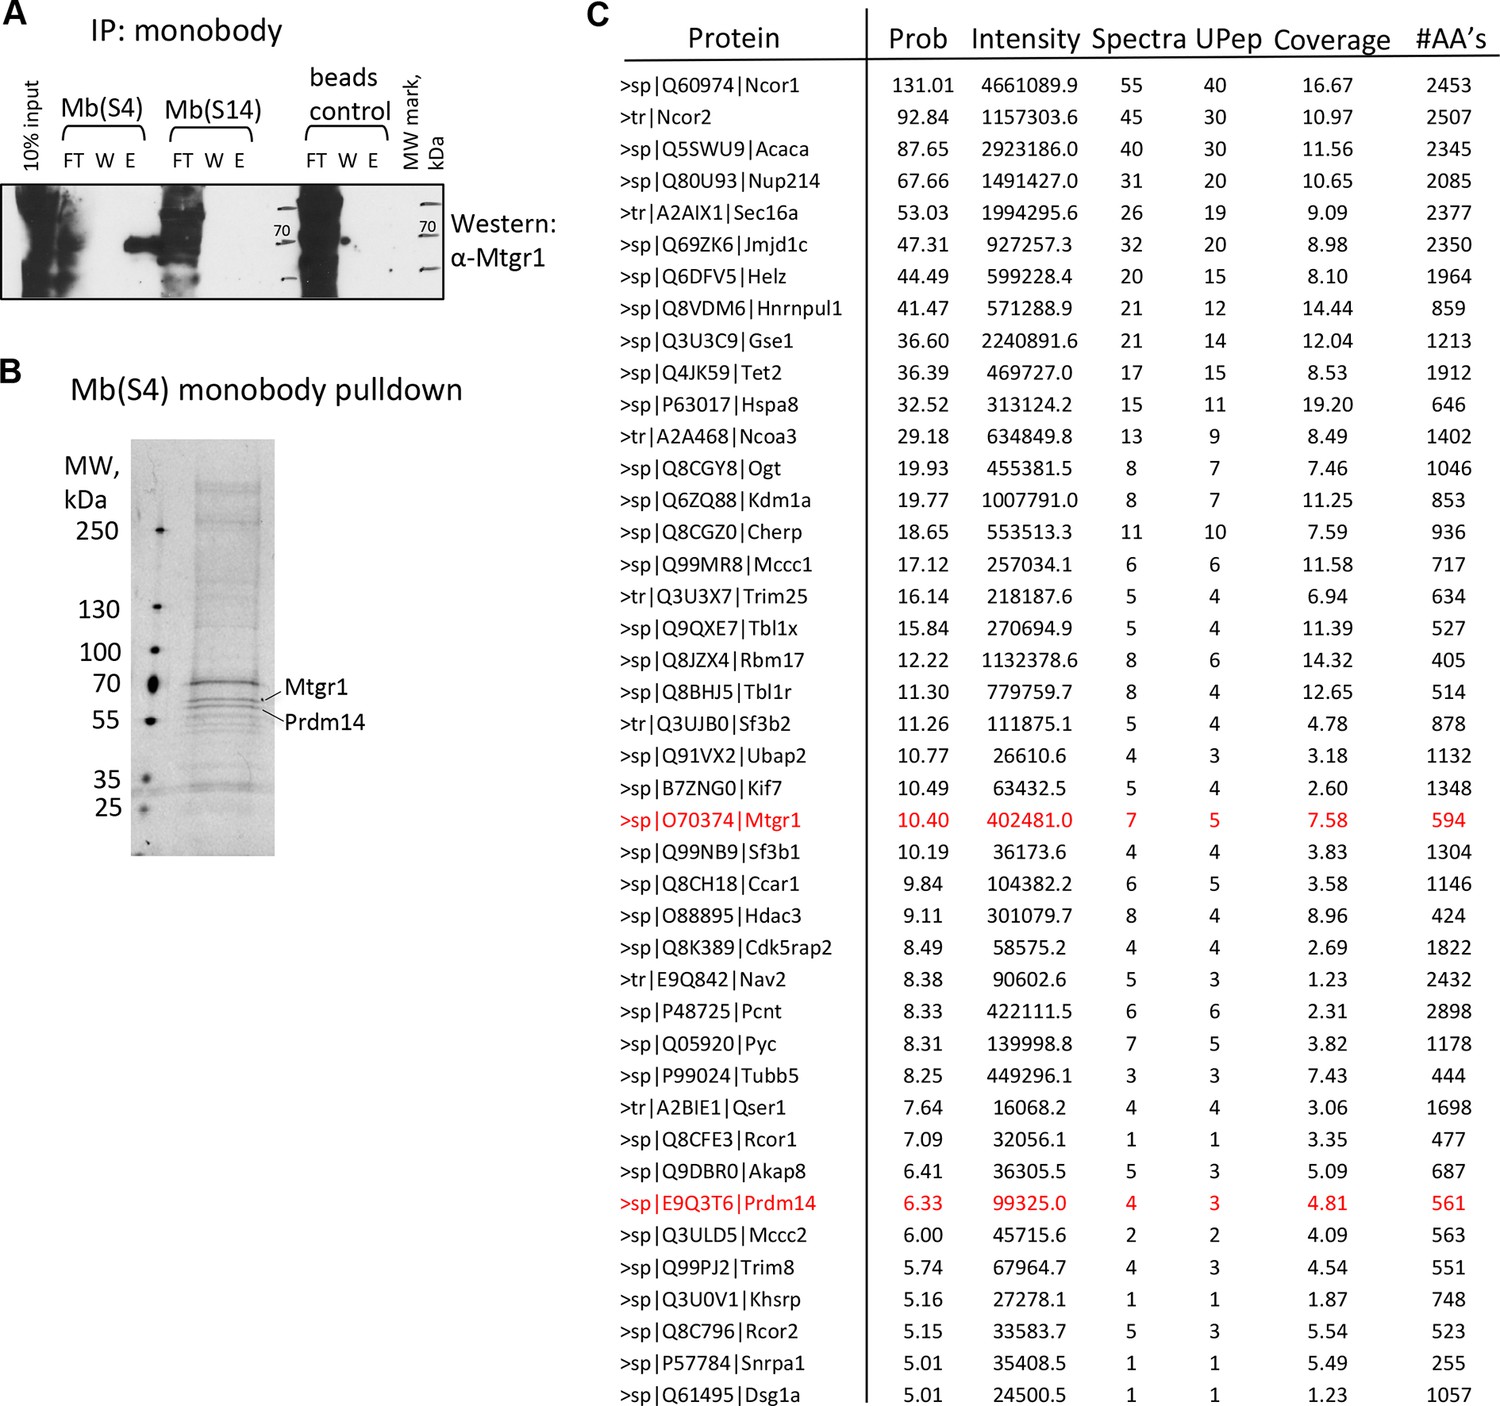
Monobody affinity pulldown of the endogenous Prdm14 protein.
(A) Co-precipitation of Mtgr1 with endogenous Prdm14 from wt mESC extracts via affinity pulldown with Mb(S4), Mb(S14) or, as a negative control, beads only followed by detection of Mtgr1 by Western blotting. (B) Silver staining of polypeptides recovered in the affinity pulldown with Mb(S4) from wt mESC extracts. (C) Mass spectrometry analysis of proteins recovered in the affinity pulldown with Mb(S4) from wt mESC extracts. Results of the top recovered and correctly matched proteins (prob >5.00; prob – log probability of the correct fit to the data) are shown. Also shown are total intensity, number of spectra and number of unique peptides recovered, percent coverage and number of amino acids in the recovered protein. E, elution; FT, flow through; mESC, mouse embryonic stem cell; Mtgr1, myeloid translocation gene related 1; W, wash; wt, wild type.
Figure 5 with 3 supplements
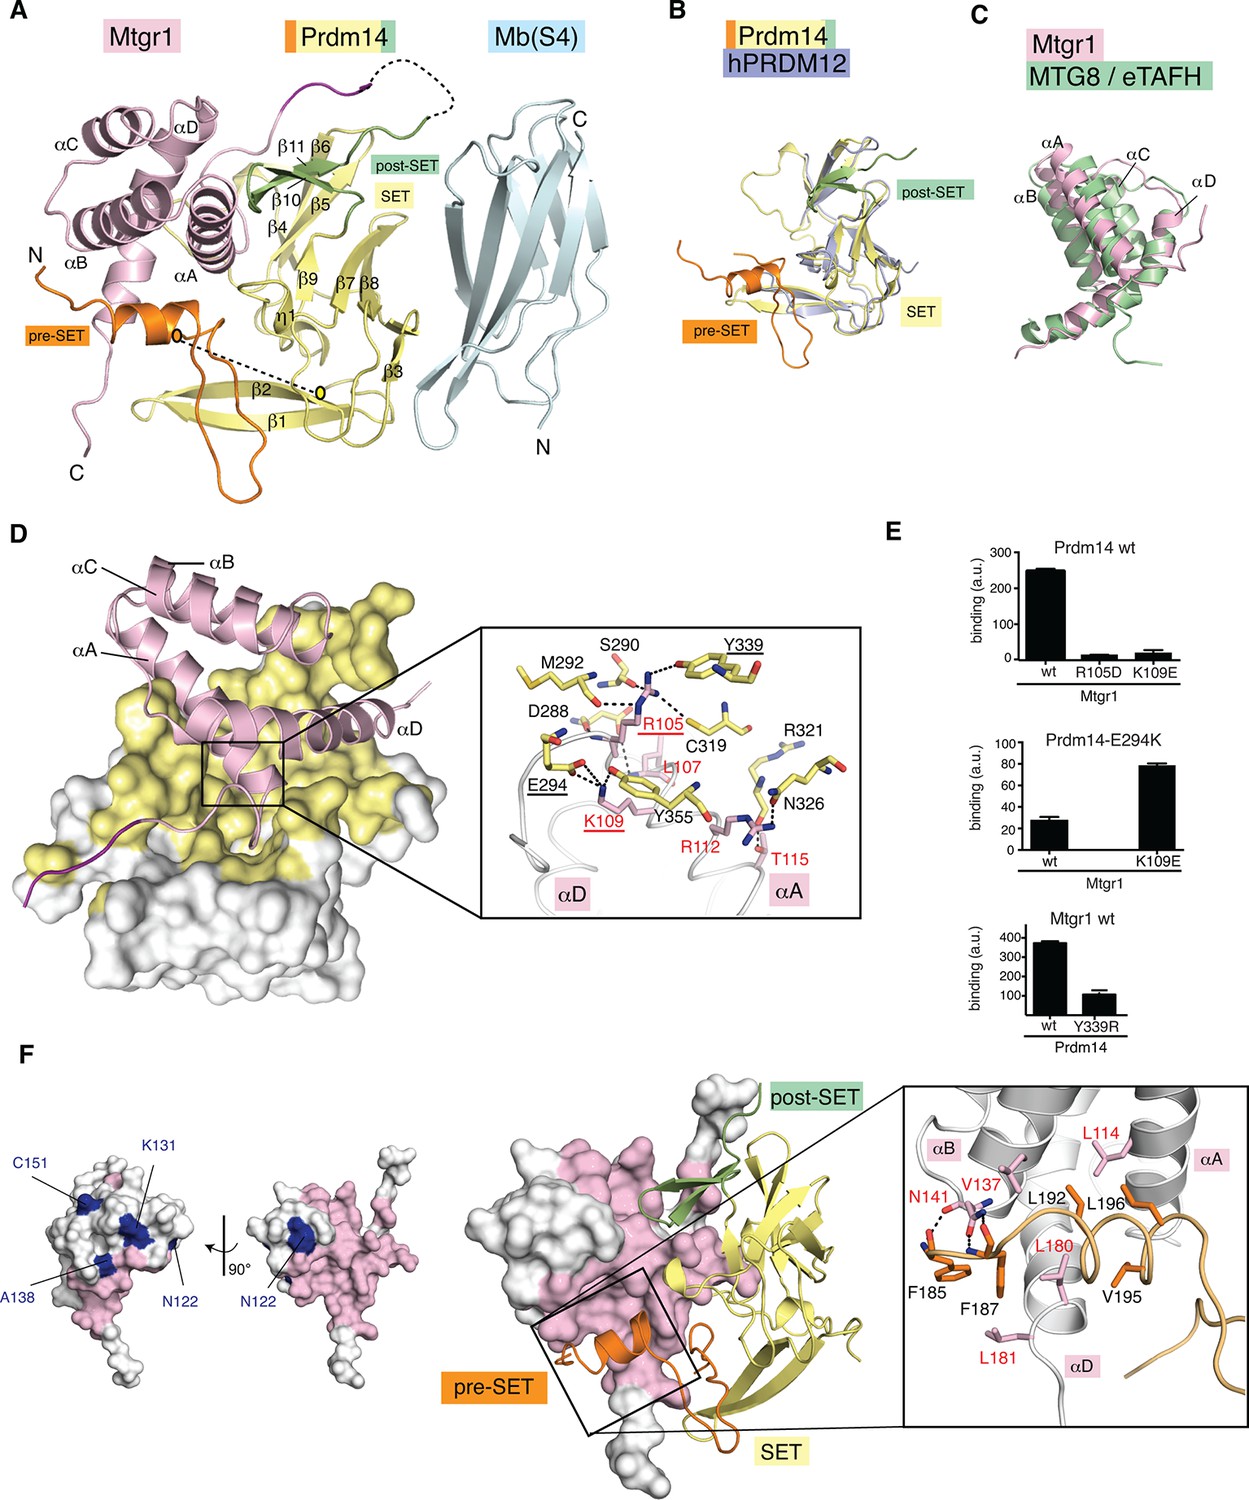
Crystal structure of the Prdm14–Mtgr1 complex.
(A) The overall structure of the Prdm14-linker–Mtgr1/Mb(S4) complex. Missing residues are shown with dotted lines. The pre-SET region (in orange), SET domain (in yellow) and post-SET region (in green) of Prdm14 are shown. The Mtgr1 helices are marked for clarity (αA–αD). (B) Superposition of the Prdm14 crystal structure with the crystal structure of hPRDM12 (PDB ID 3EP0). (C) Superposition of the Mtgr1 crystal structure with the NMR structure of the MTG8 NHR1 (eTAFH) domain (PDB ID 2KNH). (D) Prdm14–Mtgr1 interface. Prdm14 is shown in white surface representation with the interacting residues in yellow (Top). Mtgr1 is shown in cartoon representation in pink color. In the detailed view, Prdm14 residues are marked in red and Mtgr1 residues are marked in black. Salt bridges and hydrogen bonds between Prdm14 and Mtgr1 are shown in dotted lines. Residues that were mutated based on the structure are underlined. (E) Binding of wt, E294K and Y339R Prdm14 (residues 184–373) to immobilized wt Mtgr1 (top) and Mtgr1(K109E) (bottom) in a bead-based assay. (F) Mtgr1 is shown in white surface representation with interacting residues in pink (left). Non-identical residues between Mtgr1 and the other ETO proteins are shown in blue (left). The detailed view shows the interaction of Prdm14 residues N-terminal to the SET domain (pre-SET) with Mtgr1 (right). Prdm14 residues are labeled in red and Mtgr1 residues in black. Mtgr1, myeloid translocation gene related 1; NMR, nuclear magnetic resonance.
Figure 5—figure supplement 1
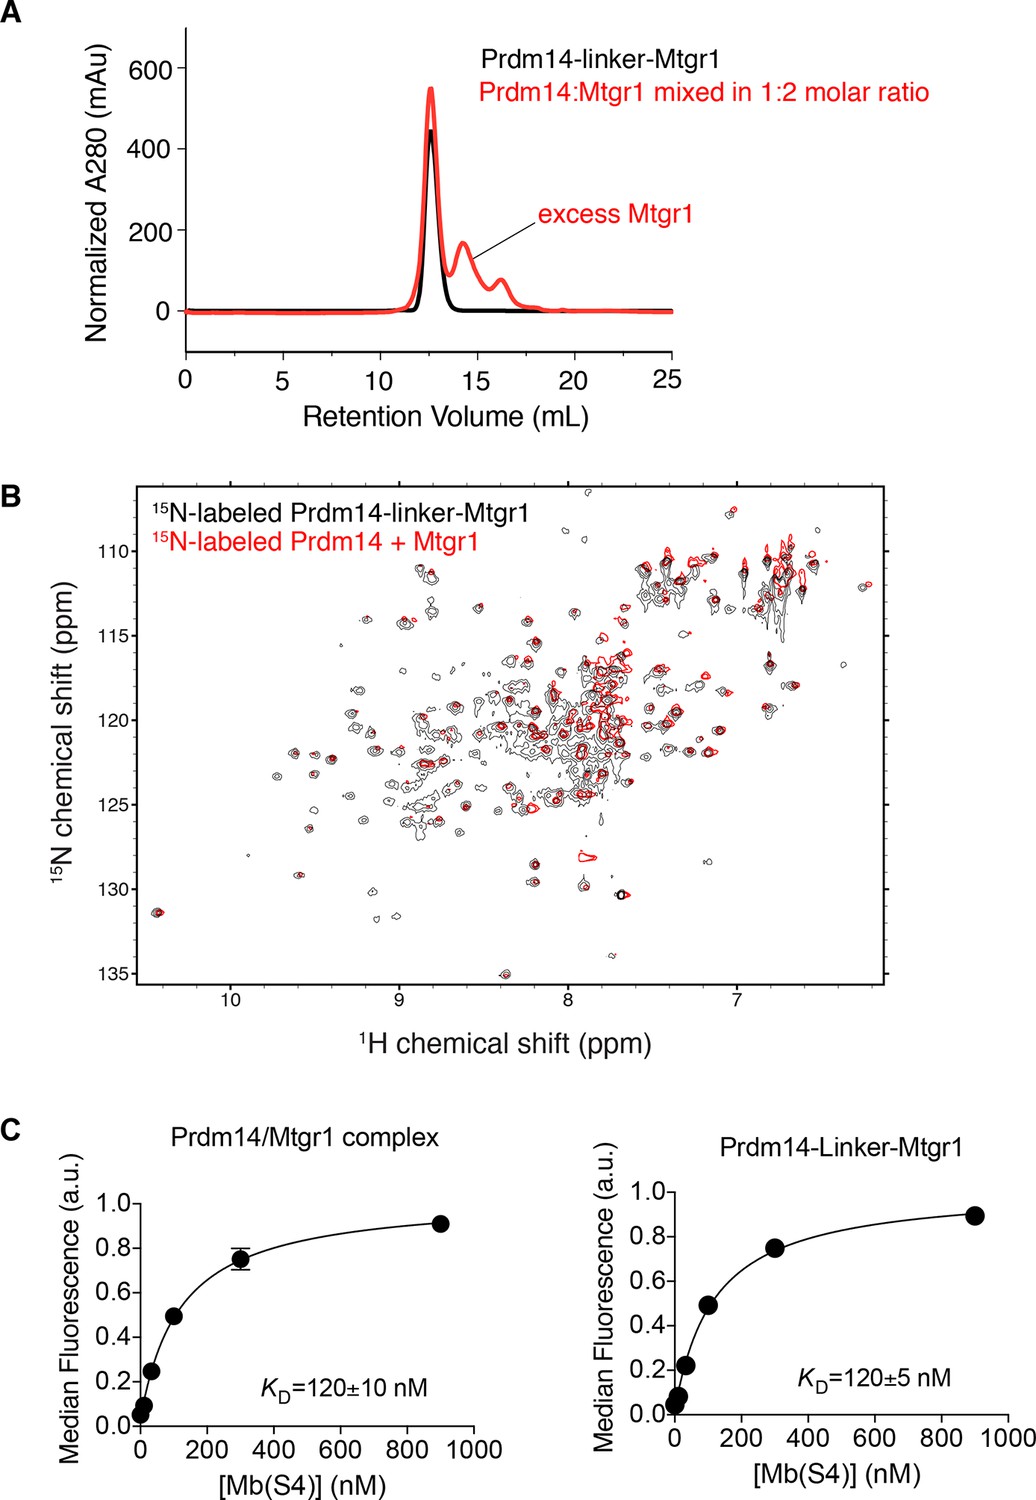
Inclusion of a linker does not affect the Prdm14–Mtgr1 interaction.
(A) Elution profiles of Prdm14-linker–Mtgr1 (in black) and Prdm14 mixed with Mtgr1 in a 1:2 molar ratio (in red) from a Superdex75 size-exclusion column. (B) Overlay of the 15N-1H HSQC spectrum of 15N-Prdm14-linker-Mtgr1 complex (black) with that of 15N-labeled Prdm14 in complex with unlabeled Mtgr1 (red). (C) Titration curves for binding of Prdm14/Mtgr1 complex and Prdm14-linker-Mtgr1 to Mb(S4). The error bars shown on each data points are the standard deviation from triplicate measurements. The curves show the best fit of the 1:1 binding model. The errors for the KD values are the standard deviations from triplicate measurements. Mtgr1, myeloid translocation gene related 1.
Figure 5—figure supplement 2

Structural features of the Prdm14-linker–Mtgr1/Mb (S4) complex.
(A) Crystals of the Prdm14-linker–Mtgr1/Mb(S4) complex obtained in 16% PEG3350, 8% Tascimate pH 5.3. (B) The Prdm14-monobody interface. Prdm14 is shown in white surface representation with the interface residues on Prdm14 shown in yellow and are labeled in black. Mb(S4) is shown in cartoon representation in cyan and are labeled in red. The upper box illustrates prominent features in the interface involving residues in the FG loop of the monobody. Trp81 of Mb(S4) is in the pocket formed by Pro250, Phe270, Val268, Asp262 and Ala265 of Prdm14. Gln75, Tyr77 and Trp81 of Mb(S4) form hydrogen bonds with Prdm14 Arg269, Asp262 and Glu251, respectively. Hydrogen bonds and salt bridges are shown in black dotted lines. The bottom box shows a salt bridge formed between Prdm14 Glu340 and Lys47 in the β-strand C of Mb(S4). (C) Unbiased feature-enhanced map showing electron density at the 1 sigma level for residues involved in Prdm14–Mtgr1 interaction. (D) Crystal contacts between monobodies and Prdm14 from neighboring molecules. The symmetry related molecules are shown with Prdm14-linker–Mtgr1 in yellow and monobody in cyan. (E) Binding of Mb(S4) and its point mutant, Trp81 to Ala, to biotinylated Prdm14 immobilized on streptavidin M280 beads, as measured using the bead-based binding assay. Mutation of Trp81 results in substantial loss of Prdm14 binding, confirming the interface between Prdm14 and Mb(S4) shown in panel B. Mtgr1, myeloid translocation gene related 1.
Figure 5—figure supplement 3

Comparison of the structure of the Prdm14–linker-Mtgr1 complex with that of the Prdm9- histone H3 peptide-S-adenosyl-L-homocysteine (AdoHcy) complex.
(A) Left, the crystal structure of the Prdm9 complex (PDB ID 4C1Q). Prdm9 is shown in cartoon representation in gray and the histone peptide is shown in sticks in blue. AdoHcy is shown in green sticks. Right, cartoon representation of Prdm14 in gray with Mtgr1 shown in pink ribbon representation. The residues in pre-SET region of Prdm14 that occupy the region equivalent to the AdoHcy binding site in Prdm9 are shown in orange. (B) Left, surface representation of Prdm9 in which the surfaces for the atoms within 4.5 Å from the peptide are marked in blue. Right, Mtgr1-interacting residues of Prdm14 are shown in pink. (C). Left, residues in the Prdm9 catalytic site (labeled in black) and the Lys4me2 of the histone peptide (labeled in red), shown in sticks. Tyr357 is directly involved in the catalytic activity of Prdm9. Right, the same region of Prdm14. Phe273 and Tyr339 in Prdm14 are respectively equivalent to Tyr276 and Tyr341 in Prdm9. Lys109 of Mtgr1 present in proximity to the Prdm14-Tyr355 (equivalent to Tyr357 in Prdm9) is shown. Also shown are Pro366 and Glu294 that have atoms within 4.5 Å of Mtgr1-Lys109. Prdm14 residues are labeled in black. K109 of Mtgr1 is labeled in red. Mtgr1, myeloid translocation gene related 1.
Figure 6 with 2 supplements
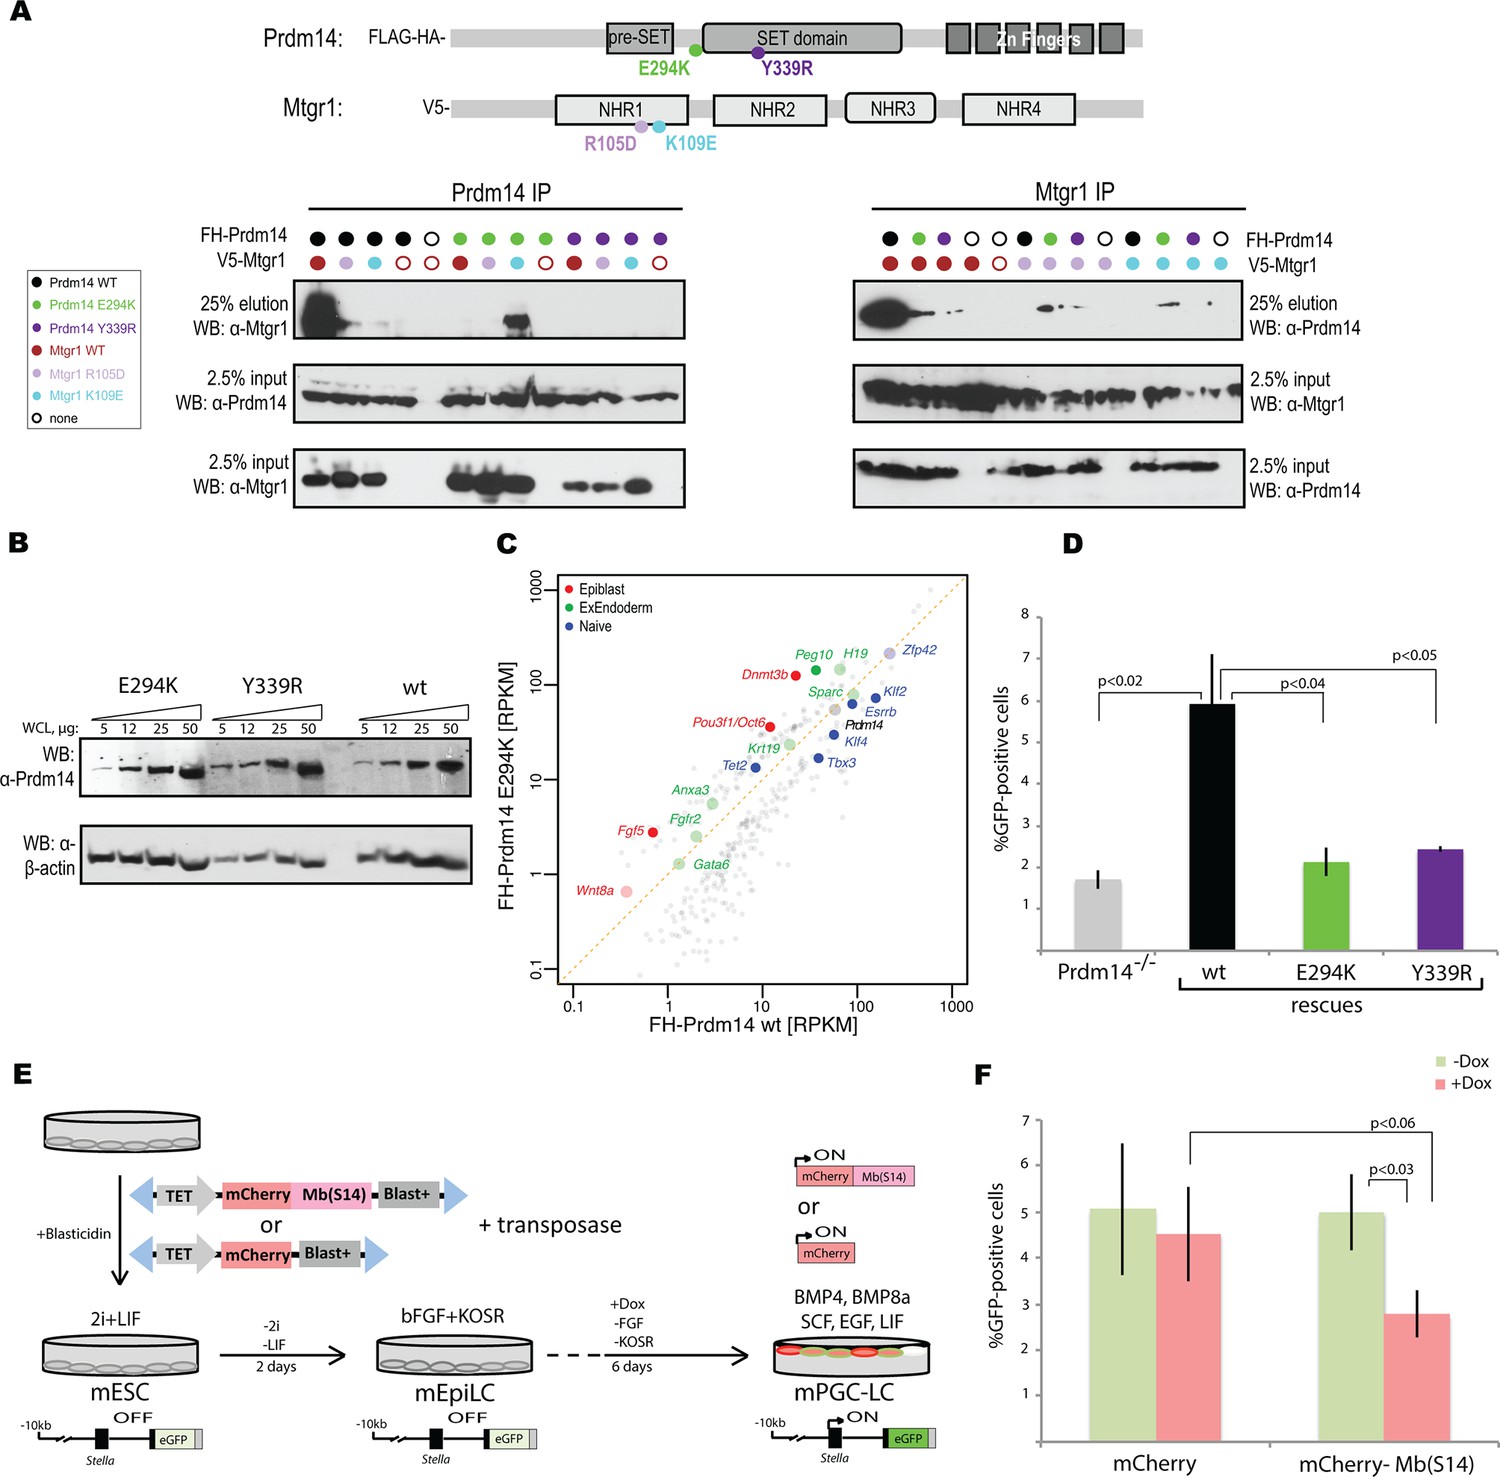
Inhibition of Prdm14–Mtgr1 interaction affects stem cell maintenance and PGC-LC induction.
(A) Single amino-acid substitutions at the interaction surface abrogate Prdm14–Mtgr1 association in cells. Indicated full length V5-Mtgr1 wt or single point mutant proteins were introduced to HEK293 cells and co-immunoprecipitated with full length FH-Prdm14 wt or single mutant protein as indicated in the diagram. Please note rescue of the association when the combination of Mtgr1 K109E and Prdm14 E294K mutants is tested. (B) Western blot showing protein expression levels of wt, E294K and Y339R FH-Prdm14 protein in lysates from Prdm14−/− mESCs cells reconstituted with the respective transgenes. (C) RNA-seq from Prdm14−/− cells reconstituted with wt Prdm14 protein (x axis) were compared to Prdm14−/− cells reconstituted with E294K Prdm14 mutant (y axis) and expression values (RPKM) of all significantly changed transcripts were plotted. The transcripts of specific genes are highlighted in red, green, blue or black as indicated; shaded colors indicate no significant difference. (D) Quantification of GFP signal as a measure of mPGC-LC induction from Prdm14−/− cells and Prdm14−/− cells reconstituted with transgenes encoding wt, E294K, or Y339R Prdm14 protein. (E) Schematics of the piggyBac transposon-based reporter system used to create dual reporter lines. mESC line was transfected with either dox-inducible mCherry construct or dox-inducible mCherry-Mb(S14) fusion protein. The lines were selected using blasticidin and three populations were tested further for their competency to form mPGC-LCs. mESC to mEpiLC transition followed by mPGC-LC transition using defined media in cells containing Stella:GFP reporter (lower panel). Doxycycline was added after mEpiLC stage. (F) Quantification of GFP signal as a measure of mPGC-LC induction from mCherry population of cells and mCherry-Mb(S14) population of cells with and without addition of doxycycline. mEpiLCs, mouse epiblast-like cells; mESCs, mouse embryonic stem cell; mPGC-LCs, mouse primordial germ cell-like cells; GFP, green fluorescent protein; Mtgr1, myeloid translocation gene related 1; RNA-seq, RNA sequencing; RPKM, reads per kilobase of exon per million reads mapped; WCL, whole cell lysates; wt, wild type.
Figure 6—figure supplement 1

Gene expression analyses of Prdm14−/− cells reconstituted with wt or E294K Prdm14.
(A) PCA of RNA-seq expression comparisons of the top 898 genes with the highest median average deviation in indicated ESC lines. (B) Heatmap displaying top 50 variable genes between Mtgr1−/−(three clones), Prdm14−/− (2 clones) mESCs or Prdm14−/− clones reconstituted with wt or mutant (E294K) Prdm14 protein. ESC, embryonic stem cell; PCA, principal component analysis; mESCs, mouse embryonic stem cell; Mtgr1, myeloid translocation gene related 1; RNA-seq, RNA sequencing.
Figure 6—figure supplement 2
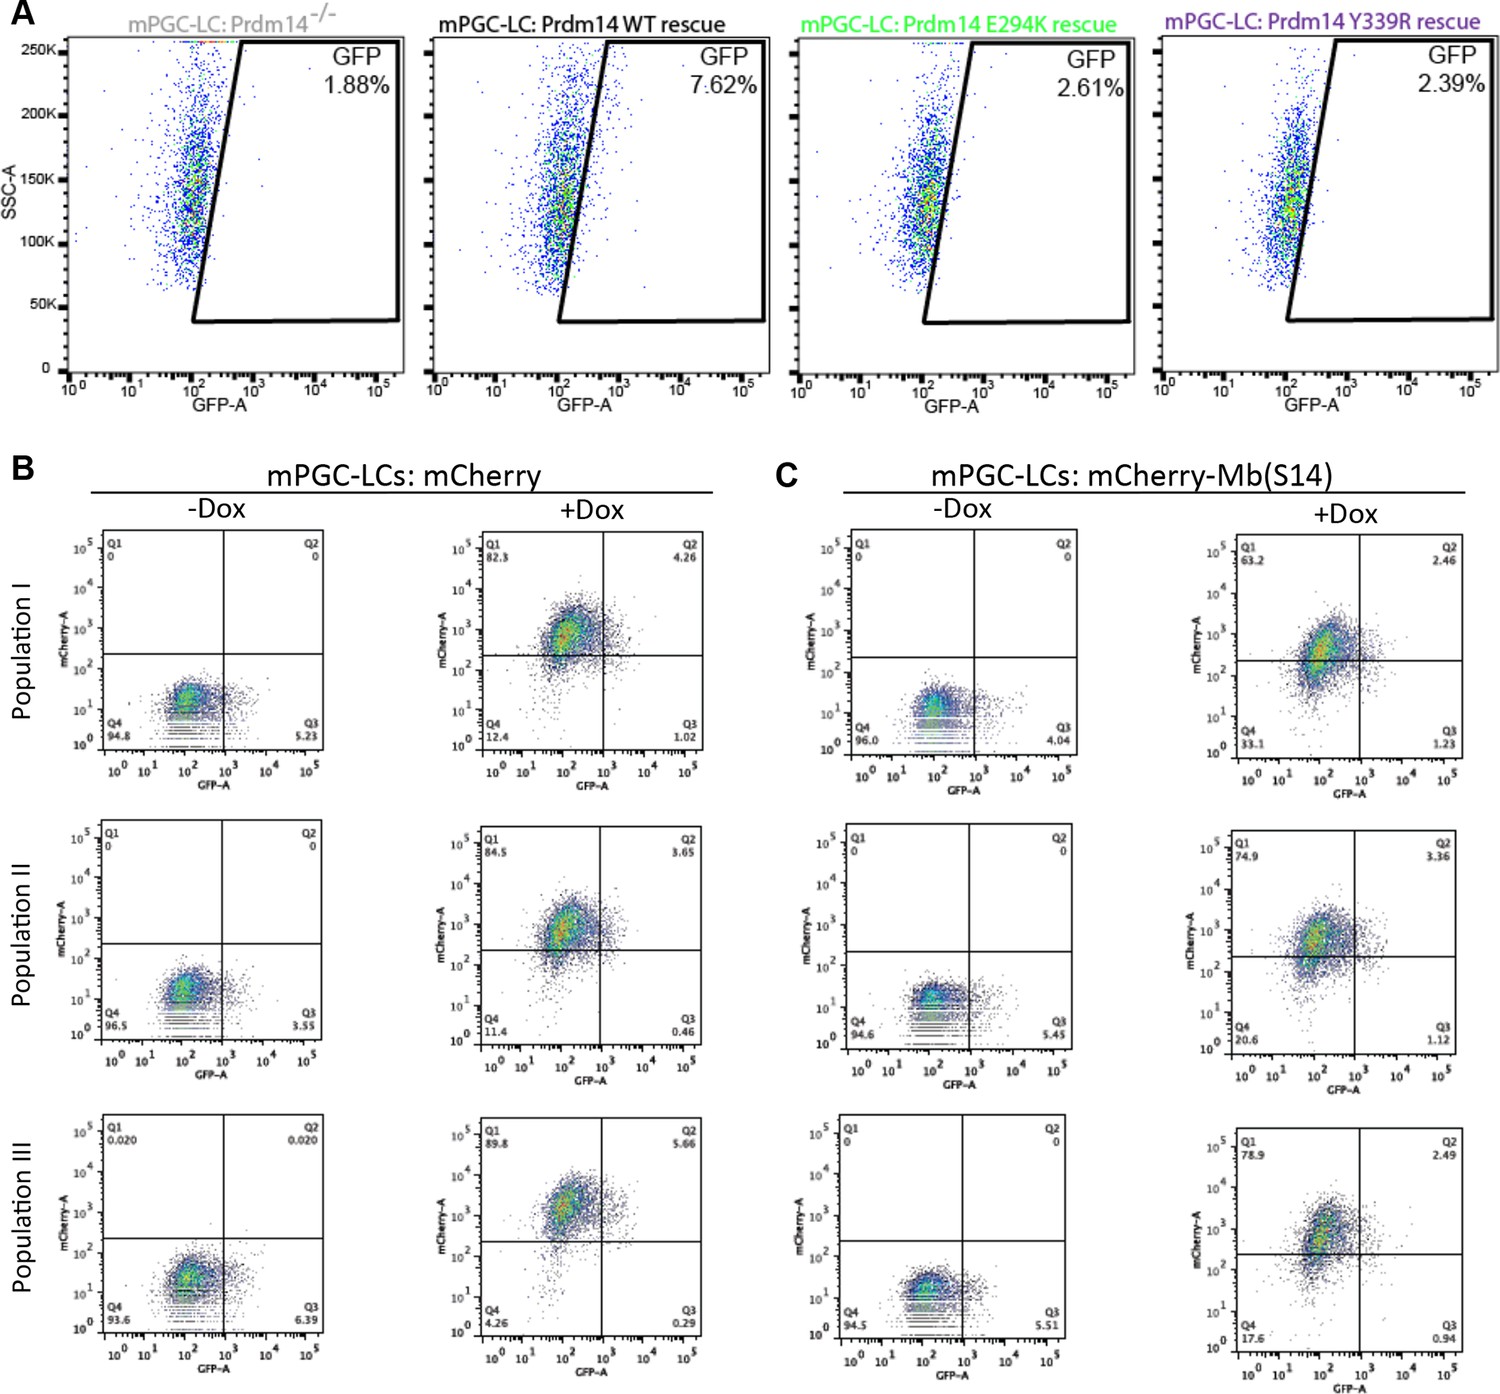
Inhibition of Prdm14–Mtgr1 interaction affects germ cell development.
(A) FACS plots of the gated quantification of GFP signal shown in Figure 6D as a measure of mPGC-LC induction from wt cells, Prdm14−/− cells or Prdm14−/− clones reconstituted with wt or mutant (E294K, Y339R) Prdm14. (B) FACS plots of the gated quantification of GFP signal shown in Figure 6F as a measure of mPGC-LC induction from three independent populations of mCherry cells or mCherry-Mb(S14) cells with and without addition of doxycycline. FACS, fluorescence-activated cell sorting; GFP, green fluorescent protein; wt, wild type.
Tables
Table 1
Data collection, phasing and refinement statistics for Prdm14-linker-Mtgr1/Mb(S4) complex crystals.
| Native | SeMet SAD | |
|---|---|---|
| Data collection | ||
| Beamline | APS 19ID | APS 19ID |
| Space group | P43212 | P43212 |
| Cell dimensions | ||
| a, b, c (Å) | 106.8,106.8,180.7 | 106.9, 106.9,180.9 |
| a, b, g (°) | 90,90,90 | 90,90,90 |
| Peak | ||
| Wavelength | 0.97918 Å | 0.97918 Å |
| Resolution (Å) | 37.7–3.05 (3.16–3.05) | 50–3.18 (3.23–3.18) |
| Rpim | 0.024 (0.482) | 0.022 (0.315) |
| I / σI | 30.0 (1.4) | 52.4 (2.0) |
| Completeness (%) | 100 (100) | 100 (100) |
| Redundancy | 20.5 (19.5) | 86.2 (45.2) |
| Refinement | ||
| Resolution (Å) | 37.7–3.05 (3.16–3.05) | |
| No. of unique reflections | 20631 (2013) | |
| Rwork / Rfree | 0.189/0.250 | |
| No. atoms | 5476 | |
Protein | 5476 | |
Ligand/ion | 0 | |
Water | 0 | |
| B-factors | 114.3 | |
Protein | 114.3 | |
Ligand/ion | 0 | |
Water | 0 | |
| R.m.s deviations | ||
| Bond lengths (Å) | 0.006 | |
| Bond angles (°) | 1.13 | |
| Ramachandran statistics | ||
Favorable | 95.8 | |
Allowed | 4.1 | |
Outliers | 0.1 |
Download links
A two-part list of links to download the article, or parts of the article, in various formats.
Downloads (link to download the article as PDF)
Open citations (links to open the citations from this article in various online reference manager services)
Cite this article (links to download the citations from this article in formats compatible with various reference manager tools)
ETO family protein Mtgr1 mediates Prdm14 functions in stem cell maintenance and primordial germ cell formation
eLife 4:e10150.
https://doi.org/10.7554/eLife.10150


