Cell-cycle quiescence maintains Caenorhabditis elegans germline stem cells independent of GLP-1/Notch
- University of Wisconsin-Madison, United States
- The Lawrence Ellison Foundation, United States
- Howard Hughes Medical Institute, University of Wisconsin-Madison, United States
Figures
Figure 1
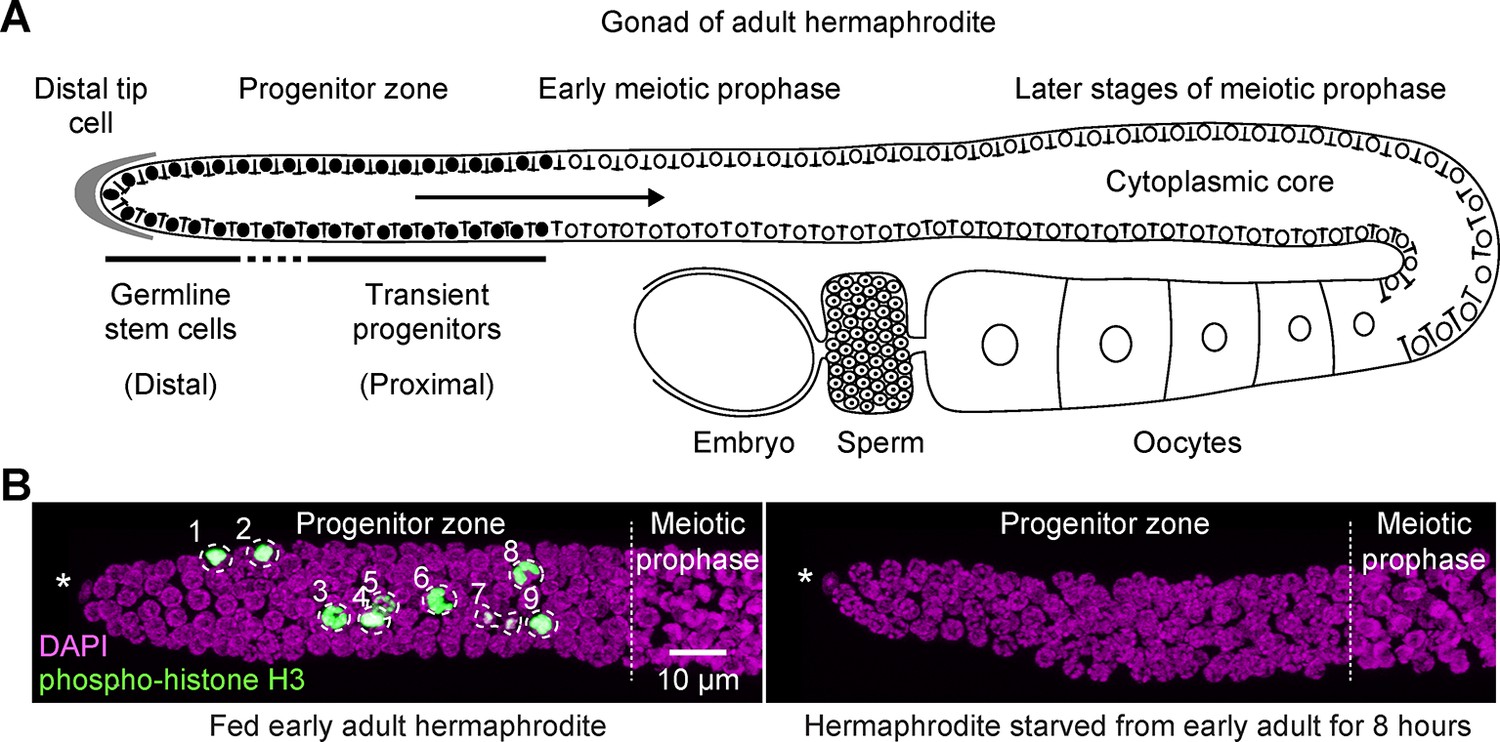
Fed versus starved adult hermaphrodite gonad of Caenorhabditis elegans.
(A) Schematic of an adult hermaphrodite gonadal arm, with the progenitor zone at its distal end and maturing gametes at its proximal end. Germline stem cells and transient progenitors are located in the distal and proximal progenitor zone, respectively. Cells in both pools cycle asynchronously, although they are partially connected via a cytoplasmic core. Filled circles, germ cell nuclei in the progenitor zone. Open circles, germ cell nuclei in meiotic prophase, including developing oocytes. Gonads in males and larval hermaphrodites are organized similarly, although their proximal germ cells differentiate as sperm. This same gonad organization is also seen in starved animals of any stage or sex for time intervals examined in this work. (B) Images of distal gonads dissected from adult hermaphrodites and stained with DAPI to visualize DNA (magenta) and anti-phospho-histone H3 to visualize M-phase chromosomes (green). M-phase cells are outlined and numbered. Left, fed early adult hermaphrodite. Right, hermaphrodite starved from early adult for 8 hr. (See Materials and methods for definition of ‘early adult’.) Asterisks, distal gonad ends. Images are maximum-intensity z-projections.
Figure 2 with 1 supplement
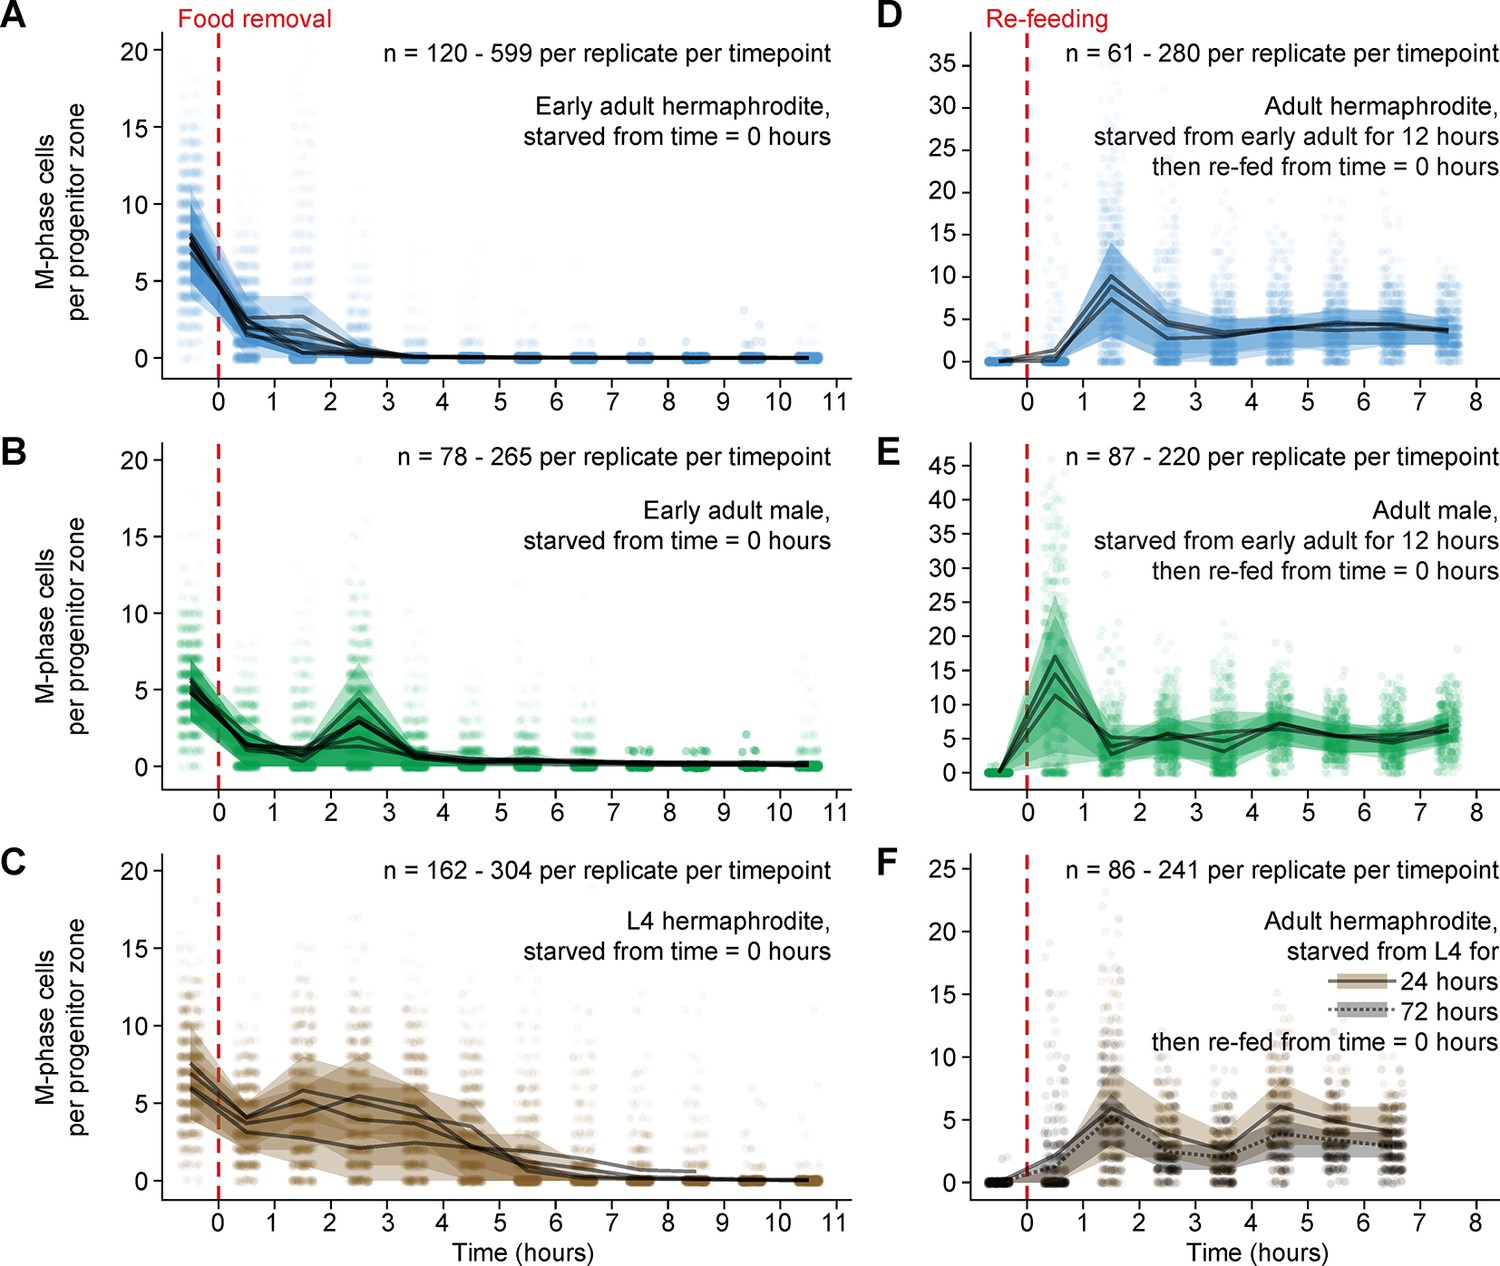
Mitotic divisions in adult progenitor zones respond quickly to food removal and re-feeding.
Time courses showing the number M-phase cells per progenitor zone after food removal or re-feeding. Time zero indicates the start of food removal or re-feeding. Animals in A, B and D, E were starved from early adult. Animals in C were starved from mid L4. Animals in F were starved from mid L4 for 24 hr or from early L4 for 72 hr. Independent replicates are overplotted with transparency. For each replicate, lines connect means, and shaded areas show interquartile ranges. Sample sizes indicate numbers of gonadal arms. Source data are available in Figure 2—source data 1.
-
Figure 2—source data 1
Counts of M-phase cells for starvation and re-feeding time courses of wildtype animals.
This comma-separated value file contains counts of M-phase cells per gonadal arm for starvation, re-feeding, and control time courses of wildtype animals (Figure 2 and Figure 2—figure supplement 1). Each row of the file represents a single gonadal arm. Descriptors include treatment group (starvation, re-feeding, mock starvation, continued feeding), animal sex (hermaphrodite, male), age at the start of treatment (L4, early adult, L4 + 24 hr), replicate, and time.
- https://doi.org/10.7554/eLife.10832.005
Figure 2—figure supplement 1
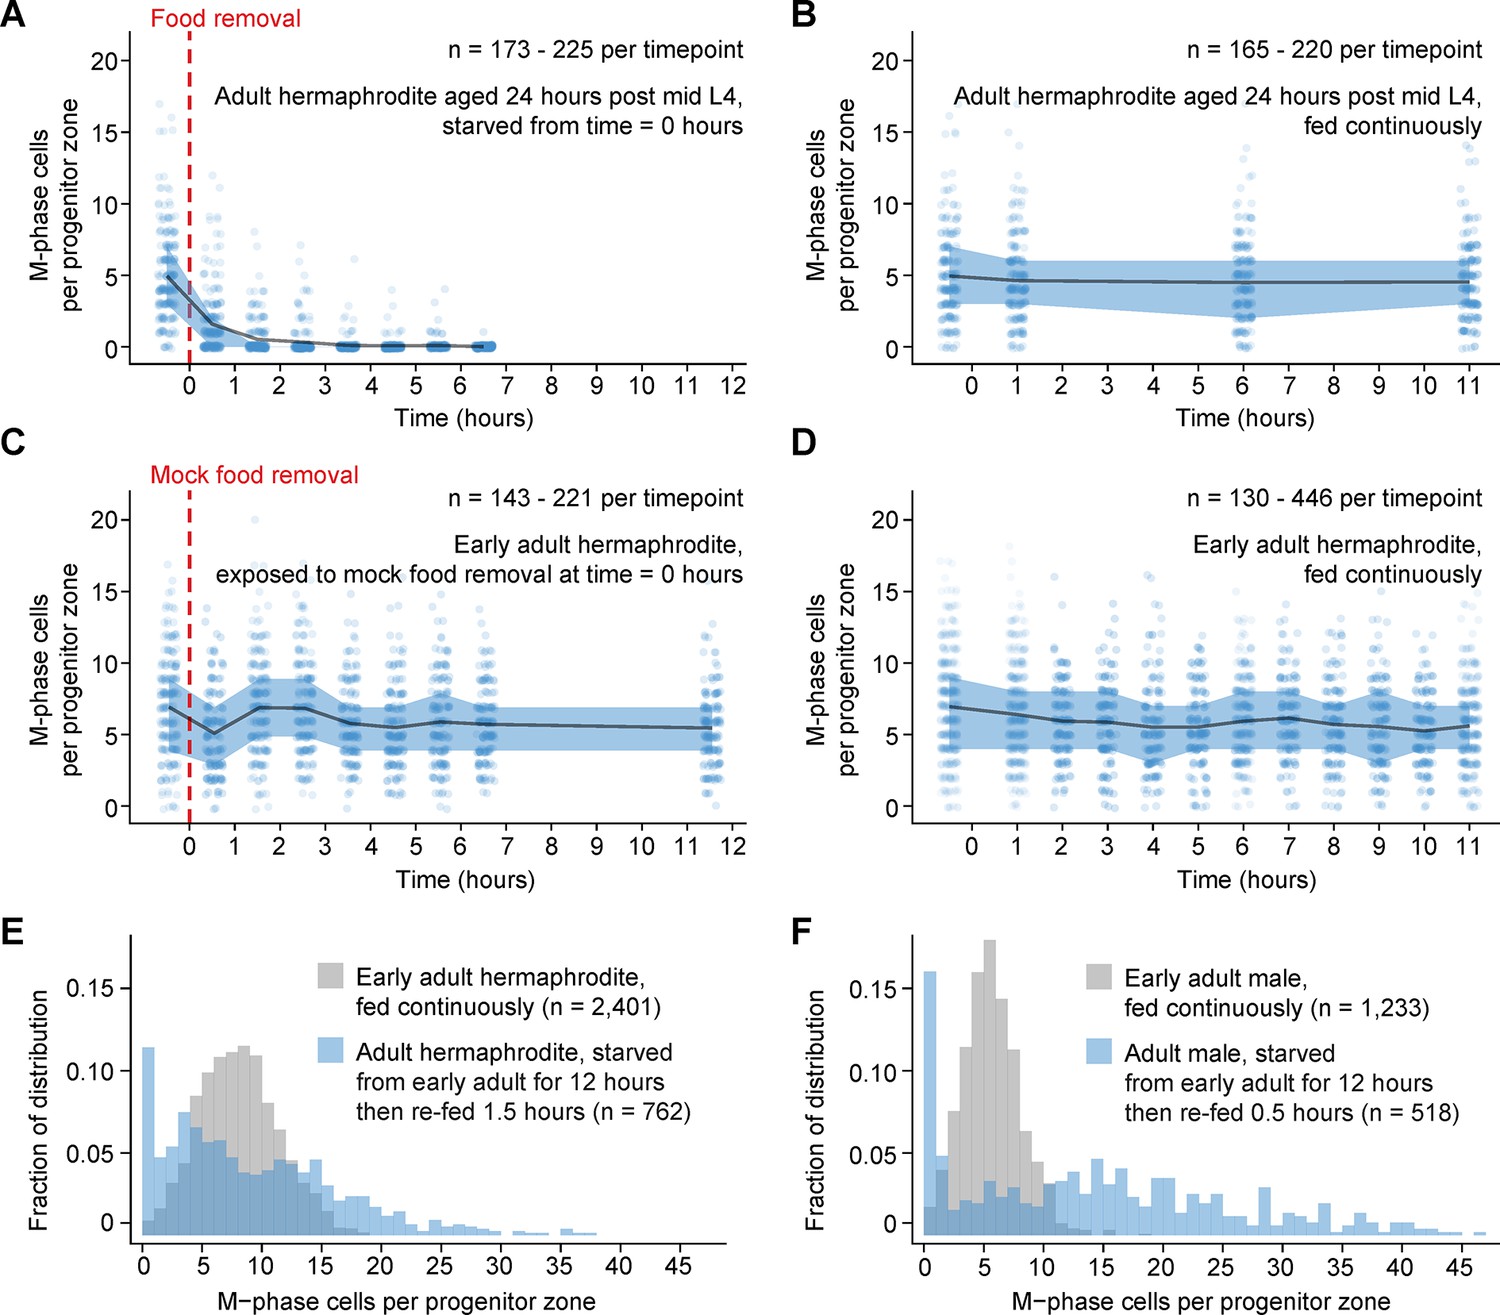
Comparison of numbers of M-phase cells in fed, starved, and re-fed animals.
(A–D) Time courses showing the number M-phase cells per progenitor zone in adult hermaphrodites exposed to food removal, mock food removal, or continuous feeding. For food removal or mock food removal, time zero indicates start of food removal or mock food removal. For continuous feeding, time zero indicates the time at which animals reached the early adult stage or the ‘24-hr post mid L4’ stage. (E, F) Normalized histograms showing the number of M-phase cells per progenitor zone for fed or re-fed adults. Data for fed animals are reproduced from the ‘before food removal’ time points of Figure 2A, C. Data for re-fed animals are reproduced from Figure 2B, D. Source data are available in Figure 2—source data 1.
Figure 3 with 2 supplements
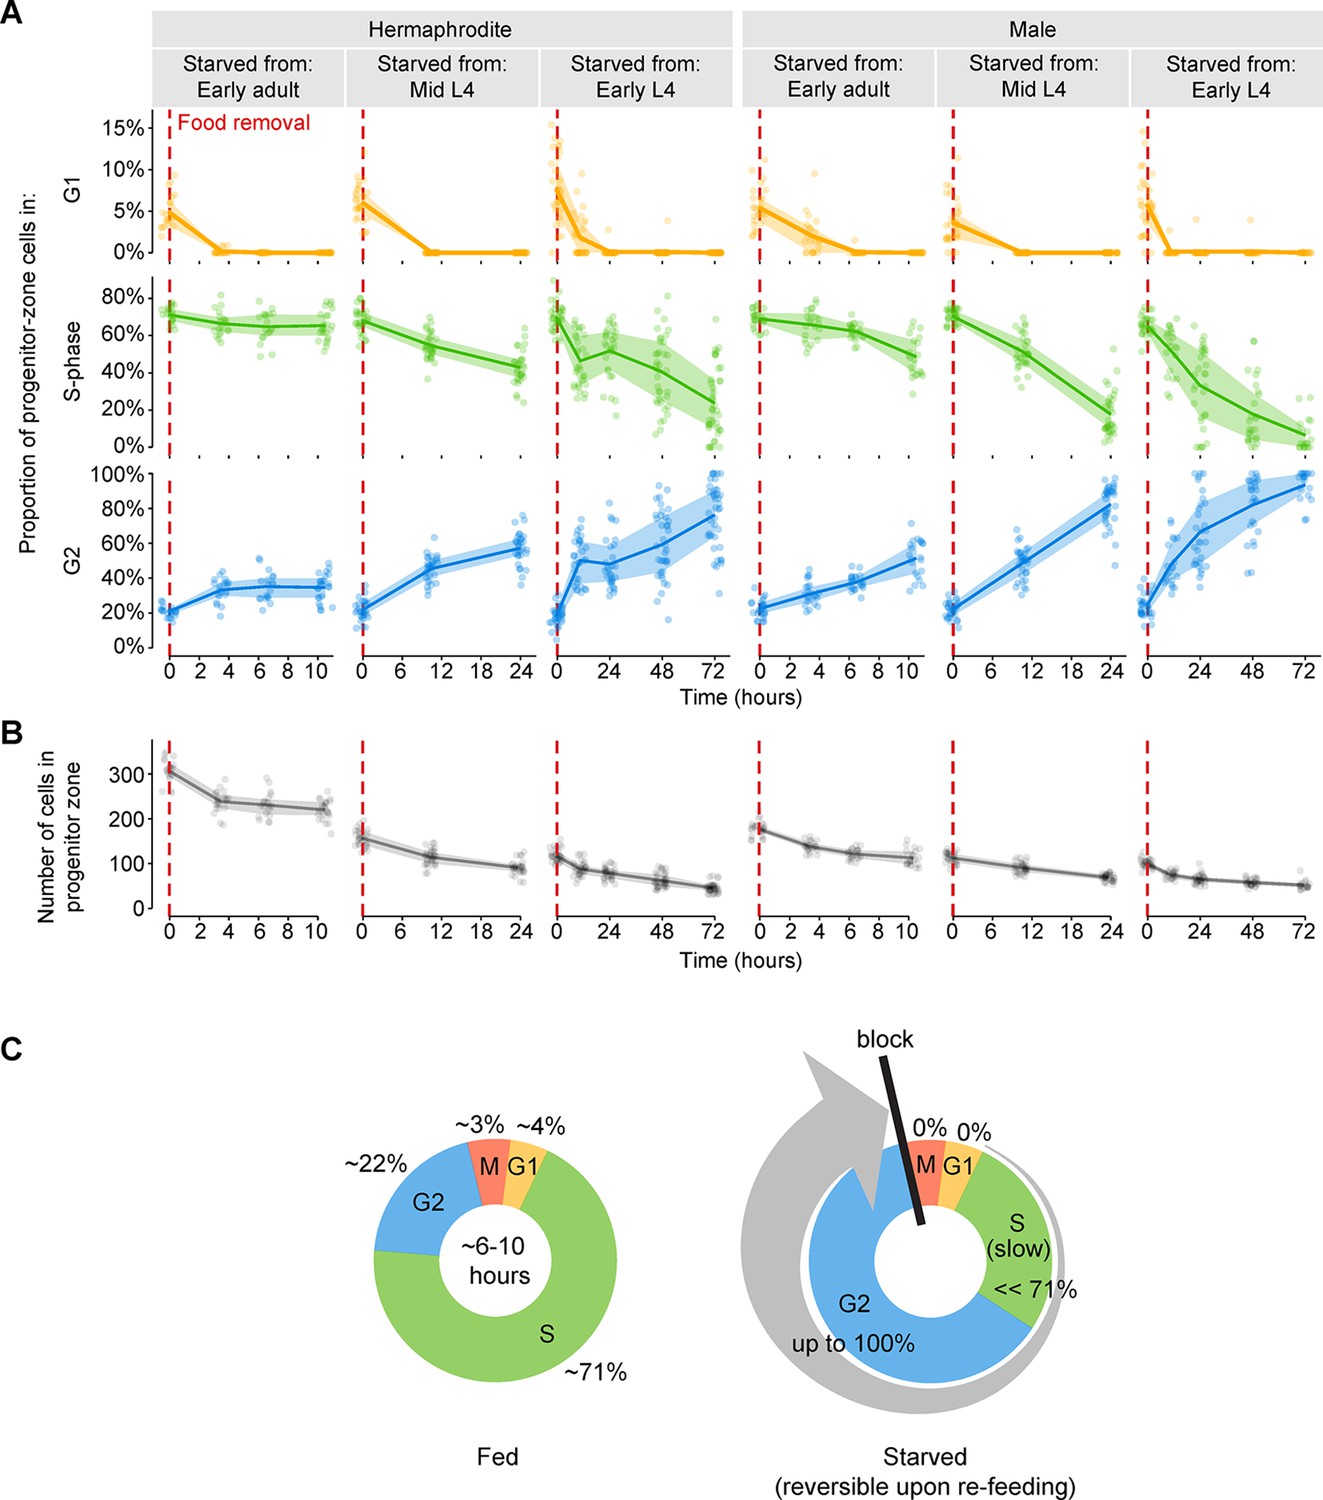
Starvation slows S-phase and causes germ cells to arrest in G2.
(A) Time courses showing the proportion of progenitor-zone cells in G1, S-phase, or G2, for animals starved from early adult or from mid or early L4. Animals starved from mid L4 were adults at the 10.5- and 24-hr time points. Animals starved from early L4 were adults at the 24-, 48-, and 72-hr time points. n = 19–40 gonadal arms per time point. (B) Time courses showing the number of cells in the progenitor zone, for the same gonads used in A. Within each plot, lines connect means, and shaded areas show interquartile ranges. (C) Schematic summarizing the effect of starvation on the mitotic cell cycle of germ cells. Cell-cycle length under fed conditions was measured in adult hermaphrodites (Figure 3—figure supplement 1). Source data are available in Figure 3—source data 1.
-
Figure 3—source data 1
Counts of cells in each phase of the cell cycle for starvation time courses of wildtype animals.
This comma-separated value file contains counts of progenitor-zone cells in each phase of the cell cycle for starvation time courses of wildtype animals (Figure 3). Each row of the file represents a single cell. Descriptors include cell-cycle phase (G1, S-phase, G2, M-phase), animal sex (hermaphrodite, male), age at the start of starvation (early L4, mid L4, early adult), time, and a gonad identifier.
- https://doi.org/10.7554/eLife.10832.008
-
Figure 3—source data 2
Counts of cells in each phase of the cell cycle for fed adult wildtype hermaphrodites.
This comma-separated value file contains counts of progenitor-zone cells in each phase of the cell cycle for fed early adult hermaphrodites and fed hermaphrodites aged 24 hr post mid L4 (Figure 3—figure supplement 1A–B). Each set of four rows of the file represents a single progenitor zone. Descriptors include cell-cycle phase (G1, S-phase, G2, M-phase), age (early adult, L4 + 24h), and a gonad identifier.
- https://doi.org/10.7554/eLife.10832.009
-
Figure 3—source data 3
EdU labeling in fed adult wildtype hermaphrodites.
This comma-separated value file contains counts of EdU-positive and EdU-negative M-phase cells in hermaphrodites exposed to EdU from the early adult stage or from 24 hr post mid L4 (Figure 3—figure supplement 1C). Each rows of the file represent a single time point. Descriptors indicate age at the start of EdU labeling (early adult, L4 + 24h).
- https://doi.org/10.7554/eLife.10832.010
-
Figure 3—source data 4
Propidium iodide intensities versus nuclear volume in the progenitor zone.
This comma-separated value file contains propidium iodide intensities and nuclear volumes of interphase progenitor-zone nuclei and distal tip cell nuclei of six EdU-labeled gonadal arms (Figure 3—figure supplement 2). Gonadal arms are from fed early adult hermaphrodites or hermaphrodites starved from early adult for 3.5 hr. Each row of the file represents a single cell. Descriptors include treatment group (fed, starved), cell-cycle phase (G1, S-phase, G2, distal tip cell), and a gonad identifier.
- https://doi.org/10.7554/eLife.10832.011
Figure 3—figure supplement 1
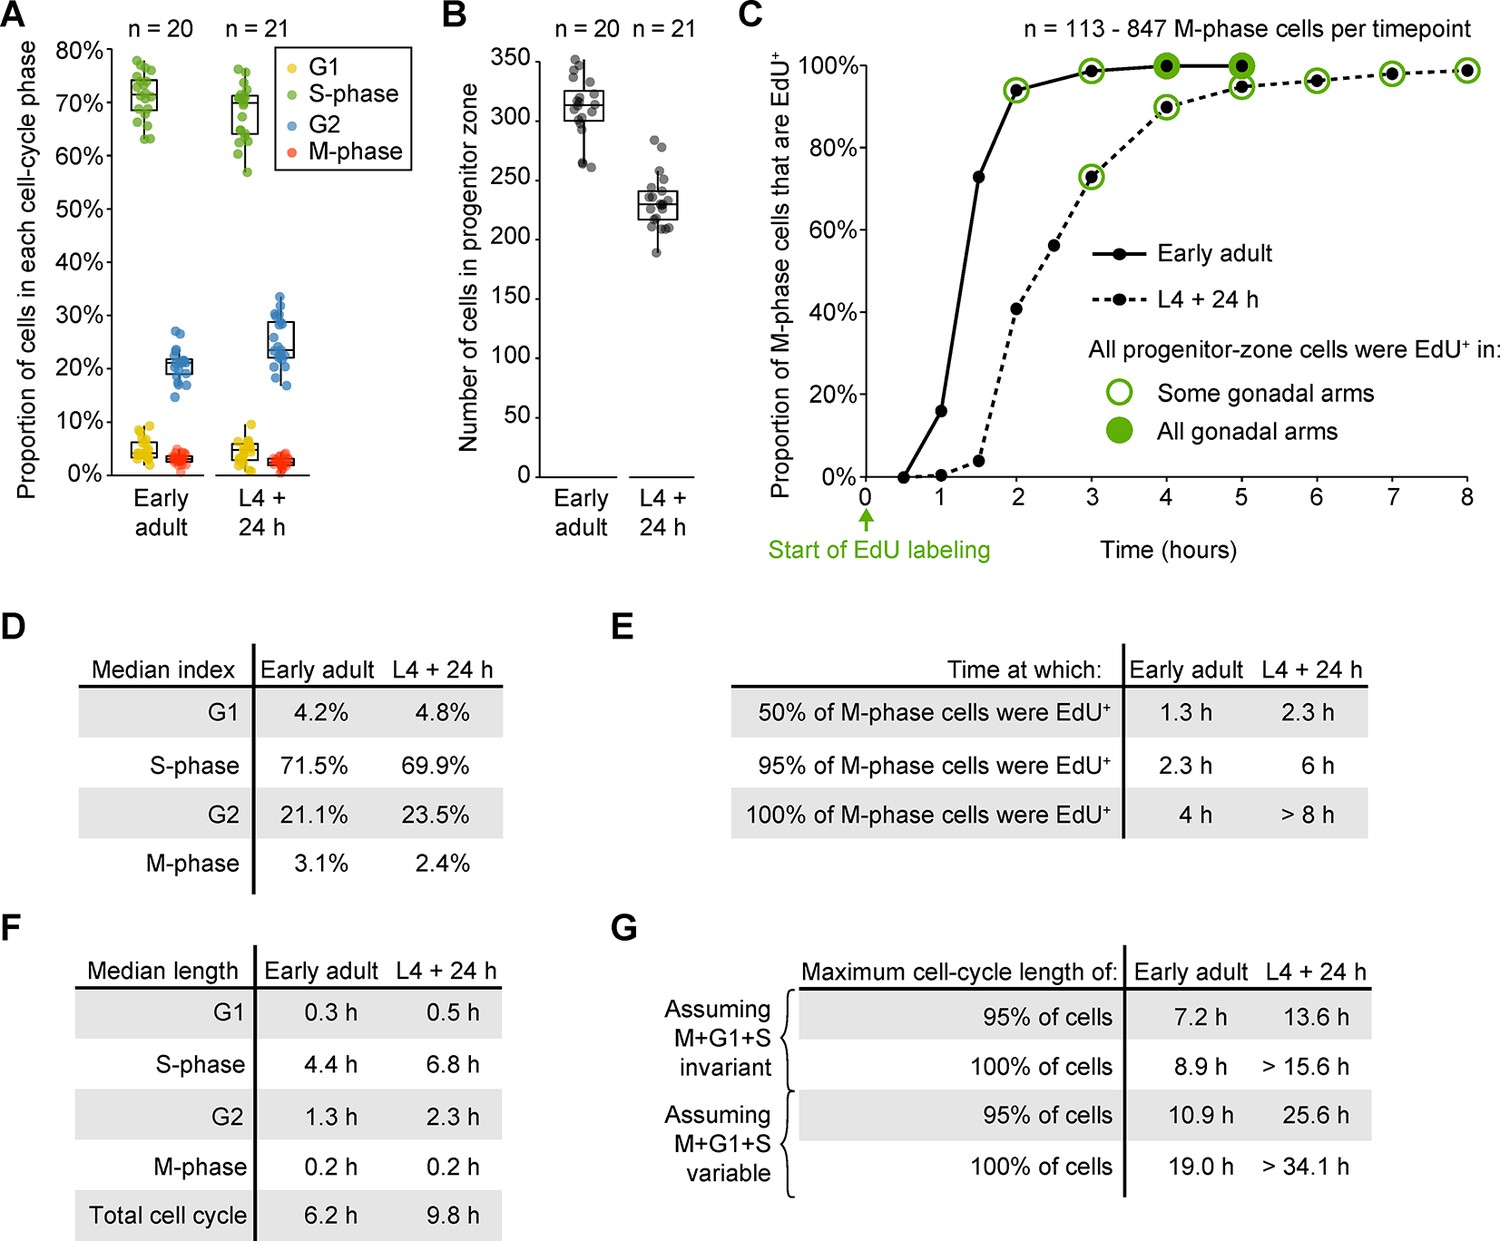
Measurements of cell-cycle length in fed animals.
(A) Proportions of progenitor-zone cells in each phase of the cell cycle in fed early adult hermaphrodites and fed adult hermaphrodites aged 24-hr post mid L4 (‘L4 + 24 h’). Data for early adults derives from the ‘before food removal’ time point of the time course in Figure 3A. Data for L4 + 24 animals derived from 0.5-hr time point of the time course in C. Sample sizes indicate number of gonadal arms. (B) Number of progenitor-zone cells for the same gonads used in C. (C) EdU-labeling time course to measure G2 length. Fed early adult hermaphrodites and hermaphrodites aged 24-hr post mid L4 were exposed to continuous EdU labeling. The proportion of M-phase cells that were EdU+ was measured at the time points shown. Open green circle, sample contained some gonadal arms in which all progenitor-zone cells were EdU+. Filled green circle, all progenitor-zone cells in all gonadal arms were EdU+ cells. (D) Median indices for each cell-cycle phase, calculated from the data in A. (E) Time at which 50%, 95%, or 100% of M-phase cells were EdU+, from the time course in C. (F) Median length of each cell-cycle phase and the total cell cycle, calculated from the data in D, E. (G) Estimates of maximum total cell-cycle length, calculated from the data in E, F. Source data for A, B are available in Figure 3—source data 2. Source data for C are available in Figure 3—source data 3.
Figure 3—figure supplement 2
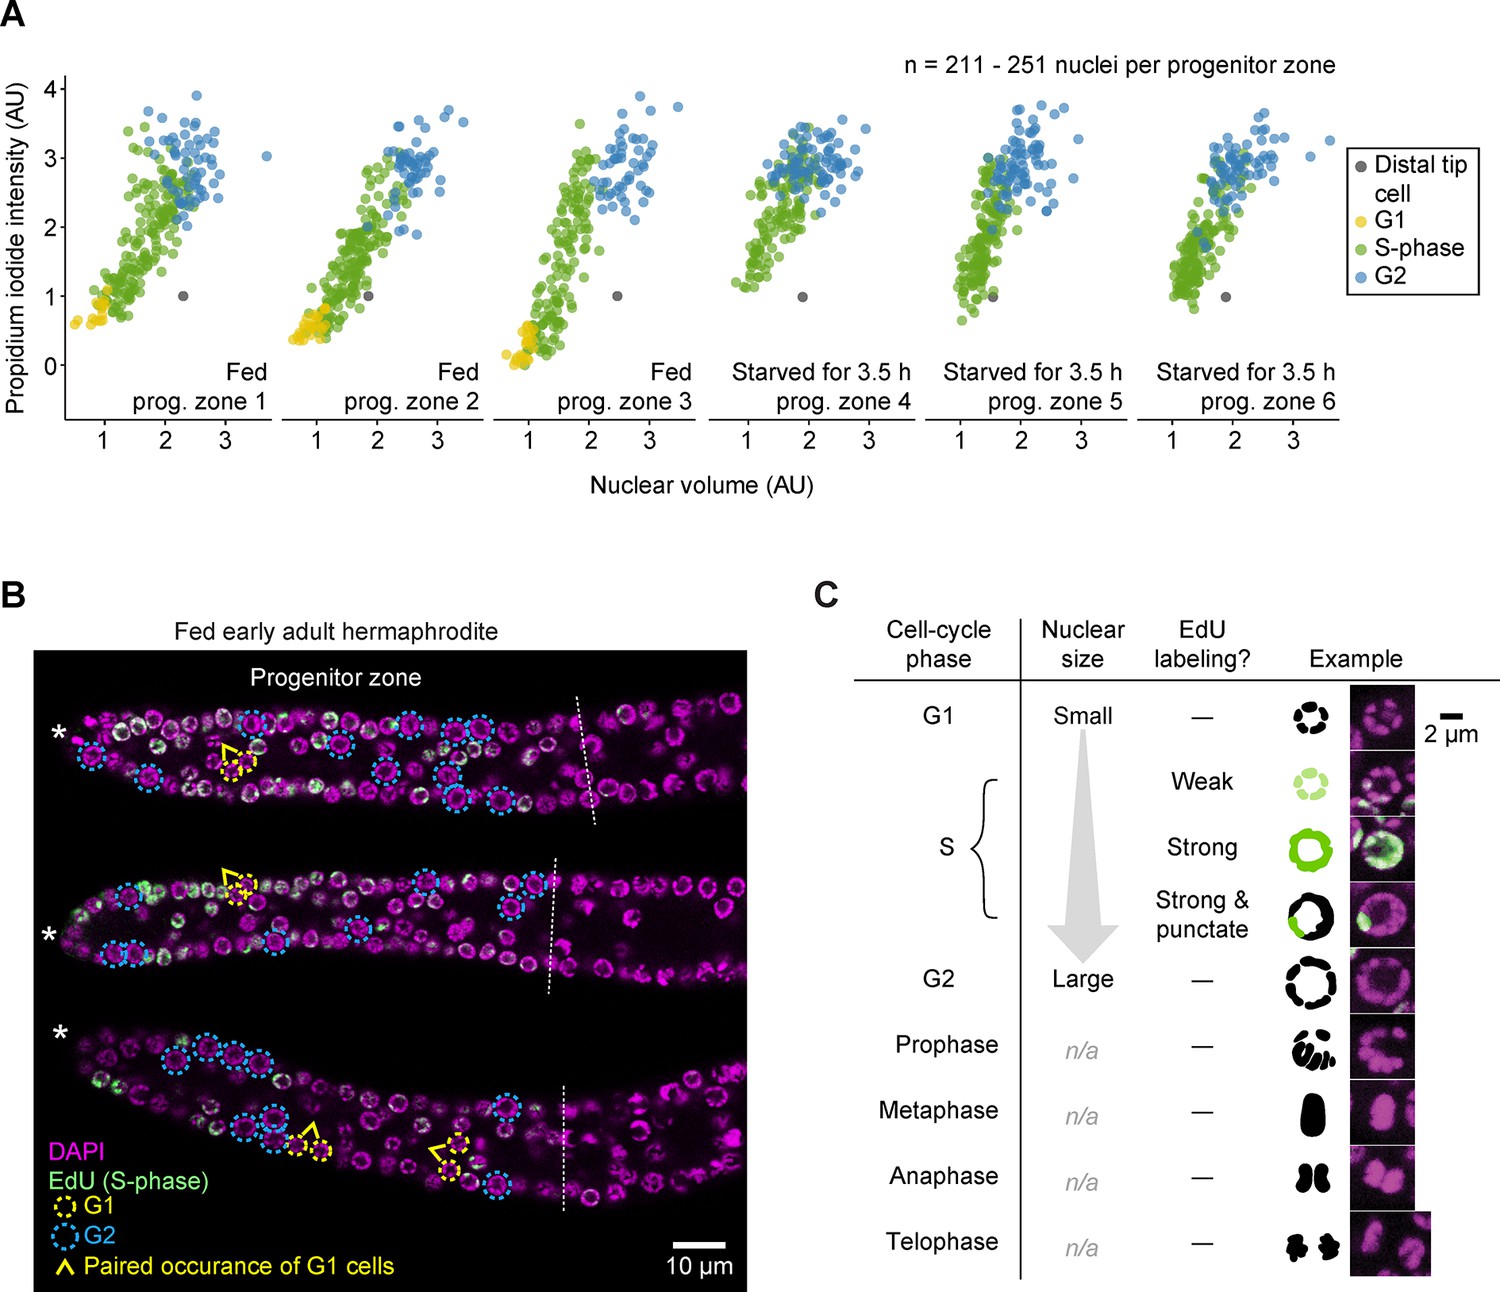
G1 versus G2 cells can be distinguished by nuclear size in EdU-labeled gonads.
(A) Propidium iodide intensities (a measure of DNA content) versus nuclear volume for interphase progenitor-zone nuclei and the distal tip cell nucleus in six gonadal arms. Propidium iodide intensities are scaled relative to the distal tip cell and the mean of G2 cells, to account for gonad-to-gonad differences in staining. Left, fed early adult hermaphrodites. Right, hermaphrodites starved from early adult for 3.5 hr. Cell-cycle phases were assigned by EdU uptake (S-phase cells) and nuclear size (G1 versus G2). AU, arbitrary units. (B) Images of EdU-labeled distal gonads (15 min EdU pulse) dissected from fed early adult hermaphrodites and stained with DAPI to visualize DNA (magenta). Asterisks, distal gonad ends. Dashed lines, progenitor zone boundaries. Yellow and blue circles, examples of G1 and G2 nuclei, respectively. Caret, paired occurrence of G1 cells. (C) Images of progenitor-zone nuclei in each stage of the cell cycle. Nuclei derive from gonads described as in B. n/a, not applicable. Source data are available in Figure 3—source data 4
Figure 4

Re-feeding restores the rate of progression through S phase and G2, as well as the meiotic entry of transient progenitors.
(A) Images of distal gonads dissected from emb-30(tn377ts) adult hermaphrodites and stained with DAPI to visualize DNA (magenta) and anti-GLD-1 (green). Animals were starved at 15°C, shifted to 25°C, and then either re-fed or maintained in starvation. Time = 0 hr indicates the time at which re-feeding was started or starvation continued. Top, starved adult hermaphrodite, Time = 0 hr. Middle, re-fed adult hermaphrodite, Time = 6 hr. Bottom, adult hermaphrodite maintained in starvation, Time = 6 hr. Dashed lines, ‘crescent’/‘non-crescent’ boundaries (defined by the second distal-most ‘crescent’ cell—see Materials and methods section). Arrowhead, an example of a metaphase-arrested cell having a high level of GLD-1. Asterisks, distal gonad ends. Images are maximum-intensity z-projections. (B) Time course showing the proportion of cells in M-phase (among the distal-most 50 germ cells) for emb-30(tn377ts) adult hermaphrodites treated as in A. n = 31–66 gonadal arms per time point. (C) Number of cells distal to the ‘crescent’/‘non-crescent’ boundary for the same gonads used in B. (D) Cell-cycle behavior, among cells distal to the ‘crescent’/‘non-crescent’ boundary, for the same gonads used in B. Cells from individual gonadal arms are plotted along lines, with color indicating cell-cycle phase (interphase or M-phase) and location determined by each cell’s position along the distal-to-proximal axis of distal gonad. For each time point, this axis is scaled relative to the mean number of cells distal to the ‘crescent’/‘non-crescent’ boundary. (E) Summary of the effects of re-feeding and continued starvation on germ cells in emb-30(tn377ts) hermaphrodites in the distal versus proximal progenitor zone. Source data are available in Figure 4—source data 1.
-
Figure 4—source data 1
Temperature-shift experiments of emb-30(tn377ts) hermaphrodites.
This comma-separated value file contains counts of interphase and M-phase progenitor-zone cells for emb-30(tn377ts) hermaphrodites re-fed at the restrictive temperature or maintained in continued starvation (Figure 4). Each row of the file represents a single cell. Descriptors include treatment group (re-fed, starved), cell-cycle phase (interphase, M-phase), ranked proximity to the distal tip cell (numeric), time, and a gonad identifier.
- https://doi.org/10.7554/eLife.10832.015
Figure 5
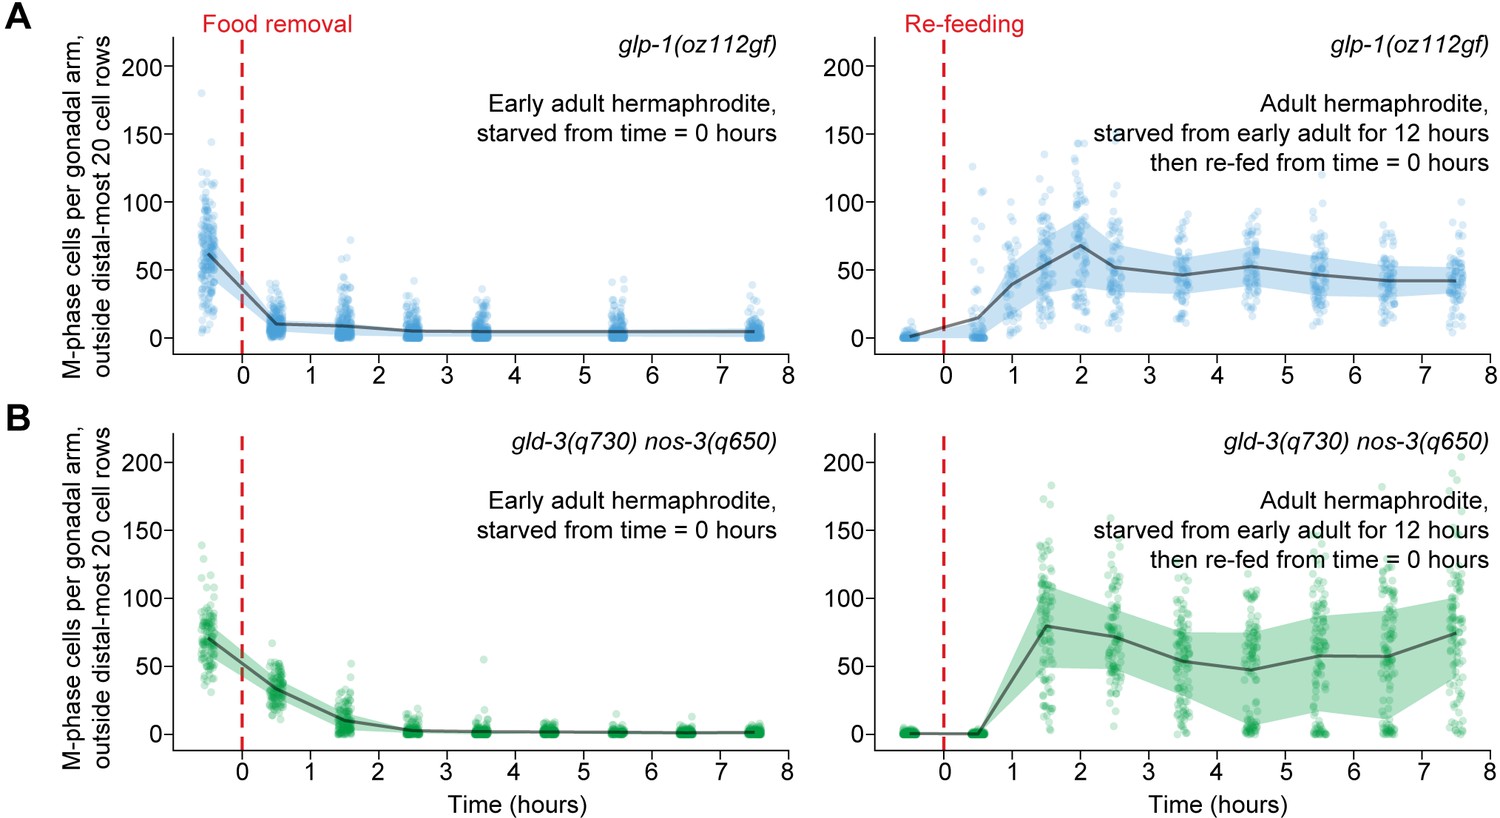
Ectopic mitotic divisions outside the progenitor zone respond normally to food removal and re-feeding.
Time courses showing the number of M-phase cells—outside the distal-most 20 rows of germ cells—after food removal or re-feeding in adult glp-1(oz112gf) hermaphrodites or adult gld-3(q730) nos-3(q650) hermaphrodites. Time zero indicates the start of food removal or re-feeding. Lines connect means, and shaded areas show interquartile ranges. n = 50–249 gonadal arms per time point. Source data are available in Figure 5—source data 1.
-
Figure 5—source data 1
Counts of M-phase cells for starvation and re-feeding time courses of glp-1(oz112gf) and gld-3(q730) nos-3(q650) hermaphrodites.
This comma-separated value file contains counts of M-phase cells per gonadal arm for glp-1(oz112gf) and gld-3(q730) nos-3(q650) starvation and re-feeding time courses (Figure 5). Each row of the file represents a single gonadal arm. Descriptors include treatment group (starvation, re-feeding), genotype (glp-1(oz112gf), gld-3(q730) nos-3(q650)), and time.
- https://doi.org/10.7554/eLife.10832.017
Figure 6 with 1 supplement

Quiescence induced by three different conditions maintains germline stem cells independent of GLP-1/Notch.
(A–F) Distance between the gonad distal tip and the first ‘crescent’ germ cell for adult hermaphrodites of the genotypes and treatments shown. Animals were grown at 15°C, shifted to 25°C for 8, 16, or 24 hr, and then returned to 15°C for 2–3 days. Gonads were collected prior to the temperature shift (15°C), immediately following the temperature shift (25°C for 8 hr, 25°C for 16 hr, or 25°C for 24 hr), and following the 15°C recovery period (… + 15°C for 2–3 days). Data are plotted as vertical histograms, with black circles denoting means. n = 55–488 gonadal arms per time point. (G) Time course showing the number of M-phase cells per progenitor zone in glp-1(q224ts) hermaphrodites starved from early adult, shifted to 25°C for 8 hr, and then re-fed at 25°C. Lines connect means, and shaded areas show interquartile ranges. (H) Time courses showing distance between the gonad distal tip and the first ‘crescent’ germ cell. Top, hermaphrodites starved from early adult, shifted to 25°C for 8 hr, and then re-fed at 25°C. Bottom, hermaphrodites fed continuously and shifted to 25°C at the early adult stage. Data are plotted as vertical histograms, with lines connecting means. Sample sizes in G, H indicate number of gonadal arms. (I) Images of distal gonads dissected from adult hermaphrodites and stained with DAPI to visualize DNA (magenta) and anti-GLD-1 (green). Gonads were dissected before and after 8 hr at 25°C. Left-hand panels, fed adult hermaphrodites. Right-hand panels, hermaphrodites starved from early adult. Asterisks, distal gonad ends. (J) Schematic summarizing the effect of cell-cycle quiescence on germline stem cell maintenance. Under conditions of active proliferation, GLP-1/Notch is required for germline stem cell maintenance. Under quiescent conditions, GLP-1/Notch is dispensable. Source data for A–F are available in Figure 6—source data 1. Source data for G, H are available in Figure 6—source data 2.
-
Figure 6—source data 1
Temperature-shift experiments of glp-1(q224) hermaphrodites.
This comma-separated value file contains measurements of the distance between the gonad distal tip and the first ‘crescent’ germ cell in temperature-shifted glp-1(q224) hermaphrodites (Figure 6A–F). Distances are measured in germ cell diameters. Each row of the file represents a single gonadal arm. Descriptors include growth conditions (fed, cdk-1 RNAi, starved from early adult, starved from mid-L4, 300 mM NaCl, no sperm) and temperature (15°C; 25°C for 8 hr; 25°C for 16 hr; 25°C for 24 hr; 25°C for 8 hr + 15°C for 2–3 days; 25°C for 16 hr + 15°C for 2–3 days; 25°C for 24 hr + 15°C for 2–3 days).
- https://doi.org/10.7554/eLife.10832.019
-
Figure 6—source data 2
Time courses of temperature-shifted glp-1(q224) hermaphrodites.
This comma-separated value file contains counts of M-phase cells and distances between the gonad distal tip and the first ‘crescent’ germ cell for two groups of animals: (i) glp-1(q224ts) hermaphrodites starved from early adult, shifted to 25°C for 8 hr, and then re-fed at 25°C, and (ii) glp-1(q224ts) hermaphrodites fed continuously and shifted to 25°C at the early adult stage (Figure 6G–H). Distances are measured in germ cell diameters. Each row of the file represents a single gonadal arm. Descriptors include treatment group (fed, starved) and time. NA, not determined.
- https://doi.org/10.7554/eLife.10832.020
Figure 6—figure supplement 1
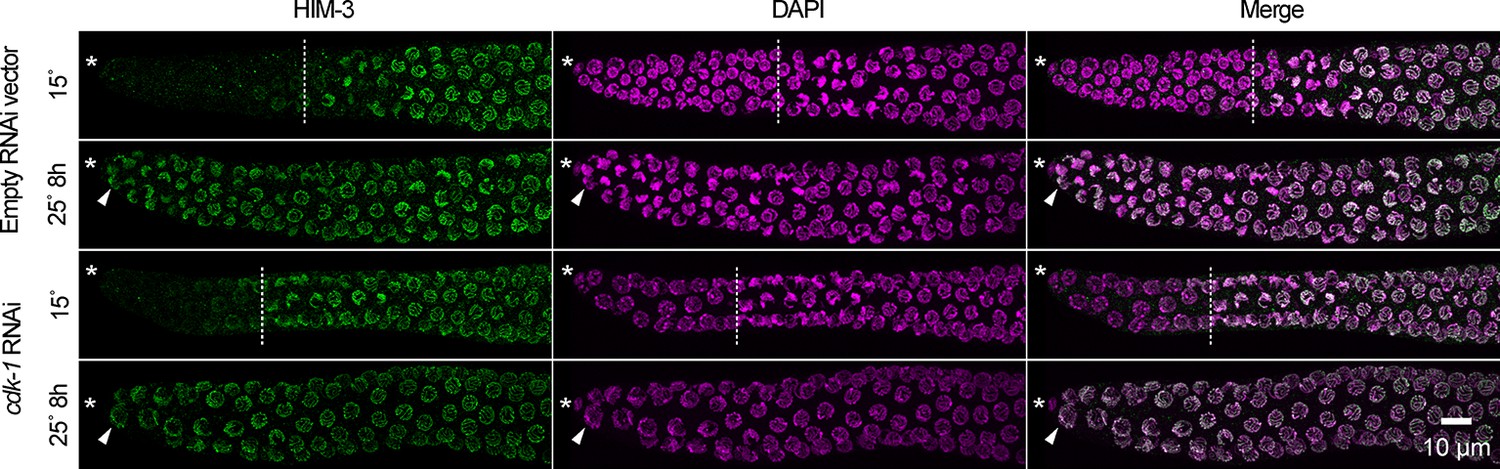
Cell-cycle arrest caused by cdk-1 RNAi does not maintain germline stem cells in the absence of GLP-1/Notch.
Images of distal gonads dissected from glp-1(q224ts) adult hermaphrodites exposed to cdk-1 RNAi (lower panels) or the empty RNAi vector, L440 (upper panels). Gonads were dissected before and after 8 hr at 25°C and stained with DAPI to visualize DNA (magenta) and anti-HIM-3 (green) to visualize formation of the synaptonymal complex, indicating meiotic entry (Zetka et al., 1999). Asterisks, distal gonad ends. Arrowheads, examples of nuclei in the distal ends in which HIM-3 has been loaded onto chromosomes. Dashed lines, progenitor zone boundaries. Images are maximum-intensity z-projections.
Figure 7 with 1 supplement
Starvation-induced quiescence is distinct from the DNA damage response and does not require factors involved in larval or behavioral responses to food.
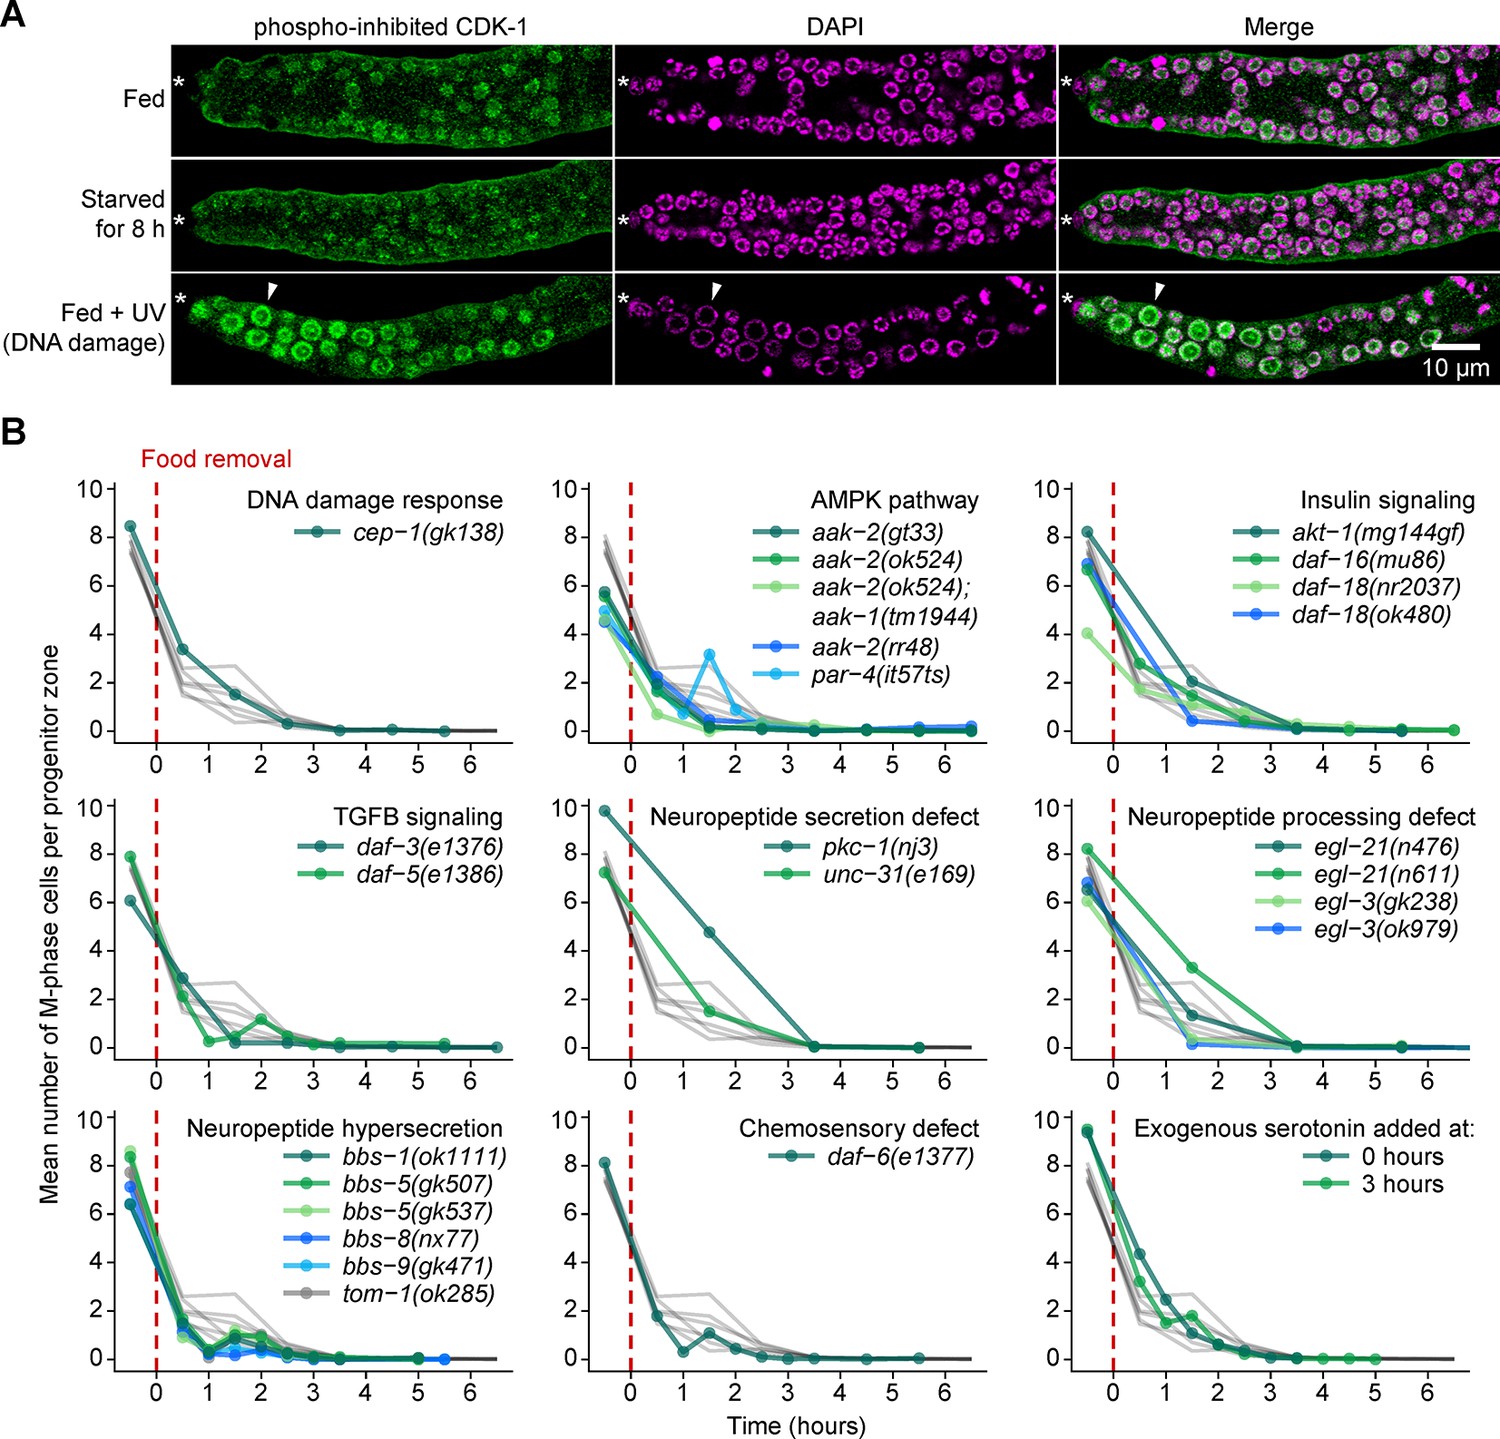
(A) Images of distal gonads dissected from adult hermaphrodites and stained with DAPI to visualize DNA (magenta) and anti-phosopho-CDK-1 (green, Santa Cruz #sc-28435-R) to visualize inhibitory phosphorylation of CDK-1. The phospho-specificity of anti-phosopho-CDK-1 is shown in Figure 7—figure supplement 1. Top row, fed adult hermaphrodite. Center row, adult hermaphrodite starved from early adult for 8 hr. Bottom row, fed adult hermaphrodite treated with UV light to induce DNA damage. Asterisks, distal gonad ends. Arrowheads, example of an enlarged nucleus having elevated phospho-CDK-1. Similar results were observed using a different phospho-CDK-1 antibody (Calbiochem #219440, data not shown). (B) Time courses showing the mean number of M-phase cells per progenitor zone after food removal for hermaphrodites of the genotypes shown. Animals were starved from early adult. Grey curves represent seven replicates of wild type, reproduced from Figure 2A. Time zero indicates the start of food removal. Lower right corner, wildtype hermaphrodites exposed to 20 mM serotonin at the onset of food removal (0 hr) or 3 hr later. n = 46–452 gonadal arms per time point. Source data are available in Figure 7—source data 1.
-
Figure 7—source data 1
Starvation time courses of mutants and of wildtype hermaphrodites exposed to exogenous serotonin.
This comma-separated value file contains counts of M-phase cells per gonadal arm for the starvation time courses shown in Figure 7B. Each row of the file represents a single gonadal arm. Descriptors include genotype (cep-1(gk138), aak-2(gt33), etc.) and time. For serotonin exposure, genotype is listed as ‘serotonin 0 hr’ or ‘serotonin 3 hr’.
- https://doi.org/10.7554/eLife.10832.023
Figure 7—figure supplement 1
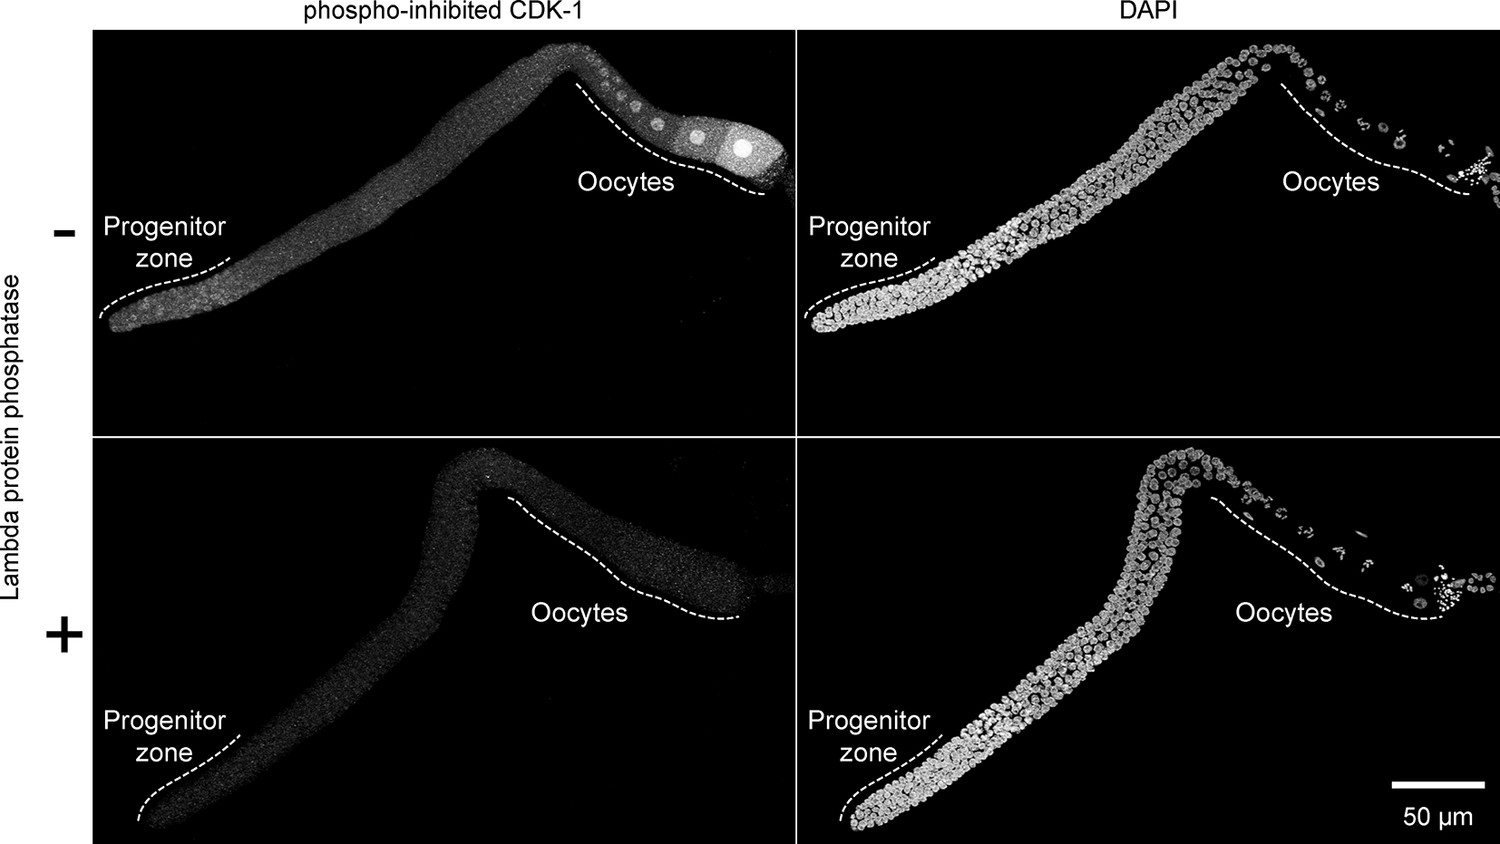
Validation of phospho-specificity of anti-phosopho-CDK-1.
Images of whole gonadal arms dissected from fed early adult hermaphrodites. Gonads were treated with or without lambda protein phosphatase and stained with anti-phosopho-CDK-1 (Santa Cruz #sc-28435-R) and DAPI to visualize DNA. Images are maximum-intensity z-projections.
Figure 8
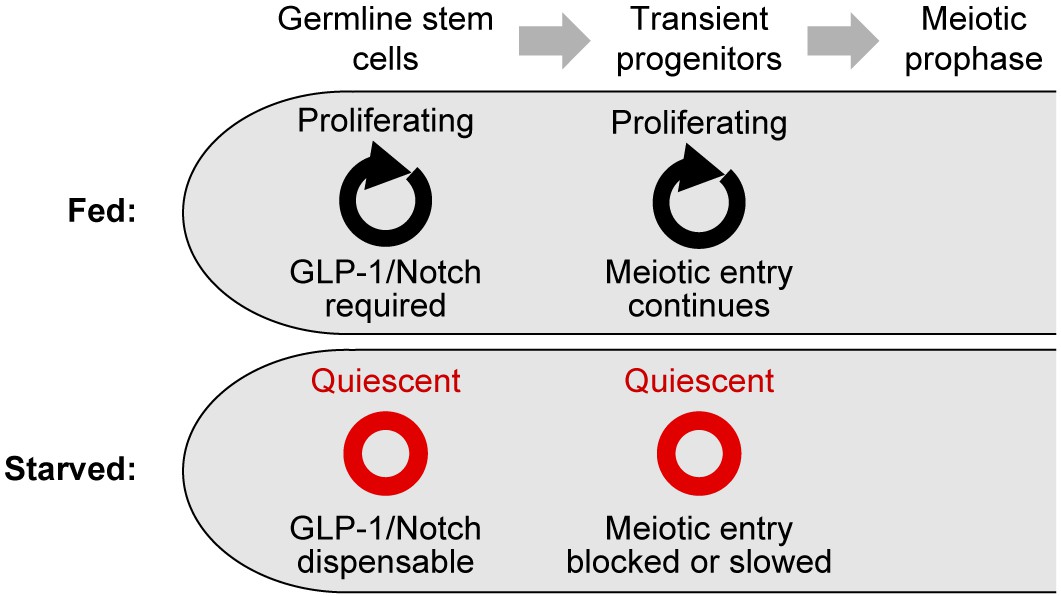
Summary of the effects of starvation on germ cell division, stem cell maintenance, and meiotic entry.
Under fed conditions, mitotic cell divisions occur throughout the progenitor zone (Crittenden et al., 2006; Maciejowski et al., 2006); GLP-1/Notch is required for stem cell maintenance (Austin and Kimble, 1987); and transient progenitors enter the meiotic cell cycle if their movement out of the progenitor zone is restricted (Cinquin et al., 2010). Under starved conditions, germ cells become quiescent; GLP-1/Notch is dispensable for stem cell maintenance; and the meiotic entry of transient progenitors is slowed or blocked.
Download links
A two-part list of links to download the article, or parts of the article, in various formats.
Downloads (link to download the article as PDF)
Open citations (links to open the citations from this article in various online reference manager services)
Cite this article (links to download the citations from this article in formats compatible with various reference manager tools)
Cell-cycle quiescence maintains Caenorhabditis elegans germline stem cells independent of GLP-1/Notch
eLife 4:e10832.
https://doi.org/10.7554/eLife.10832


