Rho-associated kinase (ROCK) function is essential for cell cycle progression, senescence and tumorigenesis
- Institute of Cancer Research, United Kingdom
- Cancer Research UK London Research Institute, United Kingdom
- Cancer Research UK Manchester Institute, United Kingdom
Figures
Figure 1 with 1 supplement
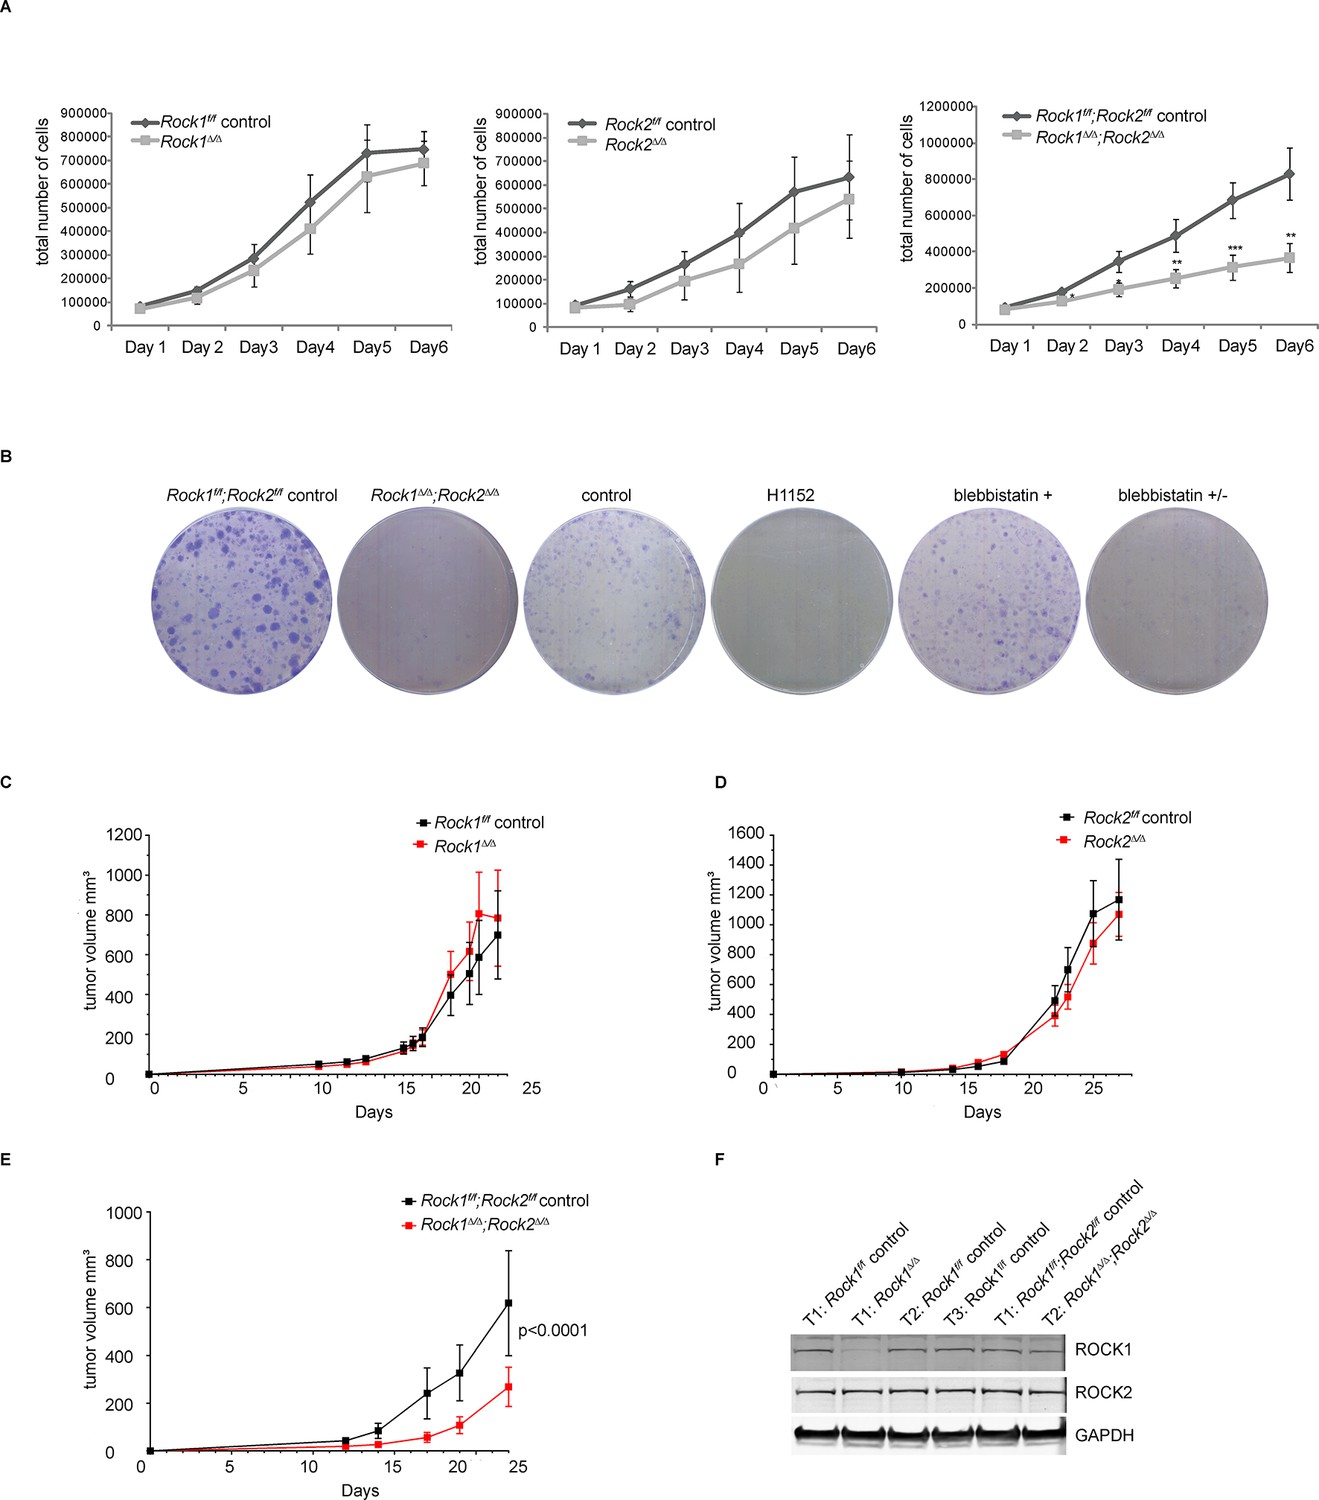
Depletion of ROCK1 and 2 leads to defects in cell proliferation in vitro and in vivo.
(A) Proliferation curves of MEFs with different genotypes over 6 days. The cells were seeded 3 d after adenovirus infection. Graphs show total number of cells and SD from 5 independent experiments each carried out in triplicates. p-values were calculated using Student’s t-test: ** p<0.005; *** p<0.001. (B) Rock1f/f;Rock2f/f control and Rock1∆/∆;Rock2∆/∆ MEFs were cultured for 3 days and wild-type cells were treated with H1152, inactive blebbistatin (+) or active blebbistatin (+/-) for 48 hr. Cells from all conditions were then subjected to a colony formation assay and grown for a further 7 days. (C–F) Rock1f/f;Rock2f/f MEFs transformed with Trp53 DD and HRas V12 were treated with Ad Cre to generate ∆. Cells were injected subcutaneously into CD1 nude mice and growth analyzed. The graph shows average tumor volume in mm3 and SEM for Rock1∆/∆ and control (C), Rock2∆/∆ and control (D), Rock1∆/∆;Rock2∆/∆ and control (E). p values were calculated by ANOVA and are as indicated. (F) Tumors with stated genotypes were immunoblotted with indicated antibodies.
Figure 1—figure supplement 1
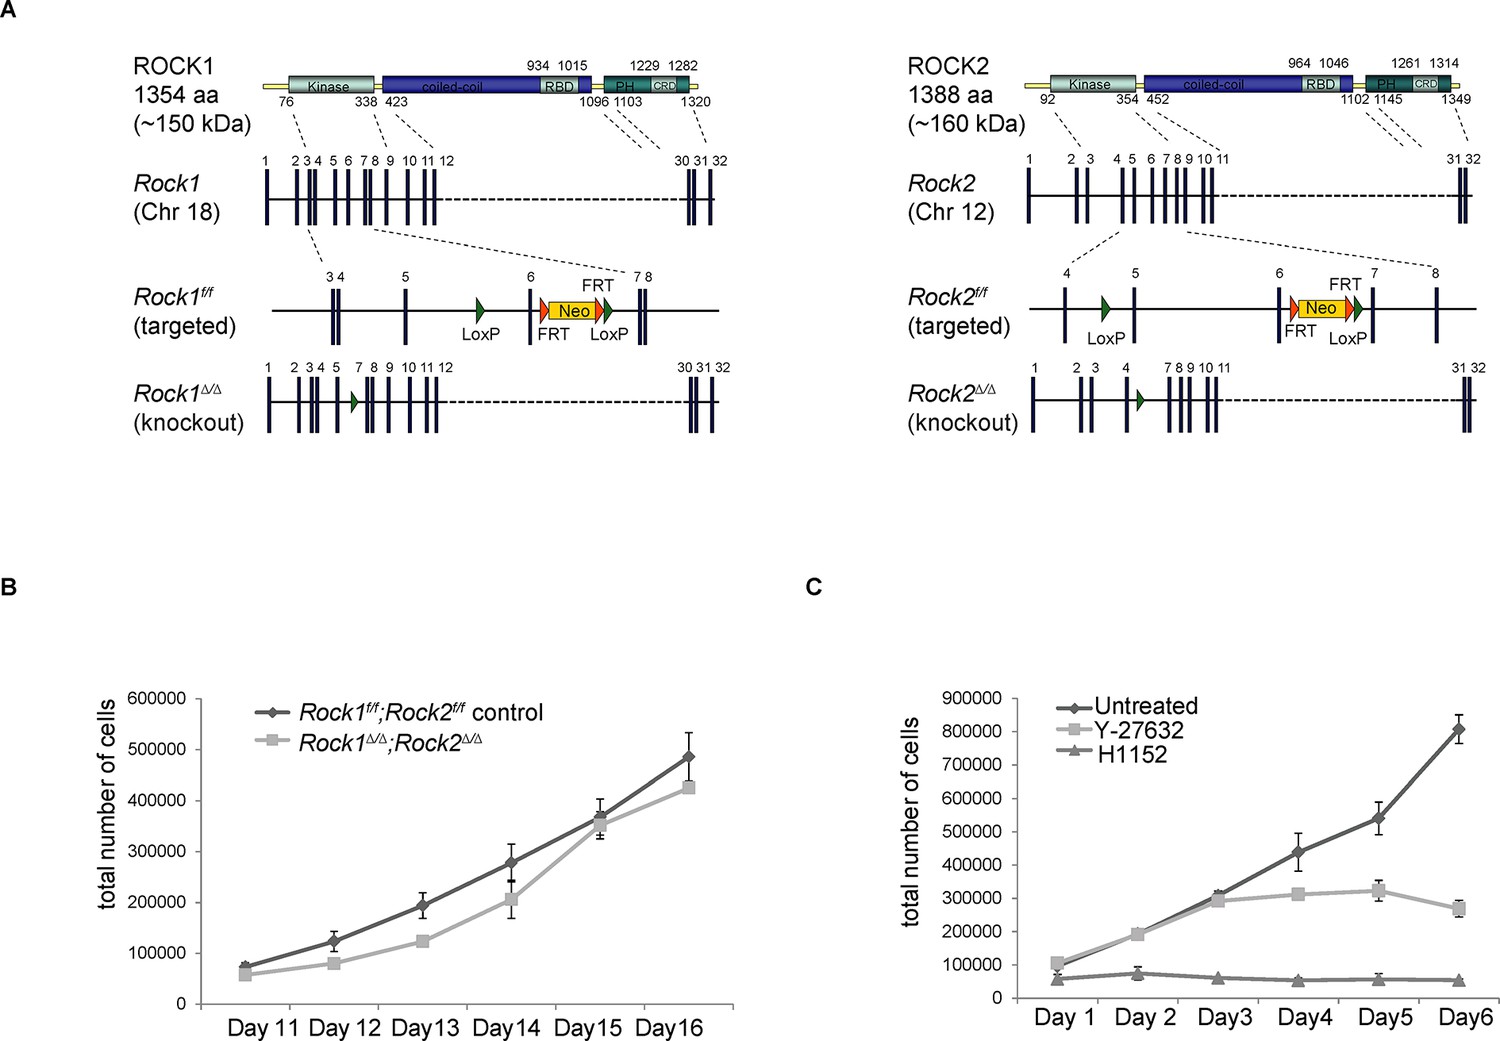
Generation of conditional Rock alleles and cell proliferation analyses.
(A) Schematic representation of mouse ROCK1 and 2 proteins, Rock1 and 2 loci, targeted and deleted alleles. (B) Proliferation curves of Rock1f/f;Rock2f/f control, Rock1∆/∆;Rock2∆/∆ MEFs 11 to 16 days after seeding. Cells were seeded 3 days after adenovirus infection. Graph shows total number of cells and SD from three independent experiments, each carried out in triplicates. (C) Cells were treated with Y-27632 and H1152. One day later, equal numbers of cells were plated and subjected to growth analysis. The graph shows average number of cells and SD from at least 3 independent experiments, each carried out in triplicates.
Figure 2 with 1 supplement
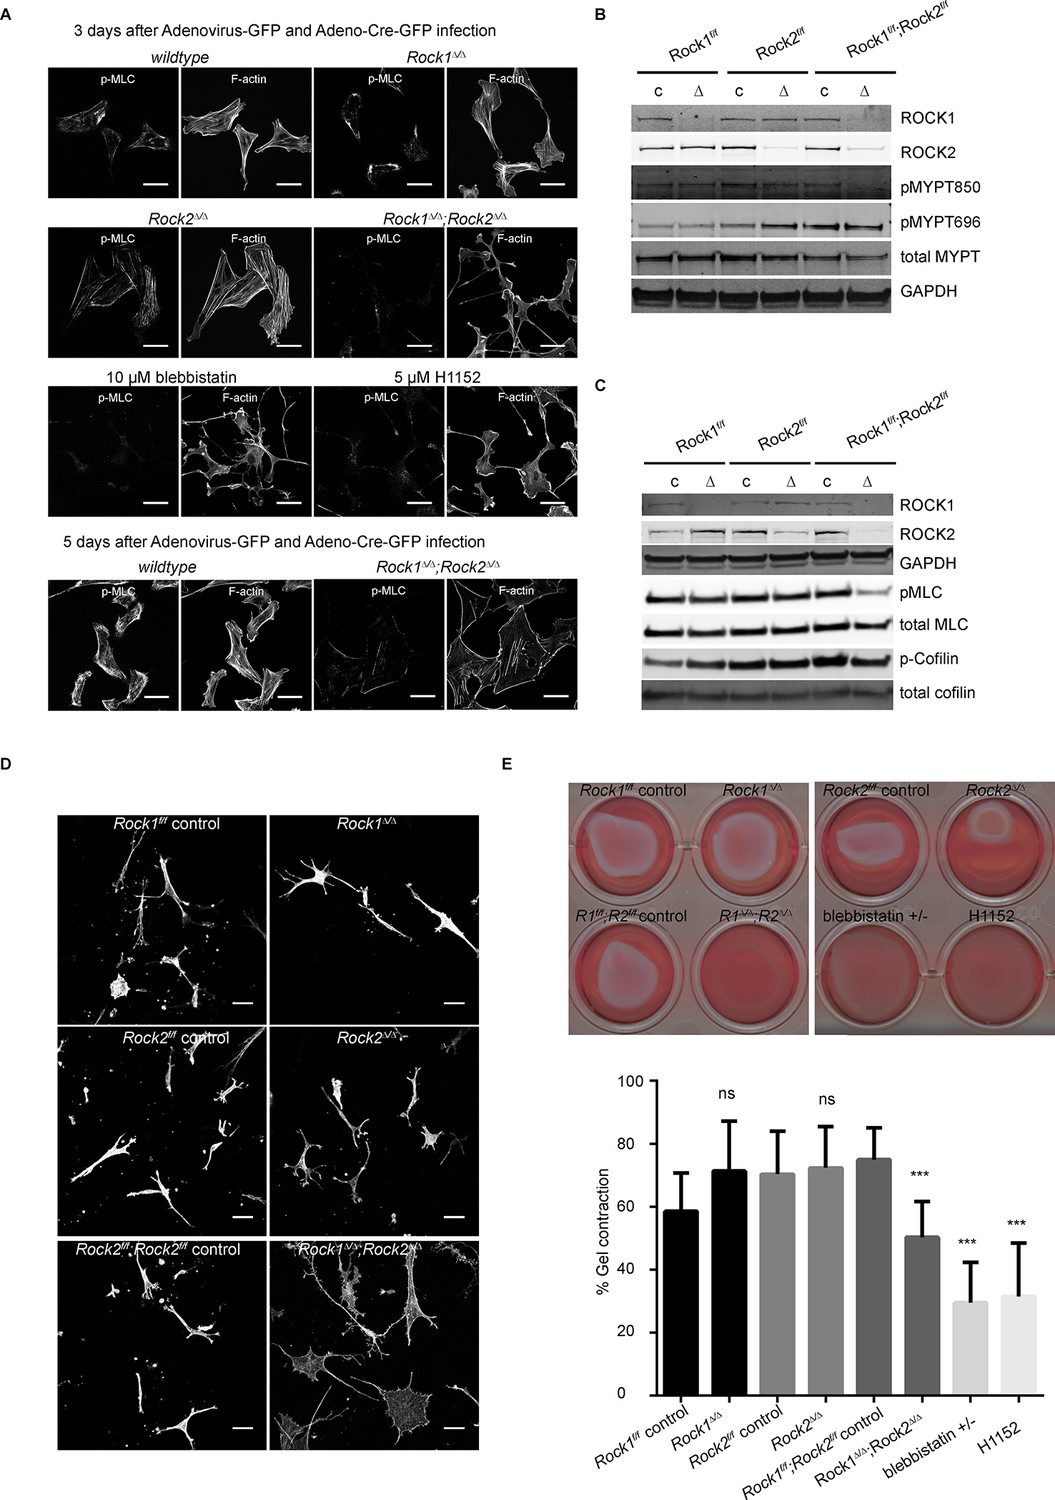
Only deletion of both ROCK1 and 2 leads to a loss of central stress fibers and a decrease in actomyosin contractility.
(A) Images of wild-type, Rock1∆/∆, Rock2∆/∆or Rock1∆/∆;Rock2∆/∆ MEFs, 3 days after Ad-GFP and Ad-Cre-GFP infection, stained for pMLC and phalloidin. Wild-type and Rock1∆/∆;Rock2∆/∆ cells are also shown 5 days after Ad-GFP and Ad-Cre-GFP infection. Scale bars are 50 µm. (B, C) Western blot analyses of ROCK targets in lysates of MEFs with indicated genotypes. Representative blots are shown, quantification of multiple biological replicates can be found in Figure 2—figure supplement 1C. (D) Images of MEFs with indicated genotypes plated on a thick layer of collagen and stained for phalloidin. Scale bars are 50 µm. (E) Images and quantification of collagen gel contraction assay using MEFs of indicated genotypes. Graph shows average data and SD from 5 independent experiments, each carried out in triplicate. p-values were calculated using Student’s t-test: ***p<0.001.
Figure 2—figure supplement 1
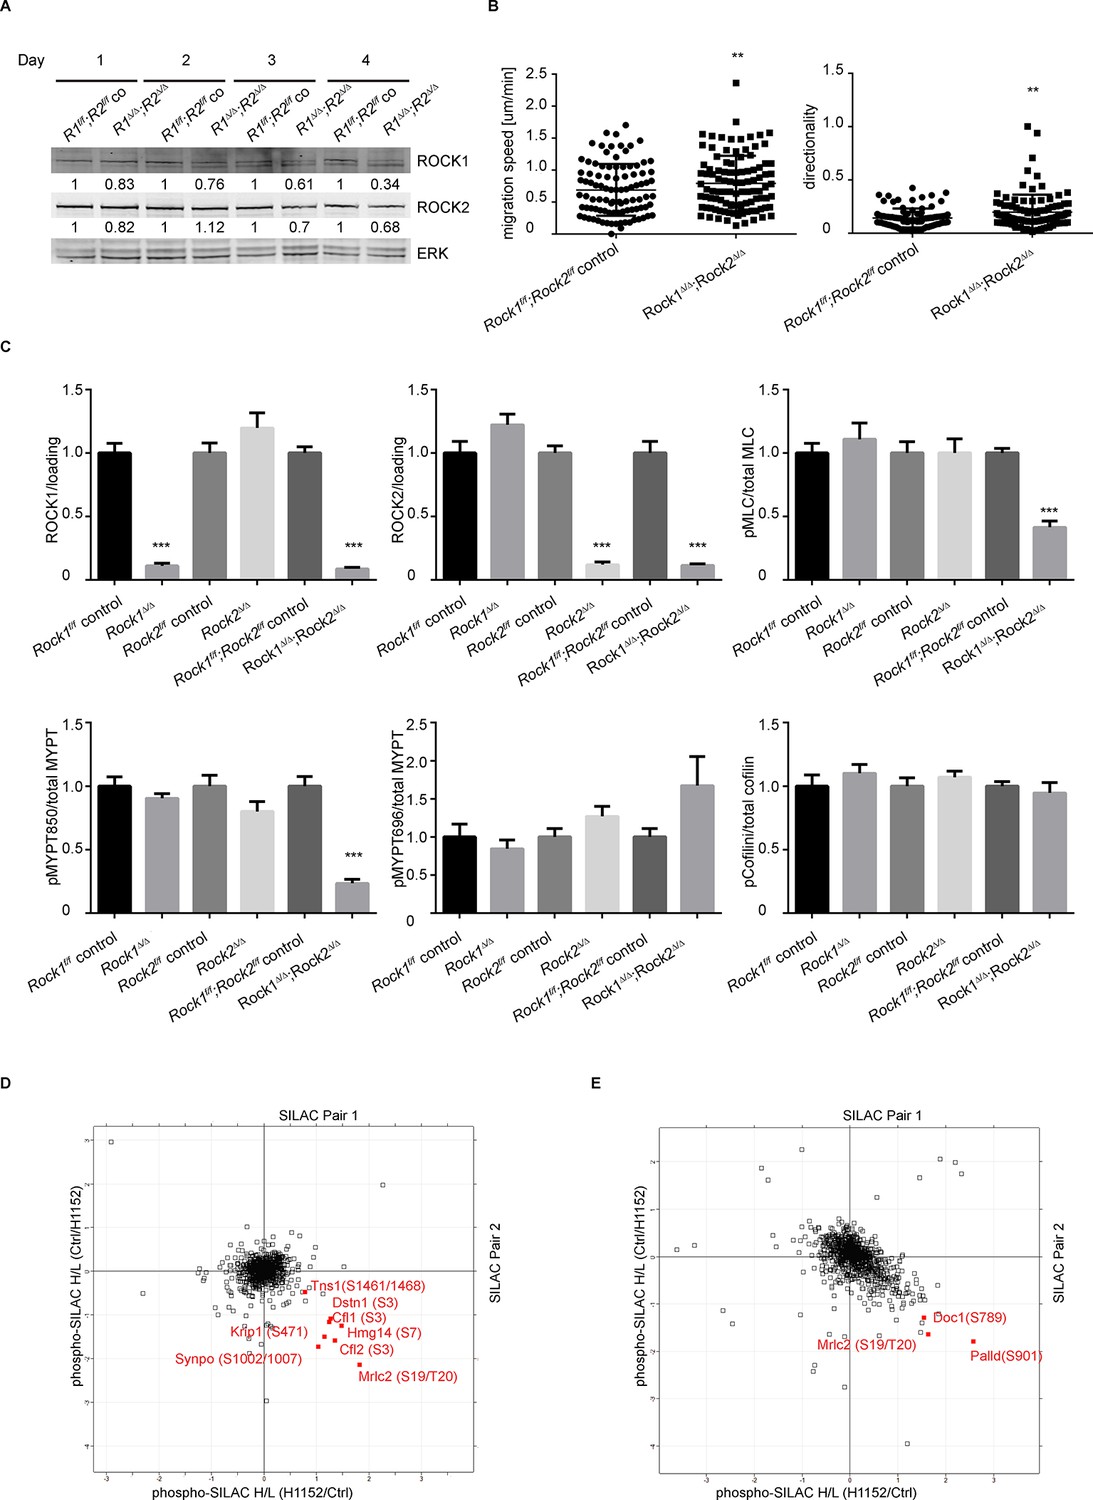
Depletion of ROCK leads to an increase in migration speed and persistent down-regulation of Myosin Regulatory Light Chain (Mrlc) phosphorylation.
(A) Western blot analysis of ROCK1 and 2 in Rock1f/f;Rock2f/f cells after indicated days of Ad-GFP and Ad-Cre-GFP infection. (B) Cells from time-lapse movies were tracked and their migration speed and directionality determined using using ImageJ analysis software. Data are from five independent experiments and p-values were calculated using Student’s t-test: ** p<0.01. (C) Quantification of western blot analyses. Graphs show protein levels of ROCK1, ROCK2 divided by total ERK protein levels and pMLC, pMYPT850, pMYPT696 and pCofilin divided by their total protein levels and SEM. The data are from five independent experiments and p-values were calculated using Student’s t-test: *** p<0.001. (D) MEFs were treated with H1152 for 20 min and the phospho-proteome was analyzed by quantitative mass spectrometry. The graph shows log ratios of identified phospho-peptides from two reciprocally heavy vs. light SILAC-labelled control and H1152-treated cell populations. The ‘Significant-B’ outlier test was used to determine significantly regulated peptides in both replicates, using a Benjamini-Hochberg FDR rate of 5%. (E) MEFs were treated with H1152 overnight and the phospho-proteome was analyzed by quantitative mass spectrometry. The graph shows log ratios of identified phospho-peptides from two reciprocally heavy vs. light SILAC-labelled control and H1152-treated cell populations. The ‘Significant-B’ outlier test was used to determine significantly regulated peptides in both replicates, using a Benjamini-Hochberg FDR rate of 5%.
Figure 3 with 1 supplement
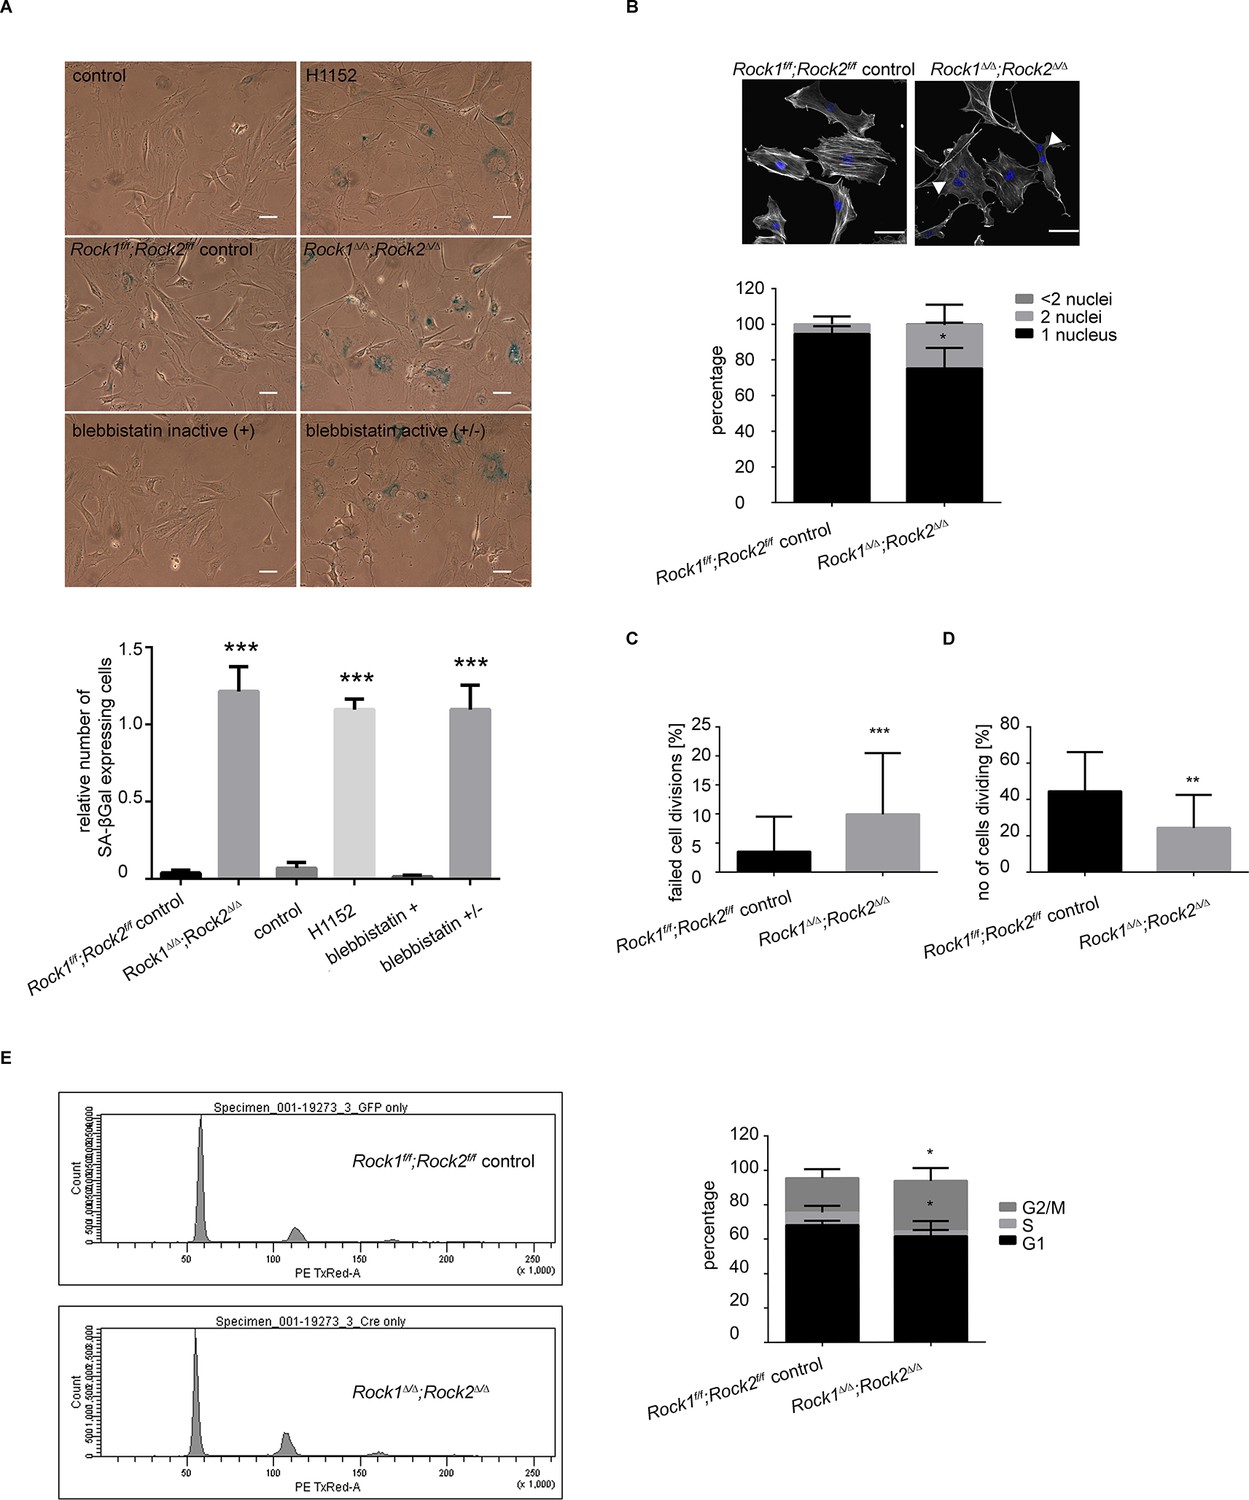
Rock1∆/∆;Rock2∆/∆ cells undergo senescence and show a cell cycle block.
(A) Images of MEFs treated with H1152, blebbistatin (+), blebbistatin (+/-) for 5 days and Rock1f/f;Rock2f/f control, Rock1∆/∆;Rock2∆/∆ MEFs, 5 days after Ad-GFP and Ad-Cre-GFP infection and followed by SA-βgal staining. Scale bars are 50 µm. Graph shows number of SA-βgal expressing cells divided by total number of cells and SD of >100 cells from three independent experiments and p-values were calculated using Student’s t-test: *** p<0.001. (B) Images of Rock1f/f;Rock2f/f and Rock1∆/∆;Rock2∆/∆ MEFs stained with phalloidin and DAPI. Overlay images shown. Arrows in image indicate binucleate cells. Scale bars are 50 µm. Bar chart shows average data and SD of nuclei in > 150 cells from 5 independent experiments. Values were calculated using Student’s t-test: * p<0.05. (C, D) Analysis of cell division of Rock1f/f;Rock2f/f and Rock1∆/∆;Rock2∆/∆ MEFs in time-lapse movies. (C) Quantification of failed cell divisions resulting in binucleate cells. (D) Quantification of average number of cells dividing. Graphs show average data and SD of > 300 cells from at least five independent experiments. (E) Cell cycle profiles of Rock1f/f;Rock2f/f and Rock1∆/∆;Rock2∆/∆ MEFs. The graph shows the percentage of cells in G2/M (top), S (middle) and G1 (bottom) phase of the cell cycle. Error bars represent SD. Data are from 5 independent experiments and p-values were calculated using Student’s t-test: * p<0.05.
Figure 3—figure supplement 1
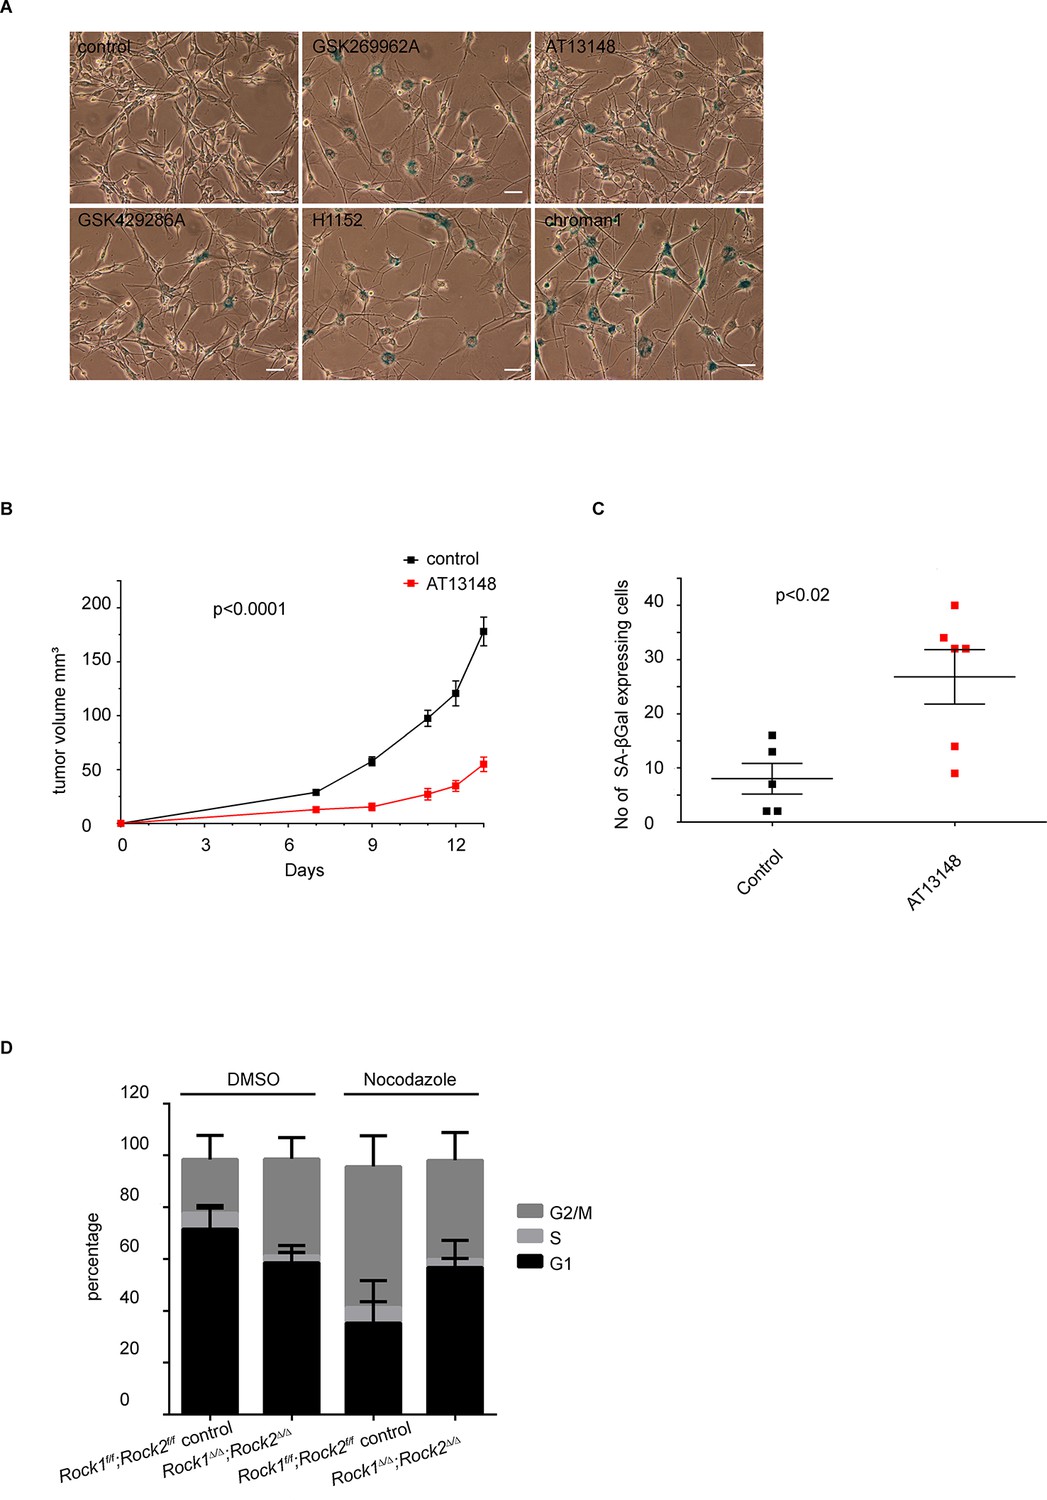
Analysis of senescence in ROCK-inhibited cells and induction of a cell cycle block in ROCK-depleted cells.
(A) Melanoma lines were treated with the indicated inhibitors for 7 days and subjected to SA-βgal staining. Scale bars are 50 µm. (B, C) Intra-dermal injection of 690cl2 melanoma cells into CD1 athymic mice followed by treatment with AT13148 (40 mg/kg) or vehicle. The graph shows average tumor volume in mm3 and SEM (B). Values calculated by Student’s t-test are as indicated. The lungs were analyzed by SA-βGal staining. The graph shows the number of SA-βGal-positive cells per 10 fields of view (C). p-values calculated by ANOVA are as indicated. (D) Rock1f/f;Rock2f/f and Rock1∆/∆;Rock2∆/∆ cells treated with nocodazole (4 µg/ml) or vehicle for 48 hrs were subjected to propidium iodide staining and flow cytometry analysis. The graph shows the percentage of cells in G2/M (top), S (middle) and G1 (bottom) phase of the cell cycle. Data are from three independent experiments and error bars represent SD.
Figure 4 with 2 supplements
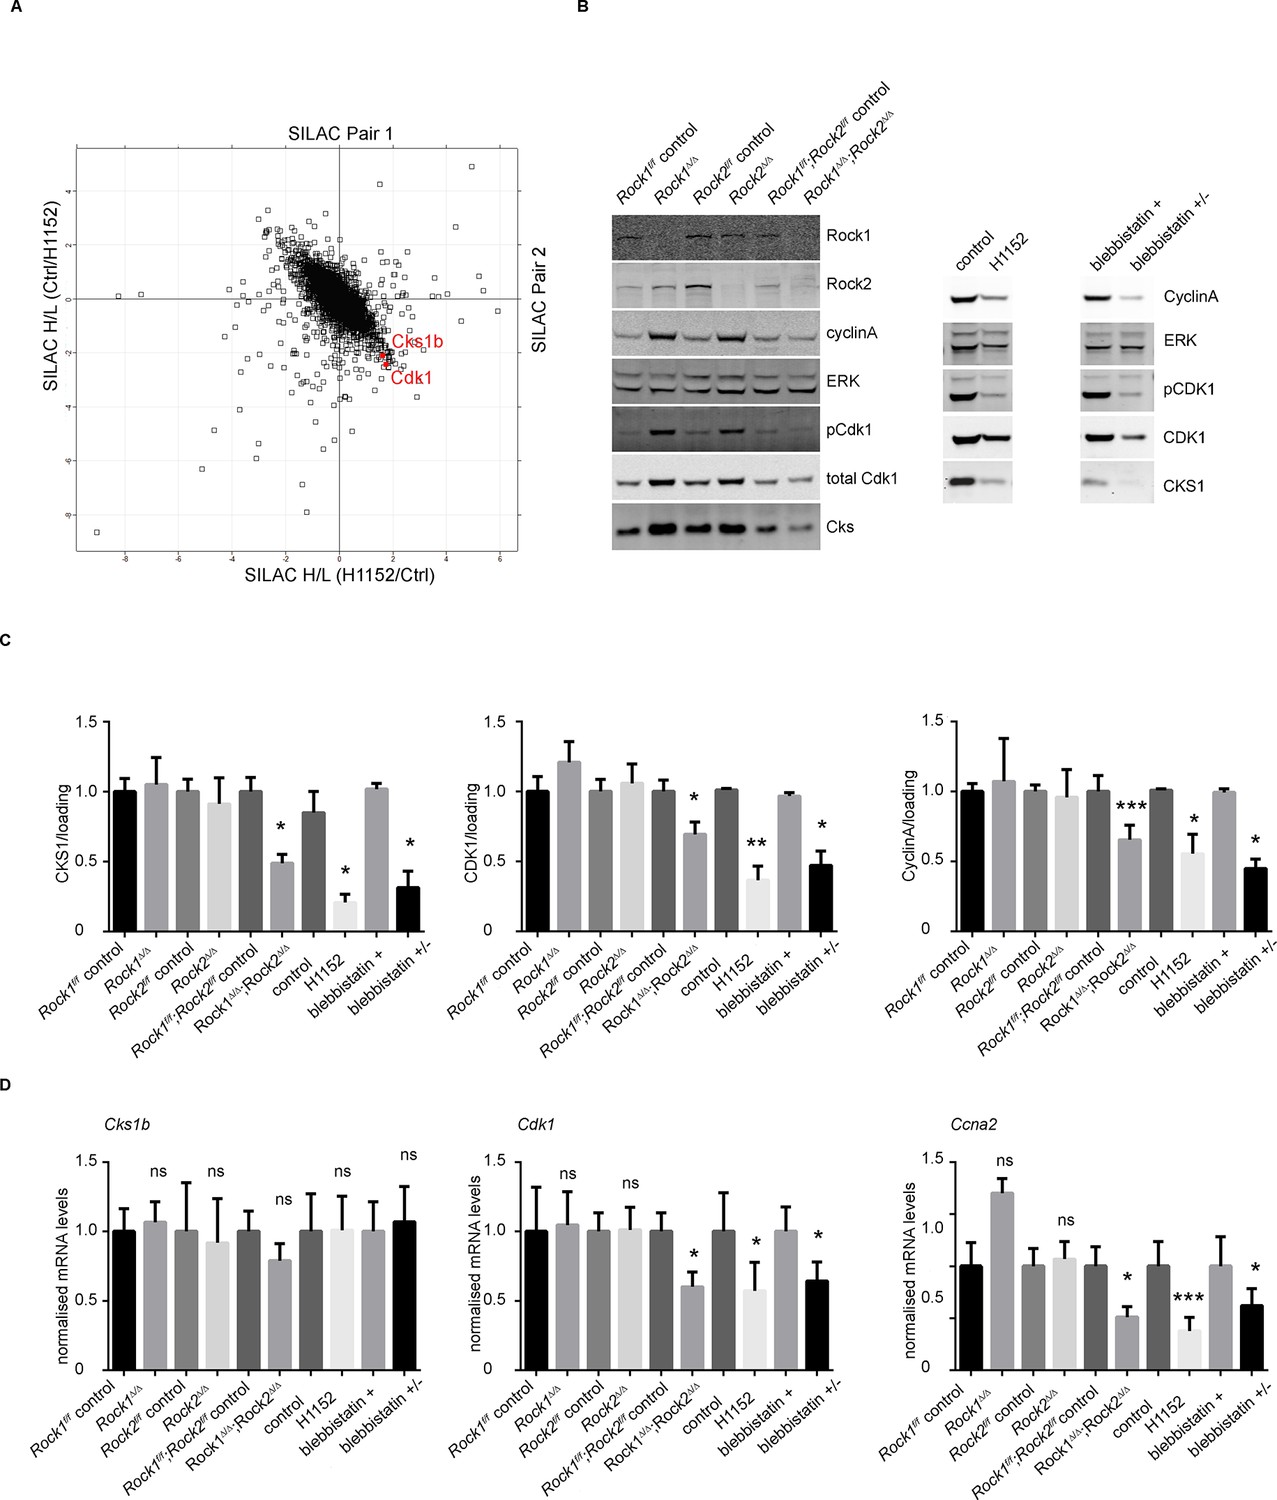
Downregulation of CKS1, CyclinA and CDK1 on abrogation of ROCK function.
(A) MEFs were treated with H1152 or vehicle for 3 days and the proteome analyzed by quantitative mass spectrometry. Graph shows log ratios of identified proteins. Data are from duplicate experiments of reciprocal SILAC labelling. The ‘Significant-B’ outlier test was used to determine significantly regulated peptides or proteins, using a Benjamini-Hochberg FDR rate of 5%. (B, C) MEFs of different genotypes or treated with indicated inhibitors were immunoblotted for pCDK1, total CDK1, Cyclin A, CKS1, ROCK1, ROCK2 and total ERK as loading control (B). (C) Quantification of western blot analyses. Graphs show protein levels of CDK1, CyclinA and CKS1 divided by total ERK protein levels and SEM in indicated samples. The data are from 5 independent experiments and p-values were calculated using Student’s t-test: * p<0.05, ** p<0.005, *** p<0.001. (D) qPCR analysis of mRNA levels of Cks1b, Cdk1 and Ccna2 in indicated samples. Graphs show average normalized mRNA levels and SD from at least five independent experiments, each carried out in triplicates. p-values were calculated using Student’s t-test: * p<0.05, *** p<0.001.
Figure 4—figure supplement 1
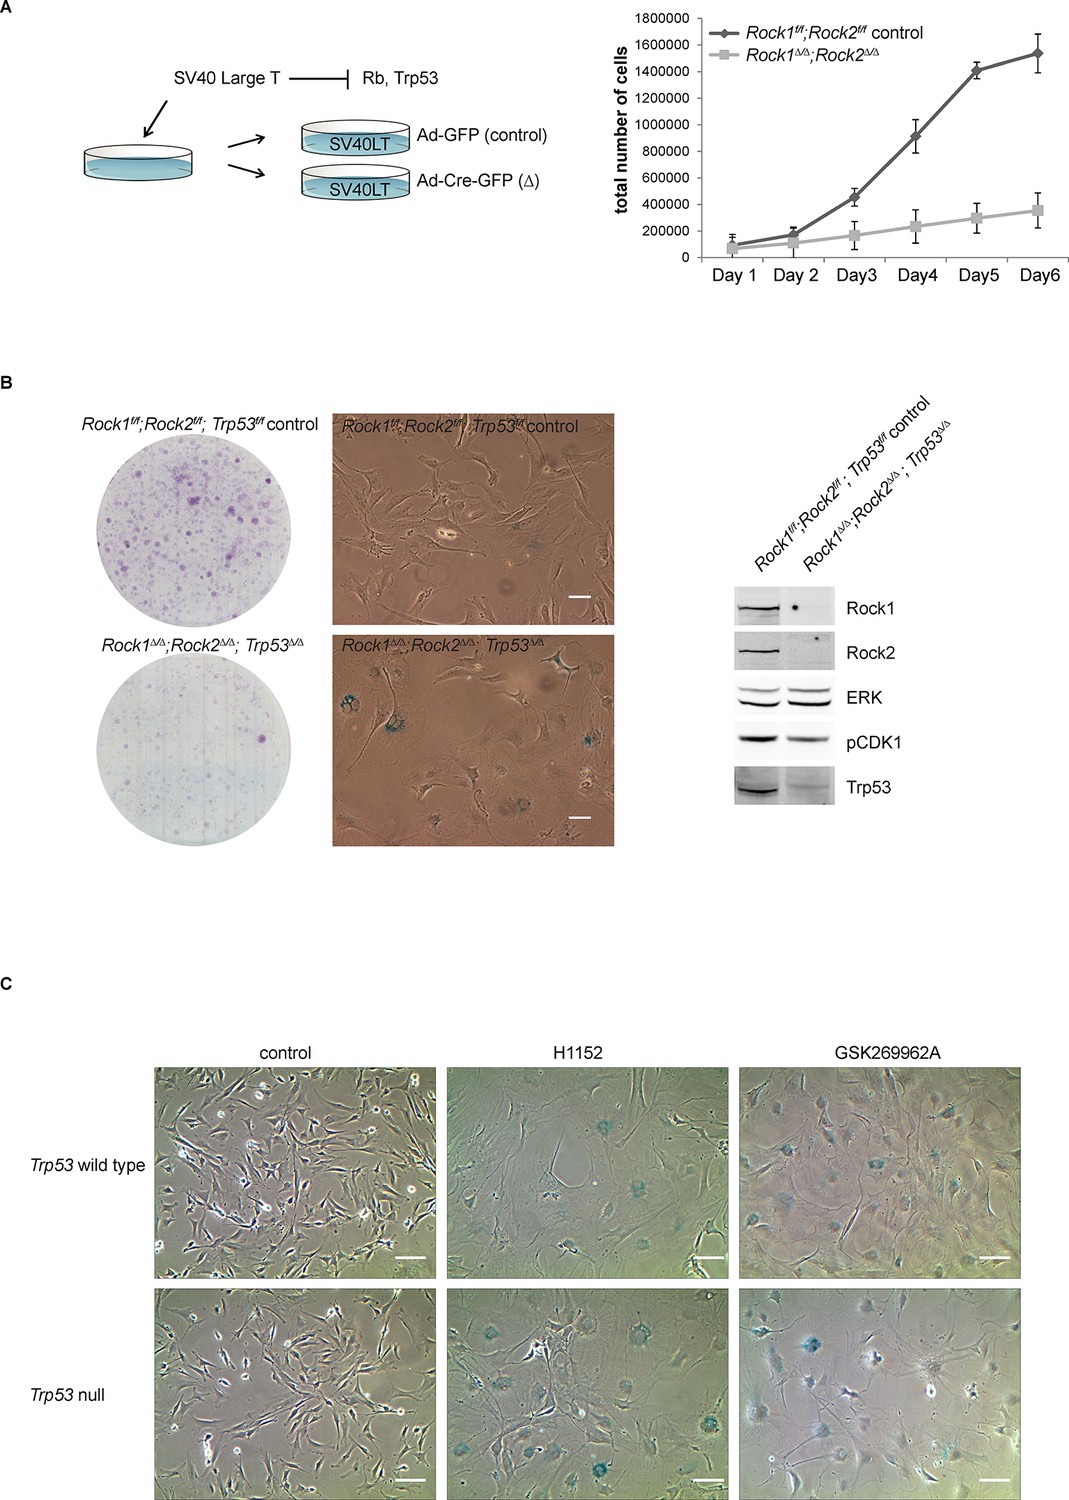
Analysis of cellular senescence in Rock1∆/∆;Rock2∆/∆;Trp53∆/∆ cells and in ROCK-inhibited Trp53 wild type and Trp53 null cells.
(A) Rock1f/f;Rock2f/f cells, immortalized with SV40 Large T, were infected with Ad-GFP or Ad-Cre-GFP to generate Rock1f/f;Rock2f/f control and Rock1∆/∆;Rock2∆/∆ cells. These were subjected to growth analysis. The graph shows average data and SD from 3 independent experiments, each carried out in triplicates. (B) Rock1f/f;Rock2f/f;Trp53f/f and Rock1∆/∆;Rock2∆/∆;Trp53∆/∆ cells were seeded at equal numbers and kept for ~7 days allowing colonies to form. In parallel, cells were subjected to SA-βgal staining and western blot analysis using indicated antibodies. Scale bars in images are 50 µm. (C) Trp53 wild-type and Trp53 null lines were treated with the indicated inhibitors for 7 days and subjected to SA-βgal staining. Scale bars are 100 µm.
Figure 4—figure supplement 2
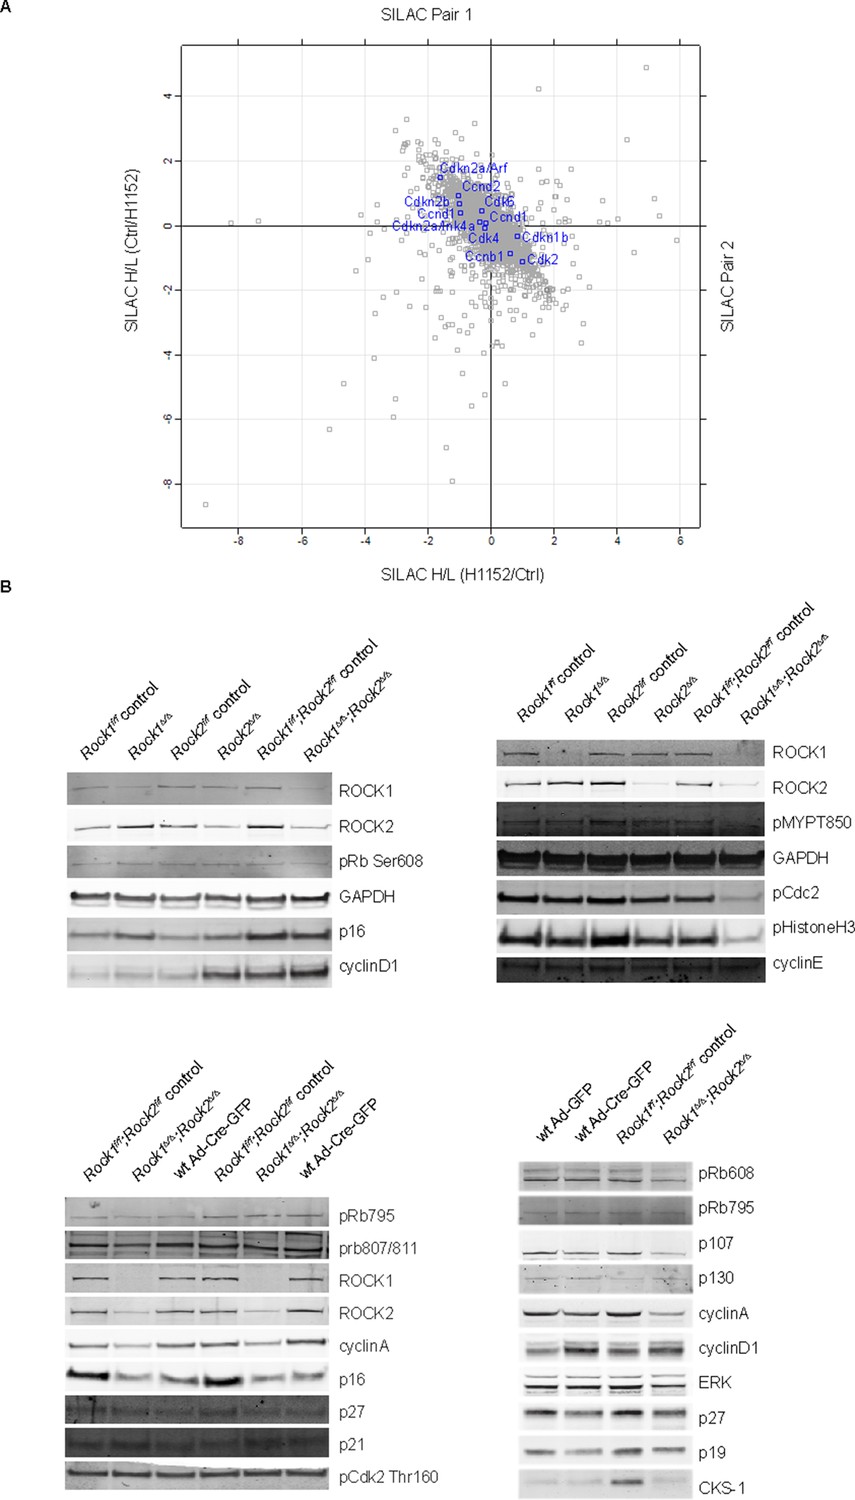
Protein levels of cell cycle regulators in ROCK-inhibited and Rock1∆/∆;Rock2∆/∆ cells.
(A) MEFs were treated with H1152 or vehicle for 3 days and the proteome analyzed by quantitative mass spectrometry. Graph shows log ratios of identified proteins. The data are from duplicate experiments of reciprocal SILAC labelling. Proteins indicated are Cdkn2a/Arf (p19), Cdkn2a/Ink4a (p16), Cdkn2b (p15), Ccnd2 (CyclinD2), Ccnd1 (CyclinD1), Ccnd3 (CyclinD3), Cdk2, Cdk4, Cdkn1b (p27), Ccnb1 (CyclinB1). (B) Rock1f/f, Rock2f/f, Rock1f/f;Rock2f/f and where indicated wild type cells infected with Ad-Cre-GFP were subjected to immunoblotting with antibodies against proteins indicated.
Figure 5
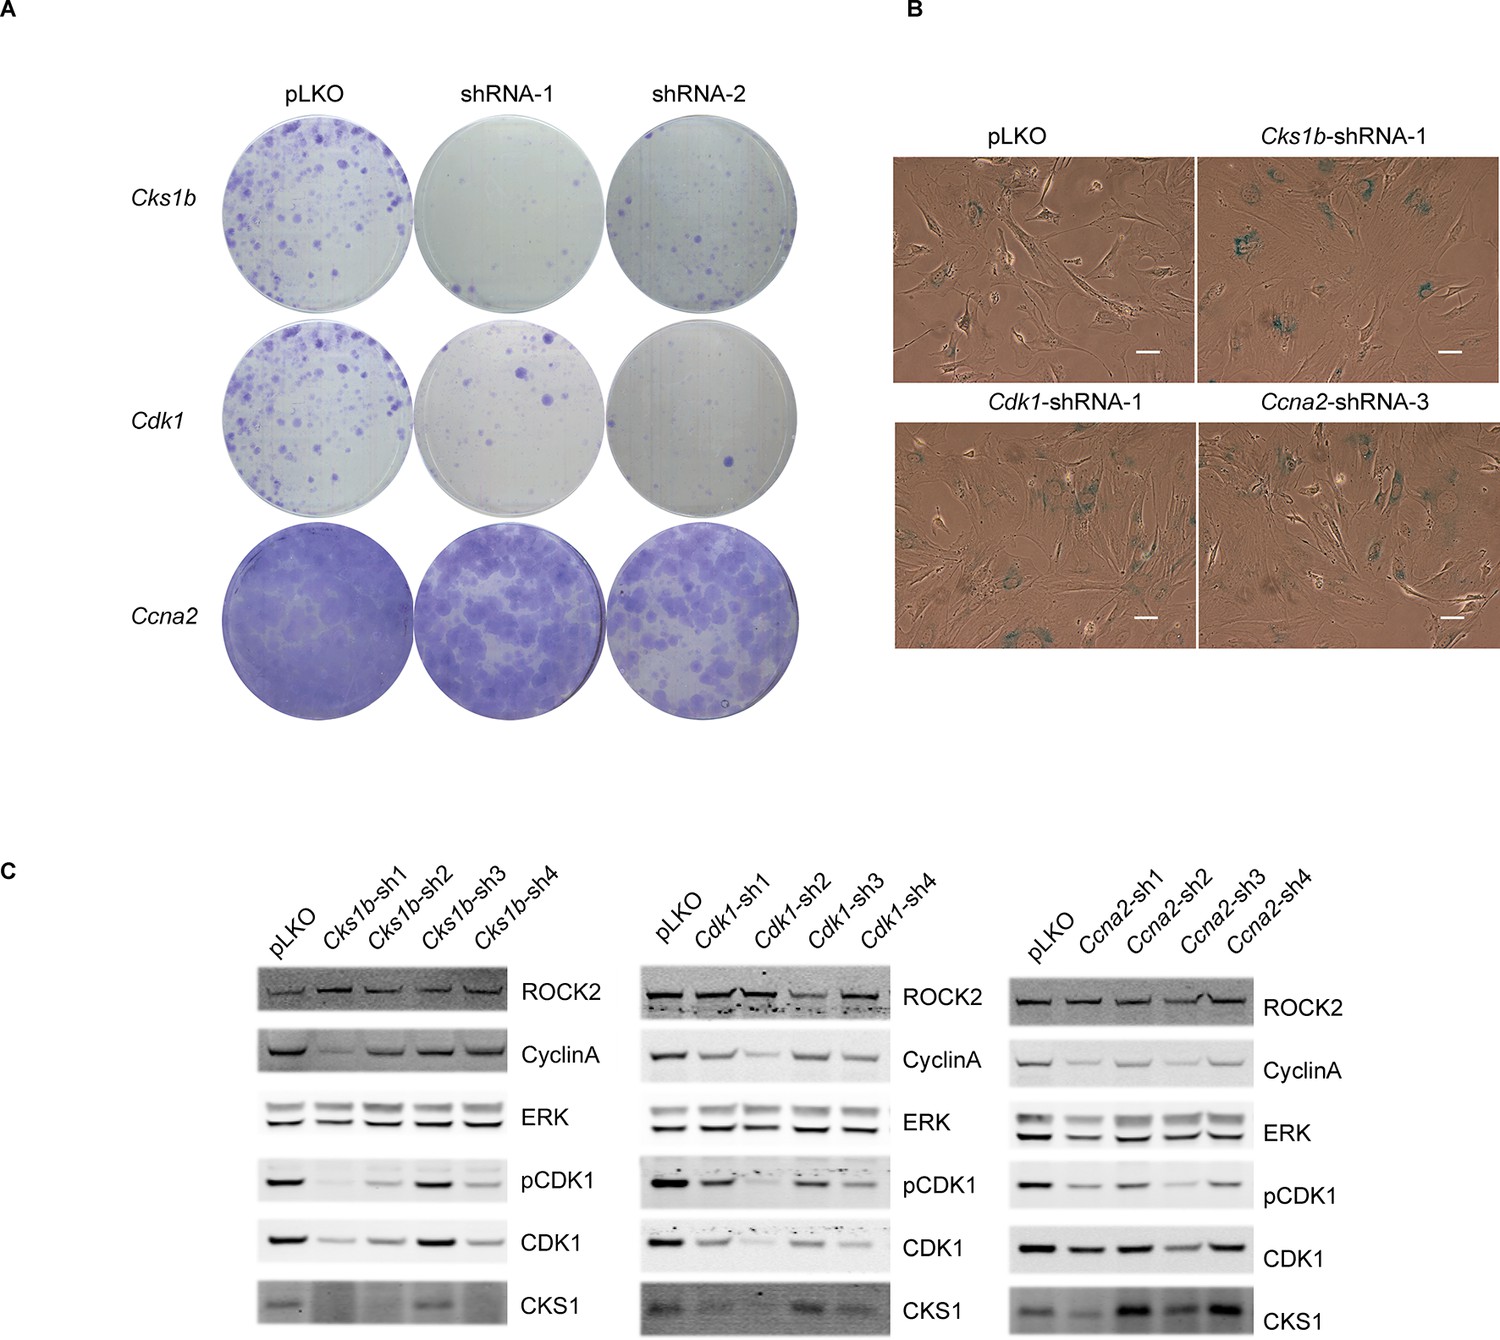
Knockdown of Cdk1 and Cks1b leads to cellular senescence.
(A–C) MEFs were infected with either control shRNA or shRNAs targeting Cks1b, Cdk1 and Ccna2. Four days after infection, equal numbers of cells were plated and kept for seven days, allowing colonies to form (A). Five days after infection with shRNAs, cells were also subjected to SA-βGal staining (B) and immunoblotting with antibodies against pCDK1, total CDK1, Cyclin A, CKS1. ROCK2 and total ERK were used as loading control (C). Scale bars are 50 µm.
Figure 6 with 1 supplement
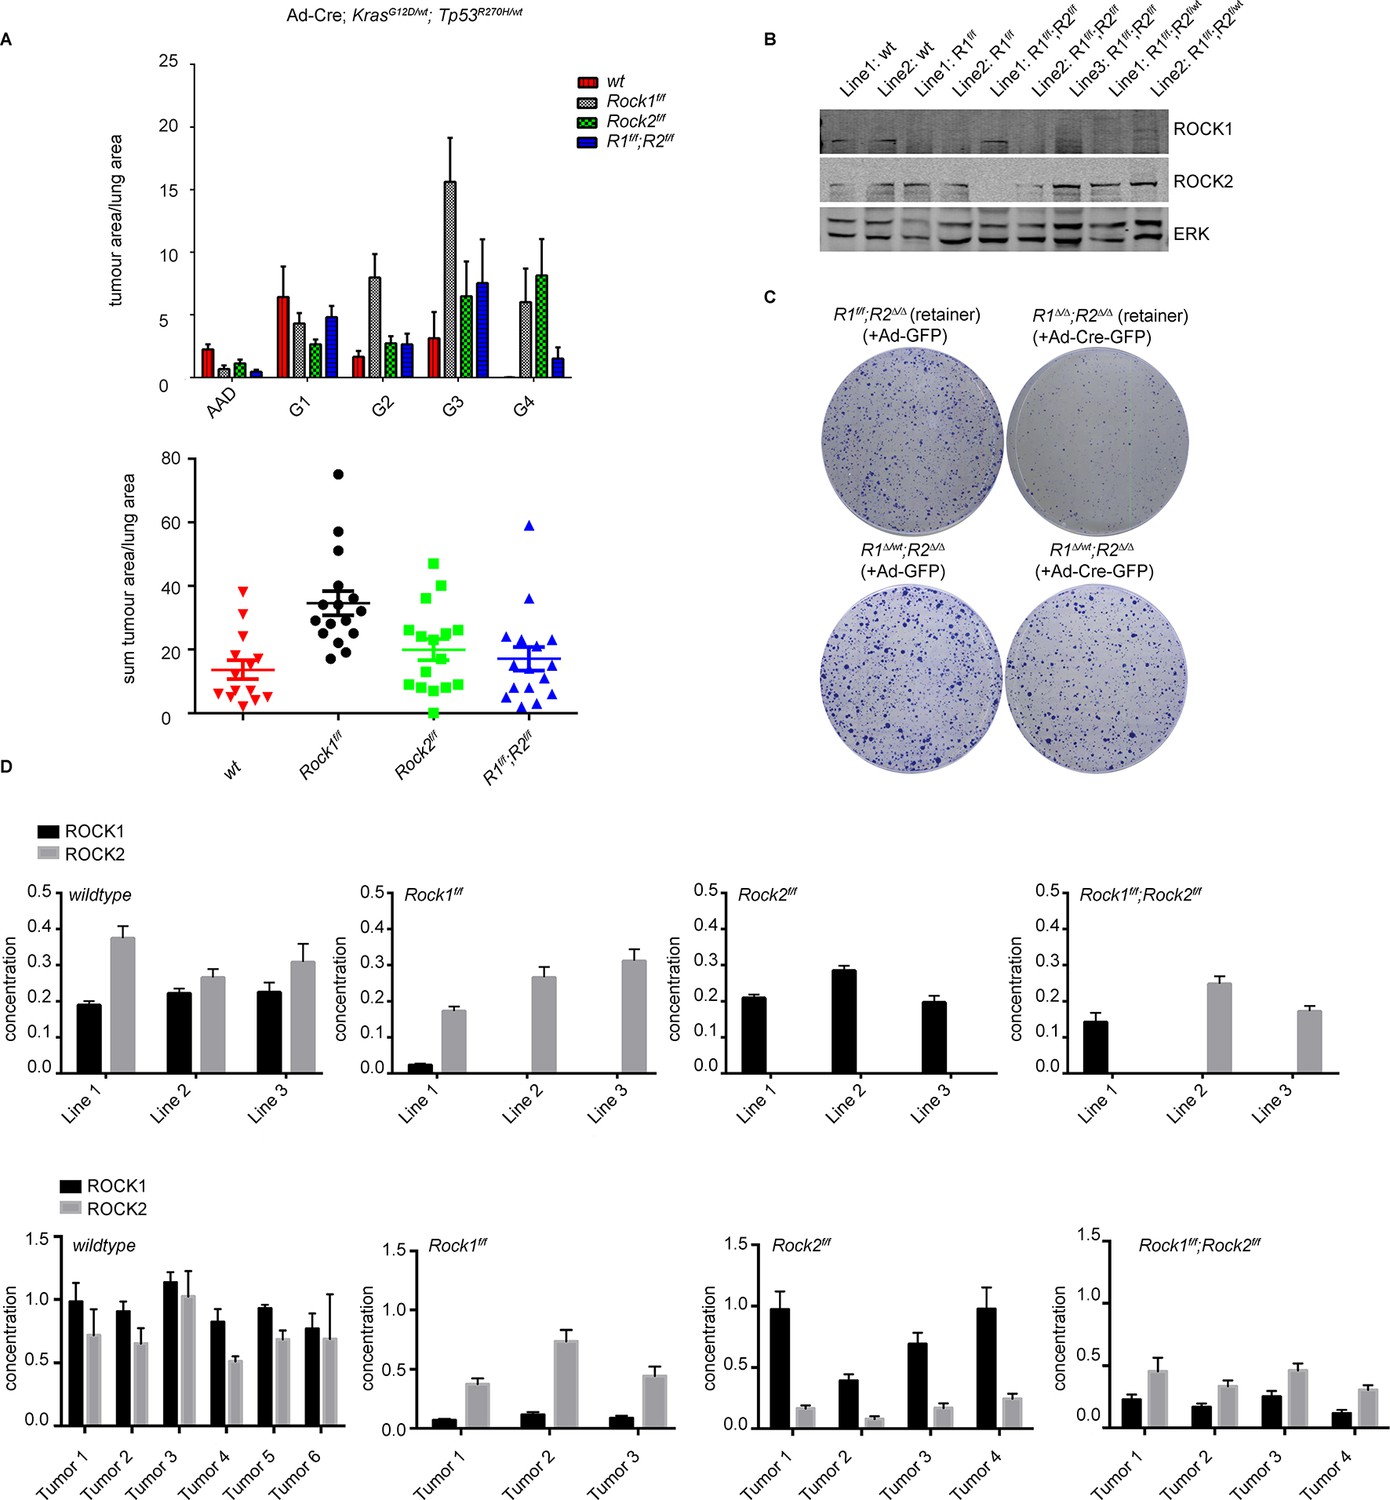
ROCK is essential for tumorigenesis.
Cohorts of mice carrying LSL-KrasG12D; LSL-Trp53R270H alleles and the indicated Rock alleles were treated once with Ad-Cre viruses by intranasal inhalation. 24 weeks later, the mice were sacrificed and the lungs were analyzed by histopathology. (A) Graphs show tumor area divided by lung area for indicated genotypes and tumor grades. The data are also displayed as a sum of tumor area divided by lung area for the indicated genotypes. Graphs show average data and SEM. The total number of mice analyzed is indicated in Scatter Plots. (B) Cell lines derived from KrasG12D;Trp53R270H tumors of either Rock1f/f, Rock2f/f, Rock1f/f;Rock2f/f or wild-type genotype were subjected to immunoblotting with indicated antibodies. (C) Isolated lung tumor cell lines of Rock1∆/wt;Rock2∆/∆ genotype as well as a cell line which retained both Rock1 alleles (Rock1f/f;Rock2∆/∆) were treated with Ad-GFP and Ad-Cre-GFP. 3 days after infection, cells were plated and kept for ~5 days allowing colonies to form. (D) Absolute quantification of ROCK1 and 2, using selective reaction monitoring (SRM). Bar graphs show the mean concentration in nM of ROCK1 (black) and ROCK2 (grey) across at least 3 biological replicates from each genetic background. Line 1–3 indicate different cell lines isolated from NSCLCs and Tumors 1–4 represent different micro-dissected tumors. Error bars represent SEM.
Figure 6—figure supplement 1
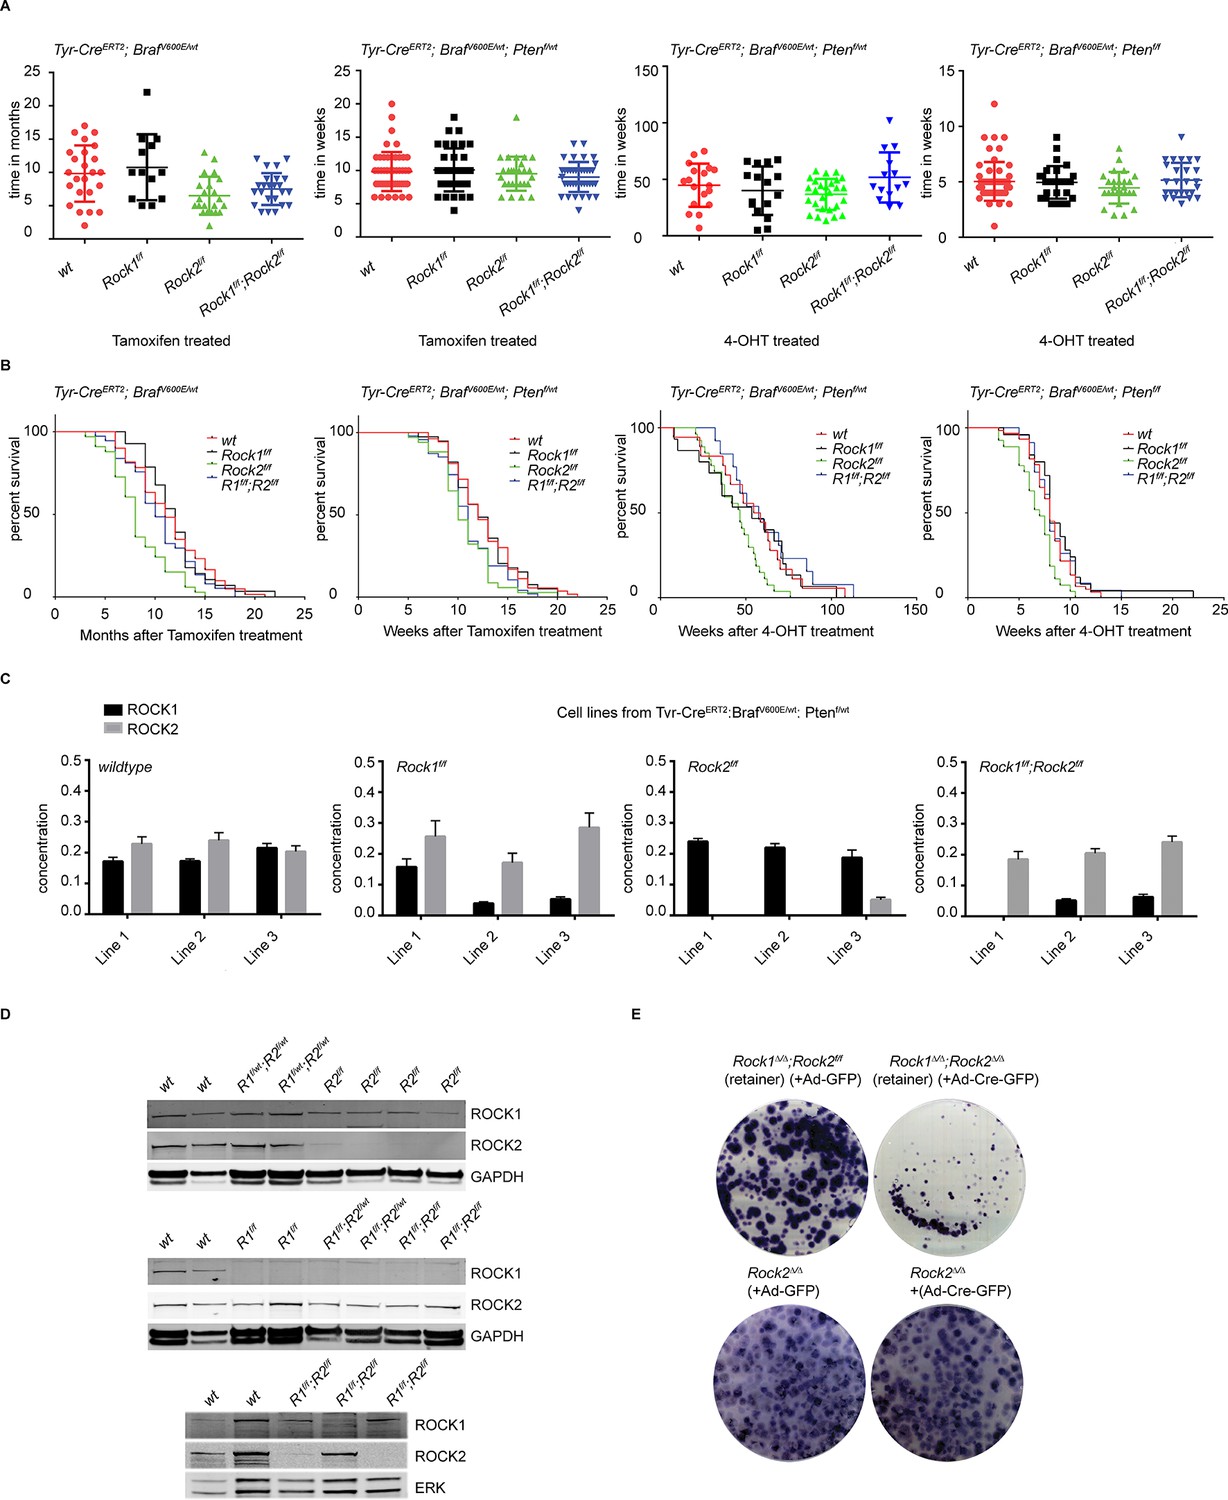
Analysis of melanomagenesis in wt, Rock1f/f, Rock2f/f and Rock1f/f;Rock2f/f mice.
(A, B) Scatter plots showing time until melanomas developed in mice carrying Tyr-CreERT2; BrafV600E alleles and where indicated Ptenf/wt, Ptenf/f and Rock alleles (A) as well as Kaplan-Meier survival curves (B). The same number of mice indicated in scatter plots was analyzed in survival curve. (C) Absolute quantification of ROCK1 and 2, using selective reaction monitoring (SRM). Bar graphs show the mean concentration in nM of ROCK1 (black) and ROCK2 (grey) across at least 3 biological replicates of different cell lines isolated from mice with a Tyr-CreERT2; BrafV600E; Ptenf/wt genetic background with Rock alleles as indicated. Error bars represent SEM. (D) Immunoblotting of lysates from melanoma cell lines derived from tumors with ROCK1 and 2 antibodies. GAPDH or ERK were used as loading control. (E) Melanoma cell lines of Rock2∆/∆ genotype as well as a cell line which retained both Rock2 alleles (Rock1∆/∆;Rock2f/f) were treated with Ad-GFP and Ad-Cre-GFP to generate controls, Rock2∆/∆ and Rock1∆/∆;Rock2∆/∆ cells. 3 days after infection, the cells were plated and kept for ~5 days allowing colonies to form.
Videos
Video 1
Rock1f/f;Rock2f/f control, 3 days after infection with Ad-GFP, 10X magnification.
https://doi.org/10.7554/eLife.12203.007
Video 2
Rock1∆/∆;Rock2∆/∆, 3 days after infection with Ad-Cre, 10X magnification.
https://doi.org/10.7554/eLife.12203.008
Video 3
Rock1f/f;Rock2f/f control, 5 days after infection with Ad-GFP, 20X magnification.
https://doi.org/10.7554/eLife.12203.011
Video 4
Rock1∆/∆;Rock2∆/∆, 5 days after infection with Ad-Cre, 20X magnification.
https://doi.org/10.7554/eLife.12203.012Additional files
-
Supplementary file 1
Identified phosphorylated proteins in MEFs treated with H1152 for 20 min or overnight versus vehicle.
- https://doi.org/10.7554/eLife.12203.019
-
Supplementary file 2
Identified total proteins upon long-term treatment of cells with H1152 versus vehicle.
- https://doi.org/10.7554/eLife.12203.020
Download links
A two-part list of links to download the article, or parts of the article, in various formats.
Downloads (link to download the article as PDF)
Open citations (links to open the citations from this article in various online reference manager services)
Cite this article (links to download the citations from this article in formats compatible with various reference manager tools)
Rho-associated kinase (ROCK) function is essential for cell cycle progression, senescence and tumorigenesis
eLife 5:e12203.
https://doi.org/10.7554/eLife.12203


